4q18 earnings announcement
TRANSCRIPT

4Q18 EarningsAnnouncement
January 31, 2019
© 2014-2019 United Parcel Service Inc., UPS, the UPS brand mark, the color brown and photos are
trademarks of United Parcel Service of America Inc. All rights reserved.

Scott ChildressInvestor Relations Officer
2

3
UPS SpeakersDavid Abney
Chairman and CEO
Jim Barber
Chief Operating Officer
Richard Peretz
CFO, SVP and Treasurer
Additional Q&A Participants:
Kate Gutmann
Chief Sales and Solutions Officer
Juan Perez
Chief Information and Engineering Officer
Scott Price
Chief Strategy and Transformation Officer

This presentation includes “forward-looking statements” within the meaning of the Private Securities Litigation Reform Act of 1995. Statements in the future tense, and all statements accompanied by terms such as “believe,” “project,” “expect,” “estimate,” “assume,” “intend,” “anticipate,” “target,” “plan,” and variations thereof and similar terms are intended to be forward-looking statements. We intend that all forward-looking statements we make will be subject to safe harbor protection of the federal securities laws pursuant to Section 27A of the Securities Act of 1933 and Section 21E of the Securities Exchange Act of 1934.
Our disclosure and analysis in this presentation, in our Annual Report on Form 10-K for the year ended December 31, 2017 and in our other filings with the Securities and Exchange Commission contain forward-looking statements regarding our intent, belief and current expectations about our strategic direction, prospects and future results. From time to time, we also provide forward-looking statements in other materials we release as well as oral forward-looking statements. Such statements give our current expectations or forecasts of future events; they do not relate strictly to historical or current facts. Management believes that these forward-looking statements are reasonable as and when made. However, caution should be taken not to place undue reliance on any such forward-looking statements because such statements speak only as of the date when made.
Forward-looking statements are subject to certain risks and uncertainties that could cause actual results to differ materially from our historical experience and our present expectations or anticipated results. These risks and uncertainties include, but are not limited to: general economic conditions, both in the U.S. and internationally; significant competition on a local, regional, national, and international basis; changes in our relationships with our significant customers; the existing complex and stringent regulation in the U.S. and internationally (including tax laws and regulations), changes to which can impact our business; increased physical or data security requirements that may increase our costs of operations and reduce operating
efficiencies; legal, regulatory or market responses to global climate change; strikes, work stoppages and slowdowns by our employees; the effects of changing prices of energy, including gasoline, diesel and jet fuel, and interruptions in supplies of these commodities; changes in exchange rates or interest rates; our ability to maintain the image of our brand; breaches in data security; disruptions to the Internet or our technology infrastructure; interruption of our business from severe weather or other natural or man-made disasters including terrorism; our ability to accurately forecast our future capital investment needs; exposure to changing economic, political and social developments in international and emerging markets; changes in business strategy, government regulations, or economic or market conditions that may result in substantial impairment of our assets; increases in our expenses or funding obligations relating to employee health, retiree health and/or pension benefits; potential additional tax liabilities both in the U.S. and internationally; the potential for various claims and litigation related to labor and employment, personal injury, property damage, business practices, environmental liability and other matters; our ability to realize the anticipated benefits from acquisitions, joint ventures or strategic alliances; our ability to manage insurance and claims expenses; and other risks discussed in our filings with the Securities and Exchange Commission from time to time, including our Annual Report on Form 10-K for the year ended December 31, 2017 or described from time to time in our future reports filed with the Securities and Exchange Commission. You should consider the limitations on, and risks associated with, forward-looking statements and not unduly rely on the accuracy of predictions contained in such forward-looking statements. We do not undertake any obligation to update forward-looking statements to reflect events, circumstances, changes in expectations, or the occurrence of unanticipated events after the date of those statements.
Information included in all presentations, including comparisons to prior periods, may reflect adjusted results. See appendix for reconciliations of adjusted results and other non-GAAP financial measures.
Forward-Looking Statements and Non-GAAP Reconciliations

5
David AbneyChairman and CEO

Successful Peak Season Thanks to our Customers and Employees
• Delivered industry-leading, on-time service.
• Optimized network utilization.
• Good revenue gains and improved revenue quality.
• Strong productivity improvements while processing high peak volumes.

7
Transformation Initiatives Producing Benefits
• 4Q18 results positively impacted by small to medium business growth and yield management.
• Highest B2B growth in several quarters.
• Generated solid operating margins, excellent free cash flow, and returned cash to shareowners.
* Non-GAAP financial measure. See Appendix for reconciliation to GAAP financial measure.
Revenue
$19.8B
Adj. EPS*
$1.94Adj. 4Q* +16.9%
4Q momentum continues in 2019.
FX Adj.* 4Q +5.2%

Committed to Transformation
• Growth in targeted markets with higher quality revenue.
• Reduce costs and increase operating efficiency to improve operating leverage.
• Develop and enhance management team, reinforce a culture of urgency and continuous transformation.

9
• External forecasts calling for somewhat softer export and GDP growth across major economies due to trade policy and division across several countries.
• UPS and our customers benefit from our global reach, flexible network and value-added services.
• We have growth opportunities in segments where we are positioned to accelerate local and cross-border trade.
• We welcome Philippe Gilbert, President of UPS Supply Chain Solutions to UPS’ leadership team.
Looking Ahead
UPS is uniquely positioned to deliver long-term value creation.

Jim BarberCOO
10

11
Executed a Comprehensive Peak Plan
• Automated facilities, refined hiring & training, adapted to market conditions.
• Aligned pricing, volume, and mix to ensure we are rewarded for value we deliver.
• Several factors that led to our success will carry us forward into 2019…

Growth with Higher Quality Revenue
• Simplified pricing for Small to Medium customers.
• Digital marketing targeting occasional shippers.
• Strategies delivered ~3% 4Q18 B2B growth.
• Partnered with Inxeption and ShopRunner to drive future ecommerce growth.
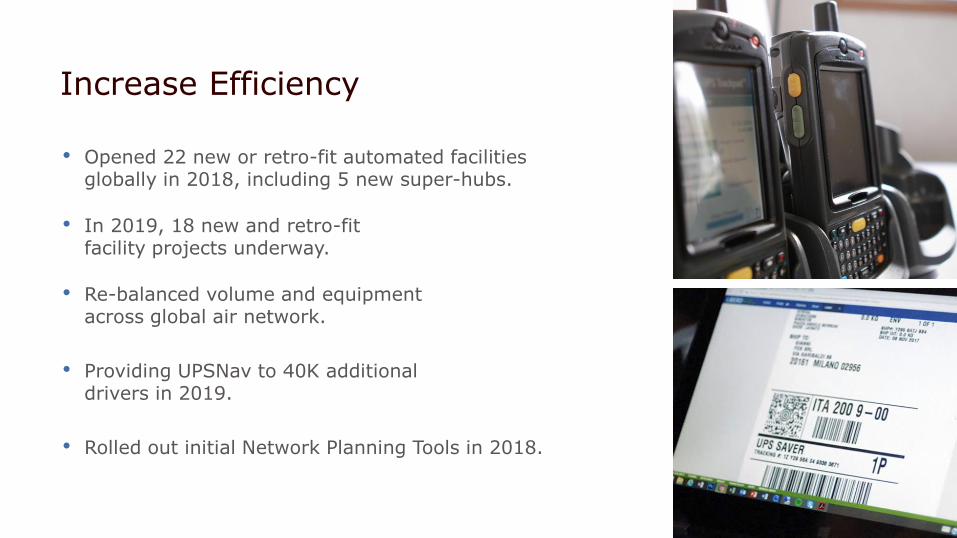
Increase Efficiency
• Opened 22 new or retro-fit automated facilities globally in 2018, including 5 new super-hubs.
• In 2019, 18 new and retro-fit facility projects underway.
• Re-balanced volume and equipment across global air network.
• Providing UPSNav to 40K additional drivers in 2019.
• Rolled out initial Network Planning Tools in 2018.

14
Richard PeretzCFO, SVP and Treasurer

15
4Q18 Financial Highlights
• Great execution...industry-leading, on-time performance, improved revenue quality.
• Generated excellent free cash flow.
• 4Q18 EPS* grew 16.9% and full-year EPS up nearly 21%.

U.S. Domestic Quarterly Yield Expanded
• Revenue per piece up almost 5%, base rates up 3.3%.
• Positive product and customer mix.
• Growth in small to medium and B2B deliveries.
• Operating profit impacted by planned start-up costs, one less operating day, and higher pension expense.
Revenue
$12.6B4Q +6.3%
Avg Daily Volume
>21M4Q +3.0%
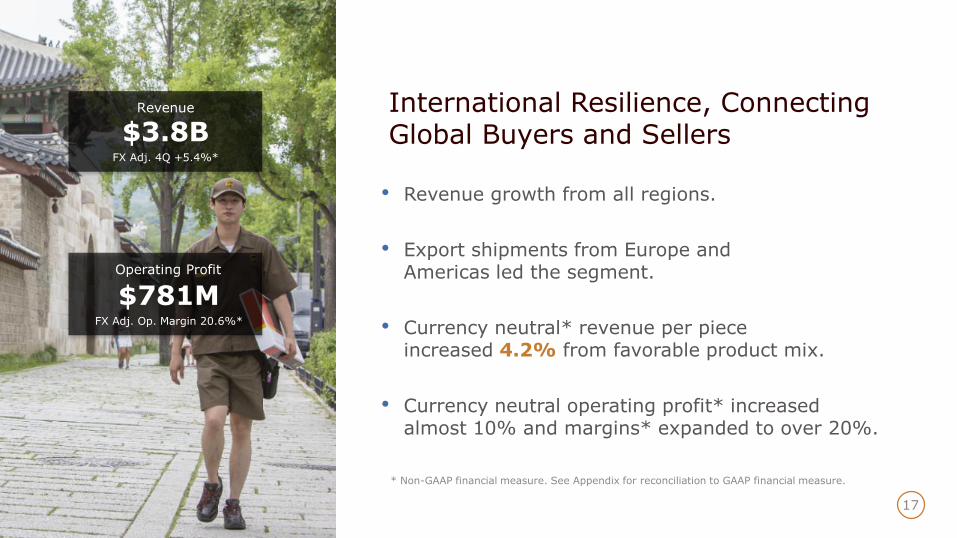
International Resilience, Connecting Global Buyers and Sellers
• Revenue growth from all regions.
• Export shipments from Europe and Americas led the segment.
• Currency neutral* revenue per piece increased 4.2% from favorable product mix.
• Currency neutral operating profit* increased almost 10% and margins* expanded to over 20%.
* Non-GAAP financial measure. See Appendix for reconciliation to GAAP financial measure.
17
Revenue
$3.8BFX Adj. 4Q +5.4%*
Operating Profit
$781MFX Adj. Op. Margin 20.6%*

Supply Chain & Freight
• SC&F produced a solid quarter.
• Forwarding unit had outstanding profit growth driven by international air and ocean freight, Coyote, and brokerage.
• Ocean generated best results in 2018.
• Distribution & Logistics revenue increased almost 7%, driven by healthcare, aerospace, retail, and manufacturing.
* Non-GAAP financial measure. See Appendix for reconciliation to GAAP financial measure.
Revenue
$3.4B4Q +0.7%
Operating Profit
$224MOp. Margin 6.5%

* Non-GAAP financial measure. See Appendix for reconciliation to GAAP financial measure.
19
For the year ended December 31, 2018:
• Free cash flow of $6.1B*, cash flow conversion 100%.
• $6.6B* reinvested into global network.
• Returned $4.2B to shareowners in 2018:
• $1B share repurchases
• $3.2B in dividends
Generating Excellent Cash Flow During Investment Cycle

* Non-GAAP financial measure. See Appendix for reconciliation to GAAP financial measure.
20
• Expect total operating profits to grow in the low teens with all three segments up double-digits.
• Includes management incentive change.
• U.S. Domestic revenue to increase 4% to 6%.
• International revenue to increase 5% to 7%.
• Supply Chain and Freight will continue to execute disciplined strategies.
2019: A Year of Real Progress

2018 Adjusted Earnings per Share (EPS)* $7.24
2019 Underlying Segment Performance $0.72 - $1.02
$7.96 - $8.26 10 to 14%
Other Pension Income/(Expense) (0.29)$
Change in Tax Rate (0.22)$
(0.51)$
2019 Adjusted EPS* Guidance $7.45 - $7.75
Non-GAAP financial measure.** Because it is not possible to predict, potential impacts of a future pension mark-to-market adjustment are not included.
2019 EPS Guidance
21
**

* Non-GAAP financial measure.
• Capital expenditures planned between 8.5%
to 10% of revenue.
• Share repurchases about $1B for the year.
• Anticipate dilutive share count of 870 million.
• Adjusted free cash flow anticipated between $3.5
to $4 billion.
• 23% to 24% expected tax rate.
2019 Outlook

23
Questions & Answers

Forward-Looking Statements
Except for historical information contained herein, the statements made in this release constitute forward-looking statements within the meaning of Section 27A of the Securities Act of 1933 and Section 21E of the Securities Exchange Act of 1934. Such forward-looking statements, including statements regarding the intent, belief or current expectations of UPS and its management regarding the company's strategic direction, prospects and future results, involve certain risks and uncertainties.Certain factors may cause actual results to differ materially from those contained in the forward-looking statements, including changes in economic and other conditions in the markets in which we operate, governmental regulations (including tax laws and regulations), our competitive environment, in the facts or assumptions underlying our health and pension benefit funding obligations, results of negotiation and ratification of labor contracts, the impact of any strikes, work stoppages or slowdowns, changes in aviation and motor fuel prices, cyclical and seasonal fluctuations in our operating results, and other risks discussed in the company's Form 10-K and other filings with the Securities and Exchange Commission, which discussions are incorporated herein by reference.
Reconciliation of GAAP and non-GAAP Financial Measures
We supplement the reporting of our financial information determined under generally accepted accounting principles ("GAAP") with certain non-GAAP financial measures, including, as applicable, "as adjusted" operating profit, operating margin, other income (expense), pre-tax income, net income and earnings per share. The equivalent measures determined in accordance with GAAP are also referred to as "reported" or "unadjusted.” Additionally, we periodically disclosefree cash flow, free cash flow excluding discretionary pension contributions, as well as currency-neutral revenue, revenue per piece and operating profit.
We consider quantitative and qualitative factors in assessing whether to adjust for the impact of items that may be significant or that could affect an understanding of our ongoing financial and business performance or trends. Examples of items for which we may make adjustments include but are not limited to: amounts related to mark-to-market gains or losses (non-cash); settlement of contingencies; gains or losses associated with mergers, acquisitions, divestitures and other structural changes; charges related to restructuring programs such as the implementation of our Transformation strategy; asset impairments (non-cash); amounts related to changes in tax regulations or positions; amounts related to changes in foreign currency exchange rates and impact from any hedging activities; other pension and postretirement related items; and debt modifications.
We believe that these non-GAAP measures provide additional meaningful information to assist users of our financial statements in understanding our financial results, cash flows and assessing our ongoing performance because they exclude items that may not be indicative of, or are unrelated to, our underlying operations and may provide a useful baselinefor analyzing trends in our underlying businesses. Management uses these non-GAAP financial measures in making financial, operating and planning decisions. We also use certain of these measures for the determination of incentive compensation awards.
Non-GAAP financial measures should be considered in addition to, and not as an alternative for, our reported results prepared in accordance with GAAP. Our non-GAAP financial information does not represent a comprehensive basis of accounting. Therefore, our non-GAAP financial information may not be comparable to similarly titled measures reported by other companies.
Mark-To-Market Pension and Postretirement Adjustments
We recognize changes in the fair value of plan assets and net actuarial gains and losses in excess of a 10% corridor for company-sponsored pension and post-retirement obligations immediately as part of net periodic benefit cost. We supplement the presentation of our operating profit, operating margin, pre-tax income, net income and earnings per share with similar non-GAAP measures that exclude the impact of the portion of net periodic benefit cost represented by the gains and losses recognized in excess of the 10% corridor and the related income tax effects. We believe this adjusted net periodicbenefit cost provides important supplemental information that reflects the anticipated long-term cost of our defined benefit plans, and provides a benchmark for historical defined benefit cost trends that may provide useful comparison of year-to-year financial performance without considering the short-term impact of changes in market interest rates, equity prices, and
similar factors.
This adjusted net periodic benefit cost ($615 million in 2018 and $843 million in 2017) is comparable to the accounting for our defined benefit plans in our quarterly reporting under U.S. GAAP, utilizing the expected return on plan assets (7.68% in 2018 and 8.65% in 2017) and the discount rate used to determine net periodic benefit cost (3.81% in 2018 and 4.34% in 2017). The non-adjusted net periodic benefit cost reflects the actual return on plan assets (-2.38% in 2018 and 14.25% in 2017) and the discount rate used to measure the projected benefit obligation at the December 31 measurement date (4.45% in 2018 and 3.81% in 2017).
The deferred income tax effects of these mark-to-market pension and postretirement adjustments are calculated by multiplying the statutory tax rates applicable in each tax jurisdiction, including the U.S. federal jurisdiction and various U.S. state and non-U.S. jurisdictions, by the adjustments. The blended average of the applicable statutory tax rates in 2018 and 2017 was 24.0% and 24.1%, respectively.
Costs Related to Restructuring Programs; Transformation Strategy Costs
We supplement the presentation of our operating profit, operating margin, pre-tax income, net income and earnings per share with similar non-GAAP measures that exclude the impact of costs related to restructuring programs, including transformation strategy costs. We believe this adjusted information provides a useful comparison of year-to-year financial performance without considering the short-term impact of restructuring costs. We evaluate the performance of our businesses on athis adjusted basis.
Impact of Changes in Foreign Currency Exchange Rates and Hedging Activities
We supplement the reporting of our revenue, revenue per piece and operating profit with similar non-GAAP measures that exclude the period-over-period impact of foreign currency exchange rate changes and hedging activities. We believe currency-neutral revenue, revenue per piece and operating profit information allows users of our financial statements to understand growth trends in our products and results. We evaluate the performance of our International Package and Supply Chain and Freight businesses on this currency-neutral basis.
Currency-neutral revenue, revenue per piece and operating profit are calculated by dividing current period reported U.S. dollar revenue, revenue per piece and operating profit by the current period average exchange rates to derive current period local currency revenue, revenue per piece and operating profit. The derived current period local currency revenue, revenue per piece and operating profit are then multiplied by the average foreign exchange rates used to translate the comparable results for each month in the prior year period (including the period over period impact of foreign currency revenue hedging activities). The difference between the current period reported U.S. dollar revenue, revenue per piece and operating profit and the derived current period U.S. dollar revenue, revenue per piece and operating profit is the period over period impact of currency fluctuations.
Free Cash Flow and Adjusted Capital Expenditures
We supplement the reporting of cash flows from operating activities with free cash flow, free cash flow excluding discretionary pension contributions and free cash flow plus principal repayments of capital lease obligations, non-GAAP liquidity measures. We believe these free cash flow measures are important indicators of how much cash is generated by regular business operations and we use it as a measure of incremental cash available to invest in our business, meet our debt obligations and return cash to shareowners. Additionally, we believe that adjusting capital expenditures for principal repayments of capital lease obligations more appropriately reflects the overall cash that we have invested in capital assets.We calculate free cash flow as cash flows from operating activities less capital expenditures, proceeds from disposals of property, plant and equipment, and plus or minus the net changes in finance receivables and other investing activities. Free cash flow excluding discretionary pension contributions adds back any discretionary pension contributions made during the period.
24
Reconciliation of GAAP and Non-GAAP Financial Measures

25
As-Reported As-Adjusted
(GAAP) (non-GAAP)
Operating profit:
U.S. Domestic Package 999$ -$ -$ 999$
International Package 781 - - 781
Supply Chain & Freight 224 - - 224
Total operating profit 2,004$ -$ -$ 2,004$
Total other income (expense) (1,461)$ -$ 1,627$ 166$
Income before income taxes 543$ -$ 1,627$ 2,170$
Income tax expense 90$ -$ 390$ 480$
Net income 453$ -$ 1,237$ 1,690$
Diluted earnings per share 0.52$ -$ 1.42$ 1.94$
As-Reported As-Adjusted
(GAAP) (non-GAAP)
Operating profit:
U.S. Domestic Package 3,643$ 235$ -$ 3,878$
International Package 2,529 76 - 2,605
Supply Chain & Freight 852 49 - 901
Total operating profit 7,024$ 360$ -$ 7,384$
Total other income (expense) (1,005)$ -$ 1,627$ 622$
Income before income taxes 6,019$ 360$ 1,627$ 8,006$
Income tax expense 1,228$ 87$ 390$ 1,705$
Net income 4,791$ 273$ 1,237$ 6,301$
Diluted earnings per share 5.51$ 0.31$ 1.42$ 7.24$
Note: Certain amounts may not compute due to rounding.
Defined Benefit
Plans MTM
Charges
Transformation
Strategy Costs
Three Months Ended December 31, 2018
Twelve Months Ended December 31, 2018
Reconciliation of GAAP and non-GAAP Income Statement Data
Defined Benefit
Plans MTM
Charges
Transformation
Strategy Costs
(in millions, except per share amounts):
Reconciliations

26
2018
2018 As- 2017 As- Currency
Reported Reported % Change Currency Neutral % Change
(GAAP) (GAAP) (GAAP) Impact (non-GAAP) (non-GAAP)
Average Revenue Per Piece:
International Package:
Domestic 6.58$ 6.31$ 4.3% 0.22$ 6.80$ 7.8%
Export 28.82 28.43 1.4% 0.63 29.45 3.6%
Total International Package 16.79$ 16.51$ 1.7% 0.42$ 17.21$ 4.2%
Consolidated 10.59$ 10.17$ 4.1% 0.05$ 10.64$ 4.6%
Revenue:
U.S. Domestic Package 12,575$ 11,833$ 6.3% -$ 12,575$ 6.3%
International Package 3,829 3,721 2.9% 92 3,921 5.4%
Supply Chain & Freight 3,444 3,421 0.7% 24 3,468 1.4%
Total revenue 19,848$ 18,975$ 4.6% 116$ 19,964$ 5.2%
2018
Currency
2018 2017 % Change Currency Neutral % Change
(GAAP) (GAAP) (GAAP) Impact (non-GAAP) (non-GAAP)
Operating Profit:
U.S. Domestic Package 999$ 1,087$ -8.1% -$ 999$ -8.1%
International Package 781 735 6.3% 26 807 9.8%
Supply Chain & Freight 224 241 -7.1% - 224 -7.1%
Total operating profit 2,004$ 2,063$ -2.9% 26$ 2,030$ -1.6%
(in millions, except per piece amounts):
Three Months Ended December 31
Reconciliation of GAAP and non-GAAP Revenue, Revenue Per Piece and Operating
Profit
Reconciliations

27
2018
2018 As- 2017 As- Currency
Reported Reported % Change Currency Neutral % Change
(GAAP) (GAAP) (GAAP) Impact (non-GAAP) (non-GAAP)
Average Revenue Per Piece:
International Package:
Domestic 6.59$ 6.07$ 8.6% (0.19)$ 6.40$ 5.4%
Export 29.27 28.70 2.0% (0.16) 29.11 1.4%
Total International Package 17.08$ 16.22$ 5.3% (0.18)$ 16.90$ 4.2%
Consolidated 10.98$ 10.53$ 4.3% (0.03)$ 10.95$ 4.0%
Revenue:
U.S. Domestic Package 43,593$ 40,761$ 6.9% -$ 43,593$ 6.9%
International Package 14,442 13,342 8.2% (147) 14,295 7.1%
Supply Chain & Freight 13,826 12,482 10.8% (39) 13,787 10.5%
Total revenue 71,861$ 66,585$ 7.9% (186)$ 71,675$ 7.6%
2018 As-
Adjusted
2018 As- 2017 As- Currency
Adjusted Adjusted % Change Currency Neutral % Change
(non-GAAP) (non-GAAP) (non-GAAP) Impact (non-GAAP) (non-GAAP)
As-Adjusted Operating Profit:
U.S. Domestic Package 3,878$ 4,303$ -9.9% -$ 3,878$ -9.9%
International Package 2,605 2,429 7.2% 10 2,615 7.7%
Supply Chain & Freight 901 797 13.0% 5 906 13.7%
Total operating profit 7,384$ 7,529$ -1.9% 15$ 7,399$ -1.7%
Reconciliation of GAAP and non-GAAP Revenue, Revenue Per Piece and As-Adjusted Operating
Profit
(in millions, except per piece amounts):
Twelve Months Ended December 31
Reconciliations

28
Reconciliations
Preliminary
2018
Cash flows from operating activities 12,711$
Cash flows used in investing activities (6,330)
Cash flows used in financing activities (5,692)
Effect of exchange rate changes on cash, cash equivalents and
restricted cash (91)
Net increase in cash, cash equivalents and restricted cash 598$
Preliminary
2018
Cash flows from operating activities (GAAP) 12,711$
Capital expenditures (6,283)
Principal repayments of capital lease obligations (340)
Adjusted Capital Expenditures (non-GAAP measure) (6,623)$
Proceeds from disposals of PP&E 37
Net change in finance receivables 4
Other investing activities 1
Adjusted Free cash flow (non-GAAP measure) 6,130$
Reconciliation of non-GAAP Liquidity Measures (in millions):
Twelve Months Ended December 31
Net Increase (Decrease) in Cash, Cash Equivalents and Restricted Cash
Reconciliation of Adjusted Capital Expenditures and Free Cash Flow
(non-GAAP measures)