4th annual renewable energy finance forum...
TRANSCRIPT

4th annual Renewable Energy Finance Forum China State of the wind industry in China – Patterns of growth
Paulo Fernando SoaresChief Executive OfficerSuzlon Tianjin Energy Ltd
BeijingMay 12-13, 2009

l S2
Market Development East Asia RegionGrowth Forecast [MW]
EER Market Forecast 2009-13 Total [MW]
8,638
11,890
14,050
15,250
16,350
17,460
China (app 85%) will be the most important
market in the East Asian region. All other
countries combines will account for only 15% of
the total additions; and the majority of which
from India
Development in Countries such as Philippines
(especially), Vietnam and Thailand is starting to
accelerate; however level of development of the
grid, weather conditions (typhoon area in
Vietnam and Philippines and lack of wind in
Thailand), project bankability; might affect
market potential.
Analysis
China will be the backbone of the developmentof Wind Business in the East Asia region;however, competion has become verydeveloped, rapid growth of the local companiesand prefered policies toward local companies
Source: EER APW955-090320 Asia Pacific Wind Energy Market Forecast 2009

l S3
Power Capacity DevelopmentActual 2008 x Target in 2010 and 2020
The RE Industry (excluing Hydro) is growing at fast pace; however, considering the development of installed capacity of other sources of electricity, Wind is, in the overal context, still neglegible.
Installed capacity growth Actual x Target
Source: CWEA reports and China Electricity Council
517.2
622.0
1,000.0
1,493.7
0.64% 0.76% 1.12% 8.83%RE ex hydro:
Analysis
713.0
2.58%
Incl. Nuclear – 2007: 8.8GW2006: 5.3GW
792.5
1.13%
Power Generation 2008(grid connected)
Installed capacity 2008
Installed capacity Total
GW [%] GW [%]
Thermal 65.75 72.6% 601.3 75.87%
Hydro 20.10 22.2% 171.5 21.64%
Nuclear - 0.0% 8,850 1.12%
Wind 4.66 5.1% 8.940 1.13%
Others - 0.0% 1,900 0.24%
Total 90.51 72.6% 792.5 100.00%
Period
Power Generation TWh l %
TotalThermal Hydro Nuclear Wind Others
2007 2,698.0 486.7 62.6 5.6 3.0 3,255.9
82.86% 14.95% 1.92% 0.17% 0.09% 100.0%
2008 2,779.3 563.3 68.4 12.8 9.6 3,443.4
80.9% 16.4% 2.00% 0.4% 0.3% 100.0%

l S4
Power Capacity DevelopmentRenewable Energy Sources – Actual x Targets
If we analyze the breakdown of the different
Renewable Energy sources and its development
forecast, we will clearly see that Large Hydro will
be the main player , attracting the bulk of the
investments.
The breakdown figures (in GW) for hydro is as
follows:
AnalysisInstalled capacity growth Actual x Target
120.3
215.8
431.9
97.3% 96.5% 94.6% 82.9% 75.7%% H
132.7
Renewable Energy sources not derived from Large
Hydro schemes should have development priority
in order to avoid the repetition of the 2007
situation, when droughts in the south pushed the
consumption of eletricity generated by coal fired
thermo power plants
Hydro Capacity 2006A 2007A 2008A 2010F 2020F
Large Hydro 72.0 NA 140.0 225.0
Pumped Storage 7.0 NA NA NA
Small Hydro 38.0 NA 50.0 75.0
Total 117.0 145.0 171.5 190.0 300.0
153.0
Source: CWEA reports and China Electricity Council
93.9%
l S5
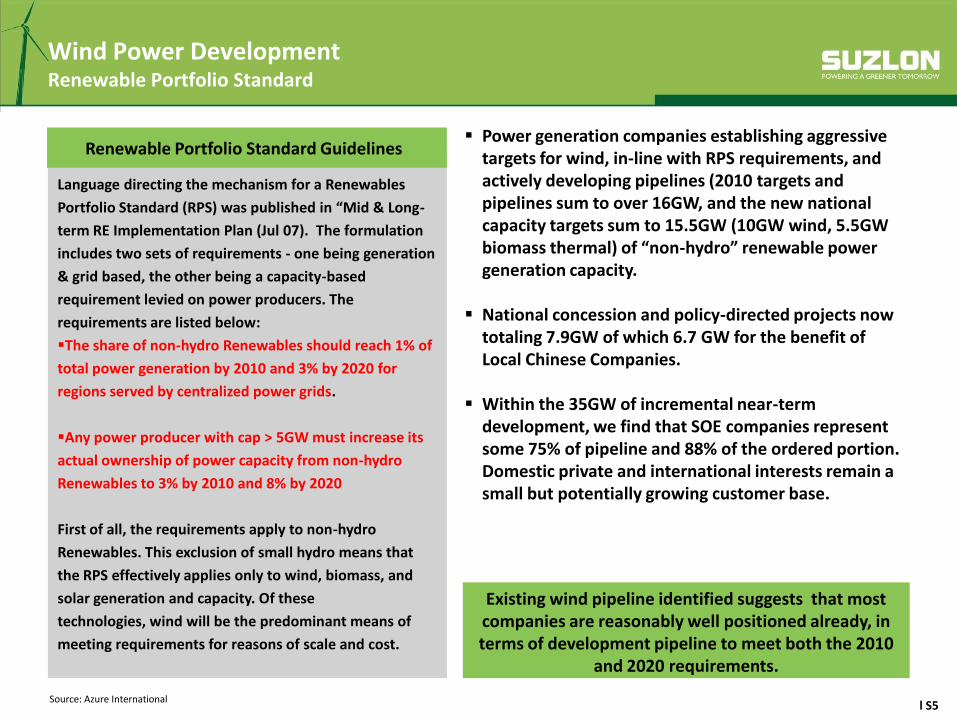
Wind Power DevelopmentRenewable Portfolio Standard
Language directing the mechanism for a Renewables
Portfolio Standard (RPS) was published in “Mid & Long-
term RE Implementation Plan (Jul 07). The formulation
includes two sets of requirements - one being generation
& grid based, the other being a capacity-based
requirement levied on power producers. The
requirements are listed below:
The share of non-hydro Renewables should reach 1% of
total power generation by 2010 and 3% by 2020 for
regions served by centralized power grids.
Any power producer with cap > 5GW must increase its
actual ownership of power capacity from non-hydro
Renewables to 3% by 2010 and 8% by 2020
First of all, the requirements apply to non-hydro
Renewables. This exclusion of small hydro means that
the RPS effectively applies only to wind, biomass, and
solar generation and capacity. Of these
technologies, wind will be the predominant means of
meeting requirements for reasons of scale and cost.
Existing wind pipeline identified suggests that most companies are reasonably well positioned already, in terms of development pipeline to meet both the 2010
and 2020 requirements.
Renewable Portfolio Standard Guidelines
Source: Azure International
Power generation companies establishing aggressive targets for wind, in-line with RPS requirements, and actively developing pipelines (2010 targets and pipelines sum to over 16GW, and the new national capacity targets sum to 15.5GW (10GW wind, 5.5GW biomass thermal) of “non-hydro” renewable power generation capacity.
National concession and policy-directed projects now totaling 7.9GW of which 6.7 GW for the benefit of Local Chinese Companies.
Within the 35GW of incremental near-term development, we find that SOE companies represent some 75% of pipeline and 88% of the ordered portion. Domestic private and international interests remain a small but potentially growing customer base.

l S6
Market Development in ChinaGrowth Forecast [MW]
EER 2009 – 202,000Goldman Sachs 2008 – 108,000ERI l NDRC- 2008 – 120,000
GWEC Growth Scenarios for China
Total capacity in MW
2007 2010 2020
Reference scenario 5,906 9,000 27,000
Moderate 5,906 17,507 100,724
Advanced 5,906 19,613 200,880
CWEA Forecasts2010 2020
Req. GW Req. GW
PG companies >5GW generating capacity
3.0% 24.0 8.0% 96.0
Electricitygeneration from non-hydro
1.0% 20.0 3.0% 100.0
Connected 8.940
CWEA
Source: Azure International /CWEA statistics / EER / New Energy Finance

l S7Source: Azure International
Market Development ChinaMarket Share – 2004 to 2008
Suppliers 2004 2005 2006 2007 2008 (Azure) Total 04-08
MW % MW % MW % MW % MW % MW %
Sinovel 0 0.0% 0 0.0% 83 6.1% 680 20.6% 1,398 23.6% 2,160 19.2%
Goldwind 40 20.1% 132 27.2% 441 32.8% 830 25.1% 1,097 18.5% 2,540 22.5%
DFEM 0 0.0% 6 1.2% 9 0.7% 222 6.7% 1,019 17.2% 1,256 11.1%
Vestas 60 30.7% 73 15.0% 318 23.6% 369 11.2% 600 10.1% 1,420 12.6%
Gamesa 71 36.3% 179 36.8% 273 20.3% 560 17.0% 459 7.7% 1,543 13.7%
Windey 1 0.3% 7 1.5% 18 1.3% 65 2.0% 201 3.4% 292 2.6%
SEC 0 0.0% 0 0.0% 0 0.0% 23 0.7% 198 3.3% 220 2.0%
Nordex 8 4.3% 8 1.7% 22 1.6% 56 1.7% 171 2.9% 265 2.4%
Acciona 0 0.0% 0 0.0% 50 3.7% 51 1.5% 150 2.5% 251 2.2%
Suzlon 0 0.0% 0 0.0% 13 0.9% 206 6.2% 115 1.9% 333 3.0%
GE 17 8.4% 78 16.0% 116 8.6% 213 6.4% 108 1.8% 531 4.7%
Xiangdian 106 1.8% 106 0.9%
Mingyang 80 1.3% 80 0.7%
Chagzhou Railcar 0 0.0% 0 0.0% 0 0.0% 9 0.3% 68 1.1% 77 0.7%
Beizhong 60 1.0% 60 0.5%
Guodian Power 24 0.4% 24 0.2%
Hanwei 24 0.4% 24 0.2%
Envision 14 0.2% 14 0.1%
Huayi Zhejiang 12 0.2% 12 0.1%
CSR Zhuzhou 8 0.1% 8 0.1%
Others 0 0.0% 3 0.6% 5 0.4% 15 0.5% 20 0.3% 42 0.4%
Total 197 100% 488 100% 1,347 100% 3,303 100% 5,935 100% 11,269 100%
Suppliers 2004 2005 2006 2007 2008 Total 04-08
MW % MW % MW % MW % MW % MW %
Foreigners 157 80% 339 70% 791 59% 1,454 44% 1,602 27% 4,339 39%
Locals 40 20% 149 30% 556 41% 1,849 56% 4,333 73% 6,930 61%
Total 197 100% 488 100% 1,347 100% 3,303 100% 5,590 169% 10,924 100%Remarks Suzlon numbers are installed machines. Total deliveries are 177MW
0%
10%
20%
30%
40%
50%
60%
70%
80%
90%
100%
2004 2005 2006 2007 2008
Others
Haizhuang
Changxing Shandong
Guoce Nordic
Lanzhou Electric
Repower
CSR Zhuzhou
Huayi Zhejiang
Envision
Hanwei
Guodian Power
Beizhong
Chagzhou Railcar
Mingyang
Xiangdian
GE
Suzlon
Acciona
Nordex
SEC
Windey
Gamesa
Vestas
DFEM
Goldwind
Sinovel

l S8
Market Development in ChinaOrders Backlog Development 2008
Source: Azure International
Order Backlog Development as of Dec 2008
Order backlog has continued to increase at fast pace, and as off Dec 2008, accounted for about 20,000MW - Order visibility is about 3 years
Top 3 companies (all local) shared 68% of all known
orders (14,010 MW) at the end of 2008;
International companies, with production facilities in
China are, in general, receiving an amount of orders
which is significantly lower than the Local Chinese
partners;
Strong increase in order for the 3 largest Chinese local
manufacturers are mainly due to National Level
Concession Projects and Special Order Award in Gansu
Province as part of the Wind Base strategy ;
National Level Concession Projects accounts for 2,714 MW or 13.9% of the total backlog;
Special Policy Orders, such as the Gansu Wind Base, accounts for 7,580 MW or 40.8% of the total backlog
WTG Manufacturer Backlog
2008 Year End Excl. NDRC
MW % MW %
1 Sinovel 5,930 32.1% 2,264 20.6%
2 Dongfang Electric 3,354 18.2% 1,319 12.0%
3 Goldwind 3,120 16.9% 1,595 14.5%
4 Vestas 869 4.7% 869 7.9%
5 Mingyang 851 4.6% 851 7.7%
6 Gamesa 739 4.0% 696 6.3%
7 Suzlon 644 3.5% 644 5.9%
8 Xiangdian 360 1.9% 360 3.3%
9 REpower 348 1.9% 348 3.2%
10 CSIC Chongqing 298 1.6% 248 2.3%
11 Nordex 281 1.5% 281 2.6%
12 Windey 267 1.4% 109 1.0%
13 Guodian 179 1.0% 179 1.6%
14 CSR Zhuzhou 176 1.0% 176 1.6%
15 China Creative 174 0.9% 174 1.6%
16 SEC Sewind Co. Ltd. 154 0.8% 154 1.4%
17 Yatu Guangzhou 149 0.8% 149 1.4%
18 Huayi Zhejiang 147 0.8% 147 1.3%
19 Changzhou Railcar 105 0.6% 105 1.0%
20 Beijing Beizhong 90 0.5% 90 0.8%
21 GE Wind 90 0.5% 90 0.8%
22 Changxing Shandong 48 0.3% 48 0.4%
23 Envision 36 0.2% 36 0.3%
Others 61 0.3% 61 0.6%
TOTAL 18,470 100.0 10.991 100.0
l S9
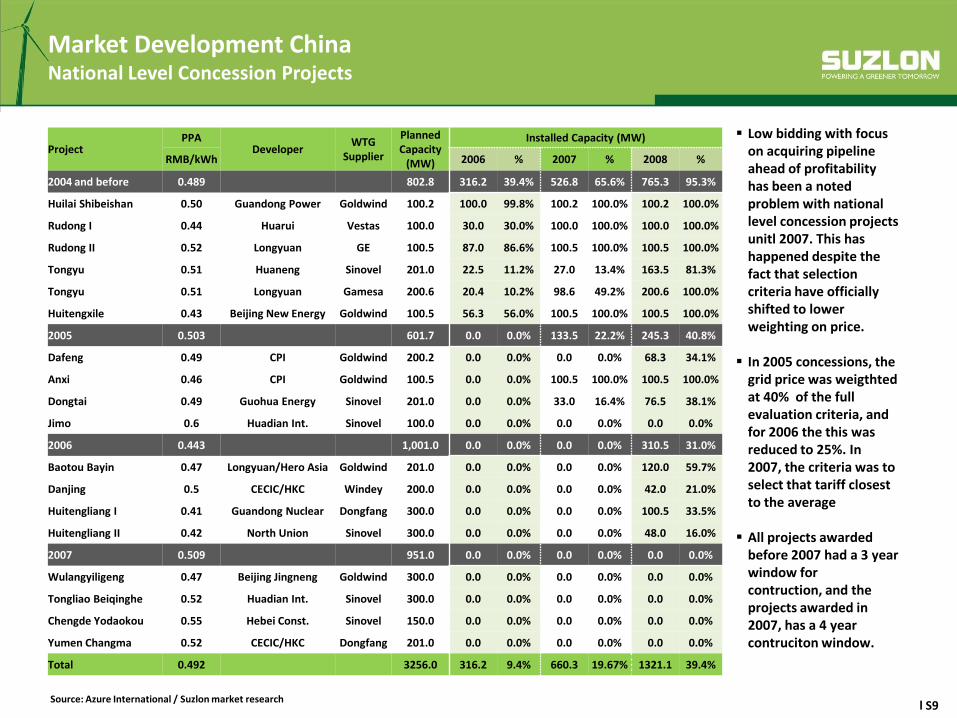
Low bidding with focus on acquiring pipeline ahead of profitability has been a noted problem with national level concession projects unitl 2007. This has happened despite the fact that selection criteria have officially shifted to lower weighting on price.
In 2005 concessions, the grid price was weigthted at 40% of the full evaluation criteria, and for 2006 the this was reduced to 25%. In 2007, the criteria was to select that tariff closest to the average
All projects awarded before 2007 had a 3 year window for contruction, and the projects awarded in 2007, has a 4 year contruciton window.
Market Development China National Level Concession Projects
Source: Azure International / Suzlon market research
ProjectPPA
DeveloperWTG
Supplier
Planned Capacity
(MW)
Installed Capacity (MW)
RMB/kWh 2006 % 2007 % 2008 %
2004 and before 0.489 802.8 316.2 39.4% 526.8 65.6% 765.3 95.3%
Huilai Shibeishan 0.50 Guandong Power Goldwind 100.2 100.0 99.8% 100.2 100.0% 100.2 100.0%
Rudong I 0.44 Huarui Vestas 100.0 30.0 30.0% 100.0 100.0% 100.0 100.0%
Rudong II 0.52 Longyuan GE 100.5 87.0 86.6% 100.5 100.0% 100.5 100.0%
Tongyu 0.51 Huaneng Sinovel 201.0 22.5 11.2% 27.0 13.4% 163.5 81.3%
Tongyu 0.51 Longyuan Gamesa 200.6 20.4 10.2% 98.6 49.2% 200.6 100.0%
Huitengxile 0.43 Beijing New Energy Goldwind 100.5 56.3 56.0% 100.5 100.0% 100.5 100.0%
2005 0.503 601.7 0.0 0.0% 133.5 22.2% 245.3 40.8%
Dafeng 0.49 CPI Goldwind 200.2 0.0 0.0% 0.0 0.0% 68.3 34.1%
Anxi 0.46 CPI Goldwind 100.5 0.0 0.0% 100.5 100.0% 100.5 100.0%
Dongtai 0.49 Guohua Energy Sinovel 201.0 0.0 0.0% 33.0 16.4% 76.5 38.1%
Jimo 0.6 Huadian Int. Sinovel 100.0 0.0 0.0% 0.0 0.0% 0.0 0.0%
2006 0.443 1,001.0 0.0 0.0% 0.0 0.0% 310.5 31.0%
Baotou Bayin 0.47 Longyuan/Hero Asia Goldwind 201.0 0.0 0.0% 0.0 0.0% 120.0 59.7%
Danjing 0.5 CECIC/HKC Windey 200.0 0.0 0.0% 0.0 0.0% 42.0 21.0%
Huitengliang I 0.41 Guandong Nuclear Dongfang 300.0 0.0 0.0% 0.0 0.0% 100.5 33.5%
Huitengliang II 0.42 North Union Sinovel 300.0 0.0 0.0% 0.0 0.0% 48.0 16.0%
2007 0.509 951.0 0.0 0.0% 0.0 0.0% 0.0 0.0%
Wulangyiligeng 0.47 Beijing Jingneng Goldwind 300.0 0.0 0.0% 0.0 0.0% 0.0 0.0%
Tongliao Beiqinghe 0.52 Huadian Int. Sinovel 300.0 0.0 0.0% 0.0 0.0% 0.0 0.0%
Chengde Yodaokou 0.55 Hebei Const. Sinovel 150.0 0.0 0.0% 0.0 0.0% 0.0 0.0%
Yumen Changma 0.52 CECIC/HKC Dongfang 201.0 0.0 0.0% 0.0 0.0% 0.0 0.0%
Total 0.492 3256.0 316.2 9.4% 660.3 19.67% 1321.1 39.4%

l S10
Order from Special NDRC PoliciesGansu Jiuqquan 10 GW Wind Base
In early May, the NDRC approved ‘Gansu Jiuquan 10 GW Wind Base Plan’ and the pre-feasibility study for the first 3.8GW
slated for development. By May 19 the NDRC approved “11th Five-Year Construction Plan of Gansu Jiuquan Wind Base
(DR Energy *2008+1135)” but the document has not been publicly released. On May 22Gansu Provincial Government held
a press conference in Beijing in which the wind base was presented for the benefit of interested WTG manufacturers.
The 3.8GW first phase project consist of twenty adjacent 100-200MW projects to be developed by 2010. If successfully
built and operating this should be the world’s largest “wind farm.
Features of Gansu Jiuquan wind base development:
1. The wind farm developers were not chosen through open public bidding.
2. No mention of wind resource measurement data available for WTG selection and micrositing.
3. With one exception, no other private or non state or provincial government owned companies will participate in
development.
4. A single feed-in tariff, set at RMB 0.5206 per kWh has been applied as per the latest Gansu National Concession project.
Other basic conditions per the Gansu Yumen Changma
5. The Gansu provincial DRC organized this development. On 16 March, the Gansu Provincial Government forbade lower-
level governments from participating in or approving wind farm developments signaling the province’s intention to
manage its wind resource with a strong centralized approach.
6. At the press conference, the Jiuquan Governor stated that turbine manufacturers with production in Gansu will be
preferred as equipment suppliers. On 19 May, Jiuquan government signed an agreement with Sinovel to establish a
manufacturing facility in Jiuquan. Goldwind already signed a similar contract in 2007 and already started constructing an
assembly facility early this year to be completed by year-end. Several other companies including Huiteng (blades), Sany
(WTG), Dongjia, Huayi, are planning to locate in the vicinity according to the Jiuquan Government press release.
10
Source: Azure International

l S11
WTG bidding information for a new round of concession projects was published on 9 March 2009
Information for 25 projects (5,250MW) located in Inner Mongolia and Hebei was released.
Project size is 150-300MW located in 4 main areas (Wulate, Tongliao, Baotou, Chengde)
Bidding deadline was 20 April 2009 and 256 valid bids were opened.
Features of the Wind Auction in Inner Mongolia and Hebei wind base development:
1. The wind farm developers were not chosen through open public bidding.
2. No mention of wind resource measurement data available for WTG selection and micrositing.
3. 23 out of 25 projects had requirement for exactly 1.5 to 2.0MW turbine type;
4. 16 projects (3,200MW) are located in class 1 or bordering class 1 (Baotou and Wulate).
5. Requirement to have 50 units produced and installed and one unit passed test operation (>240 hours) within the borders of China.
6. Payment terms are more adverse to Seller than usual businesses standard terms. Basically 90% payment after delivery is the general standard.
7. Low tariff around 0.5 Yuan/kWh ($0.07) leads to severe price pressure.
Order from Special NDRC PoliciesWind Auction 2009

l S12
Order from Special NDRC PoliciesGansu Jiuqquan 10 GW Wind Base and Wind Projects Auction 2009
Source: Azure International
Turbine supplier Technology Equipment Bids AwardsAverage
RMB/KWLowest
RMB/KWHighest
RMB/KWVariation Gansu Wind base 2008
Gamesa Own G87 2.0MW 4 6,906 6,894 6,923
NCWA Own AW77-1500 C2LT 1 6,992 6,992 6,992
GE Own GE SLE 1.5MW 1 7,672 --- ---
Nordex Own S77-1500 1.5MW 4 5,990 5,990 5,990
Repower Own MM 82 2.0MW 2 7,137 7,137 7,137
Vestas Own V90 2.0MW 2 6,934 6,880 6,987 -14.06%
Average 6,938 6,779 6,806
Beizhong DeWind FD80 2000A 2MW 1 6,081 --- --- -6.33%
Changzhou U Erlangen FD77-150/3 1.5MW 8 5,573 5,443 5,617 -17.22%
China Creative Own CCWE1500/77 4 5,471 --- ---
Dongfang REpower FD77B 1.5MW 25 5,337 5,150 5,670 -13.60%
GD United Aerodyn UP77/82-1500kW 4 5,700 5,500 5,900 -15.76%
Goldwind Vensys GW77-1500 23 5,416 5,396 5,499 -15.36%
Haizhuang Aerodyn HZ 2.0MW 14 5,658 5,522 5,723 -12.28%
Huayi Aerodyn HW82-1500/77 4 5,760 5,670 5,850 -7.08%
Mingyang Aerodyn MY 1.5 SE/82/77/65 23 5,491 5,480 5,500 -10.88%
SewindDeWind W1250C-64-65 3 5,562 5,550 5,586 -6.68%
Aerodyn W2000C-93-80 20 5,808 5,800 5,810 -6.68%
Sharpower Own SPT15A 1.5MW 3 5,793 5,760 5,859
Sinovel Fuhrländer SL 1500 LT 25 5,400 5,388 5,558 -8.47%
Windey Own WD77/82 1.5MW 16 5,158 5,032 5,336 -20.00%
Xiangdian Zephyrus XE82-2000 2MW 22 5,339 5,307 5,366 -22.03%
Zelri Windtec Wt 1650-82 LT 5 5,374 5,326 5,406 -10.93%
Average 5,465 5,293 5,637 -13.28%
In absolute terms (RMB/kW), prices of those turbines offered by Chinese were very competitive; however, this do not mean that they were cheap. Investments analysis cannot be made based only on turbine prices, but also in performance, quality and wind availability in that specific region, etc. Those prices, while competitive, does not really tell the whole story of those projects.1.None of the turbines offered by Chinese suppliers are fully certified by any reputable international certification body (GL, DNV, etc) and all of the licensed turbines have no valid certificate, as key components have been changed due to cost reasons (certification should be according to IEC standards);2.In almost all cases, there are no measured power curves, but only theoretical ones;3.Performance of Wind Turbines manufactured by local companies have a significant lower performance than that of international companies

l S13
Turbine Performance and Turbine Selection Independent review
Source: Azure International / Suzlon Proprietary Report and New Energy Finance
New Energy Finance Azure International
The focus on low tariff - instead of total IRR over the entire life span of 20-25 years of a project - forces developers to focus on initial price instead of the long-term suitability and quality of the turbine products. This is one of the main reasons behind the low turbine capacity factor of domestic made turbines compared with the capacity factors of turbines produced by foreign companies, as illustrated in the graph above. The low capacity factor is a major threat to the development of the entire Chinese wind power industry.
Projects awarded on policy orders, be it National Level Concession Projects or Wind Base projects do not have enough information, such as WIND DATA, to allow for a proper calculation of the projects IRRs, thus creating a fictitious impression of low cost. In reality, we do not even now for sure, whether those projects will be economically feasible even with wind theoretical low cost turbines from Chinese local suppliers

l S14
Turbine Performance and Turbine Selection Turbine certification
Source: DNV website
Certification of turbines are a very important part of any suppliers, development, as it verifies not only aspects related to the turbine design itself, but also manufacturing evaluations, as well as foundations, type testing and type characteristic measurements.This certification also supports the improvement of the quality in component suppliers, as key components are integral part of the certification process.
Quality System Evaluation
Manufacturing Inspection
Power Quality Tests
Acoustic Noise Measurements
review of the design documentsreceived from the client.
Safety and Function Tests Load Measurements Power Performance Measurements Blade Tests, Static and Fatigue Other TestsThe Type Testing elements shall be carried out by accredited testing laboratories. DNVwill verify that the testing is carried out according to IEC/ISO 17020 or IEC/ISO 17025, asApplicable. DNV will witness the Safety and Function Tests. In connection with this test the wind turbine will be inspected for compliance with design drawings and specifications.
Design Control Control and
Protection System
Load and Load Cases
Structural, Mechanical and Electrical Components
Component Tests Foundation
Design Req. Manufacturing
Installation, Maintenance Plan
Personnel Safety.
l S15
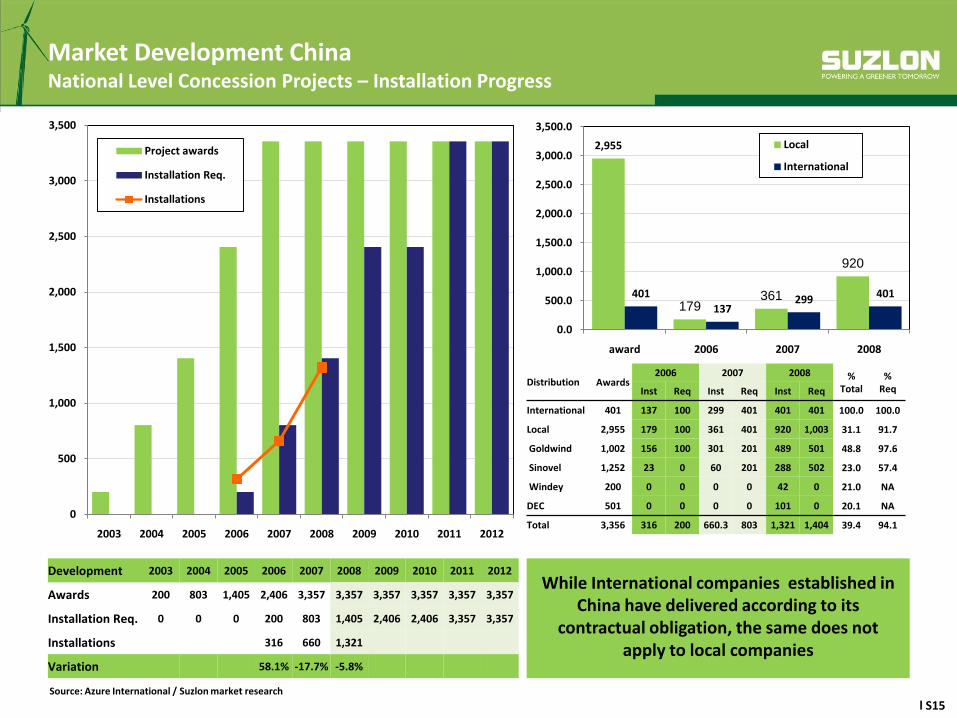
Market Development China National Level Concession Projects – Installation Progress
Source: Azure International / Suzlon market research
0
500
1,000
1,500
2,000
2,500
3,000
3,500
2003 2004 2005 2006 2007 2008 2009 2010 2011 2012
Project awards
Installation Req.
Installations
Development 2003 2004 2005 2006 2007 2008 2009 2010 2011 2012
Awards 200 803 1,405 2,406 3,357 3,357 3,357 3,357 3,357 3,357
Installation Req. 0 0 0 200 803 1,405 2,406 2,406 3,357 3,357
Installations 316 660 1,321
Variation 58.1% -17.7% -5.8%
Distribution Awards2006 2007 2008 %
Total%
ReqInst Req Inst Req Inst Req
International 401 137 100 299 401 401 401 100.0 100.0
Local 2,955 179 100 361 401 920 1,003 31.1 91.7
Goldwind 1,002 156 100 301 201 489 501 48.8 97.6
Sinovel 1,252 23 0 60 201 288 502 23.0 57.4
Windey 200 0 0 0 0 42 0 21.0 NA
DEC 501 0 0 0 0 101 0 20.1 NA
Total 3,356 316 200 660.3 803 1,321 1,404 39.4 94.1
While International companies established in China have delivered according to its
contractual obligation, the same does not apply to local companies
2,955
179361
920
401
137299 401
0.0
500.0
1,000.0
1,500.0
2,000.0
2,500.0
3,000.0
3,500.0
award 2006 2007 2008
Local
International

l S16
Order from Special NDRC PoliciesThe Wind Base Concept and its potential implications
The ‘wind base’ concept is meaningful in the scheme of continued Chinese wind project development. The concept of large
‘wind bases’ in regions with solid resources and planned grid interconnection has appeared in key pieces of legislation related
to the roll-out of wind in China.
The ‘Mid and Long-term RE Implementation Plan’ from Jun 07, 07 planned for 3 x 1-GW wind bases in Jiangsu, Hebei and IMAR
by 2010. By 2020, 6 x 1-GW wind bases are planned to be constructed in Xinjiang Dabancheng, Gansu Yumen, Jiangsu-Shanghai
coast, IMAR Huitengxile, Hebei Zhangbei and Jilin Baicheng, and other areas of proven wind resources.
More recently, the ‘11th Five-year RE Development Plan’ (Mar 03, 08) adjusted the 2010 wind target to 10GW mentioning 5 x
1-GW wind bases in Hebei, IMAR, Gansu, Jilin and Liaoning.
Implications for Project Developers
For non-SOE project wind project developers, this development sets a negative precedent. A similar approach may be adopted
in the future development of Hebei, Liaoning, Jilin and IMAR which are also slated to have ‘wind bases’. By extension further
wind bases could also adopt conditions set via national concession projects.
The ‘wind base’ mechanism does not appear to be a policy tool for provincial DRCs to catch-up planning targets. Gansu was on
the way to achieve its 1GW target before the ‘wind base’ plan emerged. After publishing a 1GW by 2010 target in
2006, 376.6MW had been installed by year-end 2007, with a further 669 MW of non wind-base ‘near term’ pipeline existing.
Implications for WTG manufacturers
For WTG manufacturers, the wind bases will likely bring pressure to localize regionally. Governments in key wind provinces will
all eye local manufacturing investment and jobs as a benefit not to be missed. Domestic WTG manufacturers are responding
with de-centralized assembly. For example, Goldwind is in the process or has already established manufacturing bases in
Beijing, Hebei Chengde, Guangdong Huilai, Gansu Jiuquan (under construction), Xinjiang (under construction), IMAR Baotou
(under construction), and Ningxia – closely following future likely wind base developments.
Source: Azure International
l S17Source: Emrging Energy Research / Azure International / CWEA statistics / Suzlon market research
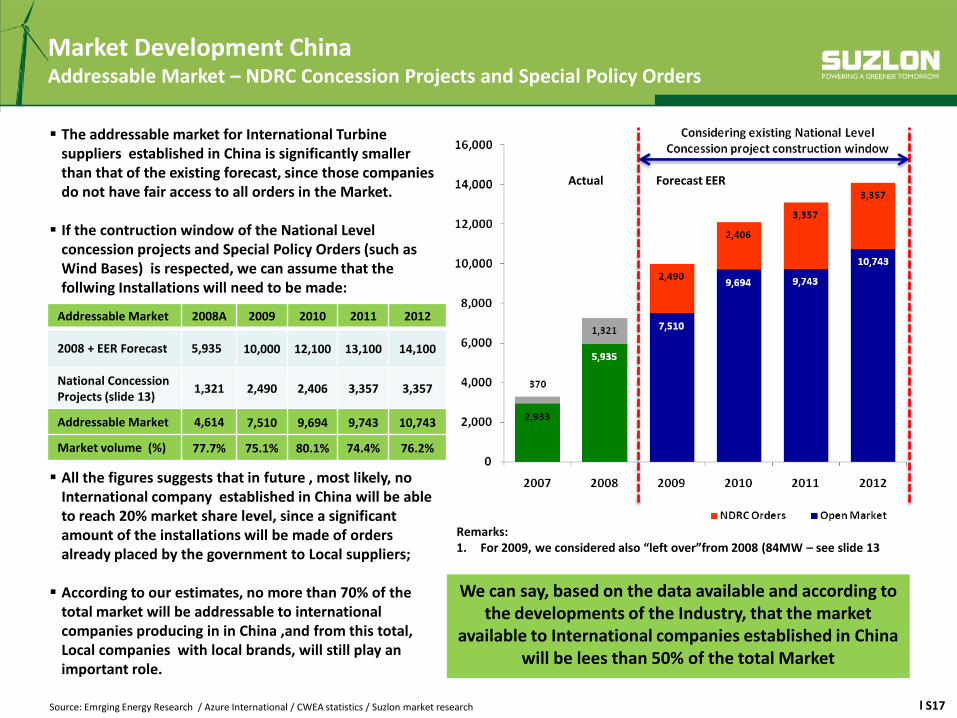
Market Development ChinaAddressable Market – NDRC Concession Projects and Special Policy Orders
Actual Forecast EER
The addressable market for International Turbine suppliers established in China is significantly smaller than that of the existing forecast, since those companies do not have fair access to all orders in the Market.
If the contruction window of the National Level concession projects and Special Policy Orders (such as Wind Bases) is respected, we can assume that the follwing Installations will need to be made:
Addressable Market 2008A 2009 2010 2011 2012
2008 + EER Forecast 5,935 10,000 12,100 13,100 14,100
National Concession Projects (slide 13)
1,321 2,490 2,406 3,357 3,357
Addressable Market 4,614 7,510 9,694 9,743 10,743
Market volume (%) 77.7% 75.1% 80.1% 74.4% 76.2%
Remarks:1. For 2009, we considered also “left over”from 2008 (84MW – see slide 13
All the figures suggests that in future , most likely, no International company established in China will be able to reach 20% market share level, since a significant amount of the installations will be made of orders already placed by the government to Local suppliers;
According to our estimates, no more than 70% of the total market will be addressable to international companies producing in in China ,and from this total, Local companies with local brands, will still play an important role.
We can say, based on the data available and according to the developments of the Industry, that the market
available to International companies established in China will be lees than 50% of the total Market

l S18
Market Environment ProjectDevelopment of Wind Farm Ownership
There are about 200 players currently
operating as developers in the wind
business in China
The top 25 companies in China have an
total of 5,382 MW installed capacity, which
represents 91% of the total Installations.
They are responsible for 76.4% of the Near
Term development (32,478 MW of 42,490
MW), and 73.1% of the Long Term
Development (107,586 MW of 147,139
MW)
Among the top 25 developers there is an
current order backlog of about 16,594 MW;
however, 15,8840 MW worth of
installations on a near term basis are still
to be ordered!
Government agencies / utilities will continue to be the biggest customer base but their domination will subside
Traditional Players will still be the dominat force in the development of the windbusiness
in China; however, there is a increasing number of Foreginer players activelly looking
for options to participate in the market!
MW Installed Ownership - Pipeline Development
Source: Azure International
To be updated

l S19
Market DevelopmentLikely Future Orders and Supplier Shares of Existing Orders
The chart lists top 20 wind farm developers out of 79, representing 65% of potential total orders, which is 18 GW in the next 2-3 yrs. Data was compiled as of Dec 31, 08 by Azure
Near Term not yet order capacity: this is equity weighted potential order capacity for next 2-3 years
Ordered Capacity: again this is equity weighted ordered capacity of the last 2-3 years. The orders were already placed with the suppliers
Sinovel, 36%
DEC, 5%
Vestas, 6%
Suzlon, 1%
Goldwind, 28%
Gamesa, 13%
Guodian United, 6
%
Others, 5%
Longyuan Orders by Manufacturer (Total of 1,853MW)
DEC, 3% Others, 6% Beijing
Beizhong,3%Goldwind
, 6%
Vestas, 6%
Sinovel, 43%
Mingyang, 19%
XMEC, 14%
Datang Orders by Manufacturers (Total of 1,468MW)
DEC, 26%
Sinovel, 57%
Suzlon, 9%
Goldwind, 2%
Others, 6%
Huaneng Orders by Manufacturers (Total of 2,446MW)

l S20
China Wind Power Development footprint
The top 11 provinces in China in terms of Windpower development
account for 93% of all installations and 98% of the future pipeline;
however:
Inner Mongolia accounts for 43% of all future developments;
The top three provinces (Inner Mongolia, Jilin and Hebei, where
Beijing and Tianjin are located) accounts for 68% of the future
project developments;
Balance between Low and Standard temperature machines will
become more difficult as STV areas represents only 14% of long term
developments.
Wind Farm development footprint / province [MW]
Source: Azure International / Suzlon Proprietary Report / Emerging Energy Research
To be updated
-
5,0
00
10
,00
0
15
,00
0
20
,00
0
25
,00
0
30
,00
0
35
,00
0
40
,00
0
45
,00
0
50
,00
0
55
,00
0
60
,00
0
Inner Mongolia
Jilin
Hebei
Liaoning
Gansu
Shandong
Jiangsu
Heilongjiang
Xinjiang
Ningxia
Guangdong Long Term Development
Near Term Development
Order Backlog
Installad capacity

l S21
China Wind Power Development footprint
1,101 18%
4,900 82%
Installad Capacity
2,553 13%
16,411 87%
Order Backlog
4,145 13%
28,591 87%
Short Term Development
13,914 14%
86,383 86%
Long Term Development
297 5%
3,319 55%
2,385 40%
Installad Capacity
435 2%
10,066 53%
8,463 45%
Order Backlog
1,035 3%
20,551 63%
11,151 34%
Short Term Development
4,798 5%
70,881 71%
24,618 24%
Long Term Development
Wind Farm development – Temperature [LTV/STV] - MW Standard Temperature Low Temperature
Wind Farm development – Wind Class [I / II / III] - MW Class I Class II Class III
The Chinese Wind power business is clearly a Class II/III LTV predominant Market, and the future tendency shows an increased importance in LTV/Class II, for what we will need larger and more competitive machines in terms RMB/MWh. Our current product portfolio is not sustainable on a medium/long term, and action must be taken immediately
Source: Azure International / Suzlon Proprietary Report

l S22
Competition: Manufacturing Buildup – Industry Plans
1,404
3,322
11,377
16,671
19,446
20,971
Analysis
Of late, there has been a trend of Large Chinese Power getting into Wind turbine manufacturing. This may take away significant volume from the open market and further intensifies the competition
There is a significant mismatch between capacity build-up and market forecast
If plans are fully implemented, local companies will be able, alone, to handle the market
Foreigner players will face a very stiff price competition and will need to develop export plans
Capacity is supposed to be even higher, if smaller players are considered
Suzlon, GE, Gamesa, Acciona, Vestas, Nordex
Sinovel, Windey, DFEM, Goldwind
24+ companies with technology or license agreement and detailed BP for WTG manufacturing
Source: Azure International / Suzlon Proprietary Report / New Energy Finance
NEF Forecast (MW) 11,200 15,900 18,100

l S23
Macro Economic Conditions

l S24
Macro Economic IndicatorsBanking Condition in China
Stimulus RMB 4trn (USD ½ trn but only ¼ is central budget & new) boosts lending, up 18% y-o-y in Dec. (vs. 5% for 1Q08) bringing full year loans granted to RMB 5trn for 2008, up 35%
0.5% decrease in loan reserve rate (now 14.5% as at 5 Dec) will tie-up a further RMB 150Bn
Stimulus affirms banking sector to continue & step up lending to wind
Most wind projects (SOE) financed up to 80% by on balance sheet debt
Compared to thermal power, wind projects are more sensitive to long-term interest rates
Some regional subsidiaries of State-owned Commercial Banks were prevented from disbursing approved loans in ’08…wait and see for ‘09
Source: Azure International
l S25
Renewable Energy Financing
New guidelines have been introduced for the approval process Detailed project review process is in place, linking
the disbursements to specific projects. This eliminates flexibility for the developers to use the funding for other projects.
Banks take greater responsibility for the due diligence
Investment Considerations Only Chinese majority owned JV is entitled for CDM
registration 51% Chinese shareholding critical for CER revenues
Debt/Equity ratio Chinese companies 80:20 Foreign companies maximum 2:1
Foreign developers to be adversely effected Regulations restrict carbon credit revenues
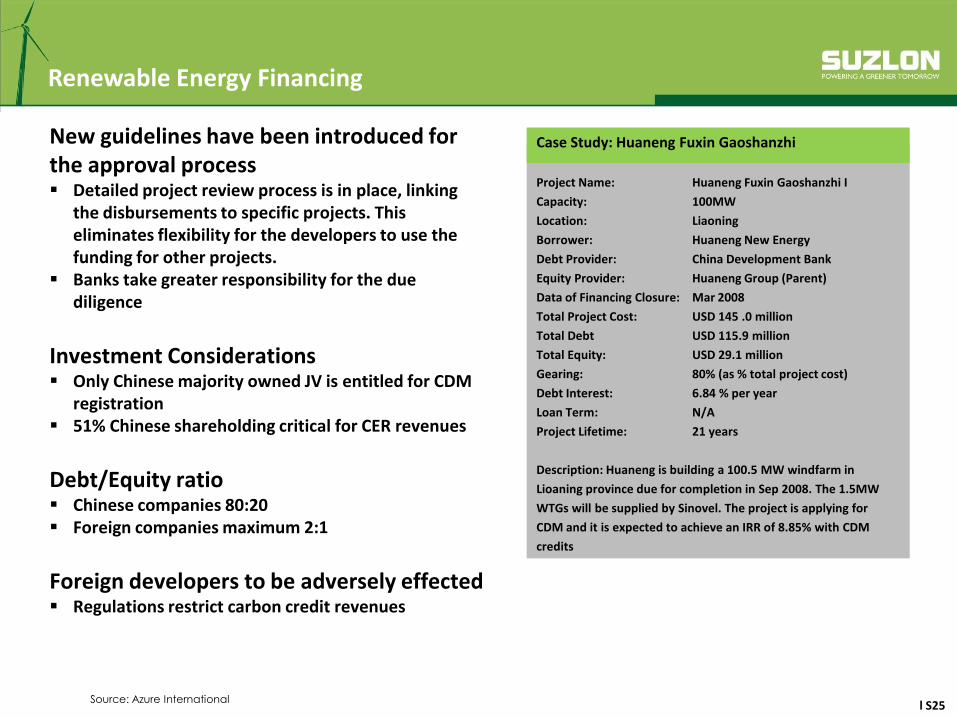
Project Name: Huaneng Fuxin Gaoshanzhi I
Capacity: 100MW
Location: Liaoning
Borrower: Huaneng New Energy
Debt Provider: China Development Bank
Equity Provider: Huaneng Group (Parent)
Data of Financing Closure: Mar 2008
Total Project Cost: USD 145 .0 million
Total Debt USD 115.9 million
Total Equity: USD 29.1 million
Gearing: 80% (as % total project cost)
Debt Interest: 6.84 % per year
Loan Term: N/A
Project Lifetime: 21 years
Description: Huaneng is building a 100.5 MW windfarm in
Lioaning province due for completion in Sep 2008. The 1.5MW
WTGs will be supplied by Sinovel. The project is applying for
CDM and it is expected to achieve an IRR of 8.85% with CDM
credits
Source: Azure International
Case Study: Huaneng Fuxin Gaoshanzhi

l S26
The Financial Crisis we are facing at the moment has benefited infra-structure projects, especially those related to
Renewable Energy. However:
Financial support is directed to SOE, with clear favorable treatment to those companies
Rules about how the stimulus package will be implemented are unclear, and large part of it is under control of the
provinces, which tends to increase lack of oversight and fair competition
Despite massive investments foreseen for the improvement of the grid infrastructure; there are doubts about the grid
capability to cope with the high targets for wind power. Additionally, slowdown in the economy and its potential long
term effect, may put pressure on grid companies to rationalize wind power generation by different producers; where
the fragmented grid is unable to transit the extra power to regions where the demand is needed. As a matter of
fact, Inner Mongolia is requiring Project Developers to allow grid companies the right to limit the amount of wind
power they can sell to the grid within their PPA contracts. Other provinces may follow suit, even though this is a clear
violation of the National Renewable Energy Law of 2006 (1)
Furthermore:
All indications shows that there will be overcapacity in manufacturing of wind turbines; however current financial
environment may delay expansion plan from small players;
Price pressure has increased significantly, specially for the international suppliers (due to low PPAs, competition from
local players, and overcapacity);
International project developers and turbine suppliers established in China must be granted access to compete on
equal terms with local players on National Level Concession Projects and NDRC special policy projects (such as the
Wind base scheme);
Intention of local project developers to produce its own WTG
Establishment of a “Chinese certification requirement”, when there is an alredy existing and worldwide recognized
certification in place.
Wind Power Development in ChinaConclusions
Source: (1) New Energy Finance - NEF_QO_20090324_China_Market_Outlook_Q1_2009_Final

l S27
Suzlon Manufacturing Facilities

l S28
Suzlon Manufacturing Facility – TianjinAerial View
Total Area: 250,000 m2
Total Built Area: 58,500 m2

l S29
Suzlon Energy Tianjin LtdManufacturing Capabilities
Suzlon Energy Tianjin Ltd
Beijiing Office
Employees : 125
Sales, PM, Site installation and OMS, Financial
Services
Tianjin Factory:
Employees: 924
Manufacturing Capabilities
Rotor Blade Unit (RBU)
Nacelle Cover Unit (NCU)
Wind Turbine Generator Unit (WTG)
Control Panel Unit (CPU)
Generator Unit
Support Infrastructure and facilities
Center for Research& Development
Training CenterWeihai Rongcheng Wind Farm – Guohua l R40sShandong Province39 x S66 1.25 MW

l S30
Thank you
This presentation and the accompanying slides (the “Presentation”), which have been prepared by Suzlon Energy Limited (the “Company”), have been prepared solely for informationpurposes and do not constitute any offer, recommendation or invitation to purchase or subscribe for any securities, and shall not form the basis or be relied on in connection with anycontract or binding commitment whatsoever. No offering of securities of the Company will be made except by means of a statutory offering document containing detailed information aboutthe Company.
This Presentation has been prepared by the Company based on information and data which the Company considers reliable, but the Company makes no representation or warranty, expressor implied, whatsoever, and no reliance shall be placed on, the truth, accuracy, completeness, fairness and reasonableness of the contents of this Presentation. This Presentation may not beall inclusive and may not contain all of the information that you may consider material. Any liability in respect of the contents of, or any omission from, this Presentation is expressly excluded.
Certain matters discussed in this Presentation may contain statements regarding the Company’s market opportunity and business prospects that are individually and collectively forward-looking statements. Such forward-looking statements are not guarantees of future performance and are subject to known and unknown risks, uncertainties and assumptions that are difficultto predict. These risks and uncertainties include, but are not limited to, the performance of the Indian economy and of the economies of various international markets, the performance ofthe wind power industry in India and world-wide, competition, the company’s ability to successfully implement its strategy, the Company’s future levels of growth andexpansion, technological implementation, changes and advancements, changes in revenue, income or cash flows, the Company’s market preferences and its exposure to market risks, as wellas other risks. The Company’s actual results, levels of activity, performance or achievements could differ materially and adversely from results expressed in or implied by this Presentation.The Company assumes no obligation to update any forward-looking information contained in this Presentation. Any forward-looking statements and projections made by third partiesincluded in this Presentation are not adopted by the Company and the Company is not responsible for such third party statements and projections
No offering of the Company’s securities will be registered under the U.S. Securities Act of 1933, as amended (the “Securities Act”). Accordingly, unless an exemption from registration underthe Securities Act is available, the Company’s securities may not be offered, sold, resold, delivered or distributed, directly or indirectly, into the United States or to, or for the account orbenefit of, any U.S. Person (as defined in regulation S under the Securities Act).
The distribution of this document in certain jurisdictions may be restricted by law and persons into whose possession this presentation comes should inform themselves about and observeany such restrictions.