4th quarter 2010 ezomnotho - kzn treasury fiscal resource... · e-mail: [email protected]...
TRANSCRIPT

EZOMNOTHOTHE KWAZULU-NATAL QUARTERLY ECONOMIC AND STATISTICAL OVERVIEW
Department of EconomicDevelopment and TourismUmnyango Wezokuthuthukiswa
Komnotho Nezokuvakasha
KWAZULU-NATAL PROVINCIAL GOVERNMENT
th4 Quarter 2010
This report is for informational purposes and any comments or statements made herein do not necessarily
reflect the views of the KwaZulu-Natal Department of Economic Development and Tourism and its
collaborative partners. The information is intended for the recipient's use only and should not be cited,
reproduced or distributed to any third party without the prior consent of the author. Although great care is
taken to ensure accuracy of information, the author nor KwaZulu-Natal Department of Economic
Development and Tourism, cannot be held responsible for any decision made on the basis of the
information cited.
For enquires about this publication please contact the following:
Department of Economic Development and Tourism
Cosmas Hamadziripi
Economist, Policy and Planning Unit (Economic Planning)
Tel: +27(0) 33 264 2781
82 520 8715
Email: [email protected]
Website: http://www.kznded.gov.za
Eddie Musasiwa
Economist
33 264 2699
Cell : +27 (0) 82 771 8125
E-Mail: [email protected]
Website:
Trade and Investment KZN
Felleng Mahlatsi
Economist
31 368 9662
Fax : +27 (0) 86 501 0682
Cell : +27 (0) 78 456 4891
E-Mail: [email protected]
Website: www.tikzn.co.za
KZN Provincial Treasury
Nokuthemba Lembethe
Economist, Economic Analysis Unit
Tel: +27(0) 33 897 4444
Cell: +27(0) 82 059 0666
Email: [email protected]
Website: www.kzntreasury.gov.za
Cell : +27 (0)
Department of Economic Development and Tourism
Tel: +27(0)
http://www.kznded.gov.za
Tel: +27(0)
http://
http://
EZOMNOTHO THE KWAZULU-NATAL QUARTERLY ECONOMIC AND STATISTICAL OVERVIEW
“Building an economy that creates opportunities for all and making tourism to work for us all”

EZOMNOTHO THE KWAZULU-NATAL QUARTERLY ECONOMIC AND STATISTICAL OVERVIEW 1
1. INTRODUCTION ........................................................................................5
2. GLOBAL ECONOMIC DEVELOPMENTS AND OUTLOOK...........................6
3. DOMESTIC ECONOMIC DEVELOPMENTS................................................14
4. LABOUR MARKET TRENDS......................................................................22
5. EXCHANGE RATE .....................................................................................28
6. INFLATION ...............................................................................................29
1.1 Introduction .....................................................................................................................................5
1.2 Authorship of the publication ..........................................................................................................5
2.1 Global Economic Activity..................................................................................................................6
2.2 Trade Wars .......................................................................................................................................6
2.3 European debt crisis.........................................................................................................................6
2.4 Global economic growth trends.......................................................................................................7
2.4.1 Advanced Economies .........................................................................................................7
2.4.2 Emerging Economies ..........................................................................................................9
2.5 Unemployment, interest rates and inflation ..................................................................................11
2.6 International exchange rates..........................................................................................................12
2.7 Commodities ..................................................................................................................................12
2.7.1 Brent crude oil..................................................................................................................12
2.7.2 Platinum and gold ............................................................................................................13
3.1 Economic performance in South Africa..........................................................................................14
3.1.1 Quarter-on-quarter Gross Domestic Product (GDP) growth rates ...................................14th3.1.2 4 Quarter sectoral drivers of GDP growth ......................................................................14
3.1.3 2010 Growth Trends.........................................................................................................15th3.2 Regional growth developments: 4 quarter 2010..........................................................................16
3.2.1 Quarter-on-quarter GDP growth rates .............................................................................16
3.2.2 KwaZulu-Natal Quarter-on-quarter sectoral growth trends.............................................17
3.2.3 KwaZulu-Natal Annual Growth Trends .............................................................................18
3.2.4 KwaZulu-Natal Sectoral Annual Growth Trends................................................................18
3.2.5 Regional Annual 2010 Growth Rates................................................................................19
3.3 KwaZulu-Natal Growth Trends in Major Cities ...............................................................................19
3.3.1. Durban .............................................................................................................................20
3.3.2. Pietermaritzburg ..............................................................................................................20
3.3.3. Richards Bay .....................................................................................................................21
4.1 Labour market indicators – South Africa........................................................................................22
4.1.1 Employment trends in South Africa .................................................................................22
4.1.2 Unemployment trends in South Africa.............................................................................22
4.2 Provincial unemployment rates .....................................................................................................23
4.3 Comparative Provincial Employment Trends .................................................................................25th4.4 4 Quarter Employment Creation vis-à-vis Unemployment Increase Paradox ..............................25
4.5 Employment Creation per province ...............................................................................................26
4.6 KZN employment levels by sector ..................................................................................................26
4.7 Labour market outlook...................................................................................................................27
5.1 Recent Exchange Rate Development..............................................................................................28
5.2 Implications for Exchange Rate Volatility .......................................................................................28
6.1 Inflation trends in South Africa ......................................................................................................29
6.2 Geographical inflation....................................................................................................................29
Tab
le O
f C
on
ten
ts
“Building an economy that creates opportunities for all and making tourism to work for us all”
6.3 Inflation outlook.............................................................................................................................30
7. INTERNATIONAL TRADE..........................................................................31
8. FOREIGN AND DOMESTIC INVESTMENT DEVELOPMENTS ...................33
9 OTHER ECONOMIC INDICATORS .............................................................37
10 2011/12 KWAZULU-NATAL PROVINCIAL BUDGET AT A GLANCE............45
11. POLICY ENVIRONMENT 2011/12............................................................48
12 REFERENCES.......................................................................................53
th7.1 South African Trade Performance: 4 quarter 2010.......................................................................31
7.2 Imports .........................................................................................................................................31
7.3 Exports .........................................................................................................................................31
7.4 South Africa Trade Highlights by World Zone: January 2011 .........................................................32
8.1 Domestic Investment Developments .............................................................................................33
8.2 KwaZulu-Natal investment performance, Q4 2010 ........................................................................34
8.2.1 Foreign Direct Investment Announcements.....................................................................35
8.2.2 Other investment projects in KwaZulu-Natal ...................................................................35
8.2.3 Latest Developments........................................................................................................35
9.1 Construction sector developments ................................................................................................37
9.1.1 Building plans – South Africa............................................................................................37
9.2 Retail sector developments............................................................................................................37
9.2.1 Retail ................................................................................................................................37
9.2.2 Retail sales outlook ..........................................................................................................38
9.3 Motor sales developments.............................................................................................................38
9.4 Consumer debt developments.......................................................................................................39
9.4.1 Regional debt developments............................................................................................40
9.5 Liquidations and insolvency ...........................................................................................................41
9.6 Tourism developments...................................................................................................................41
9.6.1 International tourism developments ...............................................................................41
9.6.2 South African Tourism Developments ..............................................................................42
9.6.3 Tourism Accommodation .................................................................................................43
9.6.4 Tourism Migration ............................................................................................................44
10.1 KwaZulu-Natal’s share of the national budget ...............................................................................45
10.2 Summary of total receipts..............................................................................................................45
10.3 KZN Budget Summary: Allocation by Department .........................................................................46
10.4 Budget Allocation per Department ................................................................................................46
10.5 Summary of infrastructure spending by Departments...................................................................47
11.1 National Policy Priorities ................................................................................................................48
11.1.1 New Growth Path (NGP)...................................................................................................48
11.1.2 Industrial Policy Action Plan (IPAP2).................................................................................48
11.1.2.1 IPAP2 Sector Priorities ..................................................................................49
11.2 KwaZulu-Natal Economic Policy Reviews and Policy Pronouncements ..........................................50
11.3 2011/12 KwaZulu-Natal Provincial Budget Policy Priorities ...........................................................50
11.3.1 Flagship programme.........................................................................................................50
11.3.2 Education .........................................................................................................................51
11.3.3 Health...............................................................................................................................51
11.3.4 Agrarian Reform ...............................................................................................................52
11.3.5 Decent Employment.........................................................................................................52
11.3.6 Crime................................................................................................................................52
2 EZOMNOTHO THE KWAZULU-NATAL QUARTERLY ECONOMIC AND STATISTICAL OVERVIEW
“Building an economy that creates opportunities for all and making tourism to work for us all”

3
Table 1: World economic growth (%) outlook projections (January 2011) ...................................................10thTable 2: Unemployment, interest and inflation rates (%): 4 quarter 2010.................................................11
Table 3: Foreign exchange rates 4rd quarter of 2010- monthly averages ....................................................12
Table 4: Quarter-on-quarter change in GDP (seasonally adjusted) per sector at constant 2005 prices for South Africa (%) ............................................................................15
Table 5: 2010 real growth rates (%) per sector .............................................................................................15
Table 6: KZN quarter-on-quarter real growth rate per sector (%).................................................................18
Table 7: KwaZulu-Natal sectoral growth trends per annum ..........................................................................19
Table 8: Labour market indicators in KZN and comparative regions .............................................................23
Table 9: Unemployment rates per province (%)............................................................................................24
Table 10: SA regional employment by province (000s) .................................................................................26
Table 11: KZN Employment Performance by Sector......................................................................................27thTable 12: 4 Quarter geographical headline inflation ...................................................................................30
thTable 13: SA trade statistics, 4 Quarter 2010 and January 2011 (R billion) .................................................31
Table 14: Value of building plans passed by larger municipalities aggregated to provincial level: 2009 versus 2010............................................................................................37
Table 15: Contribution of each retailer to % change in retail sales (constant 2008).....................................38
Table 16: Contribution by activity type to change in motor trade sales .......................................................39
Table 17: Civil cases for debt .........................................................................................................................40
Table 18: Number of civil cases recorded according to selected magistrates' offices...................................40
Table 19: Number of SA residents and foreign travellers by mode of travellers ...........................................43
Table 20: Tourist accommodation .................................................................................................................43
Table 21: SA residents and foreign travellers by direction ............................................................................44
Table 22: Infrastructure spending by Departments ......................................................................................47
List
Of
Tab
les
EZOMNOTHO THE KWAZULU-NATAL QUARTERLY ECONOMIC AND STATISTICAL OVERVIEW
Figure 1: Growth trends in sovereign indebted countries (quarter-on-quarter).............................................7rdFigure 2: OECD 3 quarter and 4 quarter growth trends...............................................................................7
Figure 3: Growth trends in major advanced countries (quarter-on-quarter)..................................................9
Figure 4: Growth trends in major emerging countries (quarter-on-quarter)................................................10
Figure 5: Price of crude oil (US$) - (March 2009 - December 2010) .............................................................13
Figure 6: Price of gold and platinum (US$) - (January 2009 – December 2010) ...........................................13
Figure 7: Annualised quarterly growth in GDP in South Africa (%) ...............................................................14
Figure 8: Sector contribution to SA GDP in 2010 ..........................................................................................16st thFigure 9: KZN quarter-on-quarter real GDP growth rate (1 Quarter 2008 - 4 2010) ..................................17
thFigure 10: 4 Quarter 2010 national and regional growth rates (%) .............................................................17
Figure 11: KwaZulu-Natal annual GDP Growth (%)- (2001-2010)..................................................................18
Figure 12: 2010 national and regional average growth rates (%)..................................................................19
Figure 13: Durban quarter-on-quarter and annualised GDP growth trends (seasonally adjusted) ..............20
Figure 14: Pietermaritzburg quarter-on-quarter and annualised GDP growth trends (seasonally adjusted)21
Figure 15: Richards bay quarter-on-quarter and annualised GDP growth trends (seasonally adjusted) ......21nd thFigure 16: Employment trends in South Africa (2 quarter of 2008 to 4 quarter of 2010) .........................22
nd thFigure 17: Trends in South African unemployment rate (%) - (2 quarter of 2008 to 4 quarter of 2010)...23ndFigure 18: Trends in comparative unemployment rates (2 quarter of 2008 to 4th quarter of 2010) .........24
ndFigure 19: Comparative employment trends (2 quarter of 2008 to 4th quarter of 2010) ..........................25
Figure 20: Trends in South African nominal exchange rates .........................................................................28
Figure 21: Trends in South African year-on-year inflation (January 2009 – January 2011)...........................29st rdFigure 22: Gross fixed capital formation by economic sector; 1 Quarter 2009 – 3 Quarter 2010
(annual % change) ....................................................................................................................33
Figure 23: Gross fixed capital formation in construction, and by business category; st rd1 quarter 2009 – 3 Quarter 2010 (annual % change) ............................................................34
stFigure 24: Share (%) of Gross fixed capital formation by business category (1 quarter 2009 – rd3 quarter 2010) .......................................................................................................................34
Figure 25: New and used vehicle sales in 2010 (year on year % change) .....................................................39
Figure 26: South African number of liquidations (2008-2010)......................................................................41
Figure 27: Total income and occupancy rate trends (2010) .........................................................................44
Figure 28: Provincial share of the national budget .......................................................................................45
Figure 29: KwaZulu-Natal summary of receipts ............................................................................................45
Figure 30: Percentage share of the total budget for 2011/12 Financial Year................................................46
th
List
Of
Figu
res
4 EZOMNOTHO THE KWAZULU-NATAL QUARTERLY ECONOMIC AND STATISTICAL OVERVIEW
“Building an economy that creates opportunities for all and making tourism to work for us all”
5
1. I
ntr
od
uct
ion1.1 Introduction
1.2 Authorship of the publication
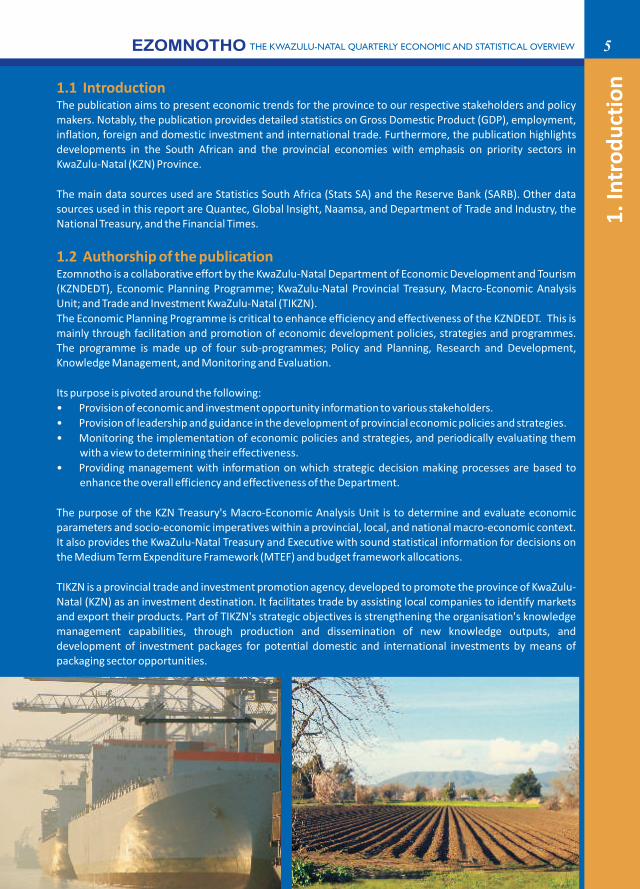
The publication aims to present economic trends for the province to our respective stakeholders and policy makers. Notably, the publication provides detailed statistics on Gross Domestic Product (GDP), employment, inflation, foreign and domestic investment and international trade. Furthermore, the publication highlights developments in the South African and the provincial economies with emphasis on priority sectors in KwaZulu-Natal (KZN) Province.
The main data sources used are Statistics South Africa (Stats SA) and the Reserve Bank (SARB). Other data sources used in this report are Quantec, Global Insight, Naamsa, and Department of Trade and Industry, the National Treasury, and the Financial Times.
Ezomnotho is a collaborative effort by the KwaZulu-Natal Department of Economic Development and Tourism (KZNDEDT), Economic Planning Programme; KwaZulu-Natal Provincial Treasury, Macro-Economic Analysis Unit; and Trade and Investment KwaZulu-Natal (TIKZN).
The Economic Planning Programme is critical to enhance efficiency and effectiveness of the KZNDEDT. This is mainly through facilitation and promotion of economic development policies, strategies and programmes. The programme is made up of four sub-programmes; Policy and Planning, Research and Development, Knowledge Management, and Monitoring and Evaluation.
Its purpose is pivoted around the following:
• Provision of economic and investment opportunity information to various stakeholders.
• Provision of leadership and guidance in the development of provincial economic policies and strategies.
• Monitoring the implementation of economic policies and strategies, and periodically evaluating them with a view to determining their effectiveness.
• Providing management with information on which strategic decision making processes are based to enhance the overall efficiency and effectiveness of the Department.
The purpose of the KZN Treasury's Macro-Economic Analysis Unit is to determine and evaluate economic parameters and socio-economic imperatives within a provincial, local, and national macro-economic context. It also provides the KwaZulu-Natal Treasury and Executive with sound statistical information for decisions on the Medium Term Expenditure Framework (MTEF) and budget framework allocations.
TIKZN is a provincial trade and investment promotion agency, developed to promote the province of KwaZulu-Natal (KZN) as an investment destination. It facilitates trade by assisting local companies to identify markets and export their products. Part of TIKZN's strategic objectives is strengthening the organisation's knowledge management capabilities, through production and dissemination of new knowledge outputs, and development of investment packages for potential domestic and international investments by means of packaging sector opportunities.
EZOMNOTHO THE KWAZULU-NATAL QUARTERLY ECONOMIC AND STATISTICAL OVERVIEW
2.1 Global Economic Activity
2.2 Trade Wars
2.3 European debt crisis
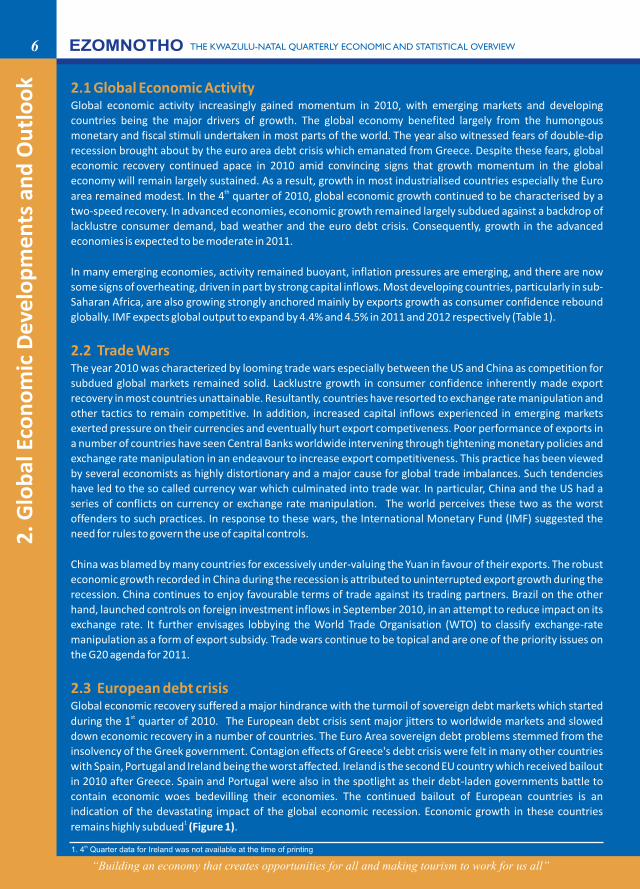
Global economic activity increasingly gained momentum in 2010, with emerging markets and developing
countries being the major drivers of growth. The global economy benefited largely from the humongous
monetary and fiscal stimuli undertaken in most parts of the world. The year also witnessed fears of double-dip
recession brought about by the euro area debt crisis which emanated from Greece. Despite these fears, global
economic recovery continued apace in 2010 amid convincing signs that growth momentum in the global
economy will remain largely sustained. As a result, growth in most industrialised countries especially the Euro tharea remained modest. In the 4 quarter of 2010, global economic growth continued to be characterised by a
two-speed recovery. In advanced economies, economic growth remained largely subdued against a backdrop of
lacklustre consumer demand, bad weather and the euro debt crisis. Consequently, growth in the advanced
economies is expected to be moderate in 2011.
In many emerging economies, activity remained buoyant, inflation pressures are emerging, and there are now
some signs of overheating, driven in part by strong capital inflows. Most developing countries, particularly in sub-
Saharan Africa, are also growing strongly anchored mainly by exports growth as consumer confidence rebound
globally. IMF expects global output to expand by 4.4% and 4.5% in 2011 and 2012 respectively (Table 1).
The year 2010 was characterized by looming trade wars especially between the US and China as competition for
subdued global markets remained solid. Lacklustre growth in consumer confidence inherently made export
recovery in most countries unattainable. Resultantly, countries have resorted to exchange rate manipulation and
other tactics to remain competitive. In addition, increased capital inflows experienced in emerging markets
exerted pressure on their currencies and eventually hurt export competiveness. Poor performance of exports in
a number of countries have seen Central Banks worldwide intervening through tightening monetary policies and
exchange rate manipulation in an endeavour to increase export competitiveness. This practice has been viewed
by several economists as highly distortionary and a major cause for global trade imbalances. Such tendencies
have led to the so called currency war which culminated into trade war. In particular, China and the US had a
series of conflicts on currency or exchange rate manipulation. The world perceives these two as the worst
offenders to such practices. In response to these wars, the International Monetary Fund (IMF) suggested the
need for rules to govern the use of capital controls.
China was blamed by many countries for excessively under-valuing the Yuan in favour of their exports. The robust
economic growth recorded in China during the recession is attributed to uninterrupted export growth during the
recession. China continues to enjoy favourable terms of trade against its trading partners. Brazil on the other
hand, launched controls on foreign investment inflows in September 2010, in an attempt to reduce impact on its
exchange rate. It further envisages lobbying the World Trade Organisation (WTO) to classify exchange-rate
manipulation as a form of export subsidy. Trade wars continue to be topical and are one of the priority issues on
the G20 agenda for 2011.
Global economic recovery suffered a major hindrance with the turmoil of sovereign debt markets which started stduring the 1 quarter of 2010. The European debt crisis sent major jitters to worldwide markets and slowed
down economic recovery in a number of countries. The Euro Area sovereign debt problems stemmed from the
insolvency of the Greek government. Contagion effects of Greece's debt crisis were felt in many other countries
with Spain, Portugal and Ireland being the worst affected. Ireland is the second EU country which received bailout
in 2010 after Greece. Spain and Portugal were also in the spotlight as their debt-laden governments battle to
contain economic woes bedevilling their economies. The continued bailout of European countries is an
indication of the devastating impact of the global economic recession. Economic growth in these countries 1remains highly subdued (Figure 1).
2. G
lob
al E
con
om
ic D
eve
lop
me
nts
an
d O
utl
oo
k6 EZOMNOTHO THE KWAZULU-NATAL QUARTERLY ECONOMIC AND STATISTICAL OVERVIEW
th1. 4 Quarter data for Ireland was not available at the time of printing
“Building an economy that creates opportunities for all and making tourism to work for us all”

Source: Trading Economics, February 2011
Economic growth in most industrialised countries especially in the Euro area remained modest despite fiscal
expansion in 2010. IMF reported that economic growth in the advanced economies averaged 3.0% in 2010.
Growth in industrialised economies is expected to average 2.5% in both 2011 and 2012.
thGross domestic product (GDP) in the OECD area grew by 0.4% in the 4 quarter of 2010, down from 0.6%
recorded in the previous quarter (Figure 2).
rd thFigure 2: OECD 3 quarter and 4 quarter GDP growth trends
Source: OECD Statistics
thDuring the 4 quarter of 2010, US GDP increased by about 2.8% compared with the previous quarter (2.6% in the rd th rd3 quarter) see Figure 3. Compared with the 4 quarter of 2009, US GDP rose by 2.8% (after 3.2% in the 3
2.4 Global economic growth trends2.4.1 Advanced Economies
Organisation for Economic Co-operation and Development (OECD)
United States of America (US)
1.0
0.8
0.6
0.4
0.2
0.0
-0.2
-0.4
-0.6
-0.8
%
OE
CD
-To
tal
Eu
rop
ea
n U
nio
n
Eu
ro a
rea
Ma
jor
se
ve
n
Ca
na
da
Fra
nce
Ge
rma
ny
Ita
ly
Ja
pa
n
Un
ite
d K
ing
do
m
Un
ite
d S
tate
s
2010: Q3 2010: Q4
Figure 1: Growth trends in sovereign indebted countries (quarter-on-quarter)
7
2
0
-2
-4
-6
-8
-10
2010:Q1
2010:Q2
2009:Q3
2010:Q3
2009:Q4
2010:Q4
2009:Q2
2009:Q1
2008:Q4
2008:Q3
2008:Q2
2008:Q1
Ireland Greece Spain Portugal
EZOMNOTHO THE KWAZULU-NATAL QUARTERLY ECONOMIC AND STATISTICAL OVERVIEW
“Building an economy that creates opportunities for all and making tourism to work for us all”

8
thquarter). The acceleration in real GDP in the 4 quarter primarily reflected a sharp downturn in imports, an
increase in personal consumption expenditures (PCE), and an upturn in residential fixed investment that were
partly offset by downturns in private inventory investment and in government spending and a deceleration in
nonresidential fixed investment. Economic growth in 2010, thus averaged 2.8% compared to a decrease of 2.6%
registered in 2009. IMF expects average GDP growth rates of 3.0% and 2.7% in 2011 and 2012 respectively.
thThe Japanese economy contracted by 0.3% in the 4 quarter of 2010, amid slowing exports and weak domestic
demand (Figure 3). Private consumption declined by 0.7%, partly due to the expiry of state subsidies for buyers
of “environmentally friendly” automobiles and other economy-boosting government measures . Exports fell by th0.7% resulting in net trade making a negative contribution to 4 quarter growth. This contraction was equivalent
to a 1.1% annualized decline and was Japan's first in more than a year and came after the expiry of government
subsidies on consumer goods. Analysts view this data as providing sufficient evidence that China has decisively
surpassed Japan as the world's second largest economy after the US in dollar terms. These developments
caused the Japanese economy to grow at 3.9% in 2010 lower than the 4.3% projected by IMF. IMF projected
growth outlook is 1.6% and 1.8% in 2011 and 2012 respectively.
thGDP increased by 0.3% in the Euro Area (EA16) and by 0.2% in the EU27 during the 4 quarter of 2010, rdcompared with the previous quarter . In the 3 quarter of 2010, growth rates were 0.4% in both zones. The Euro
area posted an average growth of 1.8% in 2010 following a 4.1% decline in 2009. Economic growth in the Euro
area is expected to average 1.5% and 1.7% in 2011 and 2012 respectively.
th rdThe German economy expanded by 0.4% in the 4 quarter following a 0.8% growth in the 3 quarter (Figure 3).
In 2010, the German economy grew by 3.6% compared to 4.7% contraction in 2009. Buoyant growth in 2010 was
boosted strongly by increased exports to China and other Asian countries. The IMF expects growth to average
2.2% and 2.0% in 2011 and 2012 respectively.
thUK GDP shrank by 0.6% in the 4 quarter of 2010, compared with an increase of 0.7% in the previous quarter th(Figure 3). The GDP estimate was significantly affected by the bad weather in December. The decline in the 4
quarter is due to decreases in services and construction output. The largest contributor to the decline in this thquarter was from business services and finance. Construction output decreased by 3.3% in the 4 quarter
compared with a rise of 3.9% in the previous quarter. IMF reports that real GDP in the U.K averaged 1.7% in 2010.
thFrance GDP expanded by 0.3% in the 4 quarter of 2010. On an annual basis, a growth rate of 1.5% was recorded.
The IMF expects the French economy to grow by 1.6% in 2011 and 1.8% in 2011 and 2012 respectively. The
lacklustre growth projections for France indicate that the Euro zone economy is still struggling to emerge out of
the recession.
Japan
Euro Area
Germany
United Kingdom (UK)
France
2
4
5
3
Growth rates of 2.0% and 2.3% are expected in 2011 and 2012 respectively.
2. Trading Economics 2011
3. The Euro Area (EA16) consists of Belgium, Germany, Ireland, Greece, Spain, France, Italy, Cyprus, Luxembourg, Malta, the Netherlands, Austria, Portugal, Slovenia, Slovakia and Finland.
4.The EU27 includes Belgium, Bulgaria, the Czech Republic, Denmark, Germany, Estonia, Ireland, Greece, Spain, France, Italy, Cyprus, Latvia, Lithuania, Luxembourg, Hungary, Malta, the Netherlands, Austria, Poland, Portugal, Romania, Slovenia, Slovakia, Finland, Sweden and the United Kingdom.
5. Flash estimates published by Eurostat, the statistical office of the European Union.
EZOMNOTHO THE KWAZULU-NATAL QUARTERLY ECONOMIC AND STATISTICAL OVERVIEW
“Building an economy that creates opportunities for all and making tourism to work for us all”

9
Figure 3: Growth trends in major advanced countries (quarter-on-quarter)
Source: Trading Economics , February 2011
Robust economic growth in most emerging and developing countries continue to be a force behind buoyant
global economic growth in 2010. It averaged 7.1% in 2010. IMF expects growth rates of 6.5% in both 2011 and
2012. High economic growth rates in 2010 were recorded in countries such as China, India and Brazil. Robust
growth in exports and strong consumer demand were the major drivers of economic activity.
thChina's real GDP growth sped up unexpectedly in the 4 quarter despite a series of tightening measures by the th rdGovernment. China's GDP grew by 9.8% in the 4 quarter, faster than the 3 quarter's 9.6% (Figure 4). Economic
growth in 2010 largely reflects buoyant industrial output supported by rebound global demand. China's
industrial value-added output was up 15.7% for 2010 compared to 4.7% in 2009. China runs a trade surplus with
almost all of its major trading partners. China's GDP grew by 10.3% in 2010, above 2009's 9.2% expansion
(Table 1).
thReal GDP in India expanded by 8.2% in the 4 quarter of 2010 (Figure 4). This was the fourth successive quarter
of GDP growth in excess of 8%. Drivers of Indian growth during 2010 were strong domestic demand, rising
exports and expanding services. Exports grew by 16.2% year-on-year, private consumption expanded by 9%,
while business investment grew by 6%. Analysts believe that India's growth rate is set to rival China's in 2011.
IMF expects India's growth rate to average 8.4% in 2011 and 8.0% in 2012.
thBrazilian economy expanded slower than expected in the 4 quarter, though the rate of growth accelerated
from the previous quarter. The seasonally adjusted gross GDP grew by 0.7% quarter-on-quarter in the rd(Figure 4). This follows a 0.4% expansion in the 3 quarter, revised from
steady growth rate of 7.5% compared to 2009. According to the
Brazilian statistical office, the 2010 growth rate is the highest annual rate since 1986. IMF expects economic
growth to average 4.5% and 4.1% in 2011 and 2012 respectively.
Russia's economy grew at its slowest pace in 2010 against a backdrop of record heat that triggered crop losses, rdforced manufacturers to halt output and crippled consumer demand. GDP grew 2.7% in the 3 quarter after
2.4.2 Emerging Economies
China
India
Brazil
Russia
th 4 quarter
0.5% rise reported initially. Year-on-year, rdthe GDP growth eased to 5% from 6.7% in the 3 quarter, while economists had forecast a slowdown to 5.2%. In
2010, the economy maintained an expected
EZOMNOTHO THE KWAZULU-NATAL QUARTERLY ECONOMIC AND STATISTICAL OVERVIEW
2010:Q1
2010:Q2
2009:Q3
2010:Q3
2009:Q4
2010:Q4
2009:Q2
2009:Q1
2008:Q4
2008:Q3
2008:Q2
2008:Q1
6
4
2
0
-2
-4
-6
-8USA Japan UK Germany France
“Building an economy that creates opportunities for all and making tourism to work for us all”
10
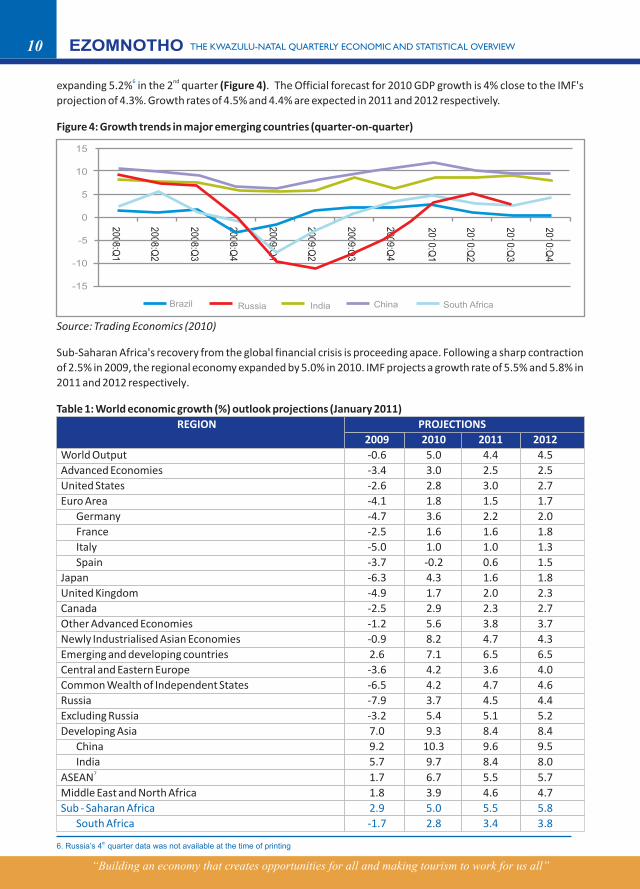
ndexpanding 5.2% in the 2 quarter (Figure 4). The Official forecast for 2010 GDP growth is 4% close to the IMF's
projection of 4.3%. Growth rates of 4.5% and 4.4% are expected in 2011 and 2012 respectively.
Figure 4: Growth trends in major emerging countries (quarter-on-quarter)
Source: Trading Economics (2010)
Sub-Saharan Africa's recovery from the global financial crisis is proceeding apace. Following a sharp contraction
of 2.5% in 2009, the regional economy expanded by 5.0% in 2010. IMF projects a growth rate of 5.5% and 5.8% in
2011 and 2012 respectively.
Table 1: World economic growth (%) outlook projections (January 2011)
World Output -0.6 5.0 4.4 4.5
Advanced Economies -3.4 3.0 2.5 2.5
United States -2.6 2.8 3.0 2.7
Euro Area -4.1 1.8 1.5 1.7
Germany -4.7 3.6 2.2 2.0
France -2.5 1.6 1.6 1.8
Italy -5.0 1.0 1.0 1.3
Spain -3.7 -0.2 0.6 1.5
Japan -6.3 4.3 1.6 1.8
United Kingdom -4.9 1.7 2.0 2.3
Canada -2.5 2.9 2.3 2.7
Other Advanced Economies -1.2 5.6 3.8 3.7
Newly Industrialised Asian Economies -0.9 8.2 4.7 4.3
Emerging and developing countries 2.6 7.1 6.5 6.5
Central and Eastern Europe -3.6 4.2 3.6 4.0
Common Wealth of Independent States -6.5 4.2 4.7 4.6
Russia -7.9 3.7 4.5 4.4
Excluding Russia -3.2 5.4 5.1 5.2
India 5.7 9.7 8.4 8.0
ASEAN 1.7 6.7 5.5 5.7
Middle East and North Africa 1.8 3.9 4.6 4.7
6
7
REGION PROJECTIONS
2009 2010 2011 2012
Developing Asia 7.0 9.3 8.4 8.4
China 9.2 10.3 9.6 9.5
Sub - Saharan Africa 2.9 5.0 5.5 5.8
South Africa -1.7 2.8 3.4 3.8
EZOMNOTHO THE KWAZULU-NATAL QUARTERLY ECONOMIC AND STATISTICAL OVERVIEW
2010:Q1
2010:Q2
2009:Q3
2010:Q3
2009:Q4
2010:Q4
2009:Q2
2009:Q1
2008:Q4
2008:Q3
2008:Q2
2008:Q1
Brazil Russia India China South Africa
15
10
5
0
-5
-10
-15
th6. Russia’s 4 quarter data was not available at the time of printing
“Building an economy that creates opportunities for all and making tourism to work for us all”
11
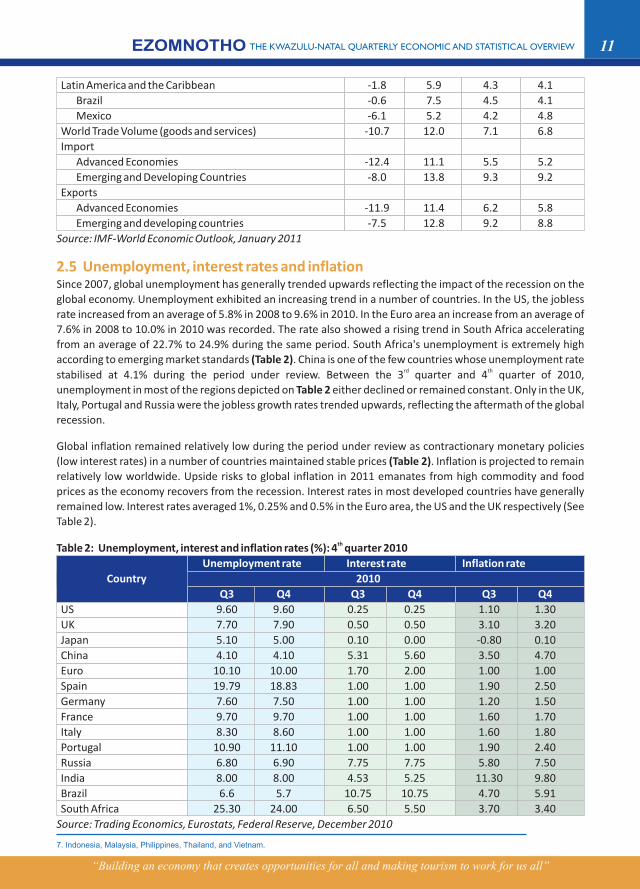
Latin America and the Caribbean -1.8 5.9 4.3 4.1
Brazil -0.6 7.5 4.5 4.1
Mexico -6.1 5.2 4.2 4.8
World Trade Volume (goods and services) -10.7 12.0 7.1 6.8
Import
Advanced Economies -12.4 11.1 5.5 5.2
Emerging and Developing Countries -8.0 13.8 9.3 9.2
Exports
Advanced Economies -11.9 11.4 6.2 5.8
Emerging and developing countries -7.5 12.8 9.2 8.8
Source: IMF-World Economic Outlook, January 2011
Since 2007, global unemployment has generally trended upwards reflecting the impact of the recession on the
global economy. Unemployment exhibited an increasing trend in a number of countries. In the US, the jobless
rate increased from an average of 5.8% in 2008 to 9.6% in 2010. In the Euro area an increase from an average of
7.6% in 2008 to 10.0% in 2010 was recorded. The rate also showed a rising trend in South Africa accelerating
from an average of 22.7% to 24.9% during the same period. South Africa's unemployment is extremely high
according to emerging market standards (Table 2). China is one of the few countries whose unemployment rate rd thstabilised at 4.1% during the period under review. Between the 3 quarter and 4 quarter of 2010,
unemployment in most of the regions depicted on Table 2 either declined or remained constant. Only in the UK,
Italy, Portugal and Russia were the jobless growth rates trended upwards, reflecting the aftermath of the global
recession.
Global inflation remained relatively low during the period under review as contractionary monetary policies
(low interest rates) in a number of countries maintained stable prices (Table 2). Inflation is projected to remain
relatively low worldwide. Upside risks to global inflation in 2011 emanates from high commodity and food
prices as the economy recovers from the recession. Interest rates in most developed countries have generally
remained low. Interest rates averaged 1%, 0.25% and 0.5% in the Euro area, the US and the UK respectively (See
Table 2).
thTable 2: Unemployment, interest and inflation rates (%): 4 quarter 2010
US 9.60 9.60 0.25 0.25 1.10 1.30
UK 7.70 7.90 0.50 0.50 3.10 3.20
Japan 5.10 5.00 0.10 0.00 -0.80 0.10
China 4.10 4.10 5.31 5.60 3.50 4.70
Euro 10.10 10.00 1.70 2.00 1.00 1.00
Spain 19.79 18.83 1.00 1.00 1.90 2.50
Germany 7.60 7.50 1.00 1.00 1.20 1.50
France 9.70 9.70 1.00 1.00 1.60 1.70
Russia 6.80 6.90 7.75 7.75 5.80 7.50
India 8.00 8.00 4.53 5.25 11.30 9.80
Brazil 6.6 5.7 10.75 10.75 4.70 5.91
South Africa 25.30 24.00 6.50 5.50 3.70 3.40
Source: Trading Economics, Eurostats, Federal Reserve, December 2010
2.5 Unemployment, interest rates and inflation
Unemployment rate Interest rate Inflation rate
Country 2010
Q3 Q4 Q3 Q4 Q3 Q4
Italy 8.30 8.60 1.00 1.00 1.60 1.80
Portugal 10.90 11.10 1.00 1.00 1.90 2.40
EZOMNOTHO THE KWAZULU-NATAL QUARTERLY ECONOMIC AND STATISTICAL OVERVIEW
7. Indonesia, Malaysia, Philippines, Thailand, and Vietnam.
“Building an economy that creates opportunities for all and making tourism to work for us all”

12
2.6 International exchange rates
2.7 Commodities
With the exchange currency war looming and continuing, most of emerging economies currencies
strengthened amid investors' appetite for emerging market assets (equities and bonds). This enormous
appetite for emerging market investments is regarded as downside competitiveness risks. The hunger for
emerging market investment assets is driven primarily by relatively higher returns on investment in emerging
markets vis-à-vis subdued interest rates in advanced economies. SA is one of the countries whose exchange rate ndhas been resilient against the US dollar. In the 2 half of 2010, the Rand appreciated by 17% against the US$,
higher compared to most emerging economies. By the end of 2010, the trade- weighted exchange rate rdstrengthened by 47% and in the 3 quarter of 2010. China and the US currencies have generally stabilised during
ththe 4 quarter of 2010 due to currency manipulation by the two countries. The Euro zone economy somewhat thstabilized, with the Euro strengthening during the 4 quarter. High unemployment in the Euro area remains a
challenge for policy makers.
thTable 3: M Foreign Exchange Rates 4 Quarter 2010
GBP£/USD 0.63 0.63 0. 64
USD/ EUR(€) 1.39 1.37 1.32
JPY(¥)/USD 81.8 82.6 83.4
CNY/USD 6.67 6.65 6.65
6.92 6.98 6.82
Source: http//www.fxtop.com, December 2010
Commodities are on top list of favourable and safe investment vehicles as volatility in the currency market
continues. Commodities such as oil, gold and platinum were largely the most sought after. Lucrative commodity
prices have buoyed economic growth in most emerging markets. Continued rise of commodity prices such as oil
and food is, however, a threat to the disinflation growth path in South Africa. This so given that commodities and
food constitute a relatively large weight on South African Consumer Price Index (CPI)
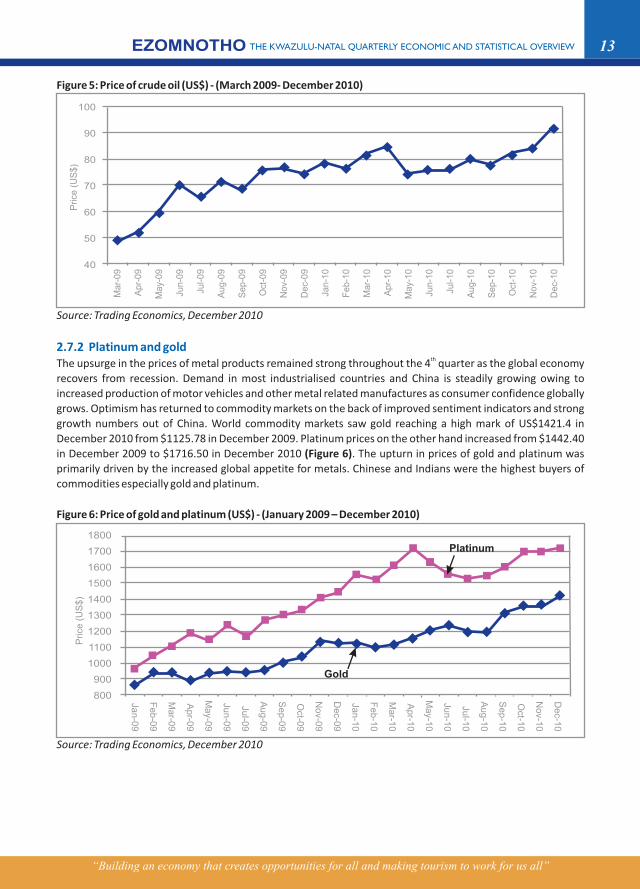
Since May 2010, the price of oil increasingly gained momentum as the global economy recovered. The pace
accelerated due to the winter season in the western countries bringing the price of oil close to $US100 by end of
2010 (Figure 5). The price of oil was expected to rise further as public demonstrations continue in Libya and
parts of the Arab world. Despite Saudi Arabia's promise to increase production in an attempt to bridge output
gap caused by production bottlenecks in Libya, the prices of oil remained above the US$100 mark. The
continued rise in the price of oil is a threat to global economic recovery at a time when the world economy is
battling to contain the aftermath of the recession such as the Euro debt crisis.
onthly Average
Currency October November December
ZAR(R)/USD
2.7.1 Brent crude oil
EZOMNOTHO THE KWAZULU-NATAL QUARTERLY ECONOMIC AND STATISTICAL OVERVIEW
“Building an economy that creates opportunities for all and making tourism to work for us all”
13
Figure 5: Price of crude oil (US$) - (March 2009- December 2010)
Source: Trading Economics, December 2010
thThe upsurge in the prices of metal products remained strong throughout the 4 quarter as the global economy
recovers from recession. Demand in most industrialised countries and China is steadily growing owing to
increased production of motor vehicles and other metal related manufactures as consumer confidence globally
grows. Optimism has returned to commodity markets on the back of improved sentiment indicators and strong
growth numbers out of China. World commodity markets saw gold reaching a high mark of US$1421.4 in
December 2010 from $1125.78 in December 2009. Platinum prices on the other hand increased from $1442.40
in December 2009 to $1716.50 in December 2010 (Figure 6). The upturn in prices of gold and platinum was
primarily driven by the increased global appetite for metals. Chinese and Indians were the highest buyers of
commodities especially gold and platinum.
Figure 6: Price of gold and platinum (US$) - (January 2009 – December 2010)
Source: Trading Economics, December 2010
2.7.2 Platinum and gold
EZOMNOTHO THE KWAZULU-NATAL QUARTERLY ECONOMIC AND STATISTICAL OVERVIEW
100
90
80
70
60
50
40
Price
(U
S$
)
Ma
r-0
9
Ap
r-0
9
Ma
y-0
9
Jun
-09
Jul-0
9
Au
g-0
9
Se
p-0
9
Oct
-09
No
v-0
9
De
c-0
9
Jan
-10
Fe
b-1
0
Ma
r-1
0
Ap
r-1
0
Ma
y-1
0
Jun
-10
Jul-1
0
Au
g-1
0
Se
p-1
0
Oct
-10
No
v-1
0
De
c-1
0
Price
(U
S$
)D
ec-1
0
No
v-10
Oct-1
0
Se
p-1
0
Au
g-1
0
Jul-1
0
Jun
-10
Ma
y-10
Ap
r-10
Ma
r-10
Fe
b-1
0
Jan
-10
De
c-09
No
v-09
Oct-0
9
Se
p-0
9
Au
g-0
9
Jul-0
9
Jun
-09
Ma
y-09
Ap
r-09
Ma
r-09
Fe
b-0
9
Jan
-09
1800
1700
1600
1500
1400
1300
1200
1100
1000
900
800
Gold
Platinum
“Building an economy that creates opportunities for all and making tourism to work for us all”

“Building an economy that creates opportunities for all and making tourism to work for us all”
143
. Do
me
stic
Eco
no
mic
Dev
elo
pm
en
ts 3.1 Economic performance in South Africa3.1.1 Quarter-on-quarter Gross Domestic Product (GDP) growth rates
th3.1.2 4 Quarter sectoral drivers of GDP growth
thEconomic growth in South Africa accelerated at 4.4% in the 4 quarter of 2010. This follows a 2.7% (revised th thfrom 2.6%) growth rate in the preceding quarter (Figure 7). The robust 4 quarter growth rate is the 6
rdconsecutive positive quarterly growth rate recorded since the end of recession in the 3 quarter of 2009. This
provides sufficient evidence that the economy has fully recovered from the recession. The modest growth in themployment during the 4 quarter further substantiates this observation. However, the stickiness of
unemployment rate around 24% remains a cause for concern for policy makers. IMF expects the South
African economy to register a growth rate of 3.4% and 3.8% in 2011 and 2012 respectively. Based on these
projections, the output gap in South Africa will remain negative and GDP growth is expected to stay behind
potential over the next two years. Economic growth prospects will depend primarily on strong consumer
confidence and increased government spending on infrastructure. However, there are indications that the
outlook for output growth, while hesitant, is somewhat more positive. Furthermore, the recovery in
household consumption expenditure appears to be sustained.
Figure 7: Annualised quarterly growth in GDP in South Africa (%)
Source: Stats SA, February 2011
thThe 4 quarter economic growth rate was driven by the mining sector (17.1%), contributing 0.9%, followed by
the general government services (5.3%) and contributing 0.7% to growth. The mining sector benefited largely
from favourable metal prices globally and the recently encouraging exchange rate. Although the agriculture
sector seems to have grown robustly by 12.5%, its contribution to GDP growth (0.3%) was inconsequential.
The manufacturing sector also contributed (0.6%) strongly to quarterly GDP, growing at 4.1%. Wholesale,
retail, motor trade and accommodation and the agriculture, forestry and fishing sectors, contributed 0.4% thand 0.3% to the 4 quarter GDP growth respectively (Table 4). Finance, real estate and business services, the
wholesale, retail, motor trade and accommodation industry and the transport, storage and communication
industry each contributed 0.4% on growth based on growth rates of 1.7%, 3.5% and 4.2% respectively.
EZOMNOTHO THE KWAZULU-NATAL QUARTERLY ECONOMIC AND STATISTICAL OVERVIEW
8.0
6.0
4.0
2.0
-
(2.0)
(4.0)
(6.0)
(8.0)
2007
:Q1
2007
:Q2
2007
:Q3
2007
:Q4
2008
:Q1
2008
:Q2
2008
:Q3
2008
:Q4
2009
:Q1
2009
:Q2
2009
:Q3
2009
:Q4
2010
:Q1
2010
:Q2
2010
:Q3
2010
:Q4
6.2
5.1
3.1 2.9
4.7
0.9
(1.8)
(2.8)
3.1
0.9
(5.9)
4.84.4
2.72.8
6.5

15
Table 4: Quarter-on-quarter change in GDP (seasonally adjusted) per sector at constant 2005 prices for South
Africa (%)
Agriculture, forestry and fishing -8.1 -18.7 -13.7 -11.0 4.9 13.6 16.3 12.5
Mining and quarrying -22.9 16.9 -3.7 7.7 18.7 -24.5 33.7 17.1
Manufacturing -24.3 -10.7 8.2 10.8 8.3 5.7 -4.9 4.1
Electricity, gas and water -4.5 1.7 3.6 2.7 4.9 -1.7 -2.2 5.6
Construction 15.6 5.5 2.9 1.2 1.3 1.0 0.8 0.2
Wholesale & retail trade, hotels & restaurants -1.6 -4.6 -0.3 -0.1 3.1 6.0 3.3 3.5
Transport, storage and Communication -1.6 -0.4 2.4 3.0 2.4 4.5 3.0 4.2
Finance, real estate and business services -0.1 -3.4 -0.6 1.8 3.2 4.0 1.4 1.7
General government services 3.5 4.1 2.0 5.2 1.2 4.6 0.4 5.3
Personal services -0.1 -1.5 -4.2 -4.4 3.5 3.6 3.1 3.3
Total value added -5.9 -2.3 1.0 3.2 4.6 2.7 2.6 4.5
Taxes less subsidies -5.4 -7.6 0.2 1.9 6.5 4.0 3.9 4.3
GDP at market prices -5.9 -2.8 0.9 3.1 4.8 2.8 2.7 4.4
Source: Stats SA, February 2011
On an annual basis, the economy grew by 2.8% in 2010 compared to -1.7% in 2009. South Africa's 2010 growth
rate remained low compared to other emerging markets especially other BRICSA countries. The manufacturing
sector grew by 5% compared to -10.4% in 2009 (Table 5). It was the largest contributor to GDP (0.7%) followed
by general government services which grew by (3.0%), contributing 0.4% to the annual growth rate. Other
sectors which contributed strongly to the annual growth rate were finance and business services (0.7%) and
grew by 1.9%. The manufacturing sector remains the backbone of the South African economy in terms of
employment and contribution to GDP. Growth of this sector remains critical to achieve higher employment. The
sector is set to benefit tremendously in 2011 owing to the recently launched R20 billion expansion grants by
Government.
In 2010, factors that weighed down the manufacturing sector were strong exchange rate and the generally
lacklustre consumer demand. It is also evident from this analysis that government services played a pivotal role
in the economy in 2010. The government's drive to embark on a sustainable growth path conducive to
employment generation was critical to ensuring this growth. The Government's planned infrastructural projects
in 2011 are expected to bolster growth prospects in 2011.
Table 5: 2010 real growth rates (%) per sector
Agriculture, forestry and fishing 16.1 -3 0.9
Mining and quarrying -5.6 -4.2 5.8
Manufacturing 2.6 -10.4 5.0
Electricity, gas and water -3.1 -1.6 2.0
Construction 9.5 7.4 1.5
Wholesale, retail, motor trade and accommodation 0.8 -2.5 2.2
Transport, storage and communication 3.4 0.6 2.9
Finance, real estate and business services 7.3 0.9 1.9
General government services 4.5 4.1 3.0
Personal services 3.9 -0.3 0.6
Industry 2009 2010
Q1 Q2 Q3 Q4 Q1 Q2 Q3 Q4
Industry 2008 2009 2010
3.1.3 2010 Economic Growth Trends
EZOMNOTHO THE KWAZULU-NATAL QUARTERLY ECONOMIC AND STATISTICAL OVERVIEW
“Building an economy that creates opportunities for all and making tourism to work for us all”

16
Total value added 3.7 -1.5 2.8
Taxes less subsidies on products 2.6 -2.9 3.0
GDP at market prices 3.6 -1.7 2.8
Source: Stats SA, February 2011
The relative size of each sector is shown in Figure 8 below. The Finance, real estate and business services
remains the largest sector in South Africa, contributing 21.2% to GDP, followed by the manufacturing sector
(15%).
Figure 8: Sector contribution to SA GDP in 2010
Source: Stats SA, February 2011
thEstimates show that the KZN economy posted a growth rate of 3.9% in the 4 of quarter of 2010. This compares rdbuoyantly to the 1.4% registered in the 3 quarter (Figure 9). The national growth rate of 4.4% was anchored
largely by the mining sector which grew by 17.1% and contributed to 0.9% points to growth. The mining sector
in KZN contributes an infinitesimal 1.1% to provincial GDP as compared to an average of 5.3% for South Africa
as a whole.
th3.2 Regional growth developments: 4 quarter 20103.2.1 Quarter-on-quarter GDP growth rates
EZOMNOTHO THE KWAZULU-NATAL QUARTERLY ECONOMIC AND STATISTICAL OVERVIEW
Personal services
General government services
Finance, real estate and business services
Transport, storage and communication
Wholesale, retail, motor trade and...
Construction
Electricity, gas and water
Manufacturing
Mining and quarrying
Agriculture, forestry and fishing
0.0% 5.0% 10.0% 15.0% 20.0% 25.0%
5.7%
13.6%
21.2%
9.1%
12.0%
3.2%
1.9%
15.0%
5.3%
2.3%
17
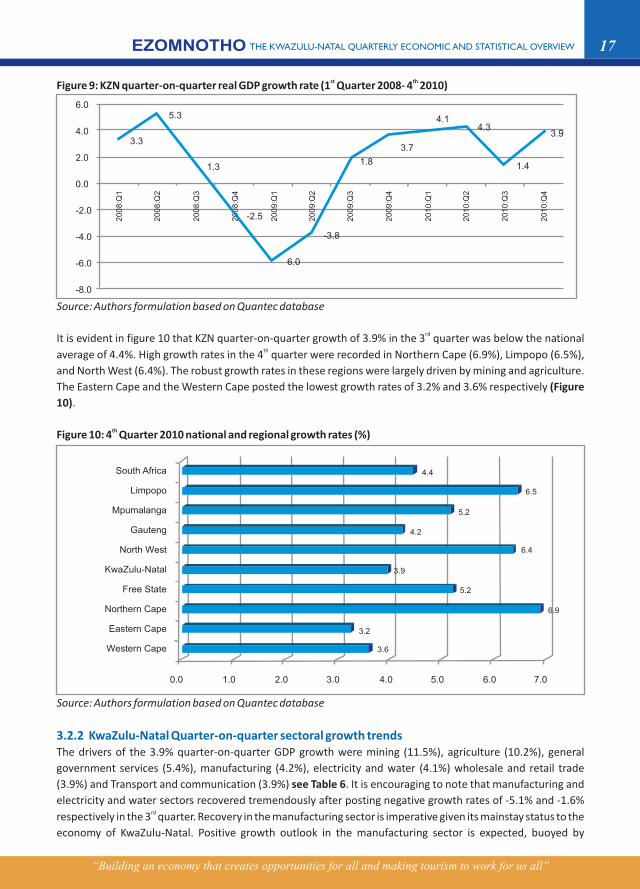
st thFigure 9: KZN quarter-on-quarter real GDP growth rate (1 Quarter 2008- 4 2010)
Source: Authors formulation based on Quantec database
rdIt is evident in figure 10 that KZN quarter-on-quarter growth of 3.9% in the 3 quarter was below the national thaverage of 4.4%. High growth rates in the 4 quarter were recorded in Northern Cape (6.9%), Limpopo (6.5%),
and North West (6.4%). The robust growth rates in these regions were largely driven by mining and agriculture.
The Eastern Cape and the Western Cape posted the lowest growth rates of 3.2% and 3.6% respectively (Figure
10).
thFigure 10: 4 Quarter 2010 national and regional growth rates (%)
Source: Authors formulation based on Quantec database
The drivers of the 3.9% quarter-on-quarter GDP growth were mining (11.5%), agriculture (10.2%), general
government services (5.4%), manufacturing (4.2%), electricity and water (4.1%) wholesale and retail trade
(3.9%) and Transport and communication (3.9%) see Table 6. It is encouraging to note that manufacturing and
electricity and water sectors recovered tremendously after posting negative growth rates of -5.1% and -1.6% rdrespectively in the 3 quarter. Recovery in the manufacturing sector is imperative given its mainstay status to the
economy of KwaZulu-Natal. Positive growth outlook in the manufacturing sector is expected, buoyed by
3.2.2 KwaZulu-Natal Quarter-on-quarter sectoral growth trends
EZOMNOTHO THE KWAZULU-NATAL QUARTERLY ECONOMIC AND STATISTICAL OVERVIEW
South Africa
Limpopo
Mpumalanga
Gauteng
North West
KwaZulu-Natal
Free State
Northern Cape
Eastern Cape
Western Cape
0.0 1.0 2.0 3.0 4.0 5.0 6.0 7.0
3.6
3.2
6.9
5.2
3.9
6.4
4.2
5.2
6.5
4.4
“Building an economy that creates opportunities for all and making tourism to work for us all”
6.0
4.0
2.0
0.0
-2.0
-4.0
-6.0
-8.0
20
08
:Q1
20
08
:Q2
20
08
:Q3
20
08
:Q4
20
09
:Q1
20
09
:Q2
20
09
:Q3
20
09
:Q4
20
10
:Q1
20
10
:Q2
20
10
:Q3
20
10
:Q4
5.3
3.3
1.3
-2.5
6.0
-3.8
1.8
3.7
4.14.3
1.4
3.9

18
improved consumer confidence nationally and globally. The modest growth rate in the construction sector is
discouraging given its importance to employment. Construction is expected to receive a boost once
government's infrastructural projects are rolled out as pronounced in both the state of the nation and the state
of the province addresses.
Table 6: KZN quarter-on-quarter real growth rate per sector (%)
Agriculture, forestry and fishing -8.3 -18.7 -13.5 -10.5 4.1 11.2 13.4 10.2
Mining and quarrying -17.1 28.2 7.6 22.5 12.5 -15.9 18.6 11.5
Manufacturing -24.5 -11.0 7.7 10.2 8.0 5.0 -5.1 4.2
Electricity and water -3.4 3.5 6.0 5.6 3.5 -1.2 -1.6 4.1
Construction 11.9 1.4 -1.8 -4.2 1.0 0.7 0.6 0.1
Wholesale & retail trade; hotels & restaurants -0.2 -2.9 1.9 2.6 3.5 6.8 3.8 3.9
Transport and communication -1.1 0.3 3.2 3.8 2.3 4.2 2.7 3.9
Finance, real estate and business services 0.5 -2.6 0.4 3.0 2.5 3.7 1.4 1.7
Community, social & other personal services 0.2 -1.1 -3.7 -3.7 3.4 3.5 3.1 3.2
General government services 3.8 4.4 2.3 5.5 1.2 4.7 0.4 5.4
All industries at basic prices -6.1 -3.4 2.0 3.9 3.9 4.4 1.0 3.9
Taxes less subsidies on products -5.1 -7.3 0.7 2.4 6.1 3.2 4.7 4.1
GDPR at market prices -6.0 -3.8 1.8 3.7 4.1 4.3 1.4 3.9
Source: Quantec, February 2011
KwaZulu-Natal posted a growth rate of 2.6% in 2010 following a decline of 1.8% in 2009 (Figure 11). The
uninspiring growth of 2.6% recorded in 2010 is typical of an economy that is pulling out of a recession. Economic
recovery in KwaZulu-Natal was anchored primarily by increased consumer spending, the 2010 world cup
spending and by improved growth in entirely all the sectors of the economy.
Figure 11: KwaZulu-Natal annual GDP Growth (%)- (2001-2010)
Source: Author's formulation based on estimates by Quantec
Industry/Sector 2009 2010
Q1 Q2 Q3 Q4 Q1 Q2 Q3 Q4
3.2.3 KwaZulu-Natal Annual Growth Trends
EZOMNOTHO THE KWAZULU-NATAL QUARTERLY ECONOMIC AND STATISTICAL OVERVIEW
7.0
6.0
5.0
4.0
3.0
2.0
1.0
0.0
-1.0
-2.0
-3.0
2001 2002 2003 2004 2005 2006 2007 2008 2009 2010
4.4
2.42.7
4.5
5.8
5.5
5.9
4.0
-1.8
2.6
“Building an economy that creates opportunities for all and making tourism to work for us all”

19
3.2.4 KwaZulu-Natal Sectoral Annual Growth TrendsOn a sectoral basis, the major drivers of growth in 2010 were manufacturing (5.1%), general government
services (3.0%), transport and communication (2.6%) and wholesale, and retail trade, hotels and
accommodation (2.4%) - (Table 7). KZN mining sector contracted by 4.3% in 2010 and was the only sector that
posted a negative growth rate. Increased spending by the provincial government on infrastructure
development is expected to play a dominant role in anchoring higher growth rates in the medium term period.
Table 7: KwaZulu-Natal sectoral growth trends per annum
Agriculture, forestry and fishing 5.2 0.3 -5.8 0.5 4.1 14.6 -3.2 0.6
Mining and quarrying 5.9 2.0 -6.3 -3.3 2.5 -6.5 2.9 -4.3
Manufacturing -0.9 4.7 6.2 6.0 5.3 2.6 -10.6 5.1
Electricity and water -11.5 7.3 6.5 3.3 3.3 -4.0 -0.5 1.6
Construction 4.7 9.4 13.6 7.6 14.4 9.6 4.0 1.1
Wholesale and retail trade; hotels and
restaurants 3.5 5.4 6.5 6.4 5.6 0.9 -1.0 2.4
Community, social and other personal
services 5.6 1.8 3.4 5.3 5.5 3.8 0.0 0.6
General government services 2.2 1.3 4.5 3.0 4.3 4.9 4.4 3.0
All industries at basic prices 2.9 4.5 5.9 5.4 6.0 4.1 -1.7 2.6
Taxes less subsidies on products 1.6 4.8 4.5 6.4 4.9 2.7 -2.6 2.9
GDPR at market prices 2.7 4.5 5.8 5.5 5.9 4.0 -1.8 2.6
Source: Quantec, February 2011
In 2010, KZN again recorded a below average growth rate of 2.6% compared to South Africa's 2.8% (Figure 12). thThis growth rate positioned KwaZulu-Natal as the slowest growing economy during the 4 quarter after the
Eastern Cape (2.3%), Northern Cape (2.3%) and Western Cape (2.5%). Provinces that posted higher growth
rates were Limpopo (3.9%), Mpumalanga (3.3%), Gauteng (3.0%) and North West (3.0%).
Figure 12 : 2010 National and Regional Average Growth Rates (%)
Source: Quantec,
Industry/Sector 2003 2004 2005 2006 2007 2008 2009 2010
Transport and communication 7.0 4.5 5.9 5.2 7.1 3.8 1.2 2.6
Finance, real estate and business services 5.6 7.2 10.6 7.7 7.8 7.3 1.5 1.8
February 2011
3.2.5 Regional Annual 2010 Growth Rates
EZOMNOTHO THE KWAZULU-NATAL QUARTERLY ECONOMIC AND STATISTICAL OVERVIEW
South Africa
Limpopo
Mpumalanga
Gauteng
North West
KwaZulu-Natal
Free State
Northern Cape
Eastern Cape
Western Cape
2.8
3.9
3.3
3.0
3.0
2.6
2.7
2.3
2.3
2.5
0.0 0.5 1.0 1.5 2.0 2.5 3.0 3.5 4.0
“Building an economy that creates opportunities for all and making tourism to work for us all”

20
3.3 KwaZulu-Natal Growth Trends in Major Cities3.3.1 Durban
8
3.3.2 Pietermaritzburg
stFigure 13 shows the city of Durban quarter-on-quarter and year-on-year quarterly growth trends between 1 th thquarter of 2009 and 4 quarter of 2009. In the 4 quarter of 2010, the economy of Durban grew by 1.1%
(quarter-on quarter). This compares unfavourably to 3.9% and 4.4% recorded for KwaZulu-Natal and South
Africa respectively .
Source: KwaZulu-Natal Provincial Treasury,
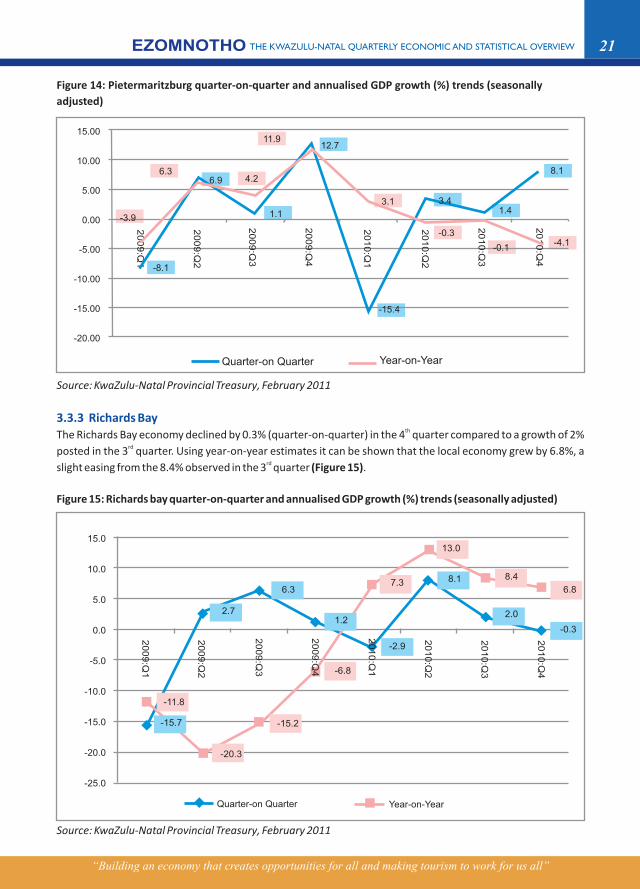
The quarter-on-quarter and year-on-year growth rates for Pietermaritzburg are presented in Figure 14. On a rdyear-on-year basis, Pietermaritzburg exhibited consecutive negative growth rates between the 3 quarter and
th4 quarter. This gloomy picture can be explained by the poor performance of Msunduzi municipal finance since
2009. However, a completely converse picture is depicted when one considers the quarter-on-quarter growth
trends. A highly buoyant growth rate of 8.1% was recorded.
Figure 13: Durban quarter-on-quarter and annualised GDP growth (%) trends (seasonally adjusted)
February 2011
EZOMNOTHO THE KWAZULU-NATAL QUARTERLY ECONOMIC AND STATISTICAL OVERVIEW
8.0
6.0
4.0
2.0
0.0
-2.0
-4.0
-6.0
-8.0
20
09
:Q1
20
09
:Q2
20
09
:Q3
20
09
:Q4
20
10
:Q1
20
10
:Q2
20
10
:Q3
20
10
:Q4
Quarter-on Quarter Year-on-Year
-6.3
-5.1
-6.6
3.1
1.80.6
-1.6
4.90.6
1.1
-5.2
-1.1
3.9
5.74.5
5.0
8. GDP Estimates by KwaZulu-Natal Provincial Treasury are more prudent figures which enable us to track economic developments in KwaZulu-Natal regional economy. These figures also enable us to compare growth trends in major cities in KZN.
21
Figure 14: Pietermaritzburg quarter-on-quarter and annualised GDP growth (%) trends (seasonally
adjusted)
Source: KwaZulu-Natal Provincial Treasury, February 2011
February 2011
3.3.3 Richards BaythThe Richards Bay economy declined by 0.3% (quarter-on-quarter) in the 4 quarter compared to a growth of 2%
rdposted in the 3 quarter. Using year-on-year estimates it can be shown that the local economy grew by 6.8%, a rdslight easing from the 8.4% observed in the 3 quarter (Figure 15).
Figure 15: Richards bay quarter-on-quarter and annualised GDP growth (%) trends (seasonally adjusted)
Source: KwaZulu-Natal Provincial Treasury,
EZOMNOTHO THE KWAZULU-NATAL QUARTERLY ECONOMIC AND STATISTICAL OVERVIEW
20
09
:Q1
20
09
:Q2
20
09
:Q3
20
10
:Q2
20
10
:Q3
20
10
:Q4
15.0
10.0
5.0
0.0
-5.0
-10.0
-15.0
-20.0
-25.0
Quarter-on Quarter Year-on-Year
20
09
:Q4
20
10
:Q1
-15.7
2.7
6.3
1.2
-2.9
8.1
2.0
-0.3
-11.8
-20.3
-15.2
-6.8
7.3
13.0
8.4
6.8
Quarter-on Quarter Year-on-Year
15.00
10.00
5.00
0.00
-5.00
-10.00
-15.00
-20.00
20
09
:Q1
20
09
:Q2
20
09
:Q3
20
09
:Q4
20
10
:Q1
20
10
:Q2
20
10
:Q3
20
10
:Q4
-3.9
6.36.9 4.2
11.912.7
3.1 3.41.4
-15.4
1.1
8.1
-4.1-0.1
-0.3
-8.1
“Building an economy that creates opportunities for all and making tourism to work for us all”
22
4.1 Labour market indicators – South Africa4.1.1 Employment trends in South Africa
4.1.2 Unemployment trends in South Africa
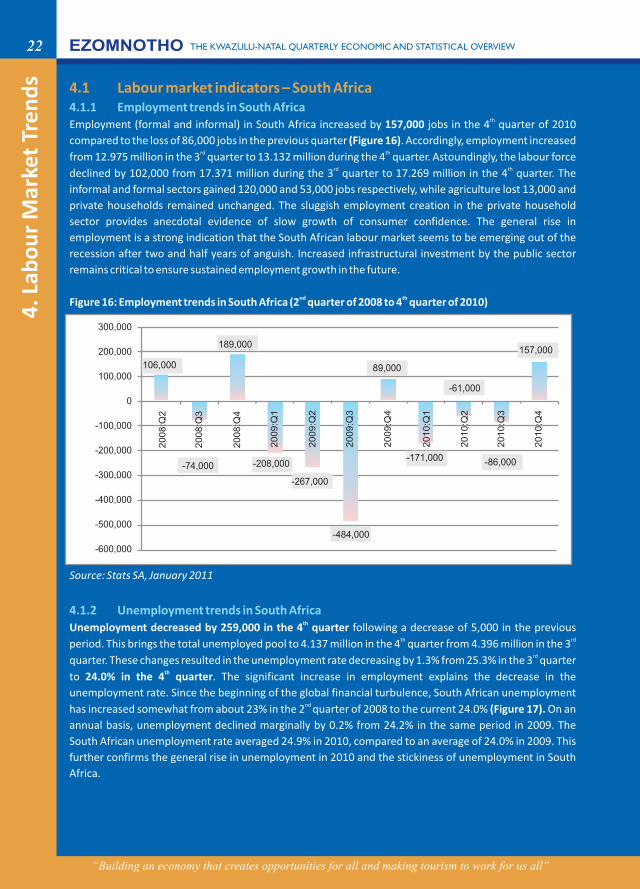
thEmployment (formal and informal) in South Africa increased by 157,000 jobs in the 4 quarter of 2010
compared to the loss of 86,000 jobs in the previous quarter (Figure 16). Accordingly, employment increased rd thfrom 12.975 million in the 3 quarter to 13.132 million during the 4 quarter. Astoundingly, the labour force
rd thdeclined by 102,000 from 17.371 million during the 3 quarter to 17.269 million in the 4 quarter. The
informal and formal sectors gained 120,000 and 53,000 jobs respectively, while agriculture lost 13,000 and
private households remained unchanged. The sluggish employment creation in the private household
sector provides anecdotal evidence of slow growth of consumer confidence. The general rise in
employment is a strong indication that the South African labour market seems to be emerging out of the
recession after two and half years of anguish. Increased infrastructural investment by the public sector
remains critical to ensure sustained employment growth in the future.
nd thFigure 16: Employment trends in South Africa (2 quarter of 2008 to 4 quarter of 2010)
Source: Stats SA, January 2011
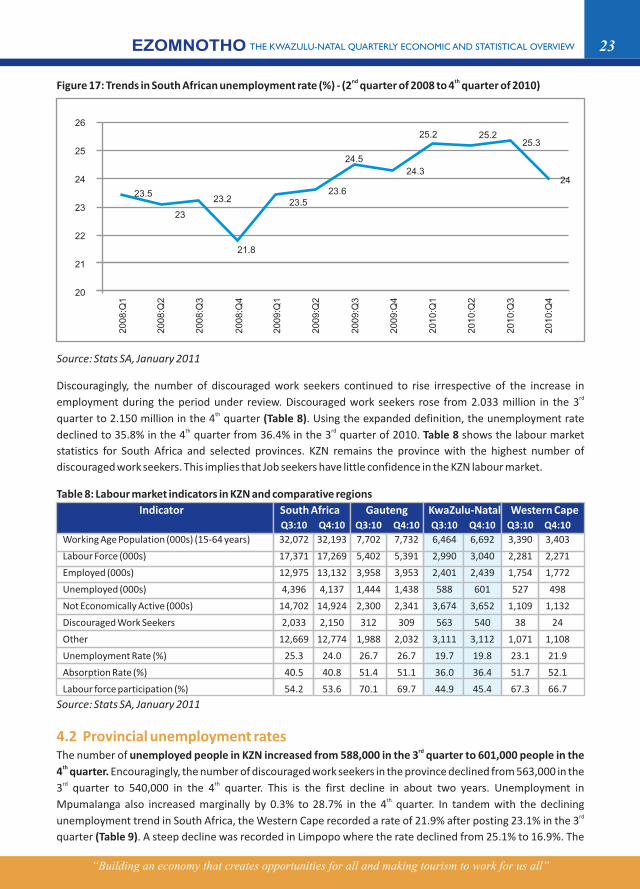
thUnemployment decreased by 259,000 in the 4 quarter following a decrease of 5,000 in the previous th rdperiod. This brings the total unemployed pool to 4.137 million in the 4 quarter from 4.396 million in the 3
rdquarter. These changes resulted in the unemployment rate decreasing by 1.3% from 25.3% in the 3 quarter thto 24.0% in the 4 quarter. The significant increase in employment explains the decrease in the
unemployment rate. Since the beginning of the global financial turbulence, South African unemployment nd has increased somewhat from about 23% in the 2 quarter of 2008 to the current 24.0% (Figure 17). On an
annual basis, unemployment declined marginally by 0.2% from 24.2% in the same period in 2009. The
South African unemployment rate averaged 24.9% in 2010, compared to an average of 24.0% in 2009. This
further confirms the general rise in unemployment in 2010 and the stickiness of unemployment in South
Africa.
4. L
abo
ur
Mar
ket
Tre
nd
sEZOMNOTHO THE KWAZULU-NATAL QUARTERLY ECONOMIC AND STATISTICAL OVERVIEW
300,000
200,000
100,000
0
-100,000
-200,000
-300,000
-400,000
-500,000
-600,000
20
08
:Q2
20
08
:Q4
20
09
:Q4
20
10
:Q4
20
08
:Q3
106,000
189,000
-74,000 -208,000
-484,000
89,000
-171,000
-61,000
-86,000
157,000
-267,000
20
09
:Q1
20
09
:Q2
20
09
:Q3
20
10
:Q1
20
10
:Q2
20
10
:Q3
“Building an economy that creates opportunities for all and making tourism to work for us all”
23
nd thFigure 17: Trends in South African unemployment rate (%) - (2 quarter of 2008 to 4 quarter of 2010)
Source: Stats SA, January 2011
Discouragingly, the number of discouraged work seekers continued to rise irrespective of the increase in rdemployment during the period under review. Discouraged work seekers rose from 2.033 million in the 3
thquarter to 2.150 million in the 4 quarter (Table 8). Using the expanded definition, the unemployment rate th rddeclined to 35.8% in the 4 quarter from 36.4% in the 3 quarter of 2010. Table 8 shows the labour market
statistics for South Africa and selected provinces. KZN remains the province with the highest number of
discouraged work seekers. This implies that Job seekers have little confidence in the KZN labour market.
Table 8: Labour market indicators in KZN and comparative regions
Working Age Population (000s) (15-64 years) 32,072 32,193 7,702 7,732 6,464 6,692 3,390 3,403
Labour Force (000s) 17,371 17,269 5,402 5,391 2,990 3,040 2,281 2,271
Employed (000s) 12,975 13,132 3,958 3,953 2,401 2,439 1,754 1,772
Unemployed (000s) 4,396 4,137 1,444 1,438 588 601 527 498
Not Economically Active (000s) 14,702 14,924 2,300 2,341 3,674 3,652 1,109 1,132
Discouraged Work Seekers 2,033 2,150 312 309 563 540 38 24
Other 12,669 12,774 1,988 2,032 3,111 3,112 1,071 1,108
Unemployment Rate (%) 25.3 24.0 26.7 26.7 19.7 19.8 23.1 21.9
Absorption Rate (%) 40.5 40.8 51.4 51.1 36.0 36.4 51.7 52.1
Labour force participation (%) 54.2 53.6 70.1 69.7 44.9 45.4 67.3 66.7
Source: Stats SA, January 2011
rdThe number of unemployed people in KZN increased from 588,000 in the 3 quarter to 601,000 people in the th4 quarter. Encouragingly, the number of discouraged work seekers in the province declined from 563,000 in the rd th3 quarter to 540,000 in the 4 quarter. This is the first decline in about two years. Unemployment in
thMpumalanga also increased marginally by 0.3% to 28.7% in the 4 quarter. In tandem with the declining rdunemployment trend in South Africa, the Western Cape recorded a rate of 21.9% after posting 23.1% in the 3
quarter (Table 9). A steep decline was recorded in Limpopo where the rate declined from 25.1% to 16.9%. The
Indicator South Africa Gauteng KwaZulu-Natal Western CapeQ3:10 Q4:10 Q3:10 Q4:10 Q3:10 Q4:10 Q3:10 Q4:10
4.2 Provincial unemployment rates
EZOMNOTHO THE KWAZULU-NATAL QUARTERLY ECONOMIC AND STATISTICAL OVERVIEW
26
25
24
23
22
21
20
20
08
:Q1
20
08
:Q2
20
08
:Q3
20
08
:Q4
20
09
:Q1
20
09
:Q2
20
09
:Q3
20
10
:Q1
20
10
:Q2
20
10
:Q3
20
10
:Q4
23.5
23
23.2
21.8
23.523.6
24.5
24.3
25.2 25.225.3
24
20
09
:Q4
“Building an economy that creates opportunities for all and making tourism to work for us all”

24
decline positioned Limpopo as the regional economy with the lowest unemployment rate in South Africa.
However, this decline is not sustainable as it can be attributed to a significant increase in the number of
discouraged work seekers from 321,000 to 393,000. This is evidence of declining employment opportunities in
Limpopo.
Unemployment remains high and above 30% mark in Northern Cape (34.4%) and Free State (35.5%). In
Gauteng, the unemployment rate remained constant at 26.7%. Using the expanded definition, KZN rd thunemployment rate declined from 38.7% in the 3 quarter to 38.3% in the 4 quarter. The Western Cape
remains the province with the lowest expanded unemployment rate of 24%. Limpopo (42.6%), North West
(41.6%) and Eastern Cape (40%) are the provinces with the highest expanded unemployment rate.
Table 9: Unemployment rates per province (%)
Western Cape 21.4 21.8 21.9 -1.2 0.5
Eastern Cape 27.0 27.2 24.7 -2.5 -2.3
Northern Cape 24.5 25.8 24.3 -1.5 -0.2
Free State 25.1 29.5 27.1 -2.4 0.2
North West 26.9 28.0 24.2 -3.8 -2.7
Gauteng 25.4 26.7 26.7 0.0 1.3
Mpumalanga 26.3 28.4 28.7 0.3 2.4
Limpopo 26.9 25.1 16.9 -8.2 -10.0
South Africa 24.1 25.3 24.0 -1.3 -0.2
Source: Stats SA, January 2011
Figure 18 evinces the unemployment trends for South Africa, Gauteng, KZN and the Western Cape between the st th1 quarter of 2008 and the 4 quarter of 2010. It is evident that unemployment has exhibited a general decline in
ththe major regions shown except in KZN where a marginal increase of 0.1% was recorded in the 4 quarter. The ndgeneral rise in unemployment since the 2 quarter of 2009 is related to the decline in employment as a result of
the global economic recession. KZN is depicted as the province with the lowest unemployment rate. This low
unemployment rate, however, is unsustainable given an abnormally high number of discouraged work seekers.
nd thFigure 18: Trends in comparative unemployment rates (2 quarter of 2008 to 4 quarter of 2010)
Source: Stats SA,
Region Q4:2009 Q3:2010 Q4:2010 Quarterly
change (000) change (000)
Annual
KwaZulu-Natal 19.3 19.7 19.8 0.1 0.5
January 2011
EZOMNOTHO THE KWAZULU-NATAL QUARTERLY ECONOMIC AND STATISTICAL OVERVIEW
29
27
25
23
21
19
17
15
2008:Q1
2008:Q2
2008:Q3
2008:Q4
2009:Q1
2009:Q2
2009:Q3
2010:Q1
2010:Q2
2010:Q3
2010:Q4
2009:Q4
S/Africa W/Cape KZN Gauteng
“Building an economy that creates opportunities for all and making tourism to work for us all”
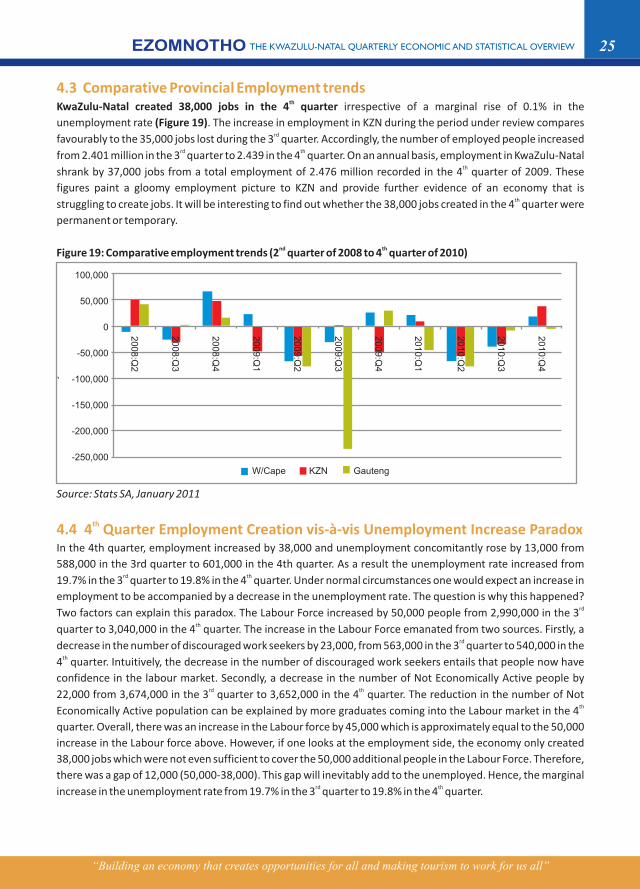
25
4.3 Comparative Provincial Employment trends
th4.4 4 Quarter Employment Creation vis-à-vis Unemployment Increase Paradox
thKwaZulu-Natal created 38,000 jobs in the 4 quarter irrespective of a marginal rise of 0.1% in the
unemployment rate (Figure 19). The increase in employment in KZN during the period under review compares rdfavourably to the 35,000 jobs lost during the 3 quarter. Accordingly, the number of employed people increased
rd thfrom 2.401 million in the 3 quarter to 2.439 in the 4 quarter. On an annual basis, employment in KwaZulu-Natal thshrank by 37,000 jobs from a total employment of 2.476 million recorded in the 4 quarter of 2009. These
figures paint a gloomy employment picture to KZN and provide further evidence of an economy that is thstruggling to create jobs. It will be interesting to find out whether the 38,000 jobs created in the 4 quarter were
permanent or temporary.
In the 4th quarter, employment increased by 38,000 and unemployment concomitantly rose by 13,000 from
588,000 in the 3rd quarter to 601,000 in the 4th quarter. As a result the unemployment rate increased from rd th19.7% in the 3 quarter to 19.8% in the 4 quarter. Under normal circumstances one would expect an increase in
employment to be accompanied by a decrease in the unemployment rate. The question is why this happened? rdTwo factors can explain this paradox. The Labour Force increased by 50,000 people from 2,990,000 in the 3
thquarter to 3,040,000 in the 4 quarter. The increase in the Labour Force emanated from two sources. Firstly, a rddecrease in the number of discouraged work seekers by 23,000, from 563,000 in the 3 quarter to 540,000 in the
th4 quarter. Intuitively, the decrease in the number of discouraged work seekers entails that people now have
confidence in the labour market. Secondly, a decrease in the number of Not Economically Active people by rd th22,000 from 3,674,000 in the 3 quarter to 3,652,000 in the 4 quarter. The reduction in the number of Not
thEconomically Active population can be explained by more graduates coming into the Labour market in the 4
quarter. Overall, there was an increase in the Labour force by 45,000 which is approximately equal to the 50,000
increase in the Labour force above. However, if one looks at the employment side, the economy only created
38,000 jobs which were not even sufficient to cover the 50,000 additional people in the Labour Force. Therefore,
there was a gap of 12,000 (50,000-38,000). This gap will inevitably add to the unemployed. Hence, the marginal rd thincrease in the unemployment rate from 19.7% in the 3 quarter to 19.8% in the 4 quarter.
nd thFigure 19: Comparative employment trends (2 quarter of 2008 to 4 quarter of 2010)
`
Source: Stats SA, January 2011
EZOMNOTHO THE KWAZULU-NATAL QUARTERLY ECONOMIC AND STATISTICAL OVERVIEW
W/Cape KZN Gauteng
100,000
50,000
0
-50,000
-100,000
-150,000
-200,000
-250,000
20
08
:Q2
20
08
:Q3
20
08
:Q4
20
09
:Q1
20
09
:Q2
20
09
:Q3
20
09
:Q4
20
10
:Q1
20
10
:Q2
20
10
:Q3
20
10
:Q4
“Building an economy that creates opportunities for all and making tourism to work for us all”
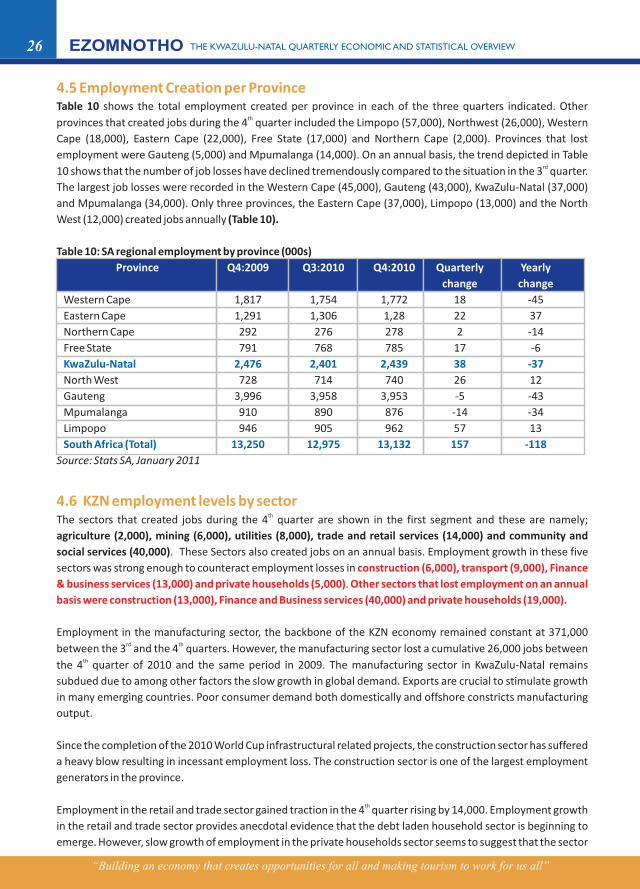
26
4.5 Employment Creation per Province
4.6 KZN employment levels by sector
Table 10 shows the total employment created per province in each of the three quarters indicated.
(26,000), Western
Cape (18,000), Eastern Cape (22,000), Free State (17,000) and Northern Cape (2,000). Provinces that lost
employment were Gauteng (5,000) and Mpumalanga (14,000). On an annual basis, the trend depicted in Table rd10 shows that the number of job losses have declined tremendously compared to the situation in the 3 quarter.
The largest job losses were recorded in the Western Cape (45,000), Gauteng (43,000), KwaZulu-Natal (37,000)
and Mpumalanga (34,000). Only three provinces, the Eastern Cape (37,000), Limpopo (13,000) and the North
West (12,000) created jobs annually (Table 10).
Table 10: SA regional employment by province (000s)
Western Cape 1,817 1,754 1,772 18 -45
Eastern Cape 1,291 1,306 1,28 22 37
Northern Cape 292 276 278 2 -14
Free State 791 768 785 17 -6
North West 728 714 740 26 12
Gauteng 3,996 3,958 3,953 -5 -43
Mpumalanga 910 890 876 -14 -34
Limpopo 946 905 962 57 13
Source: Stats SA,
thThe sectors that created jobs during the 4 quarter are shown in the first segment and these are namely;
agriculture (2,000), mining (6,000), utilities (8,000), trade and retail services (14,000) and community and
social services (40,000). These Sectors also created jobs on an annual basis. Employment growth in these five
sectors was strong enough to counteract employment losses in
.
The manufacturing sector in KwaZulu-Natal remains
subdued due to among other factors the slow growth in global demand. Exports are crucial to stimulate growth
in many emerging countries. Poor consumer demand both domestically and offshore constricts manufacturing
output.
Since the completion of the 2010 World Cup infrastructural related projects, the construction sector has suffered
a heavy blow resulting in incessant employment loss. The construction sector is one of the largest employment
generators in the province.
thEmployment in the retail and trade sector gained traction in the 4 quarter rising by 14,000. Employment growth
in the retail and trade sector provides anecdotal evidence that the debt laden household sector is beginning to
emerge. However, slow growth of employment in the private
Other thprovinces that created jobs during the 4 quarter included the Limpopo (57,000), Northwest
households sector seems to suggest that the sector
Province Q4:2009 Q3:2010 Q4:2010 Quarterly Yearly
change change
KwaZulu-Natal 2,476 2,401 2,439 38 -37
South Africa (Total) 13,250 12,975 13,132 157 -118
January 2011
Employment in the manufacturing sector, the backbone of the KZN economy remained constant at 371,000 rd thbetween the 3 and the 4 quarters. However, the manufacturing sector lost a cumulative 26,000 jobs between
ththe 4 quarter of 2010 and the same period in 2009.
construction (6,000), transport (9,000), Finance
& business services (13,000) and private households (5,000) Other sectors that lost employment on an annual
basis were construction (13,000), Finance and Business services (40,000) and private households (19,000).
EZOMNOTHO THE KWAZULU-NATAL QUARTERLY ECONOMIC AND STATISTICAL OVERVIEW
“Building an economy that creates opportunities for all and making tourism to work for us all”
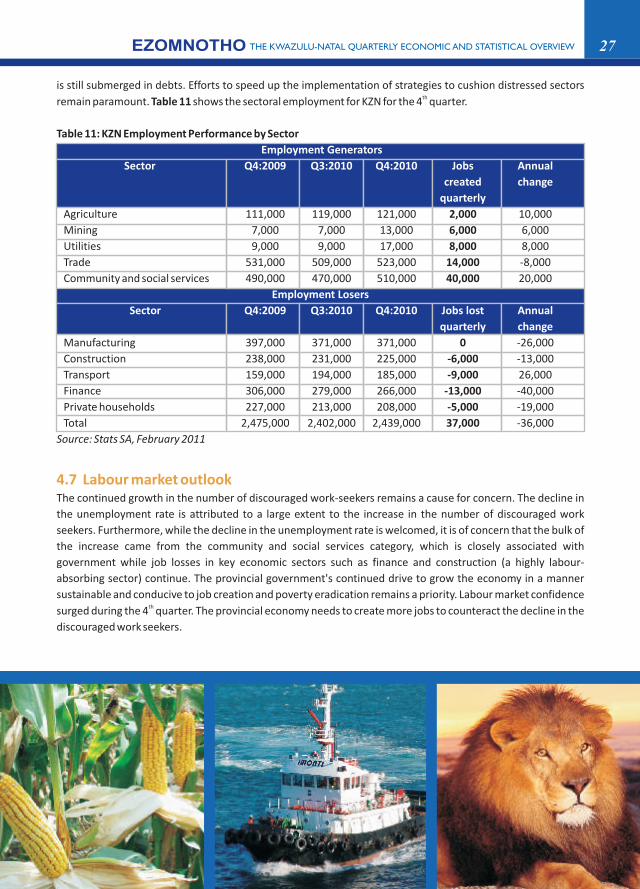
27
is still submerged in debts. Efforts to speed up the implementation of strategies to cushion distressed sectors thremain paramount. Table 11 shows the sectoral employment for KZN for the 4 quarter.
Table 11: KZN Employment Performance by Sector
Agriculture 111,000 119,000 121,000 2,000 10,000
Mining 7,000 7,000 13,000 6,000 6,000
Utilities 9,000 9,000 17,000 8,000 8,000
Trade 531,000 509,000 523,000 14,000 -8,000
Community and social services 490,000 470,000 510,000 40,000 20,000
Manufacturing 397,000 371,000 371,000 0 -26,000
Construction 238,000 231,000 225,000 -6,000 -13,000
Transport 159,000 194,000 185,000 -9,000 26,000
Finance 306,000 279,000 266,000 -13,000 -40,000
Private households 227,000 213,000 208,000 -5,000 -19,000
Total 2,475,000 2,402,000 2,439,000 37,000 -36,000
Source: Stats SA, February 2011
The continued growth in the number of discouraged work-seekers remains a cause for concern. The decline in
the unemployment rate is attributed to a large extent to the increase in the number of discouraged work
seekers. Furthermore, while the decline in the unemployment rate is welcomed, it is of concern that the bulk of
the increase came from the community and social services category, which is closely associated with
government while job losses in key economic sectors such as finance and construction (a highly labour-
absorbing sector) continue. The provincial government's continued drive to grow the economy in a manner
sustainable and conducive to job creation and poverty eradication remains a priority. Labour market confidence thsurged during the 4 quarter. The provincial economy needs to create more jobs to counteract the decline in the
discouraged work seekers.
Employment Generators
Sector Q4:2009 Q3:2010 Q4:2010 Jobs Annual
created change
quarterly
Employment Losers
Sector Q4:2009 Q3:2010 Q4:2010 Jobs lost Annual
quarterly change
4.7 Labour market outlook
EZOMNOTHO THE KWAZULU-NATAL QUARTERLY ECONOMIC AND STATISTICAL OVERVIEW

28
5.1 Recent Exchange Rate Development
5.2 Implications for Exchange Rate Volatility
South Africa's currency (ZAR), appreciated against the dollar and other major currencies in recent times.
Notably, the exchange rate appreciated from an average of ZAR10 in November 2008 to a two and a half year
high of ZAR6.82 in December 2010 against the US$ (Figure 20). The rand has also firmed against other major
currencies such as the euro (€) and the pound (GBP£).
Figure 20: Trends in South African nominal exchange rates
Source: Fxtop, December 2010
The appreciation of the South African currency has been a subject of heated debate among scholars, labour
experts and policy makers in 2010. The Labour Organisation and many other stakeholders have advocated for a
weaker exchange rate as a way of improving the competitiveness of South African exports. Proponents of a
weaker exchange rate believe that such a regime allows exporters to shift from the production of non-tradables
to tradables and hence improve capacity utilisation. Analogously, an appreciation of the exchange rate
generally affects the tradable sector more than the non-tradable sector. An exchange rate appreciation is
associated with a decline in the Rand (ZAR) price of export and a concominant fall in the ZAR price of import.
However, due to the size of the South African economy, exchange rate developments in the domestic economy
will not affect international demand for exports.
In South Africa, the continued appreciation of the Rand predominantly affects sectors such as mining,
manufacturing and agriculture. This has a direct effect of reducing the employment generation capacity of the
economy. Whilst the appreciation of the Rand affects exporters, importers generally benefit from lower prices.
The Minister of Finance, Pravin Gordham, recently alluded that inflation was somewhat under control due to
the rand strength.
From the demand side, South Africa's trade with the rest of the world is biased towards imports as evidenced by
a current account deficit which persisted for a long time. A weaker exchange rate makes imports relatively
expensive compared to domestically produced goods. However, given the non-substitutability between
domestically produced goods and imports the costs of a weaker exchange rate will be factored into production
giving rise to inflation. The structure of South African imports leans towards capital goods, raw materials and oil.
Since the beginning of the year, South African economic agents have enjoyed a generally low inflation level
which has been anchored to a large extent by relatively low prices of imports (oil and raw materials).
5. E
xch
ange
Rat
eEZOMNOTHO THE KWAZULU-NATAL QUARTERLY ECONOMIC AND STATISTICAL OVERVIEW
18
16
14
12
10
8
6
4
2
0
Jan-
07
Mar
-07
May
-07
Jul-0
7
Sep-0
7
Nov-0
7
Jan-
08
Mar
-08
May
-08
Jul-0
8
Sep-0
8
Nov-0
8
Jan-
08
Mar
-08
May
-08
Jul-0
8
Sep-0
8
Nov-0
8
Jan-
09
Mar
-09
May
-09
Jul-0
9
Sep-0
9
Nov-0
9
Jan-
10
Mar
-10
May
-10
Jul-1
0
Sep-1
0
Nov-1
0
Euro (€)
US$
GBP (£)
“Building an economy that creates opportunities for all and making tourism to work for us all”
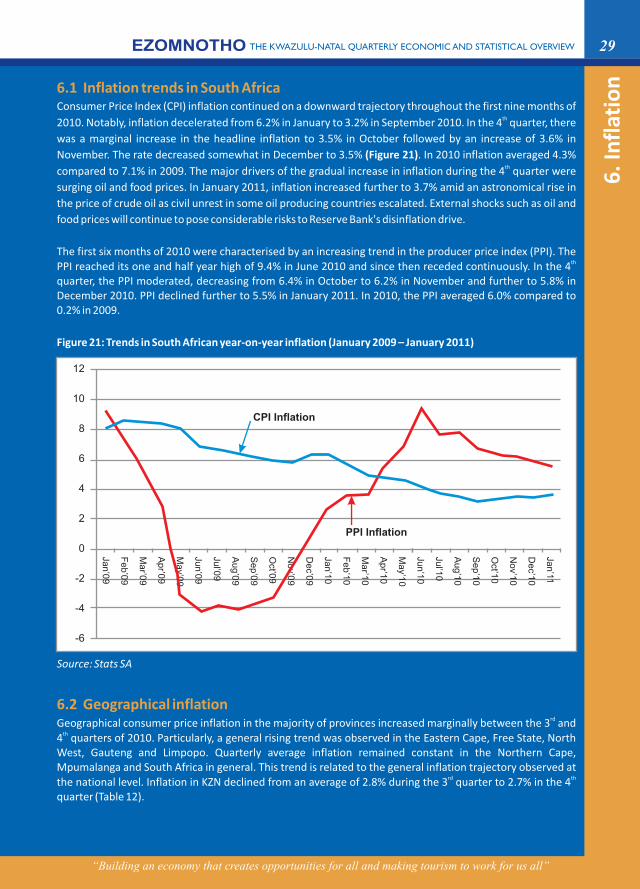
6. I
nfl
atio
n
29
6.1 Inflation trends in South Africa
6.2 Geographical inflation
Consumer Price Index (CPI) inflation continued on a downward trajectory throughout the first nine months of th2010. Notably, inflation decelerated from 6.2% in January to 3.2% in September 2010. In the 4 quarter, there
was a marginal increase in the headline inflation to 3.5% in October followed by an increase of 3.6% in
November. The rate decreased somewhat in December to 3.5% (Figure 21). In 2010 inflation averaged 4.3% thcompared to 7.1% in 2009. The major drivers of the gradual increase in inflation during the 4 quarter were
surging oil and food prices. In January 2011, inflation increased further to 3.7% amid an astronomical rise in
the price of crude oil as civil unrest in some oil producing countries escalated. External shocks such as oil and
food prices will continue to pose considerable risks to Reserve Bank's disinflation drive.
The first six months of 2010 were characterised by an increasing trend in the producer price index (PPI). The thPPI reached its one and half year high of 9.4% in June 2010 and since then receded continuously. In the 4
quarter, the PPI moderated, decreasing from 6.4% in October to 6.2% in November and further to 5.8% in December 2010. PPI declined further to 5.5% in January 2011. In 2010, the PPI averaged 6.0% compared to 0.2% in 2009.
Figure 21: Trends in South African year-on-year inflation (January 2009 – January 2011)
Source: Stats SA
rdGeographical consumer price inflation in the majority of provinces increased marginally between the 3 and th4 quarters of 2010. Particularly, a general rising trend was observed in the Eastern Cape, Free State, North
West, Gauteng and Limpopo. Quarterly average inflation remained constant in the Northern Cape, Mpumalanga and South Africa in general. This trend is related to the general inflation trajectory observed at
rd ththe national level. Inflation in KZN declined from an average of 2.8% during the 3 quarter to 2.7% in the 4 quarter (Table 12).
EZOMNOTHO THE KWAZULU-NATAL QUARTERLY ECONOMIC AND STATISTICAL OVERVIEW
12
10
8
6
4
2
0
-2
-4
-6
Jan
’11
De
c’10
No
v’10
Oct’1
0
Se
p’1
0
Au
g’1
0
Jul’1
0
Jun
’10
Ma
y’10
Ap
r’10
Ma
r’10
Fe
b’1
0
Jan
’10
De
c’09
No
v’09
Oct’0
9
Se
p’0
9
Au
g’0
9
Jul’0
9
Jun
’09
Ma
y’09
Ap
r’09
Ma
r’09
Fe
b’0
9
Jan
’09
CPI Inflation
PPI Inflation
“Building an economy that creates opportunities for all and making tourism to work for us all”

30
thTable 12: 4 Quarter geographical headline inflation
Western Cape 4.0 3.8 3.3 3.7 3.5 3.6 3.3 3.5
Eastern Cape 3.4 3.7 3.7 3.6 3.7 3.8 3.7 3.7
Northern Cape 3.1 2.9 2.8 2.9 2.9 2.9 2.8 2.9
Free State 3.5 3.6 3.9 3.7 4.2 4.1 4.0 4.1
North West 3.0 2.8 2.8 2.9 2.9 3.3 3.1 3.1
Gauteng 3.7 3.3 3.1 3.4 3.3 3.6 3.7 3.5
Mpumalanga 3.3 3.2 3.1 3.2 3.2 3.2 3.2 3.2
Limpopo 3.4 3.1 2.9 3.1 3.5 2.9 3.5 3.3
South Africa 3.7 3.5 3.2 3.5 3.4 3.6 3.5 3.5
Source: Stats SA, January 2011
The Reserve Bank expects the domestic inflation trajectory to remain within the target range over the entire forecast period to the end of 2012. Inflation is expected to average 4.6% in 2011 and 5.3% in 2012. The upward adjustment is mainly due to revised assumptions of the international oil price over the forecast period.
rd Geographical area July August September 3
quarter quarter
average average
thOctober NovemberDecember 4
KwaZulu-Natal 2.9 2.9 2.5 2.8 2.6 2.9 2.7 2.7
6.3 Inflation outlook
EZOMNOTHO THE KWAZULU-NATAL QUARTERLY ECONOMIC AND STATISTICAL OVERVIEW

7. I
nte
rnat
ion
al T
rad
e
31EZOMNOTHO THE KWAZULU-NATAL QUARTERLY ECONOMIC AND STATISTICAL OVERVIEW
“Building an economy that creates opportunities for all and making tourism to work for us all”
th7.1 South African Trade Performance 4 Quarter 2010 (and January 2011)
7.2 Imports
7.3 Exports
The trade statistics for the last three months of 2010 (October to December) recorded a total of
R15.5 billion in trade surplus. This was an impressive improvement over a R5.5 billion deficit in the last quarter
of 2009 (Table 13).
thTable 13: SA trade statistics, 4 Quarter 2010 and January 2011 (R billion)
2010 2009
Month/Variable Exports Imports Trade Exports Imports Trade
Balance Balance
Jan 36.6 40 -3.4
m-o-m* -19.40% -4.10%
y-o-y** 1.1% -25.6%
Dec 53.9 43.6 10.3 45.4 41.7 3.7
m-o-m -10.40% -15.90%
y-o-y 18.80% 4.50%
Nov 60.2 51.8 8.4 45.9 48.3 -2.5
m-o-m 20.80% -2.40%
y-o-y 31.20% 7.10%
Oct 49.8 53 -3.2 44.1 50.8 -6.7
m-o-m -6.30% 7.00%
y-o-y 13.00% 4.40%
Cumulative figures
Jan 36.6 40 -3.4
y-o-y 1.1% -25.6%
Jan - Dec 590.2 585.2 5 513.9 541.2 -27.3
y-o-y 14.90% 8.10%
Jan - Nov 536.5 541.6 -5 470 499.5 -29.5
y-o-y 14.10% 8.40%
Jan - Oct 476.7 489.9 -13.2 424.5 451.2 -26.7
y-o-y 12.30% 8.60%
Source: SARS, Preliminary trade statistics (various); *month-on-month = % change compared to preceding
month; ** year-on-year = % change compared to same month in the previous year
International trade exhibited an improved performance in 2010 compared to 2009. Total exports grew 14.9%
from R513.9 billion in 2009 to R590.0 billion in 2010. On the other hand, imports increased by 8.1% from
R541.2 billion in 2009 to R582.2 billion in 2010. This translated to R5.0 billion surplus compared to R27.3 billion
deficit in 2009. Main trade (import and export) developments are given below.
• Prepared foodstuffs, beverages and tobacco decreased by R 459 million (25%).
• Mineral products decreased by R 908 million (-6%).
• Precious and semi-precious stones and metals decreased by R1 632 million (10%).
• Base metals and articles thereof decreased by R1 641 million (18%)
• Vehicles, aircraft and vessels decreased by R 807 million (15%).
• Mineral products decreased by R 365 million (4%).
• Products of the chemicals or allied industries decreased by R1 185 million (24%).
32
•
• Textile and textile articles decreased by R 478 million (28%).
• Base metals and articles thereof decreased by R 843 million (35%)
• Machinery and electrical appliances decreased by R2 489 million (18%).
• Vehicles, aircraft and vessels increased by R 324 million (6%).
• Original equipment components decreased by R1 136 million (37%).
Overall, the decline in imports (-15.9%) was greater than that in exports (-10.4%), leading to a
R10.3 billion surplus. The preliminary trade statistics for January 2011 recorded a R4.9 billion deficit, after an
impressive R10.3 billion surplus in December 2010. The negative trade balance in January was a result of a
steeper decline in exports (17%) compared to 14% increase in imports. On a year-on-year basis, the January
trade performance was a retreat, from deficit of R3.4 billion registered during the same period in 2009.
The December 2010 to January 2011 change (down by -17.0%) in exports of goods reflected decreases
mainly in:
• Machinery and electrical appliances decreased by R825 million (20%);
• Vehicles, aircraft and vessels decreased by R2,230 million (48%);
• Mineral products decreased by R2,503 million (19%);
• Precious and semi-precious stones and metals decreased by R2,958 million (21%) and
• An increase in base metals and articles thereof by R758 million (10%).
The December 2010 to January 2011 change (up by 14.0%) in imports of goods reflected increases mainly
in:
• Machinery and electrical appliances increased by R1,849 million (17%);
• Original equipment components increased by R1,306 million (67%).
• Products of the chemicals or allied industries increased by R906 million (24%);
• Base metals and articles thereof increased by R806 million (51%);
• Plastics and rubber and articles thereof increased by R464 million (29%);
• Textile and textile articles increased by R428 million (34%) and
• Decreases in mineral products by R264 million (3%) and
• Vehicles, aircraft and vessels by R131 million (2%).
• Asia: The trade deficit increased from R2.1 billion in December to R 4.9 billion in January 2011.
Exports decreased by R 1.5 billion to R 16.6 billion and imports increased by R 1.3 billion to
R 21.5 billion.
• Europe: The surplus of R 0.2 billion in December changed to a deficit of R4.8 billion in January
2011. Exports decreased by R 1.1 billion to R13.0 billion and imports increased by R3.9 billion to
R17.8 billion.
• America: The surplus of R 0.6 billion in December changed to a deficit of R 2.1 billion in January
2011. Exports decreased by R2.2 billion to R3.9 billion and imports increased by R0.5 billion to
R6.0 billion.
• Africa: The surplus decreased from R 5.3 billion in December to R2.9 billion in January 2011.
Exports decreased by R2.0 billion to R6.3 billion and imports increased by R0.4 billion to
R3.4 billion.
• Oceania: The deficit increased from R0.2 billion in December to R0.4 billion in January 2011.
Exports decreased by R0.3 billion to R0.5 billion and imports decreased by R0.01 billion to
R0.9 billion.
Plastics and rubber and articles thereof decreased by R 417 million (21%).
7.4 January 2011: South Africa Trade Highlights by World Zone
EZOMNOTHO THE KWAZULU-NATAL QUARTERLY ECONOMIC AND STATISTICAL OVERVIEW
“Building an economy that creates opportunities for all and making tourism to work for us all”

8. F
ore
ign
An
d D
om
est
ic In
vest
me
nt
Dev
elo
pm
en
ts
33
8.1 Domestic Investment DevelopmentsDomestic investment in the economy appears to be still strained. The latest gross fixed capital formation
rd(GFCF) data in the 3 quarter of 2010 from the South African Reserve Bank (SARB) indicate a general decline in rdinvestment in the country during this period. GFCF performance in the 3 quarter continued on a downward
st spiral after successive loss in momentum since the 1 quarter of the same year, recording 1.4% decline in GFCF ndgrowth, after a decline of 5.1% decrease in 2 quarter of 2010. All sectors except transport, storage and
communications and construction, to a less extent financial intermediation and insurance, real estate and rdbusiness services (FREBS) experienced a decline in GFCF growth in the 3 quarter of 2010 compared to same
quarter in 2009 (Figure 22).
st rdFigure 22: Gross fixed capital formation by economic sector; 1 Quarter 2009 – 3 Quarter 2010 (annual %
change)
Source 23: SARB online statistical queries (2011); own calculations
Interestingly, it is still the non-residential part of Construction Works that is holding the fort, albeit at a slower
pace. Another intriguing revelation is the apparent correlation between public corporations' investment
spending and non-residential investment spending on the one hand, and that between private enterprise
investment spending and residential building category on the other (Figure 23). This may indicate a continued
anti-cyclical approach to spending by government during the trying economic climate.
EZOMNOTHO THE KWAZULU-NATAL QUARTERLY ECONOMIC AND STATISTICAL OVERVIEW
2009/01 2009/02 2009/03 2009/04 2010/01 2010/02 2010/03
60.0%
50.0%
40.0%
30.0%
20.0%
10.0%
0.0%
-10.0%
-20.0%
-30.0%
-40.0%
Total Utilities Construction Mining & Quarrying Logistics Govt Serv Com Serv FREBS Manuf

34
st rdFigure 23: Gross fixed capital formation in construction, and by business category; 1 quarter 2009 – 3
Quarter 2010 (annual % change)
Source: SARB online statistical queries (2011); own calculations
Although it may seem weak in the recent quarters, the contribution of the private sector to investment cannot
be understated. This sector contributes in excess of 70% to the total GFCF in the country (Figure 24). In fact, the
private sector is slowly reclaiming its position in investment, with declines in investment by this sector slowing
down, while increases in public corporations' investment spending are following suit.
st rdFigure 24: Share (%) of Gross fixed capital formation by business category (1 quarter 2009 – 3 quarter 2010)
Source: SARB online statistical queries (2011); own calculations
The Provincial Investment Monitor also reflected positive, though meagre, developments. As at November
2010, the total fixed investment index had been positive for six months on a year-on-year basis, indicating that
investment is slowly turning a corner. Investment in buildings completed and civil construction were negative as
th8.2 KwaZulu-Natal investment performance, 4 Quarter 2010
EZOMNOTHO THE KWAZULU-NATAL QUARTERLY ECONOMIC AND STATISTICAL OVERVIEW
40.0%
30.0%
20.0%
10.0%
0.0%
-10.0%
-20.0%
2009/042009/032009/022009/01 2010/01 2010/02 2010/03
Residential buildings Non-residential buildings Public corporations Private enterprises
100%
90%
80%
70%
60%
50%
40%
30%
20%
10%
0%
2008/01 2008/02 2008/03 2008/04 2009/01 2009/02 2009/03 2009/04 2010/01 2010/02 2010/03
Public corporarions Private enterprises
“Building an economy that creates opportunities for all and making tourism to work for us all”

35
large projects linked to the FIFA Soccer World Cup wound up. However, machinery and equipment, the biggest
category in the fixed investment category for the province, showed significant increases (13.9% in November).
These large increases were probably a result of the stronger Rand, which offered an opportunity for most
manufacturers to upgrade their equipment in order to improve their competitiveness.
January 2011 - Hewlett-Packard (HP), United States is investing in KwaZulu-Natal, South Africa in the Software &
IT services sector in a Sales, Marketing & Support project. The US-based Hewlett-Packard has relocated into a
new office in KwaZulu-Natal. The office will primarily focus on service delivery and consulting. However, in the
coming year the company is set to hire new staff to diversify its services and expand clientele base in the region.
Transnet Pipelines, a subsidiary of Transnet, is constructing a new multi-product pipeline (NMPP) to move
petrol, diesel and jet fuel from Durban to Gauteng province, to replace the existing and ageing Durban to 3Johannesburg fuel pipeline (DJP). The network is expected to have a capacity of 1 000 m /h when brought on
3stream, which could be scalable by up to 3 000 m /h through the addition of new pump stations. The new
pipeline is designed to have a life cycle spanning over 70 years. The project value has escalated by R2.75-billion
from R12.67 billion to R15.42 billion.
The National Energy Regulator of South Africa (Nersa) has provisionally granted Transnet a 59.8% increase in
revenue for its petroleum pipeline network. According to the regulator's draft tariff determination, the State-
owned enterprise's allowable revenue for the 2011/12 financial year will now rise from R1.2 billion to R1.9
billion. This is considered a major financial boost for the company, seeing that it is pushing hard to complete the
NMPP. In October 2010, Transnet submitted to Nersa an application for a 69% increase – which is equivalent to
an increase of R845.8 million – in its allowable revenue for the 2011/12 financial period, for its petroleum
pipeline system. In November last year, the company submitted additional information to its previous
application, which pushed its application for allowable revenue to 128%, or R1.6 billion.
Minister of Public Enterprises unveiled a panel of experts to probe the cost escalations and time delays
associated with the NMPP. The panel will report its findings by the end of April 2011. The minister requested
three independent reports covering governance, engineering and project management aspects of the NMPP, as
well as independent legal opinion. All this comes after it was announced in December 2010, that the cost of the
new pipeline had increased to R23.4 billion from R9.5 billion, and that the delivery schedule had been delayed
from an initial completion date of December 2011 to December 2013.
Transnet is reported to have consented to being part of the probe and will work with the expert team. As a result
of the delays, Transnet has had to develop contingency plans, including road and rail transport options, to
ensure security of fuel supply to Gauteng between 2010 and 2014.
Transnet reported that it had finalised the extensive review of all aspects of the NMPP, and that the
8.2.1 Foreign Direct Investment announcements
8.2.2 Other major investment projects in KwaZulu-Natal
New Multi-product Pipeline (NMPP)- Transnet
8.2.3 Latest DevelopmentsFebruary 2011
January 2011
December 2010
board of
directors have approved the schedule variation and cost changes for the construction of the pipeline. In addition
to the schedule changes, the revised cost estimates for the NMPP are now estimated at R23.4 billion. Transnet
EZOMNOTHO THE KWAZULU-NATAL QUARTERLY ECONOMIC AND STATISTICAL OVERVIEW
“Building an economy that creates opportunities for all and making tourism to work for us all”

36
attributed the revision to a number of reasons, including engineering and environmental impact assessment, a
tight construction schedule at the outset, as well as significant increases to both steel and equipment costs.
The NMPP, which had its deadline extended to December 31, 2013, was on track for completion. Transnet plans
to use road and rail to transport additional fuel, to avoid the likelihood of fuel shortages, as a result of the delay
in the original timeline.
As for the existing DJP, it will have to continue running for nine months beyond March 31, 2011, to cope with
security of supply challenges in Gauteng. Intelligent pigging inspection of the DJP indicates that the pipelines' stflow rate must be reduced to ease the operating pressure from the 1 of April 2011 onwards. The pipeline will
then run together with the NMPP trunk.
Between April 2011 and September 2011, the downscaled DJP, as well as road and rail freight will be used to
transport product. Detailed plans to cope with the reduced flow rate of the DJP during this period will need to be
developed between the Department of Energy, the Department of Public Enterprises, Transnet Pipelines (TPL),
Transnet Freight Rail and the oil industry at large before the NMPP is available; which is the second phase of
TPL's fuel supply bridging plan. However, beyond December 2011, the downscaled DJP and parts of the NMPP
trunk will be used to ensure supply, in collaboration with road and rail transport, until the completion of the
NMPP.
A key action in the second phase of the fuel bridging plan is the simultaneous use of the downscaled DJP and the
NMPP, while bypassing terminal 1 in Island View. Feeder lines to the Durban depot will be used, and meters and
pumps with modified manifolds will be used to feed the DJP and NMPP at the same time.
November 2010
EZOMNOTHO THE KWAZULU-NATAL QUARTERLY ECONOMIC AND STATISTICAL OVERVIEW
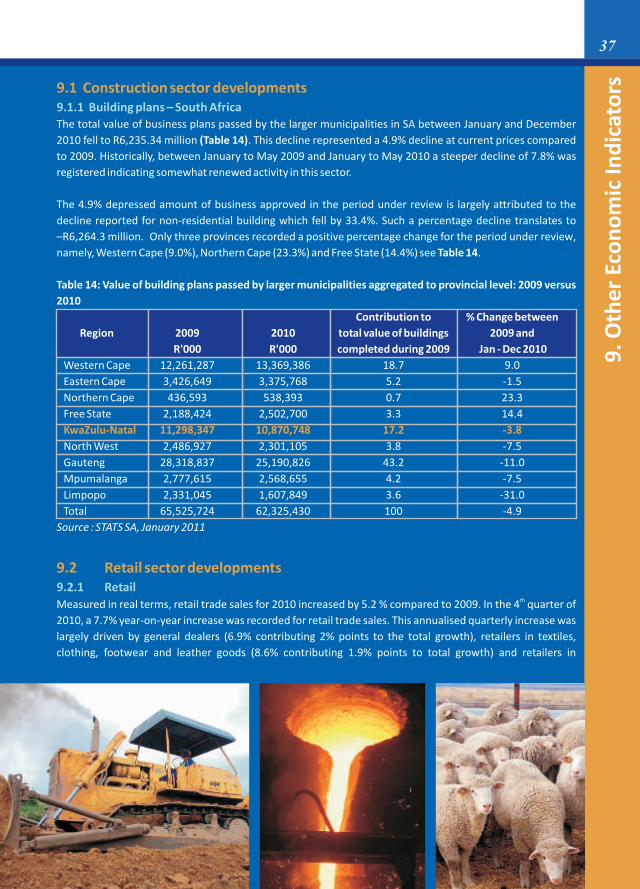
9. O
the
r Ec
on
om
ic In
dic
ato
rs
37
9.1 Construction sector developments
KwaZulu-Natal 11,298,347 10,870,748 17.2 -3.8
9.2 Retail sector developments
9.1.1 Building plans – South Africa
9.2.1 Retail
The total value of business plans passed by the larger municipalities in SA between January and December
2010 fell to R6,235.34 million (Table 14). This decline represented a 4.9% decline at current prices compared
to 2009. Historically, between January to May 2009 and January to May 2010 a steeper decline of 7.8% was
registered indicating somewhat renewed activity in this sector.
The 4.9% depressed amount of business approved in the period under review is largely attributed to the
decline reported for non-residential building which fell by 33.4%. Such a percentage decline translates to
–R6,264.3 million. Only three provinces recorded a positive percentage change for the period under review,
namely, Western Cape (9.0%), Northern Cape (23.3%) and Free State (14.4%) see Table 14.
Table 14: Value of building plans passed by larger municipalities aggregated to provincial level: 2009 versus
2010
Contribution to % Change between
Region 2009 2010 total value of buildings 2009 and
R'000 R'000 completed during 2009 Jan - Dec 2010
Western Cape 12,261,287 13,369,386 18.7 9.0
Eastern Cape 3,426,649 3,375,768 5.2 -1.5
Northern Cape 436,593 538,393 0.7 23.3
Free State 2,188,424 2,502,700 3.3 14.4
North West 2,486,927 2,301,105 3.8 -7.5
Gauteng 28,318,837 25,190,826 43.2 -11.0
Mpumalanga 2,777,615 2,568,655 4.2 -7.5
Limpopo 2,331,045 1,607,849 3.6 -31.0
Total 65,525,724 62,325,430 100 -4.9
Source : STATS SA, January 2011
thMeasured in real terms, retail trade sales for 2010 increased by 5.2 % compared to 2009. In the 4 quarter of
2010, a 7.7% year-on-year increase was recorded for retail trade sales. This annualised quarterly increase was
largely driven by general dealers (6.9% contributing 2% points to the total growth), retailers in textiles,
clothing, footwear and leather goods (8.6% contributing 1.9% points to total growth) and retailers in

38
pharmaceutical and medical goods, cosmetics and toiletries (18.6% contributing 1.0% points to total growth)
see Table 15.
Table 15: Contribution of each retailer to % change in retail sales (constant 2008)
General Dealers 51,273 54,812 3,539 6.9 2.6
Food, Beverages & Tobacco 13,188 13,308 120.0 0.9 0.1
Pharmaceutical and Medical
Goods, Cosmetics
and Toiletries 7,384 8,760 1,376 18.6 1.0
Textiles, clothing, footwear
& leather goods 30,067 32,643 2,576 8.6 1.9
Household furniture,
Appliances & equipment 8,735 10,098 1,363 15.6 1.0
Hardware, paint & glass 8,012 8,253 241 3.0 0.2
All other retailers 17,121 18,303 1,182 6.9 0.9
Total 135,780 146,177 10,397 7.70 7.7
Source, Stats SA, January 2011
stAccording to the Business Monitor International Index (BMI) SA's, 1 quarter 2011 Retail Report forecasts that
the country's retail sales will surge from an expected R603.2 billion in 2011 to R896.7 billion by 2015. This
growth is largely attributed to rising disposable incomes, falling unemployment, increasing urbanisation and
the emergence of a black middle class. The BMI forecasts an average annual GDP growth of 3.9% between 2011
and 2015. It notes that an expected population increase from 50.2 million in 2011 to an estimated 52.2 million
by 2015 will significantly boost demand in this sector.
In 2010, consumer spending was lifted by foreign visitors to South Africa especially during the FIFA Soccer Wold
Cup games. The retail sector is still benefiting from the games via the secondary transmission mechanism.
However, going forward, the political instability in the Arab region poses a major risk to growth. Oil is a major
input in most production processes and hence its price volatility exerts inflationary pressure which dampens
growth.
thSubdued economic activity was registered in motor vehicle sales in the 4 quarter. Total motor trade sales thincreased by 15.3% in the 4 quarter compared to the same period in 2009. The biggest driver of this growth was
new vehicle sales which grew by 26% during that period. When compared to previous quarter, new vehicles rd thsales actually retreated from R26,610 million in the 3 quarter to R25,130.0 million in the 4 quarter. On the
thother hand, used vehicle sales rose marginally from R16,773 million in previous quarter to R17,204 million in 4
quarter (Table 16).
th 4 Quarter-on Annual Contribution
Quarter Quarter to Annual
2010 Annual % Change
Change
th 4
Type of Retailer Quarter % Change
2009
R'mil R'mil
9.2.2 Retail sales outlook
9.3 Motor vehicle sales developments
EZOMNOTHO THE KWAZULU-NATAL QUARTERLY ECONOMIC AND STATISTICAL OVERVIEW
“Building an economy that creates opportunities for all and making tourism to work for us all”

Table 16: Contribution by activity type to change in motor trade sales
New vehicle sales 19,943 25,130 26
Used vehicle sales 15,003 17,204 14.7
Workshop income 6,129 7,182 17.2
Income from fuel sales 20,065 22,999 14.6
Income from Convenience store sales 4,968 5,052 1.7
Total 80,849 93,190 15.30
Source: Stats SA, December 2010
Other key drivers of growth in this sector include fuel sales, workshop income, accessory sales and income from rdsales from conveniences stores. Notably income from fuel sale rose from R21,181 million in 3 quarter to
thR22,999 million in the 4 quarter. Growth in the fuel sales translates to a 14.6% change between the two
periods. Though the sales from convenience stores were a significant driver of sales in the sector, their annual
percentage change was 1.7% for the same period.
Figure 25 demonstrates that the year on year percentage change in new and used vehicles in 2010. Volatility is
quite high in the new vehicles sector. This may be attributed to the after effects of the financial crisis. The car
industry is more sensitive to swings in the business cycle. During 2010, the used vehicle market was constrained
with the peak levels 20% being registered in August vis-à-vis the new vehicles market which doubled peaked at
about 60% in April and in August in the same year.
Figure 25: New and used vehicle sales in 2010 (year on year % change)
Source: Stats SA, December 2010
Better economic conditions in favour of renewed consumer demand and a friendlier business environment may
be proxied by the decrease in the number of civil summons issued for debt. A drop of 5.5% was recorded thbetween 2009 and 2010. On an annualised quarterly-basis, the 4 quarter registered a 14.7% decline compared
to the same period in 2009 (Table 17). The percentage change for civil judgments recorded for debt eased to
8.9% in 2010 from the preceding year. The value of civil judgements recorded for debt was down by 18.2% from
December 2009 to December 2010. This decline meant that there was renewed economic activity in the
economy hence individuals and the corporate sector could borrow and default less on their debt obligations.
Type of Activity Q4:2009 Q4:2010 Annual
(R' mil) (R' mil) % Change
9.4 Consumer debt developments
39EZOMNOTHO THE KWAZULU-NATAL QUARTERLY ECONOMIC AND STATISTICAL OVERVIEW
70
60
50
40
30
20
10
0
-10
Jan Feb Mar Apr May Jun Jul Aug Sep Oct Nov Dec
New Vehicle Sales Used Vehicle Sales
%
“Building an economy that creates opportunities for all and making tourism to work for us all”

Table 17: Civil cases for debt
Actual Estimates 77,356 -10.9 -14.7 -5.5
Civil summons for debt 37,592 -24.8 -22.5 -7.3
Civil judgements 390.7 -18.2 -23.1 -8.9
Source: Stats SA, December 2010
Table18 shows the number of civil cases recorded according to selected magistrates' office per quarter and rd thannually. On a quarterly basis, the number of civil cases recorded between the 3 and 4 quarters declined in
thmost of the regions shown. During the 4 quarter of 2010, Johannesburg recorded the highest frequency of civil rdcases of about 60,561 compared to 72,158 during the 3 quarter. This constituted about 31.1% of total cases as
rdcompared to 32% during the 3 quarter. This was followed by Pretoria (15.6%), the Durban (11%) and Cape
Peninsula (10.3%). Although the number of civil cases recorded in Durban declined by 6.4%, it is important to rd thnote that its contribution to total cases increased from 10.2% in the 3 quarter to 11% in the 4 quarter.
Pietermaritzburg also recorded a decline of 13.9%. The highest decline was recorded in the Cape Peninsula (-
35.6%). Annually, there was an overall marginal increase of 1.1% in the number of civil cases recorded. Most of
the regions recorded declines except Pietermaritzburg and Bloemfontein where the number of cases recorded
increased by 5.6% and 58.5% respectively (Table 18).
Table 18: Number of civil cases recorded according to selected magistrates' offices
Cape Peninsula 31,300 13.9 20,164 10.3 -35.6 134,632 119,640 -11.1
Port Elizabeth 8,753 3.9 8,078 4.1 -7.7 43,416 37,136 -14.5
East London 3,329 1.5 2,950 1.5 -11.4 18,080 15,823 -12.5
Kimberley 1,136 0.5 917 0.5 -19.3 8,026 5,246 -34.6
Pietermaritzburg 5,553 2.5 4,780 2.6 -13.9 21,618 22,836 5.6
Durban 22,914 10.2 21,443 11.0 -6.4 91,171 90,782 -0.4
Johannesburg 72,158 32.0 60,561 31.1 -16.1 260,137 256,134 -1.5
East Rand 14,235 6.3 11,460 5.9 -19.5 54,501 54,499 0.0
West Rand 9,049 4.0 7,753 4.0 -14.3 38,110 33,988 -10.8
Pretoria 34,172 15.2 30,328 15.6 -11.2 152,361 138,594 -9.0
Vereeniging 4156 1.8 3,247 1.7 -21.9 24,302 17,129 -29.5
Bloemfontein 18435 8.2 12,577 6.5 -31.8 40,531` 64,259 58.5
Total 225190 100.0 184,258 100.0 -13.4 846,354 856,066 1.1
Source: Authors calculations based on Stats SA civil cases report
This broad based decline in the number of civil cases on debt is encouraging given that recently the trend was
displeasing. This trend provides us with anecdotal evidence that South African consumers are gradually
emerging from the debt. The number of civil debt cases is still extremely high compared to the pre-recession
period and this indicates that South African consumers continue to be heavily indebted and exposed to high
incidence of financial vulnerability. This occurs despite the decline in interest rate during the past two years and
the continued improvement in consumer inflation. High consumer indebtedness remains a threat to consumer
Dec ' 10 % Change % Change % Annual
Regions Dec '09 & Q4:2009 Change
Dec '10 -Q4:2010 2009 & 2010
rd th3 Quarter 4 Quarter 2009 2010 Yearly
Regions Number Contri- Number Contribution Quarterly change
of bution of (%) change (%)
Civil Cases (%) civil cases (%)
9.4.1 Regional debt developments
EZOMNOTHO THE KWAZULU-NATAL QUARTERLY ECONOMIC AND STATISTICAL OVERVIEW40
“Building an economy that creates opportunities for all and making tourism to work for us all”

41
confidence, a major engine for economy recovery. According to Standard Bank, the household debt reduction
process is likely to remain slow this year, given the countervailing force of a weak labour market.
South African consumers have enjoyed declining interest rates during the past few years as a result of
continued cuts in the repo rate by the Reserve Bank since December 2008. The repo rate declined from 12% in
December 2008 to the current 5.5% effected in November 2010. The decline in the interest rate augurs well for
consumers who have struggled to service their debt obligations in the midst of the global economic recession.
The continued decline in the number of civil summonses, civil judgements and the value of civil judgements thfor debt recorded during the 4 quarter and between 2009 and 2010 bears testimony that the current interest
rate environment bodes well for the generality of consumers in South Africa.
According to Stats SA, the total number of liquidations for 2010 decreased by 3.4% (from 4,133 to 3,992)
compared with 2009. A year-on-year decrease of 14.9% (from 382 to 325) was recorded for December 2010.
The 3.4% decrease in the total number of liquidations for 2010 was due to decreases of 3.7% in compulsory
liquidations (from 295 to 284) and 3.4% in voluntary liquidations (from 3,838 to 3,708). Close corporation
liquidations decreased by 8.5% (from 2,244 to 2,053) while company liquidations increased by 2.6% (from
1,889 to 1,939). The highest numbers of liquidations in 2010 were related to businesses in the financing,
insurance, real estate and business services industry (1,753 cases or 43.9% of liquidations) and the wholesale.
The decline in the number of liquidations in 2010 compared to 2009 is encouraging. However, on a month-by-
month basis, the number of companies liquidating is still high as compared to the pre-recession period (Figure
26). Figure 26 shows the number of liquidations per month between 2008 and 2010.
Figure 26: South African number of liquidations (2008-2010)
Source: Stats SA, December 2010
International tourism suffered major setbacks emanating from the global economic crisis. In 2010, the global
tourism sector has shown signs of recovery according to Advance Release of the UNWTO World Tourism
Barometer 2010. Air traffic disruptions from the euro zone volcanic eruption and extreme weather conditions
9.5 Liquidations and insolvency
9.6 Tourism developments
9
9.6.1 International tourism developments
EZOMNOTHO THE KWAZULU-NATAL QUARTERLY ECONOMIC AND STATISTICAL OVERVIEW
600
500
400
300
200
100
0
Jan’2008
May’2008
Jul’2
008
Mar’2008
Sep’2008
Nov’2008
Jan’2009
Mar’2009
May’2009
Jul’2
009
Sep’2009
Nov’2009
Jan’2010
Mar’2010
May’2010
Jul’2
010
Sep’2010
Nov’2010
“Building an economy that creates opportunities for all and making tourism to work for us all”
9. Figures for December 2010 were not available at the time of printing

42
in the western regions were amongst the major contributing factors to a sluggish recovery of the industry in
2010. Lacklustre global consumer growth also contributed to sluggish recovery in international tourists.
Emerging economies (especially BRIC economies) continued to dominate the recovery in international
tourism, enhanced by improved economic activity in their economies with a 8% growth while advanced
economies posted a 5% growth. Asia recorded a strongest growth of 13% with 204 million international tourist
arrivals from 181 million in 2009 and were the first region to recover from the recession. Africa was the only
region that posted positive figures in 2009 because it was partly shielded from the global crisis and in 2010 a 6%
(49 million) growth was recorded at the back of the 2010 FIFA World Cup in South Africa. Middle East recorded
14 % growth following Asia, and the ailing Europe recorded a slow growth of 3% (471 million) due to air traffic
disruption and economic uncertainty. The US tourism industry was disrupted by the N1H1 influenza outbreak
but rebounded in 2010 with 8% (151 million) growth. The international tourism for 2010 sustained growth
emanated from improved economic recovery in many economies and world events i.e. FIFA World cup 2010,
Winter Olympics in Canada, Shanghai Expo in China and Commonwealth Games in India. UNWTO forecast
international tourist arrivals to grow by 4% to 5% in 2011. Emerging economies will continue to be at the helm
due to exhausted economies from their counterparts.
South Africa's tourism industry is one of the fastest growing and considered a key sector by government in
boosting economic growth and generating employment. The tourism industry benefitted tremendously from
the government infrastructural development programmes in preparation of the FIFA World Cup 2010. Airport
modernization, purchasing of new fuel efficient airbus fleet, development of hospitality sector, and stadia
construction were some of the major tourism related 2010 World Cup infrastructural projects.
The 2010 FIFA World Cup boosted the country's world confidence in tourism sector and 309,544 tourists visited
the country for the event, of which 38% were from Africa. Foreign tourists spent about R4 billion in South Africa
during 2010 soccer World Cup, according to estimates reported by Finance Minister, Pravin Gordhan. Exchange
rate appreciation of SA's currency against major currencies i.e. US dollar and the Euro constrained the industry
earnings.
Statistics SA December 2010 Report on Tourism and Immigration, reported that the routine data collected by
the Department of Home Affairs' (DHA) immigration officers at the ports of entry into South Africa showed that
a total of 3,502,670 travellers (arrivals and departures) passed through South African ports of entry in December
2010 (Table 19). They were made up of 1,305,568 South African residents and 2,197,102 foreign travellers.
South African residents arrivals increased by 23.3% from 450,320 in December 2009 to 555,061 in December
2010 and foreign arrivals increased by 19.7% from 940,836 in December 2009 to 1,126,332 in December 2010.
Road transport was the most common mode of travel used by 75.6% of travellers and 24.3% used air transport.
Most of our tourists in December 2010 came from the UK followed by Germany, in the SADC region Zimbabwe
dominates followed by Lesotho and Mozambique and in other African countries Nigeria is leading followed by
Kenya. Most of SA's tourists in December 2010 visited for holiday purposes; Europe (97.0%), Australia (97.2%),
Middle East (95.8%), Asia (86.9%). in December 2010, male tourist made up 54.1% of total tourists and female
made up 45.7%. The age distribution of tourists recorded that 86.7% of tourists were aged between 15 and 64
years overseas.
10
9.6.2 South African Tourism Developments
EZOMNOTHO THE KWAZULU-NATAL QUARTERLY ECONOMIC AND STATISTICAL OVERVIEW
“Building an economy that creates opportunities for all and making tourism to work for us all”
10. Brazil, Russia, India and China

43
Table 19: Number of SA residents and foreign travellers by mode of travellers
S A residents 1,022,544 817,858 1,305,568 27.7 59,6
Arrivals 450,320 408,001 555,061 23.3 36.0
Departures 572,224 409,857 750,507 31.2 83.1
Foreign Travellers 1,788,055 1,868,505 2,197,102 22.9 17.6
Arrivals 940,836 1,003,953 1,126,332 19.7 12.2
Department 847,219 864,552 1,070,770 26.4 23.9
Source: Stats SA, February 2011
thTotal income from the tourism accommodation sector improved marginally in the 4 quarter. It rose by 8% rd thquarter-on–quarter (q/q) from R1,604.97 in the 3 quarter to R1,741.23 million in the 4 quarter (Table 20). This
was an improved performance compared to the 7% (q/q) decline in the previous period. According to Stats SA,
on an annual basis, total income for the accommodation sector in December 2010 declined by 0.2% compared
with December 2009. The occupancy rate during the period under review averaged around 46% thus
contributing to the improved sector (q/q) performance.
Table 20: Tourist accommodation
Stay Units Available (000) 109.37 109.73 110.03 108.87
Stay Unit Night Sold (000) 1,064.63 1,057.77 1,447.50 1,549.07
Occupancy Rate % 45.70 45.03 42.93 46.37
Income (Accommodation) R'mil 979.10 1,106.53 1,105.53 1,013.97
Income (Restaurant and Bar) R'mil 318.73 297.27 310.07 366.80
Total Income [R'mil] 1,627.73 1,733.07 1,604.97 1,741.23
Source: Stats SA
Figure 27 evinces the trends in total income and occupancy rates for the tourism accommodation sector. A
robust positive correlation exists between total income and the occupancy rates. Compared to 2009, there was thlacklustre performance in this sector in 2010. The number of stay nights for the 4 quarter eased by 5.9% relative
to the same period in 2009. The overall effect of this trend was suppressed profitability in the sector. Between
May and July sharp peaks were observed in the total income trend. This is largely attributed to the 2010 soccer
World Cup.
December November December % change % change
Travel direction 2009 2010 2010 Dec 09 - Nov 10 -
Dec 2010 Dec 2010
Indicator Quarter 1 Quarter 2 Quarter 3 Quarter 4
Total 2,810,599 2,686,363 3,502,670 24.6 30.4
9.6.3 Tourism Accommodation
, February 2011
EZOMNOTHO THE KWAZULU-NATAL QUARTERLY ECONOMIC AND STATISTICAL OVERVIEW
“Building an economy that creates opportunities for all and making tourism to work for us all”

Figure 27: Total income and occupancy rate trends (2010)
Source: Stats SA,
Regular data collected by the Department of Home Affairs at the SA's ports of entry show an increase of 24.6%
increase in the total number of travellers in and out the country (SA residents included) between December th 2009 and December 2010 (Table 21). In the 4 quarter, the largest increase of 30.4% in total travellers
(disregarding the direction) was recorded between November and December 2010.
, February 2011
, February 2011
9.7.4 Tourism Migration
Table 21: SA residents and foreign travellers by direction
Grand Total 2,375,289 2,606,363 3,502,670 0.4 -1.7 30.4 24.6
SA Residents 722,616 817,858 1,305,568 -5.0 -8.8 59.6 27.7
Arrivals 373,807 408,001 555,061 1.2 -12.5 36.0 23.3
Departures 348,809 409,857 750,507 -10.9 -4.9 83.1 31.2
Foreign Travellers 1,652,673 1,868,505 2,197,102 3.3 1.8 17.6 22.9
Arrivals 889,529 1,003,953 1,126,332 4.4 0.03 12.2 19.7
Departures 763,144 864,552 1,070,770 2.0 3.9 23.9 26.4
Source: Stats SA,
2010 % Change
Travel Direction October November December Sept '10- Oct '10- Nov '10 - Dec '09-
Oct '10 Nov '10 Dec '10 Dec '10
44 EZOMNOTHO THE KWAZULU-NATAL QUARTERLY ECONOMIC AND STATISTICAL OVERVIEW
2,300
2,200
2,100
2,000
1,900
1,800
1,700
1,600
1,500
1,400
60
50
40
30
20
10
0
Jan Feb Mar Apr May Jun Jul Aug Sep Oct Nov Dec
Inco
me
R’m
il
Ra
te (
%)
Total Income (R’mil)
Occupancy Rate
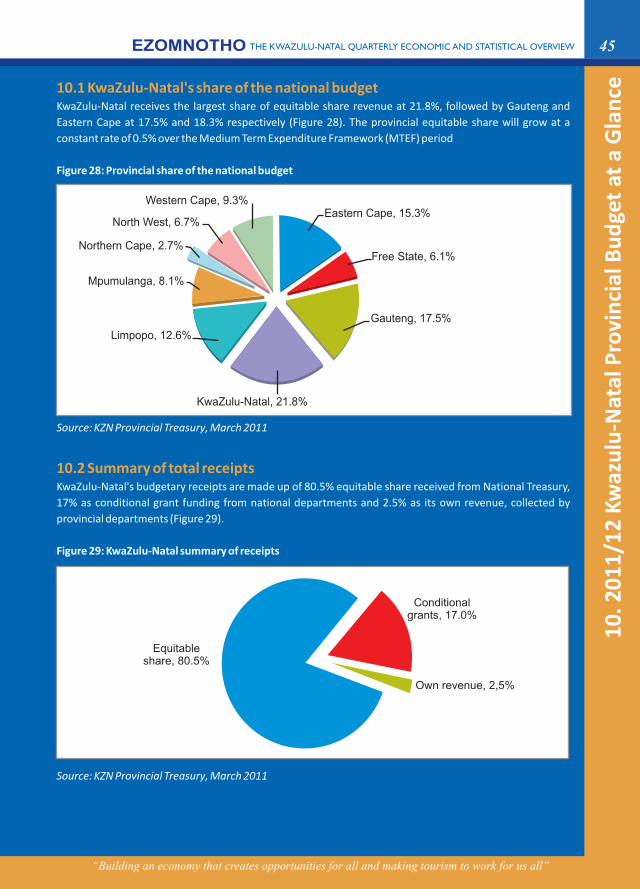
10.1 KwaZulu-Natal's share of the national budget
10.2 Summary of total receipts
KwaZulu-Natal receives the largest share of equitable share revenue at 21.8%, followed by Gauteng and
Eastern Cape at 17.5% and 18.3% respectively (Figure 28). The provincial equitable share will grow at a
constant rate of 0.5% over the Medium Term Expenditure Framework (MTEF) period
Figure 28: Provincial share of the national budget
Source: KZN Provincial Treasury, March 2011
KwaZulu-Natal's budgetary receipts are made up of 80.5% equitable share received from National Treasury,
17% as conditional grant funding from national departments and 2.5% as its own revenue, collected by
provincial departments (Figure 29).
Figure 29: KwaZulu-Natal summary of receipts
Source: KZN Provincial Treasury, March 2011
10
. 20
11
/12
Kw
azu
lu-N
atal
Pro
vin
cial
Bu
dge
t at
a G
lan
ce
45EZOMNOTHO THE KWAZULU-NATAL QUARTERLY ECONOMIC AND STATISTICAL OVERVIEW
Western Cape, 9.3%
North West, 6.7%
Northern Cape, 2.7%
Mpumulanga, 8.1%
Limpopo, 12.6%
KwaZulu-Natal, 21.8%
Gauteng, 17.5%
Free State, 6.1%
Eastern Cape, 15.3%
Equitableshare, 80.5%
Conditional grants, 17.0%
Own revenue, 2,5%
“Building an economy that creates opportunities for all and making tourism to work for us all”

10.3 KZN Budget Summary: Allocation by Department
10.4 Budget Allocation per Department
Figure 30 illustrates the allocation of provincial 2011/12 budget per each Department.
Figure 30: Percentage share of the total budget for 2011/12 Financial Year
Source: KZN Provincial Treasury, March 2011
The total budget for KwaZulu-Natal for 2011/12 is R77.3 billion, allocated as follows:
• R32.6 billion for the Department of Education (42.2% of total budget);
• R24.5 billion for the Department of Health (31.7% of total budget);
• R6.6 billion for the Department of Transport (8.5% of total budget);
• R3.1 billion for the Department of Human Settlement (3.9% of total budget);
• R2.5 billion for the Department of Agriculture, Environmental Affairs and Rural Development (3.2% of total
budget);
• R2 billion for the Department of Social Development (2.5% of total budget);
• R1.5 billion for the Department of Economic Development and Tourism (1.9% of total budget);
• R1.2 billion for the Department of Public Works (1.6% of total budget);
• R1.1 billion for the Department of Co-operative Governance and Traditional Affairs (1.5% of total budget);
• R536,5 million for the Provincial Treasury (0.7% of total budget);
• R471.1 million for the Office of the Premier (0.6% of total budget);
• R358.3 million for the Department of Sports and Recreation (0.5% of total budget);
• R374.7 million for the Provincial Legislature (0.5% of total budget);
• R364.9 million for the Department of Arts and Culture (0.5% of total budget);
• R150.1 million for the Department of Community Safety and Liaison (0.2% of total budget); and
• R55 million for the Royal Household (0.1% of total budget).
46 EZOMNOTHO THE KWAZULU-NATAL QUARTERLY ECONOMIC AND STATISTICAL OVERVIEW
Royal Household
Community Safety and Liaison
Arts and Crafts
Provincial Legislature
Sport and Recreation
Office of the Premier
Provincial Treasury
Co-operative Governance and Traditional Affairs
Public Works
Economic Development and Tourism
Social Development
Agriculture, Environmental Affairs and Rural..
Human Settlements
Transport
Health
Education
“Building an economy that creates opportunities for all and making tourism to work for us all”
0.1%
0.2%
0.5%
0.5%
0.5%
0.6%
0.7%
1.5%
1.6%
1.9%
2.5%
3.2%
3.9%
8.5%
31.7%
42.2%
0.0% 5.0% 10.0% 15.0% 20.0% 25.0% 30.0% 35.0% 40.0% 45.0%

10.5 Summary of infrastructure spending by DepartmentsDespite the current economic climate, infrastructure spending has remained steady, with a projected growth of
20% between 2009/10 and 2012/13.
Table 22: Infrastructure spending by Departments
Source: KZN Provincial Treasury, March 2011
47EZOMNOTHO THE KWAZULU-NATAL QUARTERLY ECONOMIC AND STATISTICAL OVERVIEW
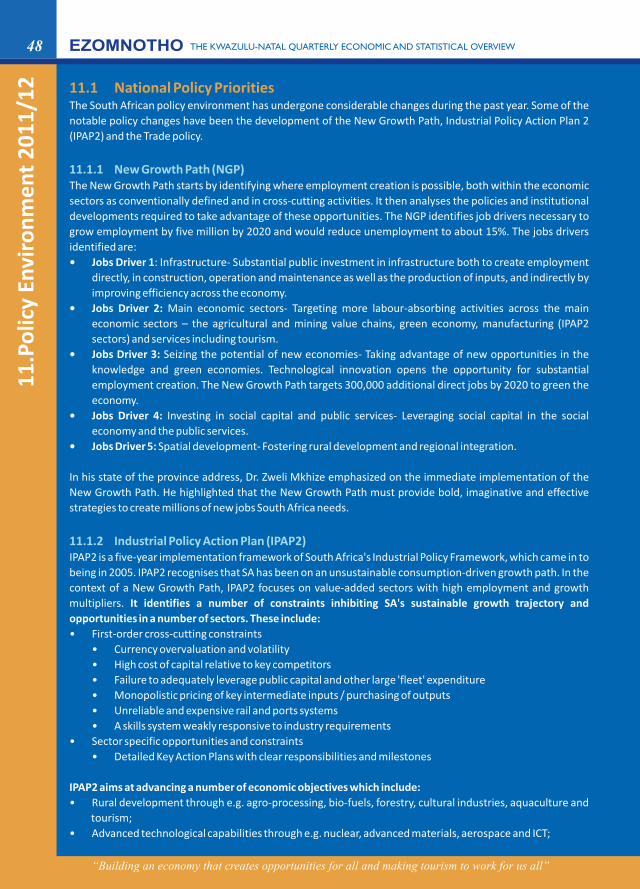
11.1 National Policy PrioritiesThe South African policy environment has undergone considerable changes during the past year. Some of the
notable policy changes have been the development of the New Growth Path, Industrial Policy Action Plan 2
(IPAP2) and the Trade policy.
The New Growth Path starts by identifying where employment creation is possible, both within the economic
sectors as conventionally defined and in cross-cutting activities. It then analyses the policies and institutional
developments required to take advantage of these opportunities. The NGP identifies job drivers necessary to
grow employment by five million by 2020 and would reduce unemployment to about 15%. The jobs drivers
identified are:
• Jobs Driver 1: Infrastructure- Substantial public investment in infrastructure both to create employment
directly, in construction, operation and maintenance as well as the production of inputs, and indirectly by
improving efficiency across the economy.
• Jobs Driver 2: Main economic sectors- Targeting more labour-absorbing activities across the main
economic sectors – the agricultural and mining value chains, green economy, manufacturing (IPAP2
sectors) and services including tourism.
• Jobs Driver 3: Seizing the potential of new economies- Taking advantage of new opportunities in the
knowledge and green economies. Technological innovation opens the opportunity for substantial
employment creation. The New Growth Path targets 300,000 additional direct jobs by 2020 to green the
economy.
• Jobs Driver 4: Investing in social capital and public services- Leveraging social capital in the social
economy and the public services.
• Jobs Driver 5: Spatial development- Fostering rural development and regional integration.
In his state of the province address, Dr. Zweli Mkhize emphasized on the immediate implementation of the
New Growth Path. He highlighted that the New Growth Path must provide bold, imaginative and effective
strategies to create millions of new jobs South Africa needs.
IPAP2 is a five-year implementation framework of South Africa's Industrial Policy Framework, which came in to
being in 2005. IPAP2 recognises that SA has been on an unsustainable consumption-driven growth path. In the
context of a New Growth Path, IPAP2 focuses on value-added sectors with high employment and growth
multipliers. It identifies a number of constraints inhibiting SA's sustainable growth trajectory and
opportunities in a number of sectors. These include:
• First-order cross-cutting constraints
• Currency overvaluation and volatility
• High cost of capital relative to key competitors
• Failure to adequately leverage public capital and other large 'fleet' expenditure
• Monopolistic pricing of key intermediate inputs / purchasing of outputs
• Unreliable and expensive rail and ports systems
• A skills system weakly responsive to industry requirements
• Sector specific opportunities and constraints
• Detailed Key Action Plans with clear responsibilities and milestones
IPAP2 aims at advancing a number of economic objectives which include:
• Rural development through e.g. agro-processing, bio-fuels, forestry, cultural industries, aquaculture and
tourism;
• Advanced technological capabilities through e.g. nuclear, advanced materials, aerospace and ICT;
11.1.1 New Growth Path (NGP)
11.1.2 Industrial Policy Action Plan (IPAP2)
11
.Po
licy
Envi
ron
me
nt
20
11
/12
48 EZOMNOTHO THE KWAZULU-NATAL QUARTERLY ECONOMIC AND STATISTICAL OVERVIEW
“Building an economy that creates opportunities for all and making tourism to work for us all”
• The Green Economy;
• Downstream mineral beneficiation;
• Strengthened linkages between Tourism and Cultural industries;
• Stronger integration between sector strategies and skills development plans;
• Macro-economic stability:
• Improved trade balance
• Increased supply lower inflationary pressures
• Increase in net revenue base
• Diversification of production and risk
• Significant contribution to employment, both direct and indirect
IPA2 proposes a comprehensive and Integrated policy response to scale-up Industrial Policy and the following
policy measures are outlined:
• Stronger coherence between macro- and micro- economic policies in relation to exchange and interest
rates; inflation and trade balance imperatives
• Industrial financing channelled to more labour-intensive and value-adding sectors
• Leveraging procurement to raise domestic production and employment in a range of sectors
• Developmental trade policies such as tariffs and standards deployed in a selective and strategic manner
• Competition policies: competitive input costs for productive investments and affordable goods and
services for poor and working-class households
• Skills, technology and innovation policies better aligned to sectoral priorities
• Deploying these policies in general and in relation to more ambitious sector strategies, as set out in
detailed Cross-cutting and Sector KAPs
Cluster 1: Qualitatively new areas of focus
• Metals fabrication, capital and transport equipment sectors: leverage Capex programme, rebuild and
position as future exporters
• Green and energy saving industries: solar water heating, concentrated solar power, wind power, energy
efficiency
• Agro-processing linked to food security and food pricing imperatives
Cluster 2: Scale up / broaden interventions in existing IPAP sectors
• Automotives, Components, Medium and Heavy Commercial Vehicles: raise economies of scale and
localisation of components
• Downstream Mineral Beneficiation: based on establishing minimum beneficiation levels
• Plastics, Pharmaceuticals and Chemicals: focused on plastics and value-adding pharmaceuticals
• Clothing, Textiles, Footwear, Leather: recapture domestic market share through competitiveness
upgrading and tackling
• Biofuels: establish regulatory framework and support agricultural and refining investment
• Forestry, Paper & Pulp, Furniture: unblock water licences and promote further processing
• Strengthening linkages between Cultural Industries and Tourism
• Business Process Outsourcing: broaden and deepen SA's product offerings
Cluster 3: Sectors to develop long-term advanced capabilities
• Nuclear: leveraging local production and technology transfer
• Advanced Materials: feeding into new growth industries such as aerospace, solar and nuclear
• Aerospace: strengthening integration into supply chains
11.1.2.1 IPAP2 Sector Priorities
49EZOMNOTHO THE KWAZULU-NATAL QUARTERLY ECONOMIC AND STATISTICAL OVERVIEW
“Building an economy that creates opportunities for all and making tourism to work for us all”

11.2 KwaZulu-Natal Economic Policy Reviews and Policy Pronouncements
11.3 2011/12 KwaZulu-Natal Provincial Budget Policy Priorities
To advance sustainable economic growth and improve the efficacy of government initiatives and interventions
in the province a number of strategies have been reviewed. The Economic Sectors and Infrastructure
Development Cluster (ESID) is currently developing and reviewing a number of economic strategies. Some of
these strategies include among others the Human Settlement, Rural development, Airport Strategy, Provincial
Spatial Economic Development Strategy (PSEDS), KwaZulu-Natal Industrial Development Strategy (IDS), Export
and Investment Strategies. In addition the Provincial Planning Commission is also reviewing the Provincial
Development and Growth Strategy (PGDS). The PGDS is expected to provide a developmental vision for KZN and
a collaborative framework to drive implementation of government policy priorities. These policies and
strategies emphasize sustainable economic growth to address the twin economic woes of unemployment and
poverty.
Some of the key policy objectives include the need to finding ways of unlocking the province's export potential
and attraction of investment onto its shores. The development of some of these strategies is a direct response to
the 2009 KwaZulu-Natal job summit which instructed the department to develop strategies to encourage export
development and the attraction of investment into the province. The development and review of these
strategies is critical given the need to embark on a sustainable growth path in terms of job creation, poverty
eradication and bridging the gap between the first and second economies. These provincial policy
developments will ensure that we are aligned with the new national policy directives and priorities of
government.
The Flagship programme is a comprehensive approach by government to address food insecurity; create
healthy and sustainable communities and provide an integrated programme addressing the upliftment of
women and youth. The flagship programme was launched in 2009.The flagship is premised on the fact that that
a successfully implemented programme by government departments focused at the ward level will
systematically contribute to food security, improved health, community development, job creation, poverty
alleviation and strengthening of local institutions through more empowered communities. The flagship
programme is comprised of three core sub-programmes:
• Sub-Programme 1: Food Security and Emerging Farmer Programme
• Sub-Programme 2: Creating Healthy and Sustainable Communities
• Sub-Programme 3: Integrated Programme for Youth and Women
The Flagship programme is thus a proactive programme by the KwaZulu-Natal provincial government aimed at
eradicating poverty through escalating service delivery and harmonizing interventions by provincial
government departments in poverty stricken areas of the province. The 2011 budget emphasized the need to
implement turnaround strategies for each district to reinforce the flagship programme and integrate its
rebranding. The rebranding of the programme is to give it a necessary impetus with a clear call for all to
participate. Turn around strategies will include:
• Framework for mobilizing and managing qualitative impact of corporate social investment initiatives
• De velopment of a system for guiding co-coordinating and monitoring interventions as informed by
household profile exercise
• Strategies for managing the recruited community care workers and youth ambassadors; and
• Partnership with existing field officers and managing their career development programmes.
The budget further states the implementation plan for the turnaround strategy which will include:
• The adoption of the rebranding document for the Flagship programme with all inputs from the Lekgotla;
• The finalization of the turnaround strategies by each HOD for each district incorporating all inputs from
11.3.1 Flagship
50 EZOMNOTHO THE KWAZULU-NATAL QUARTERLY ECONOMIC AND STATISTICAL OVERVIEW
“Building an economy that creates opportunities for all and making tourism to work for us all”

Lekgotla; and
• The re-launch of the rebranded provincial Flagship programme starting at uMgungundlovu followed by all
districts in the sequence as decided upon by the leadership.
The 2011/12 budget proposes an increase in budget allocation to education towards the Provincial 10-point
plan, which is an intervention to support poorly performing schools. The plan is used as a reporting instrument
for the matric improvement plan and the collaborative effort of officials, learners, educators, parents and
communities to improve and support education as government priority number one. To operationalize this
intervention, schools will be closely monitored for their functionality in 2011. A Dinaledi school project has also
been established to improve on Mathematics and Science in 84 schools at high school level. The Department of
Education (DOE) will also be undergoing annual national assessment to monitor progress in the improvement of
learner attainment in literacy and numeracy for Grades 3, 6 and 9 in 4 087 schools. DOE will also make strides in
strengthening teaching and learning by appointing staff, mostly in deep rural areas which are in need of subject
advisers. In order to deal with the shortage of qualified educators, the department finances the training of 1 000
initial teacher education in institutes and universities.
DOE is in the initial stages of drawing up a Public-Private Partnerships (PPP) to provide new schools, new office
accommodation for districts and circuits in a stride to improve infrastructure. The department will sustain skills
training through FETCs, skills centres, NNCV courses, N1-N6 courses, and short courses to contribute
significantly to the HRD Strategy of the province. Emphasis will be on SETA collaboration and co-operation with
each of the 9 FETCs in KZN.
Over and above the aforementioned, the key strategies for the province in combating the education
predicaments is to ensure that all schools and colleges function optimally and smoothly with principals and
SMTs in place and all schools and colleges enjoy 100% delivery of LTSM in 6 322 schools.
The KZN Department of Health strives for optimal health for all persons in the province and aim to develop and
deliver a sustainable, co-ordinated, integrated and comprehensive health system at all levels of care based on
the primary health care approach. Health remains one of the top key priorities of the province with the main
focus being:
• Increasing Life Expectancy;
• Decreasing Maternal and Child Mortality;
• Combating HIV and AIDS and decreasing the burden of diseases from Tuberculosis; and
• Strengthening the health system effectiveness.
Key strategies proposed in the 2011/12 budget include:
• Overhaul Provincial Health Services;
• Improve the efficiency and quality of health services;
• Reduce morbidity and mortality due to communicable diseases and non-communicable conditions and
illnesses;
• Strengthening inter-sector collaboration.
Activities that have been put in place to achieve the abovementioned strategies are:
• improving clinic governance;
• responding quickly and appropriately to the burden of diseases and consequent health needs;
• strengthening HIV/TB integration;
• maintaining preventative strategies for malaria control;
11.3.2 Education
11.3.3 Health
51EZOMNOTHO THE KWAZULU-NATAL QUARTERLY ECONOMIC AND STATISTICAL OVERVIEW
“Building an economy that creates opportunities for all and making tourism to work for us all”

• prevention of illness and promotion of health;
•
• strengthening mental health disability and rehabilitative care and address substance abuse and violence;
• engaging in behavioral change campaigns for staff and communities;
• improve the referral and transport by introducing dedicated or specialized ambulances for maternity and
pediatric care;
• improving staff competency and skills and improving quality of clinical care;
• establishing waiting mothers lodge in all districts and strengthening mortality reviews at hospitals.
Agrarian reform is a rural development strategy to stimulate agricultural production with a view to contributing
towards food security. The government aims to support the provision of agricultural equipment and inputs to
support emerging farmers and households nationally. Crucial to the effort of achieving food security are a
number of stepwise interventions that move from protecting natural agricultural assets through Land Care
projects, household and small farmer support (Mechanization, inputs and infrastructure), Land reform post-
settlement support, extension improvement, and finally research support to improve commercial farming
enterprises.
The national government has budgeted R9 billion to finance new job creation initiatives. The Premier, Dr Zweli
Mkhize, in his state of the province address mentioned that Infrastructure will play a vital role in creating
employment in the Province through various projects such as roads, schools and health facilities among others.
There are already existing projects of this nature which are labour intensive to create jobs. Zibambele is one of
them and has employed 40,000 contractors and 50,000 others through the Expanded Public Works Programme
(EPWP). For 2011 large contracts that are due to start are the Cornubia (50,000 units), Vulindlela rural housing
(25,000 units), Driefontein (15,000 units) Nyoni (2,700 units). These are multi-year projects which together with
the rectification projects and the repair of fully or partially destroyed homes damaged by disasters will create
47,000 job opportunities and 15,000 permanent jobs.
Fighting crime remains a focal point of the South African government. The government continues to put in place
measures to curb crime and its impact on the economy. Recent statistics by the National Minister of Police show
that cash in transit heist and ATM bombings in KwaZulu-Natal decreased by 11% in 2010. The national budget
tabled by Minister of Finance, Pravin Gordhan, provides R2.1 billion towards police personnel. This will increase
the number of police personnel to 202,260 in 2013/2014, from about 190,000 at present. In his state of the
Province address, Premier Dr. Zweli Mkhize reaffirmed government's commitment to fight crime. The Premier
emphasized the need for KwaZulu-Natal to reverse its history of unbridled violence and mayhem.
accelerate implementation of the integrated school health and promoting schools program;
and
11.3.4 Agrarian reform
11.3.5 Government intervention in creating decent employment
11.3.6 Fighting crime
52 EZOMNOTHO THE KWAZULU-NATAL QUARTERLY ECONOMIC AND STATISTICAL OVERVIEW
1. Brazilian Statistical Office, Data releases, March 20112. Creamer Media. 2011. Research Channel. Industrial projects in progress: KwaZulu-Natal.
Johannesburg, South Africa. www.researchchannel.co.za 3. European Commission, Eurostat, http://epp.eurostat.ec.europa.eu 4. fdimarkets.com. 2009. 5. Financial Times Ltd. 2010. Foreign Direct Investment [FDI] Intelligence, November. London, United
Kingdom. Website: www.fdimarkets.com 6. Financial Times Ltd. 2011. Foreign Direct Investment [FDI] Intelligence, November. London, United
Kingdom. Website: www.fdimarkets.com 7. Financial Times, 2010. FDI markets (CSID), Accessed: August 7-16, 2010.8. Graham, Benjamin, and David Dodd (1951), Security Analysis. McGraw-Hill Book Company. ISBILLION
0071448209.9. http://www.wto.org/english/res_e/statis_e/its2009_e/its09_merch_trade_product_e.htm10. International Monetary Fund (IMF), World Economic Outlook, July 200711. Kwazulunatalbusiness. 2009. Major projects in KwaZulu-Natal. url:
http://www.kwazulunatalbusiness.co.za/special-features/241408.htm. Accessed: November 23, 2009.
12. Luiz, J. and H. Charalambous. 2009. Factors influencing foreign direct investment of South African financial services firms in Sub-Saharan Africa. International Business Review, Vol 18, No.3. pp 305-317.
13. Moody Reports, March 2011 nd14. National Association of Automobile Manufactures of South Africa (NAAMSA), 2 Quarter New
Vehicle Sales Report, 201015. Organization for Economic Cooperation and Development [OECD]. 2009. OECD Economic Outlook
No. 86, November 2009. Paris, France.16. Quantec Research. 2010. EasyData (CSID). Accessed: August 7-16, 2010.17. Quantec. 2009. RSA regional indicators. Pretoria.
http://quanis1.easydata.co.za/ReportFolders/ReportFolders.aspx?CS_ChosenLang=en18. Quantec. 2010. South Africa: provincial trade statistics. Johannesburg, South Africa. Website:
www.quantec.co.za rd19. South African Reserve Bank, 3 Quarter Economic Bulletin, 2010
20. South African Reserve Bank [SARB]. 2011. Online statistical queries: gross fixed capital formation. Pretoria, South Africa. Website: www.resbank.co.za
21. South African Reserve Bank. 2009. Quarterly bulletin, September 2009. Pretoria, South Africa.22. South African Revenue Services [SARS]. 2010. Monthly trade data, September. Pretoria, South Africa.
Website: www.sars.co.za 23. South African Revenue Services [SARS]. 2010. Monthly trade data, various. Pretoria, South Africa.
Website: www.sars.co.za 24. South African Revenue Services [SARS]. 2011. Monthly trade data, January. Pretoria, South Africa.
Website: www.sars.co.za25. South African Revenue Services [SARS]. Preliminary trade statistics: RSA progressive Jan-Jun 2009 /
Jan-Jun 2010. http://www.sars.co.za/uploads/documents/60968_4.3SAcumulative.pdf. Accessed: August 16, 2010.
26. Standard Bank Economic Bulletins.27. Statistics South Africa, Data Publications, 201028. Steven M. Sheffrin (2003). Economics: Principles in action. Upper Saddle River, New Jersey 07458:
Pearson Prentice Hall. pp. 271. ISBILLION 0-13-063085-3. 29. The Trading Economics, http://www.tradingeconomics.com/ 30. United Nations Conference on Trade and Development [UNCTAD]. 2009. World Investment Report.
www.unctad.org31. United Nations Conference on Trade and Development [UNCTAD]. 2010. World investment report
2010. Geneva, Switzerland. 32. World Trade Organisation [WTO]. 2009. International trade statistics 2009. WTO, Geneva.33. Zhan, J. J. 2006. FDI statistics: a critical review and policy implications. WAIPA, Geneva.
12
. Ref
ere
nce
s
53EZOMNOTHO THE KWAZULU-NATAL QUARTERLY ECONOMIC AND STATISTICAL OVERVIEW
“Building an economy that creates opportunities for all and making tourism to work for us all”

Provincial TreasuryPROVINCE OF KWAZULU-NATAL
Phone: 033 264 2500 • Email: info@Website: http://www.kznded.gov.za
kznded.gov.za
In Collaboration with
Department of EconomicDevelopment and TourismUmnyango Wezokuthu thukiswa
Komnotho Nezokuvakasha
KWAZULU-NATAL PROVINCIAL GOVERNMENT