5 - 1 chapter 5: spreadsheet engineering management science: the art of modeling with spreadsheets,...
TRANSCRIPT

5 - 1
5 - 1
Chapter 5: Spreadsheet Engineering
Management Science: The Art of Modeling with Spreadsheets, 3e
S.G. Powell
K.R. Baker
© John Wiley and Sons, Inc.
Power Point Slides Revised By: Tony Ratcliffe, James Madison University

Spreadsheet Engineering5 - 2
Builders use blueprints or plans. Without plans structures will fail to be effective.
Advanced planning in any sort of design can speed up implementation.
Spreadsheets are no different from other arenas of design. Engineering and advanced planning aids
effectiveness.

Spreadsheet Design5 - 3
An efficient process minimizes time spent.An effective process yields results that meet
users’ requirements.Good design helps analysts spend the
majority of their effort improving decisions, rather than building and fixing models.

The Phases of Spreadsheet Modeling5 - 4
DesigningBuilding Testing
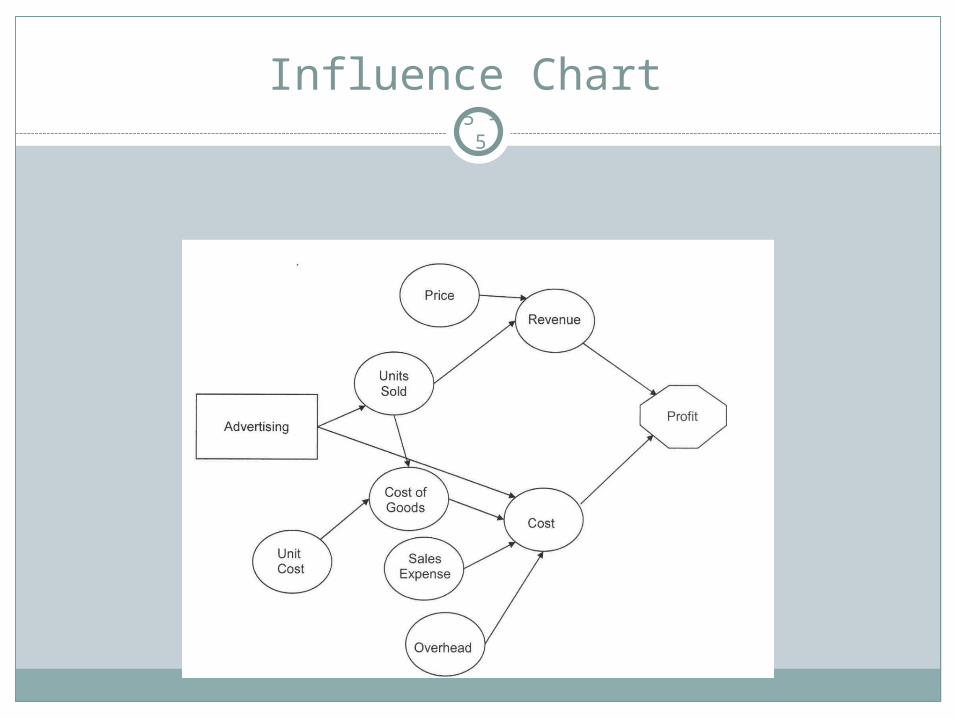
Influence Chart 5 - 5

Designing a Spreadsheet5 - 6
PlanModularizeStart smallParameterizeDesign for useKeep it simpleDesign for communicationDocument important data and formulas
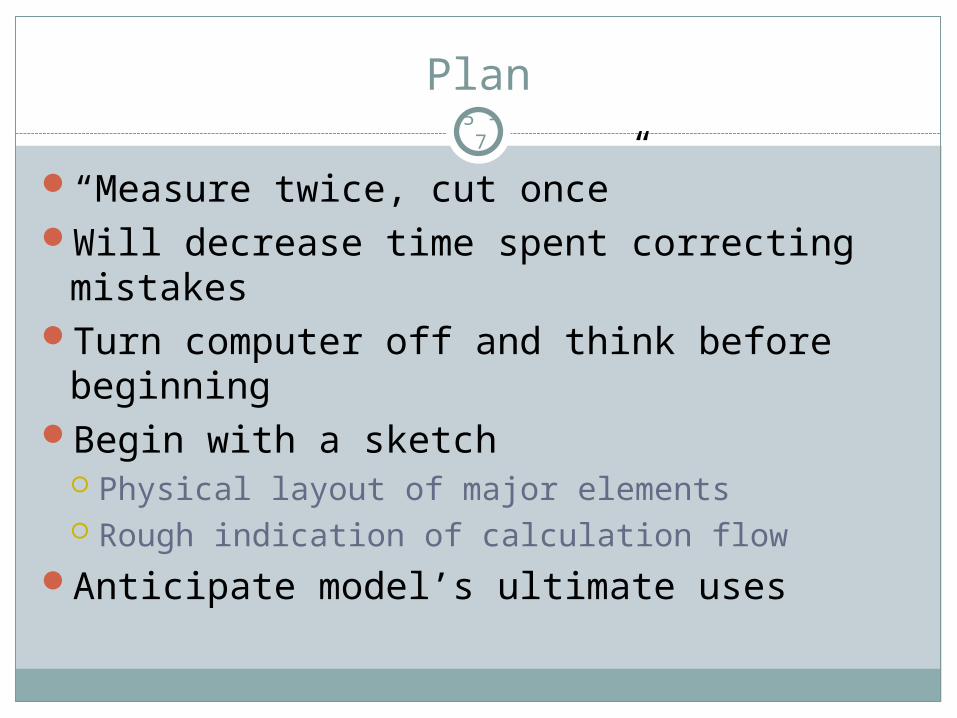
Plan5 - 7
“Measure twice, cut once”Will decrease time spent correcting
mistakesTurn computer off and think before
beginningBegin with a sketch
Physical layout of major elements Rough indication of calculation flow
Anticipate model’s ultimate uses
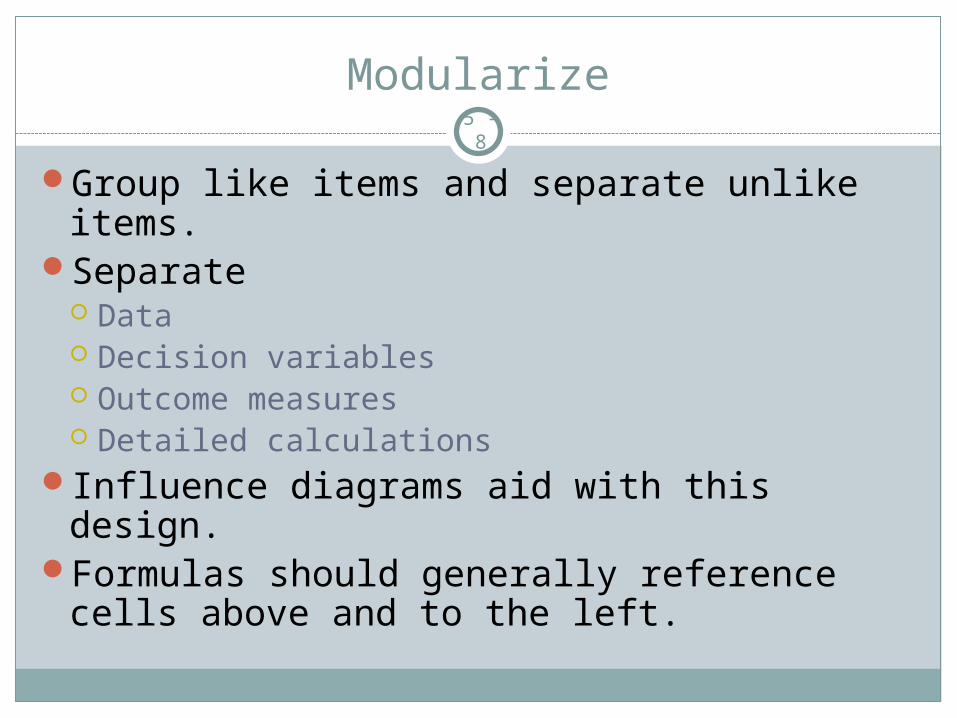
Modularize5 - 8
Group like items and separate unlike items.Separate
Data Decision variables Outcome measures Detailed calculations
Influence diagrams aid with this design.Formulas should generally reference cells
above and to the left.

Start Small5 - 9
Sketch full design but do not build all at once.
Isolate one module then build and test that module.
Local mistakes are much easier to detect than when they are part of the global model.

Parameterize5 - 10
Place parameters in a single location away from calculations.
Formulas should only contain cell references, not numerical values.
Assists in: Identifying parameters Sensitivity analysis Documentation

Design for Use5 - 11
Anticipate who will use spreadsheet What type of questions will be asked?
Make it easy to change common parameters.
Make it easy to find key outputs. Group in one place
Include graphs of outputs.Record numerical values of base case
outputs.

Keep It Simple5 - 12
Complex spreadsheets: Require more time and effort to build Are much more difficult to debug
Keep formulas short. Decompose complex calculations into intermediate
steps.

Design for Communication5 - 13
Spreadsheets’ lives are often longer than expected.
Use visual cues that reinforce model’s logic Use informative labels Use blank spaces Use outlines, color, bold fonts, as appropriate
Split windows can aid in viewing.

Document Important Data and Formulas
5 - 14
Record source for important parameters.
Explain important formulas.Use Cell Comments to describe cell contents.
Consider a separate module to list assumptions.

Cell Comments5 - 15
Insert Cell Comment – Review►Comments►New Comment
Different display options Comment & indicator – permanently display
comment Indicator – red triangle indicates comment,
display when cursor in cell None – neither comment nor indicator visible

Workbook Design5 - 16
Use separate sheets to group similar kinds of information.
Design workbooks for ease of navigation.Protect workbooks from unwanted changes
during use.

Example: Northern Museum Capital Campaign5 - 17

Use Separate Sheets to Group Similar Kinds of Information
5 - 18
Workbooks should be designed to make a model easy to understand and use.
Individual worksheets should each have a well-defined purpose and be given descriptive names.
They should also appear in a natural order. Assumptions, calculations and results
should be placed on separate worksheets whenever possible to allow users to view assumptions and results without being distracted by the details of the calculations.

Guide to Sheets5 - 19
Design Workbooks for Ease of Navigation and Use
5 - 20
Any form of structural help for users is beneficial.
Use revealing names for individual sheets. Double-click on name tab at bottom of spreadsheet to
edit name

Outlining5 - 21

Design a Workbook as a Decision Support System
5 - 22
A decision support system is an integrated information system that provides data, analytics, and reporting capabilities over an extended period of time to multiple users.
Effective decision support systems are designed to present information in a manner that is most useful to decision makers.
Use graphs instead of tables of numbers.

Protect Workbooks From Unwanted Changes During Use
5 - 23
Lock cells not to be changed.Use worksheet protection.Use data validation.

Locking Cells5 - 24
To lock all cells: Select entire worksheet Select Home►Font , choose the Protection tab, and
check the box for LockedTo unlock variable cells:
Select desired cells Select Home►Font and choose the Protection tab,
but this time we uncheck the box for Locked

Example of Locking Cells5 - 25

Protecting Worksheets5 - 26
Review►Changes►Protect SheetAt top of Protect Sheet window check box
for Protect worksheetIf check only Select Unlocked Cells
User will be able to only select and modify unlocked cells.
If check Select Locked and Unlocked Cells User will be able to select any cell but only
modify unlocked cells.

Example of Protecting Worksheet
5 - 27

Data Validation5 - 28
Controls input valuesHighlight cells then click Data►Data Tools
►Data ValidationThree tabs
Settings: Restrict inputs (e.g., range of cell values) Input Message: Create message when cursor on
cell Error Alert: Alert for invalid entry

The Data Validation Window5 - 29

Example: Error alert produced by Data Validation
5 - 30
Building a Workbook5 - 31
Follow a plan.Build one module at a time.Predict the outcome of each formula. Copy and paste formulas carefully.Use relative and absolute addressing to
simplify copying.Use the Function Wizard to ensure correct
syntax.Use range names to make formulas easy to
read.Choose input data to make errors stand out.

Copying and Pasting Formulas5 - 32
Copying (rather than retyping) reduces the potential for typographical errors.
Copying can also be a source of bugs. e.g., wrong range copied

Relative and Absolute Addressing 5 - 33
Necessary for efficient copyingAn address such as B7 is relative.
In cell A6, B7 represents one row down and one column to the right.
If copied, new formula will refer to new cell that is one row down and one column to the right.
An address such as $B$6 is absolute. Cell will not change if formula is copied. Use for parameter values.

Function Wizard5 - 34
The button fx brings up the function wizard.Contains a complete list of all Excel functionsSelecting a function will bring up a window
showing needed inputs. Function value will be shown in window
automatically

Range Names5 - 35
Any cell or range of cells may be named.Name or cell reference may be used in
formulas. Names easier to debug and use
Require extra work to enter and maintainSelect Formulas►Defined Names►Define
Name to assign a name.Pull-down window at top left of
spreadsheet. Shows all named cells for workbook Can be used to enter individual cell names

Testing a Spreadsheet5 - 36
Check that numerical results look plausible.Check that formulas are correct.Test that model performance is plausible.

Check That Numerical Results Look Plausible
5 - 37
Make rough estimates.Check with a calculator.Test extreme cases.

Check That Formulas Are Correct5 - 38
Check visually.Display individual cell references.Display all formulas.Use the Excel Auditing Tools.Use Excel Error Checking.Use error traps.Use auditing software.

Checking Formulas Visually5 - 39
Visually check formulas in each cell.Most effective when range names usedTends to be tedious

Displaying Individual Cell References5 - 40
Press F2 or double-click on cell of interest.Reveals formula with color-coded cell
referencesStronger visual clues than manual checking

Display All Formulas5 - 41
Hold down control key and press tilde key.All formulas are displayedMakes for easier scanningAids in detecting deviations from patternsReverse by repeating Control – Tilde
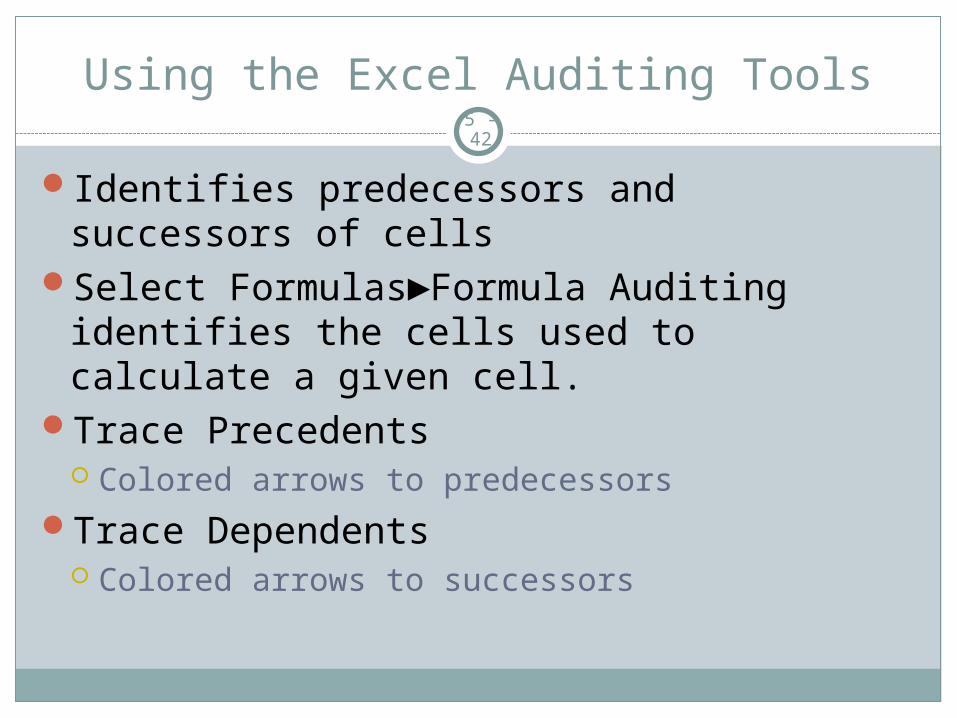
Using the Excel Auditing Tools5 - 42
Identifies predecessors and successors of cells
Select Formulas►Formula Auditing identifies the cells used to calculate a given cell.
Trace Precedents Colored arrows to predecessors
Trace Dependents Colored arrows to successors

Excel Error Checking5 - 43
Managed from the Formulas tab of the Excel Options menu.
Available in Excel 2002 and later versionsEquivalent of grammar checking in word
processingCells with possible errors are flagged with
colored triangle

Errors Checked Under Automatic Error Checking
5 - 44
Cells containing formulas that result in an errorInconsistent calculated column formula in tablesCells containing years represented in 2 digitsNumbers Formatted as text or preceded by an
apostropheFormulas inconsistent with other formulas in the
regionFormulas which omit cells in a regionUnlocked cells containing formulasFormulas referring to empty cellsData entered in a table is invalid

Use Error Traps5 - 45
Error traps are formulas added to a spreadsheet that warn the user of potential errors.
They can check for errors in input data or for errors in formulas.
Any number of error traps can be added to a workbook to improve its safety.
It is important that the results of these error checks be clearly visible to the user.
One way to do this is to create an overall error trap that checks whether any one of the individual traps is true, and returns a warning.

Use Auditing Software5 - 46
A number of Excel add-ins are available for auditing spreadsheets.
These add-ins typically provide a set of tools for detecting errors and displaying model structure graphically.
One such tool is Spreadsheet Professional (www.spreadsheetinnovations.com).

Test That Model Performance Is Plausible
5 - 47
Model should react in a plausible manner to a range of inputs
The user should be content with trends in output based on varying inputs.
Sensitivity testing (Chapter 6) is an important tool to test plausibility.

Summary5 - 48
Spreadsheets deserve careful engineering. Most spreadsheets contain errors. Users are over confident about their models.
Rules for spreadsheet modeling: Designing a spreadsheet Designing a workbook Building a workbook Testing a workbook

5 - 49
Copyright 2011 John Wiley & Sons, Inc.
All rights reserved. Reproduction or translation of this work beyond that permitted in section 117 of the 1976 United States Copyright Act without express permission of the copyright owner is unlawful. Request for further information should be addressed to the Permissions Department, John Wiley & Sons, Inc. The purchaser may make back-up copies for his/her own use only and not for distribution or resale. The Publisher assumes no responsibility for errors, omissions, or damages caused by the use of these programs or from the use of the information herein.