5. environmental and social baseline … · 5. environmental and social baseline conditions ......
TRANSCRIPT
Qatalum EIA Report
Contract No: QA-S1-NHT-B44-5279586 Doc Ref: QA-00-ATK-F15-00001-FINAL
5035013/01-01/EIA 4Dec06 rev02.doc 5-1
5. ENVIRONMENTAL AND SOCIAL BASELINE CONDITIONS
5.1 INTRODUCTION
5.1.1 This Chapter of the EIA report aims to describe the existing (baseline) social and
environmental conditions at and around the proposed Qatalum Project site. The
geographical setting for the project has already been described in Section 3.3 of this report
(also see Figure 1.1), this Chapter contains the following Sections:
• Physical Environment;
• Physical Oceanography;
• Meteorology and Climate;
• Air Quality;
• Terrestrial Ecology and Birds;
• Marine Ecology;
• Noise;
• Waste Management and Disposal; and
• Socio Economic Context:
5.1.2 A number of Appendices have been produced to support the information provided herein
and to provide further details of the baseline environment surveys that have been
undertaken as part of the Qatalum Project; these are:
• Appendix B – Baseline Soil and Groundwater Investigation;
• Appendix C – Marine Survey: Original Port Concept;
• Appendix D – Ambient Air Quality;
• Appendix E – Baseline Terrestrial Ecology and Birds;
• Appendix F – Noise Survey and Assessment; and
• Appendix G – Social Impact Assessment Report.
5.1.3 The baseline data collected will be used in conjunction with the assessment
methodologies described in Chapter 6 to:
• identify the presence of sensitive receptors;
• assist with determining the significance of the potential environmental and social
impacts associated with the Project;
• determine where specific further mitigation, control and management techniques
are required; and
• identify where compensatory measures (e.g. habitat reinstatement) are required.
5.2 GENERAL METHODOLOGY
5.2.1 The information required for the baseline section of the full EIA has been obtained from a
number of sources, the main ones being:
Qatalum EIA Report
Contract No: QA-S1-NHT-B44-5279586 Doc Ref: QA-00-ATK-F15-00001-FINAL
5035013/01-01/EIA 4Dec06 rev02.doc 5-2
• consultation and data gathering exercises in Qatar/the Middle East;
• desk-top surveys and literature reviews;
• existing information sources and data purchase;
• field surveys;
• underwater video footage; and
• data from the Project Proponents.
5.2.2 Where applicable, the methods for obtaining data and for characterising baseline
conditions have:
• used internationally accepted techniques;
• been undertaken in accordance with The Environmental Impact Assessment
Policy and Procedure for the State of Qatar;
• been carried out with reference to any relevant sections of the World Bank PPAH6
and the IFC safeguard policies for environmental and social issues.
5.2.3 Consultation and data gathering exercises have involved a number of sources, including
personnel from: the MIC Authority, SCENR, QP, government departments/ministries,
various NGOs and local interest groups. These are discussed in more detail in the relevant
Sections below.
5.2.4 As a result of previous involvement with EIA and related projects at Mesaieed; Atkins,
Hydro and QP already hold some of the data required to characterise the baseline
environment. Data purchase has included one year of the MIC Authority’s air quality
monitoring data and the 2004 SARC report33
. Desk-top surveys and literature reviews
have included internet and library searches, as well as reference to previous EIA reports
that have been produced for projects in MIC. A list of references is presented in Chapter 1
of this document and some of the key information sources are listed below:
• Ecological Survey of the Marine and Coastal Environment of Mesaieed Industrial
City, undertaken by Scientific and Applied Research Centre (SARC), 200433
;
• Gabbro Berth Expansion at Mesaieed Port EIA report2, produced by COWI, 2005.;
• Consultancy Services for Environmental Studies of Proposed Dredging Works
Port Mesaieed, Qatar and subsequent environmental monitoring study reports for
Dragomar International A.G34
,35
in 2001;
• Crushed Stone Import Facility, Mesaieed Port Environmental Impact Assessment
report, produced for QP by Halcrow in 200136
;
• New Midrex DRI Plant for QASCO, Mesaieed: Detailed Environmental Impact
Assessment, report for Midrex Technologies Inc.37
;
• Geotechnical Site Investigation Report for the Qatalum Site;38
and
• Air quality data for 2005 from QP’s monitoring station at the MIC Authority’s
offices.
5.2.5 Field surveys have been carried out to supplement the above data sources and for
environmental/social conditions that require site specific information. The following surveys
have been undertaken as part of the EIA process:
Qatalum EIA Report
Contract No: QA-S1-NHT-B44-5279586 Doc Ref: QA-00-ATK-F15-00001-FINAL
5035013/01-01/EIA 4Dec06 rev02.doc 5-3
• air quality;
• noise;
• soil and groundwater;
• seawater and sediment quality;
• marine biology and ecology;
• terrestrial ecology; and
• bird survey.
5.2.6 The scope and methods for the proposed field surveys are discussed further below and in
the relevant Appendices. The remainder of this Chapter aims to characterise the baseline
environment at and around the proposed Qatalum Site.
5.3 PHYSICAL ENVIRONMENT
Landscape and Topography
5.3.1 Qatar is a peninsula, about 180 km long and 85 km wide, covering an area of
approximately 11,500 km2. It is surrounded on three sides by the waters of the Arabian
Gulf and is directly connected by land, in the south, to Saudi Arabia. The landscape
consists primarily of plains, desert, and wadis. Rocky hills and sand dunes are mostly
found in the southern areas of the country; saline mud flats are common along the coast.
As around 82% of Qatar is desert, most settlements are located along the better-watered
coast. Within Qatar, Mesaieed occupies a flat near-featureless plain with little or no
vegetation. The Qatalum Site is generally slightly undulating, low lying, and sandy scrub
land. However, an area of vegetation (reedbed and grassland) runs through the central
northern and western part of the site area. The vegetation is associated with the outflow of
treated effluent from the neighbouring sewage treatment plant, located to the north of the
site, and is discussed further in Section 5.7.
5.3.2 Qatar is generally flat with a few prominent hills; land elevation ranges are generally
between 6-100 m above sea level. The topography of the Qatalum Site is generally low-
lying and partly flooded by seawater. Site elevation varies from approximately –2 m in the
eastern areas to approximately +1.5 m in the western areas (relative to Qatar National
Height Datum (QNHD)viii
).
viii
QNHD is 1.3 m above Chart Datum
Qatalum EIA Report
Contract No: QA-S1-NHT-B44-5279586 Doc Ref: QA-00-ATK-F15-00001-FINAL
5035013/01-01/EIA 4Dec06 rev02.doc 5-4
Land Use
5.3.3 MIC occupies an area of around 117 km2; it is predominantly an industrial township with
an Industrial Area (~43 km2), including port facilities, and a small community. The
commercial and residential areas (the Community Area) are located in the north of MIC, as
indicated previously (see Figure 1.1). The nearest residents are 3 km to the north west of
the Qatalum Site. A Master Plan for the Community Area has been prepared and consists
of the full range of housing, retail, leisure, recreation, health, education and other
community facilities necessary to sustain a large scale industrial area. It is understood that
this Master Plan anticipates the MIC development requirements until 2028.
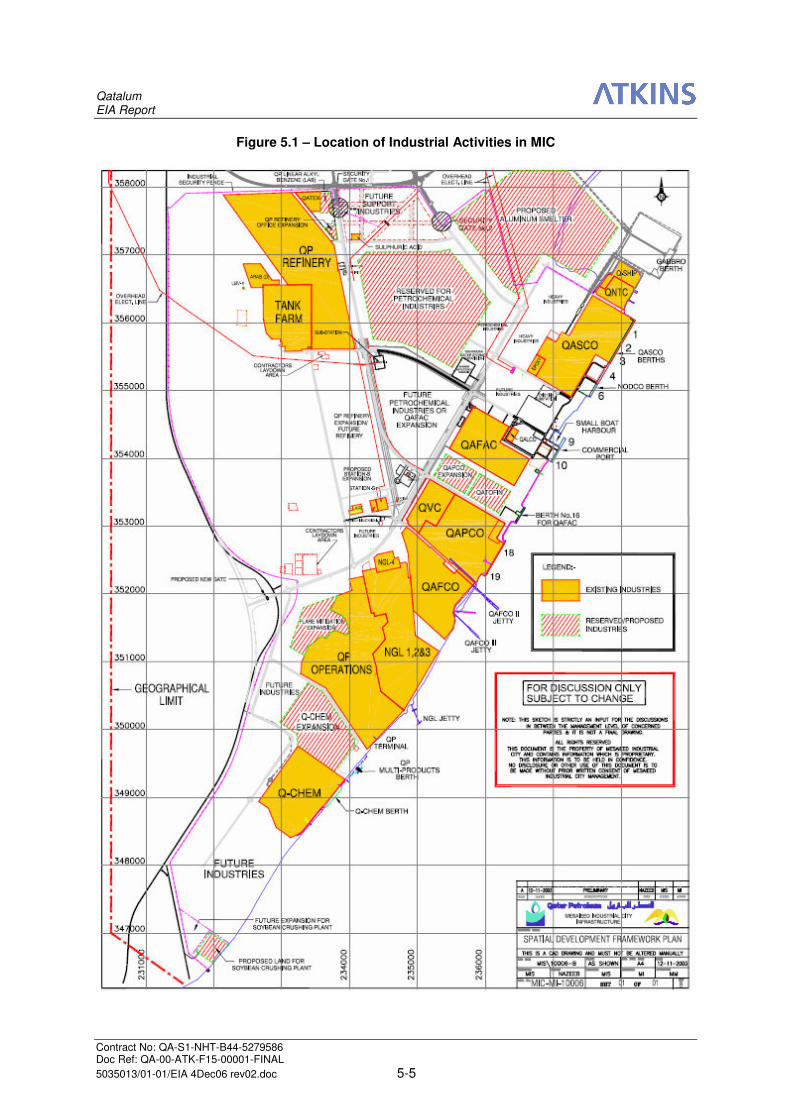
5.3.4 MIC Industrial Area accommodates a variety of industrial activities as well as oil and gas
processing and export facilities and has a well-established and fully serviced port
infrastructure. During recent years several new companies have been established and
some of the existing major industries have been subject to large expansion projects. An
Industrial Area Master Plan is currently under preparation by QP/MIC Authorities. The
major industries at MIC are indicated in Figure 5.1 and include:
• Qatar Petroleum (QP)
• Qatar Steel Company (QASCO);
• Qatar Petrochemical Company (QAPCO);
• Qatar Fertilizer Company (QAFCO);
• Qatar Additives Company (QAFAC);
• Qatar Vinyl Company (QVC);
• Qatar Chemical Company (Q-Chem);
• QP Refinery (formally National Oil Distribution Company (NODCO)); and
• Natural Gas Liquefaction Facilities (NGL-Plant).
5.3.5 The proposed Qatalum Main Site is an undeveloped site; historically no industrial activities
have been reportedly undertaken at the site. Access to the plot may be achieved through
the new access road constructed to the Gabbro Jetty or through the roads adjoining the
plot. A security fence and a transmission line run parallel to each other, cutting through the
site. With the exception of an overhead power transmission line, there is no existing
infrastructure present at the site.
5.3.6 The Original Port Area would form an extension of the existing Gabbro Berth area. The
Alternative Port Area is currently unused land, located South of QASCO, in between
existing MIC industries and infrastructure, which has been set aside for industrial
development. One of the main roads within the MIC Industrial Area bounds the onshore
north west edge of the Alternative Port Area and a transmission line runs parallel to this
road towards and onto the Qatalum Main Site.
Qatalum EIA Report
Contract No: QA-S1-NHT-B44-5279586 Doc Ref: QA-00-ATK-F15-00001-FINAL
5035013/01-01/EIA 4Dec06 rev02.doc 5-5
Figure 5.1 – Location of Industrial Activities in MIC
Qatalum EIA Report
Contract No: QA-S1-NHT-B44-5279586 Doc Ref: QA-00-ATK-F15-00001-FINAL
5035013/01-01/EIA 4Dec06 rev02.doc 5-6
Geology
Regional Geology38
5.3.7 The Qatar peninsula is geologically part of the Arabian Gulf Basin, which has accumulated
sediments, with little interruption and has been influenced in only a minor way by tectonic
activity, since the Paleozoic Period. The thickness of sedimentary rocks overlying
basement rocks in Qatar is estimated to be over 10 km. The recent post Cretaceous
geological succession of Qatar can be summarized as a rhythmical sequence of shallow
water marine limestones, along with occasional shales and evaporites. The latter two
represent accumulations of material from nearby land masses and precipitation of
anhydrite and gypsum in still, shallow basins respectively. Occasional interruptions to
sedimentation have occurred producing minor unconformities. The formations exposed in
the present day Qatar peninsula are all of Tertiary to Quaternary age.
Local Geology and Site Conditions38
5.3.8 The south east part of the Qatar Peninsular, near Mesaieed, is characterised by an aeolin,
quartz dune complex. Scattered dunes, mainly of the barchan type, move under the
influence of north westerly “shamal” winds across the Simsima Limestone rock surface.
These dunes are rapidly migrating into the sea, prograding the coast to produce a
predominantly quartz sand sabkha. The resulting low lying flat coastal plain is up to 40 km
long, 7-10 km wide and up to 30 m thick. The precise source of the migrating sand dunes
is not known; however, the present sand supply is almost exhausted and within a few
thousand years this type of sedimentation will probably cease. The coastal area is then
likely to revert to carbonate coastal sedimentation similar to that in most other parts of the
Arabian Gulf.
5.3.9 Prior to the land reclamation operations in the 1970s, the industrial complex would
probably have been a relatively level intertidal mud/sand flat. The present Main Site would
once have been in a relatively deep water (approximately 15 to 20 m) marine environment
that led to the formation/deposition of bioclastic carbonate sands. Marine faunal activity
must have been abundant and cementation of the sands and the bioclastic material
created the calcarenite (caprock) material. A relatively quiet period of deposition must then
have followed, which led to the formation of the marine dark grey carbonate silts and
sandy silts. Further, as the sand dunes migrated in a south easterly direction, aeolian sand
was blown into the sea and deposited over the natural marine sediments.
5.3.10 During the 1970s extensive land reclamation works were undertaken over much of the
Industrial Complex (including the Alternative Port Area) by placing hydraulically pumped,
dredged fill material on the muddy/sand flat, thus raising the ground above tidal levels.
Hence, for much of the north and eastern areas of MIC, the entire geological succession
has been masked / covered by hydraulically placed fill material. The majority of the
Qatalum Main Site is unaffected by these reclamation/filling operations, with the exception
of a small portion located on the northern corner of the site.
5.3.11 The geotechnical investigation classified the ground conditions encountered on the Main
Site into four principle categories:
Qatalum EIA Report
Contract No: QA-S1-NHT-B44-5279586 Doc Ref: QA-00-ATK-F15-00001-FINAL
5035013/01-01/EIA 4Dec06 rev02.doc 5-7
• made-ground (hydraulic fill material);
• natural (aeolian derived) reworked sands;
• natural marine sediments, comprising marine silts and sands/gravel; and
• solid limestone bedrock, belonging to the Simsima formation.
5.3.12 In summary, the onshore geology at the Qatalum Main Site comprises a sandy silty
overburden to a depth of approximately 6 to 20 m below ground level, overlying the
limestone bedrock of the Simsima Formation.
Seismic Conditions
5.3.13 Qatar is within an area of low seismic activity and is reportedly classified within Seismic
Zone 0 by the Uniform Building Code; although designing to Seismic Zone 1 is
recommended for Doha and this will also be applied to the Qatalum Project.
Hydrology
Surface Water
5.3.14 As noted previously, part of the south eastern boundary of the site is flooded with
seawater; however, owing to the arid nature of the overall area, no natural surface fresh
water bodies of significance are present at Mesaieed, or within the immediate vicinity of
the site.
5.3.15 Historically, an “inland lagoon” (which has since disappeared) was reported to exist over
part of the site, this is thought to be a part of the Umm Said Sewage Pond (reedbed),
which was created through the discharge of treated effluent from the MIC sewage
treatment plant36
. Comparison of observations made during the 2005 Qatalum Winter Bird
Survey, which identified very few areas of open water, and available literature imply that
there has been a drying out of the reedbed in recent years; this is discussed further in
Section 5.7.
Groundwater
5.3.16 The three uppermost solid geological units provide the major aquifer system present in
Qatar; these are: the Dammam, Rus and Umm Er Radhuma Formation. Recent drift
deposits generally provide only minor aquifers.
5.3.17 The groundwater system in MIC is controlled by sea level and recharge to, and
abstractions from the Sabkha Aquifer. Due to the low lying nature of the site, groundwater
is present at a shallow depth across the site. In addition, due to the proximity of the sea,
the groundwater is tidally influenced across the site area. The groundwater in the site area
is unconfined. Groundwater was encountered and monitored in all the land boreholes of
the Qatalum Geotechnical site investagation38
. The highest groundwater levels recorded
during Qatalum Main Site investigation ranged from 0.89 m to -0.83 m QNHD.
Qatalum EIA Report
Contract No: QA-S1-NHT-B44-5279586 Doc Ref: QA-00-ATK-F15-00001-FINAL
5035013/01-01/EIA 4Dec06 rev02.doc 5-8
5.3.18 No information is presently available for the hydraulic conductivity, hydraulic gradient and
the groundwater flow direction across the site area. Notwithstanding this, it is likely that
due to the low lying nature of the surrounding land and the proximity of the coast, the
hydraulic gradient would be relatively low. In addition, due to the tidal influence, the
groundwater flow direction is likely to vary between towards the coast (east) and inland
(west).
Soil and Groundwater Quality
5.3.19 A soil and groundwater survey at the Qatalum Main Site was undertaken in February 2006
to characterise the local soil and groundwater conditions and to supplement the data
obtained from the geotechnical investigations38
.
5.3.20 The survey involved a basic site investigation, involving the excavation of shallow trial pits
across the site and soil analysis, at ten locations, for:
• total petroleum hydrocarbons (TPH) or oil and grease;
• polyaromatic hydrocarbons (PAH); and
• heavy metals (cadmium, chromium, copper, lead, manganese, nickel, selenium,
vanadium, zinc).
5.3.21 Eight groundwater samples were taken from existing boreholes on the site and analysed
for:
• nutrients (nitrate, nitrite and phosphate);
• fluoride;
• chloride;
• total petroleum hydrocarbons (TPH) or oil and grease;
• total organic carbon (TOC);
• BTEX (benzene, toluene, ethyl benzene and xylene);
• polyaromatic hydrocarbons (PAH); and
• metals (cadmium, chromium, copper, lead, manganese, nickel, selenium,
vanadium, zinc).
5.3.22 Sampling was undertaken by Gulf Laboratories Co. (Gulf Labs) under the supervision of
an experienced Atkins site engineer. Trial pits, borehole sampling and analysis were
undertaken in accordance with internationally accepted techniques. The full details of the
soil and groundwater survey and the results are presented in Appendix B. A summary of
the results is presented below.
Soil Quality
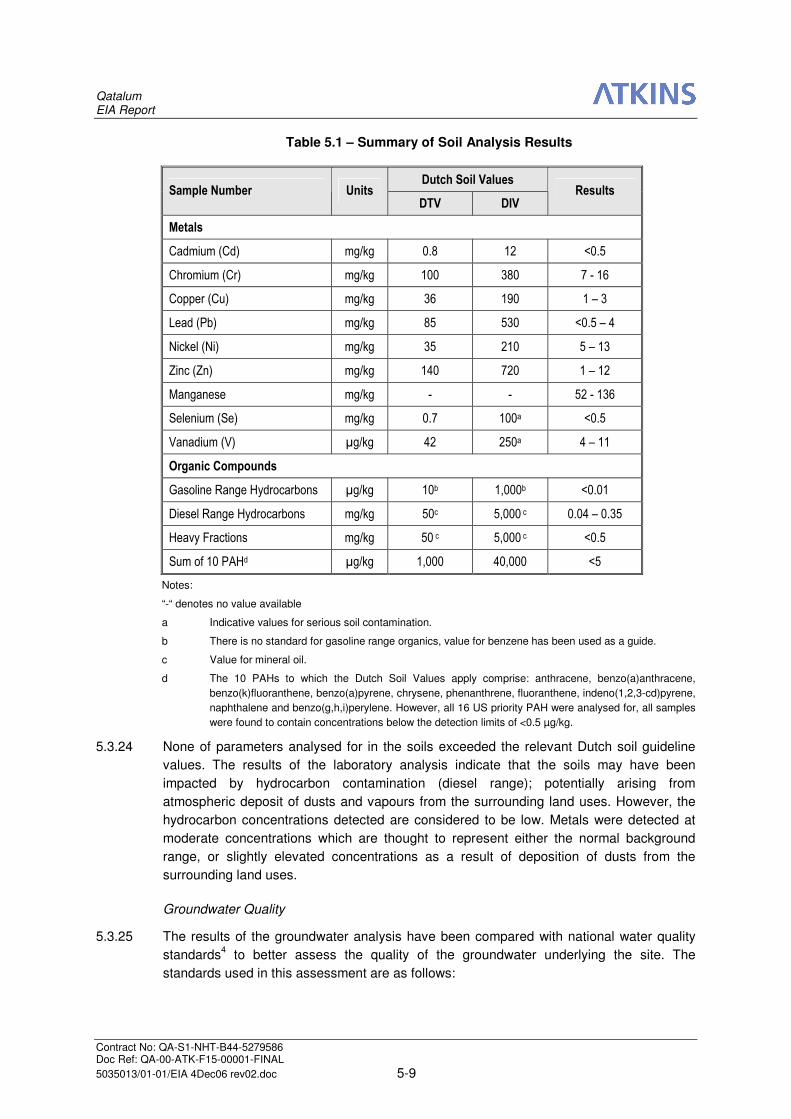
5.3.23 As discussed in Section 2.6, many appraisals of soil quality utilise the Dutch guidelines17
for assessing soil quality. A summary of the soil sampling results compared to the relevant
Dutch Guidelines is presented in Table 5.1.
Qatalum EIA Report
Contract No: QA-S1-NHT-B44-5279586 Doc Ref: QA-00-ATK-F15-00001-FINAL
5035013/01-01/EIA 4Dec06 rev02.doc 5-9
Table 5.1 – Summary of Soil Analysis Results
Dutch Soil Values Sample Number Units
DTV DIV Results
Metals
Cadmium (Cd) mg/kg 0.8 12 <0.5
Chromium (Cr) mg/kg 100 380 7 - 16
Copper (Cu) mg/kg 36 190 1 – 3
Lead (Pb) mg/kg 85 530 <0.5 – 4
Nickel (Ni) mg/kg 35 210 5 – 13
Zinc (Zn) mg/kg 140 720 1 – 12
Manganese mg/kg - - 52 - 136
Selenium (Se) mg/kg 0.7 100a <0.5
Vanadium (V) µg/kg 42 250a 4 – 11
Organic Compounds
Gasoline Range Hydrocarbons µg/kg 10b 1,000b <0.01
Diesel Range Hydrocarbons mg/kg 50c 5,000 c 0.04 – 0.35
Heavy Fractions mg/kg 50 c 5,000 c <0.5
Sum of 10 PAHd µg/kg 1,000 40,000 <5
Notes:
“-“ denotes no value available
a Indicative values for serious soil contamination.
b There is no standard for gasoline range organics, value for benzene has been used as a guide.
c Value for mineral oil.
d The 10 PAHs to which the Dutch Soil Values apply comprise: anthracene, benzo(a)anthracene,
benzo(k)fluoranthene, benzo(a)pyrene, chrysene, phenanthrene, fluoranthene, indeno(1,2,3-cd)pyrene,
naphthalene and benzo(g,h,i)perylene. However, all 16 US priority PAH were analysed for, all samples
were found to contain concentrations below the detection limits of <0.5 µg/kg.
5.3.24 None of parameters analysed for in the soils exceeded the relevant Dutch soil guideline
values. The results of the laboratory analysis indicate that the soils may have been
impacted by hydrocarbon contamination (diesel range); potentially arising from
atmospheric deposit of dusts and vapours from the surrounding land uses. However, the
hydrocarbon concentrations detected are considered to be low. Metals were detected at
moderate concentrations which are thought to represent either the normal background
range, or slightly elevated concentrations as a result of deposition of dusts from the
surrounding land uses.
Groundwater Quality
5.3.25 The results of the groundwater analysis have been compared with national water quality
standards4 to better assess the quality of the groundwater underlying the site. The
standards used in this assessment are as follows:
Qatalum EIA Report
Contract No: QA-S1-NHT-B44-5279586 Doc Ref: QA-00-ATK-F15-00001-FINAL
5035013/01-01/EIA 4Dec06 rev02.doc 5-10
• Qatari Standard for Treated Wastewater from Industrial Land Based Facilities
Used for Irrigation (QSTW);
• Qatari Standard for Seawater Quality (QSSQ); and
• Qatari Guidelines for Drinking Water Quality (QDW).
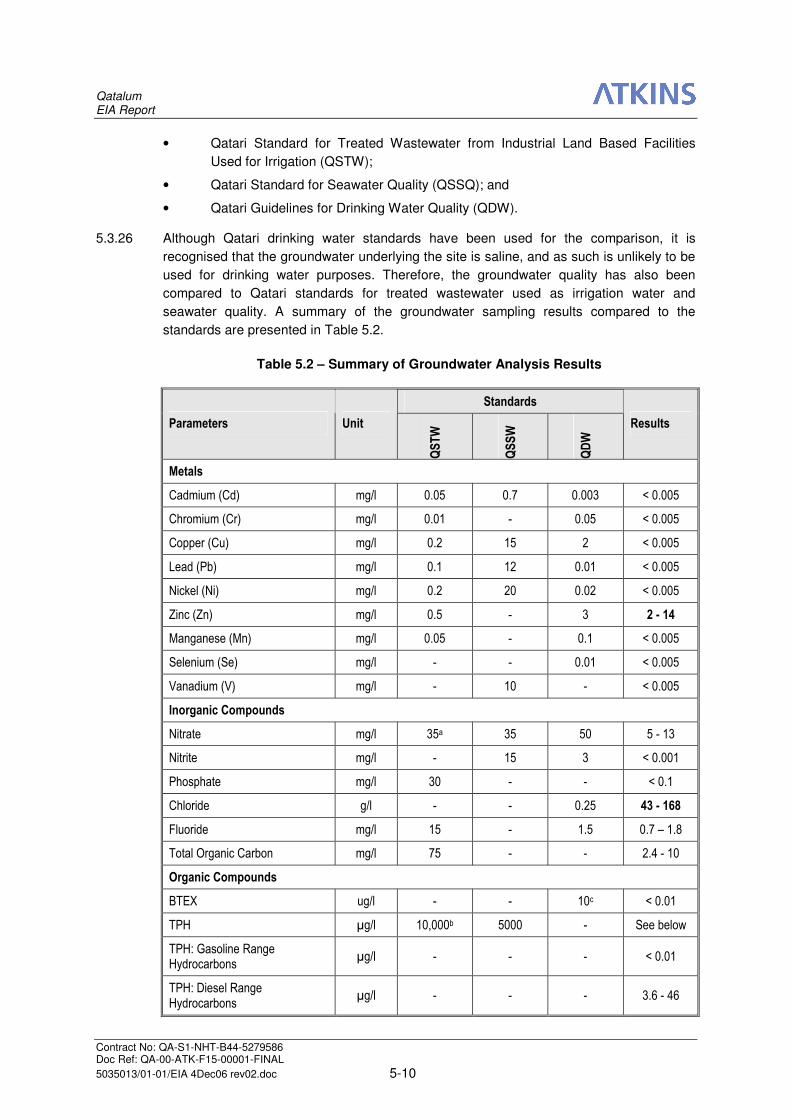
5.3.26 Although Qatari drinking water standards have been used for the comparison, it is
recognised that the groundwater underlying the site is saline, and as such is unlikely to be
used for drinking water purposes. Therefore, the groundwater quality has also been
compared to Qatari standards for treated wastewater used as irrigation water and
seawater quality. A summary of the groundwater sampling results compared to the
standards are presented in Table 5.2.
Table 5.2 – Summary of Groundwater Analysis Results
Standards
Parameters Unit QSTW
QSSW
QDW Results
Metals
Cadmium (Cd) mg/l 0.05 0.7 0.003 < 0.005
Chromium (Cr) mg/l 0.01 - 0.05 < 0.005
Copper (Cu) mg/l 0.2 15 2 < 0.005
Lead (Pb) mg/l 0.1 12 0.01 < 0.005
Nickel (Ni) mg/l 0.2 20 0.02 < 0.005
Zinc (Zn) mg/l 0.5 - 3 2 - 14
Manganese (Mn) mg/l 0.05 - 0.1 < 0.005
Selenium (Se) mg/l - - 0.01 < 0.005
Vanadium (V) mg/l - 10 - < 0.005
Inorganic Compounds
Nitrate mg/l 35a 35 50 5 - 13
Nitrite mg/l - 15 3 < 0.001
Phosphate mg/l 30 - - < 0.1
Chloride g/l - - 0.25 43 - 168
Fluoride mg/l 15 - 1.5 0.7 – 1.8
Total Organic Carbon mg/l 75 - - 2.4 - 10
Organic Compounds
BTEX ug/l - - 10c < 0.01
TPH µg/l 10,000b 5000 - See below
TPH: Gasoline Range Hydrocarbons
µg/l - - - < 0.01
TPH: Diesel Range Hydrocarbons
µg/l - - - 3.6 - 46
Qatalum EIA Report
Contract No: QA-S1-NHT-B44-5279586 Doc Ref: QA-00-ATK-F15-00001-FINAL
5035013/01-01/EIA 4Dec06 rev02.doc 5-11
Standards
Parameters Unit
QSTW
QSSW
QDW Results
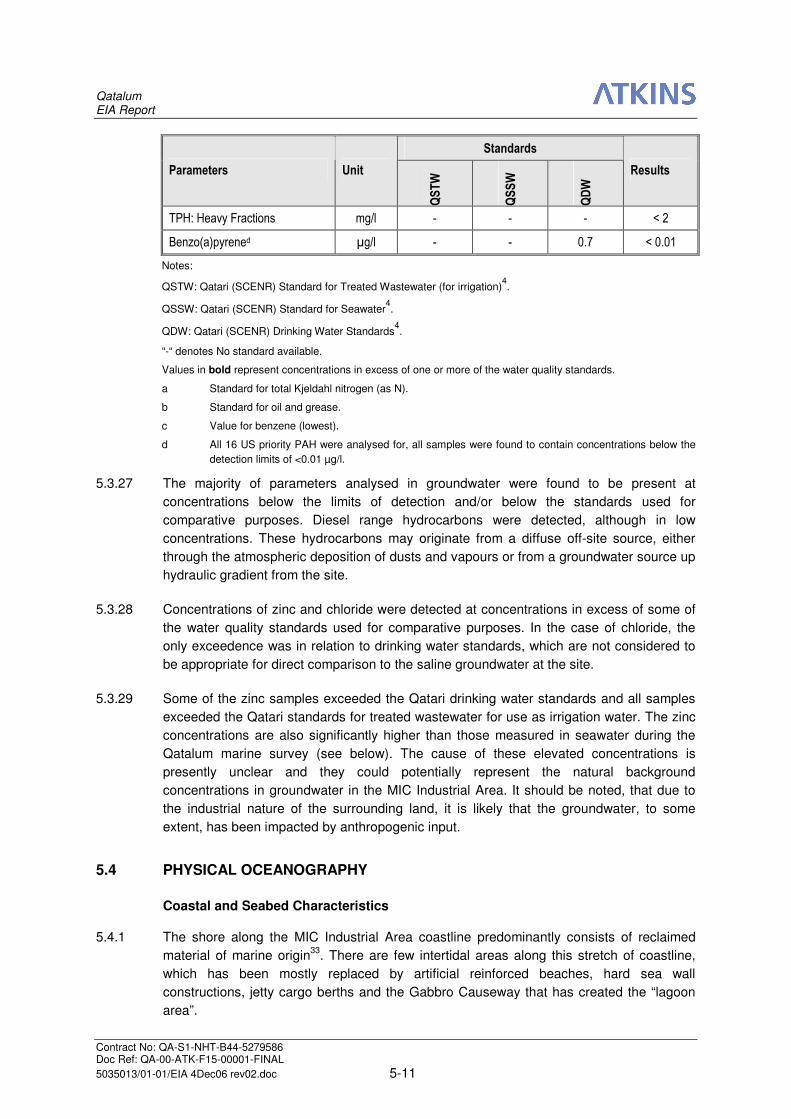
TPH: Heavy Fractions mg/l - - - < 2
Benzo(a)pyrened µg/l - - 0.7 < 0.01
Notes:
QSTW: Qatari (SCENR) Standard for Treated Wastewater (for irrigation)4.
QSSW: Qatari (SCENR) Standard for Seawater4.
QDW: Qatari (SCENR) Drinking Water Standards4.
“-“ denotes No standard available.
Values in bold represent concentrations in excess of one or more of the water quality standards.
a Standard for total Kjeldahl nitrogen (as N).
b Standard for oil and grease.
c Value for benzene (lowest).
d All 16 US priority PAH were analysed for, all samples were found to contain concentrations below the
detection limits of <0.01 µg/l.
5.3.27 The majority of parameters analysed in groundwater were found to be present at
concentrations below the limits of detection and/or below the standards used for
comparative purposes. Diesel range hydrocarbons were detected, although in low
concentrations. These hydrocarbons may originate from a diffuse off-site source, either
through the atmospheric deposition of dusts and vapours or from a groundwater source up
hydraulic gradient from the site.
5.3.28 Concentrations of zinc and chloride were detected at concentrations in excess of some of
the water quality standards used for comparative purposes. In the case of chloride, the
only exceedence was in relation to drinking water standards, which are not considered to
be appropriate for direct comparison to the saline groundwater at the site.
5.3.29 Some of the zinc samples exceeded the Qatari drinking water standards and all samples
exceeded the Qatari standards for treated wastewater for use as irrigation water. The zinc
concentrations are also significantly higher than those measured in seawater during the
Qatalum marine survey (see below). The cause of these elevated concentrations is
presently unclear and they could potentially represent the natural background
concentrations in groundwater in the MIC Industrial Area. It should be noted, that due to
the industrial nature of the surrounding land, it is likely that the groundwater, to some
extent, has been impacted by anthropogenic input.
5.4 PHYSICAL OCEANOGRAPHY
Coastal and Seabed Characteristics
5.4.1 The shore along the MIC Industrial Area coastline predominantly consists of reclaimed
material of marine origin33
. There are few intertidal areas along this stretch of coastline,
which has been mostly replaced by artificial reinforced beaches, hard sea wall
constructions, jetty cargo berths and the Gabbro Causeway that has created the “lagoon
area”.
Qatalum EIA Report
Contract No: QA-S1-NHT-B44-5279586 Doc Ref: QA-00-ATK-F15-00001-FINAL
5035013/01-01/EIA 4Dec06 rev02.doc 5-12
5.4.2 Previous surveys33,34& 39
of the MIC near-shore marine environment describe the seabed
as consisting largely of a mixture of fine sand and silts, with a high percentage of clay. The
near-shore area of northern Mesaieed is comprised of up to 3 m of very fine silty
material36
. To the north and east of the Fasht Al Arif the seabed is markedly different. Fine
and medium carbonate sands, including shell fragments, still dominate the sediment, but
form only a thin veneer over the limestone bedrock34
.
5.4.3 Typical of marine and coastal waters, the finer silts are found along the sandy foreshore
and in near-shore areas, especially those which receive silty deposits from the alluvial fan
on the border of Fasht Al Arif. Finer silts are also found in and close to the lagoon where
water recycling by currents, waves and tides is not as evident as in deeper offshore areas,
allowing finer silts to drop out of suspension. Larger grains are found in samples further
offshore in deeper waters where water recycling is more prevalent.
5.4.4 At the Original Port Areaix, sediment samples, taken during the Qatalum Marine Survey,
exhibited particle size distributions with a wide variation in type of sediment ranging from
silt through fine to medium sands to coarse sands (see Appendix C for grain size analysis
results). Seabed sediment characteristics at the Alternative Port Area have been
extensively assessed by the 2001-2003 SARC survey33
. This survey shows that, in the
vicinity of the Qatalum Jetty, sediment type and composition also exhibited wide variation
over the survey period. Generally, the sediments around the Alternative Port Area were
observed to contain high proportions of sand and silt, but also relatively high clay content
ranging from 4-16 %. Surveys carried out in the vicinity of the Alternative Port Area, by
Atkins in 200034
, support the SARC survey results.
5.4.5 Lithological studies indicate that there is a thickness of up to 3 m of very fine silty material
in the near-shore area of northern Mesaieed34
. However, recent dive surveys of the
previously undisturbed areas identified as possible dredge sites for the Alternative Port
concept (see Figure 3.8), suggest that this could be as little as 25 cm. The MIC coastline
is stable and shows no sign of erosion or littoral drift.
ix
After submission of revision 01 of the EIA report, the Alternative Port concept was chosen. However the text,
relating to both Port concepts, within this updated (revision 02) EIA report has been retained, unchanged.
Qatalum EIA Report
Contract No: QA-S1-NHT-B44-5279586 Doc Ref: QA-00-ATK-F15-00001-FINAL
5035013/01-01/EIA 4Dec06 rev02.doc 5-13
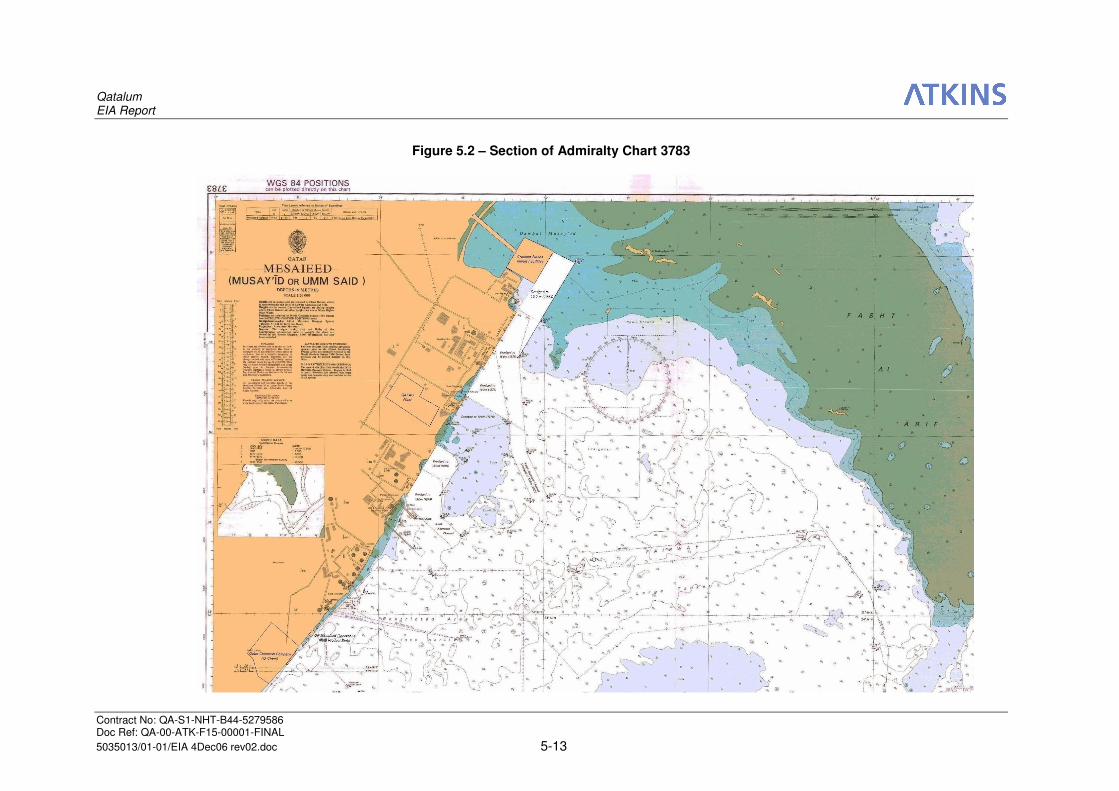
Figure 5.2 – Section of Admiralty Chart 3783
Qatalum EIA Report
Contract No: QA-S1-NHT-B44-5279586 Doc Ref: QA-00-ATK-F15-00001-FINAL
5035013/01-01/EIA 4Dec06 rev02.doc 5-14
Bathymetry
5.4.6 The Gulf is relatively shallow with an average depth of 35 m and a maximum depth of
100 m, which occurs near the entrance to the Strait of Hormuz40
. The total sea area of
Qatar’s seawaters is approximately 35,000 km2, which equates to approximately 15% of
the Gulf41
. Water depths around the Qatar coast average 30 m to the north and east and
20 m towards the west of the peninsula.
5.4.7 The marine environment of the study area at Mesaieed is illustrated in Figure 5.2 and is
characterised by relatively shallow waters, typical of much of the southern shoreline of the
Arabian Gulf, with maximum depths rarely exceeding 25 m. This is supported by SARC’s
three dimensional view of the coastal area off MIC, which generally shows that the coastal
area has depths of up to 25 m in inshore areas33
.
5.4.8 The most prominent bathymetrical feature of the Mesaieed area is the Fasht Al Arif, a
projection of rock and soft sediment extending in a south easterly direction from the Qatar
Peninsula, effectively creating a natural harbour to the south within which Mesaieed Port
has developed.
5.4.9 The Qatalum Marine Survey, carried out in 2005 to the north of the MIC area (see
Appendix C), identified very shallow water depths of <1.5 m on the Fasht Al Arif and 1 to
5 m in the Original proposed dredge areas. The seabed south of Fasht Al Arif slopes to
depths of 15 to 20 m.
5.4.10 Existing water depths in the area surrounding the Alternative Port Jetty are -13 m CD (as
indicated in Figure 3.8).The main topographical feature in the vicinity of the Alternative
Port location is the dredged navigation channel that lies to the east of this area and
extends northwards. The depth of the navigation channel is approximately 15 m.
Tides
5.4.11 Tides are mixed, though predominantly diurnal in the Mesaieed area. The tidal range in
this area is relatively small with a mean tidal range during spring tides of 1.5 m (2.12 to
0.57 m CD) was recorded for Mesaieed Port2. Tidal levels in metres relative to Mesaieed
Chart Datum are reported42
as follows:
• Highest Astronomical Tide (HAT): +2.50
• Mean Higher High Water (MHHW): +1.90
• Mean Lower High Water (MLHW): +1.20
• Mean Higher Low Water (MHLW): +1.10
• Mean Lower Low Water (MLLW): +0.70
• Lowest Astronomical Tide (LAT): +0.30
Qatalum EIA Report
Contract No: QA-S1-NHT-B44-5279586 Doc Ref: QA-00-ATK-F15-00001-FINAL
5035013/01-01/EIA 4Dec06 rev02.doc 5-15
Waves
5.4.12 Wave heights of <1 m generally exist around Mesaieed and its offshore environment,
largely due to the presence of the Fasht Al Arif to the east, which creates a natural harbour
effect limiting wave heights during predominant northerly weather regimes34
. The
occurrence of the ‘shamal’ (north) winds in the winter months contributes to rough to high
seas, (i.e. wave heights of 1.5 m), though these are likely only 5 to 10% of the time and
largely occur from October to February. Extreme high swells (>3.5 m wave height) occur
less than 1% of the time34
. In the summer, strong winds can also occur, as a result of the
difference in the temperature of the land mass and the sea, resulting in large waves and
vertical mixing of the water column.
Currents and Circulation Patterns
5.4.13 The general circulation pattern in the Gulf is anticlockwise, which is particularly strong in
the south. The primary factors affecting circulation in Qatar coastal waters are density-
driven or tidal/wind-driven currents. Density-driven currents are considered the primary
influence on the circulation of water flowing into the Gulf, through the Straits of Hormuz,
from the Gulf of Oman. Southerly winds during the summer and strong northerly winds in
the winter mix the surface waters of the Gulf and influence local circulation in shallow
waters, such as those off the Qatari coastline33
.
5.4.14 Along the Mesaieed coastline, near-shore long-shore currents (i.e. currents flowing parallel
to the shore within this zone) are typically wave-dominated. However, local circulation
patterns are predominantly influenced by the presence of two rocky reefs, Fasht Al Arif
and Fasht Al-Udayd, the latter lying approximately 19 km offshore33
.
5.4.15 Current velocities in the area are generally parallel to the shore and northerly during flood
and southerly during ebb tides33
. Current speeds were measured for the EIA carried out
for the new QASCO DRI plant during September 200437
and were found to be low, ranging
from <0.05 to 0.25 m/s. During the Qatalum Marine Survey, it was found that the currents
were highly variable and that there was little strong periodicity, suggesting that the
currents are strongly influenced by wind. Data supplied by Hydro42
reports that inshore
seawater currents are typically 1 knot (~0.5 m/s), parallel to the face of the existing
Gabbro Berth.
Seawater Temperature
5.4.16 The surface and shallow waters of the Gulf undergo wide temperature changes in
response to daily and seasonal cycles of heating and cooling. Strong ‘shamals’ result in
thorough mixing of the entire water column causing vertical temperature gradients to be
generally small, with the exception of late summer where some stratification may occur43
.
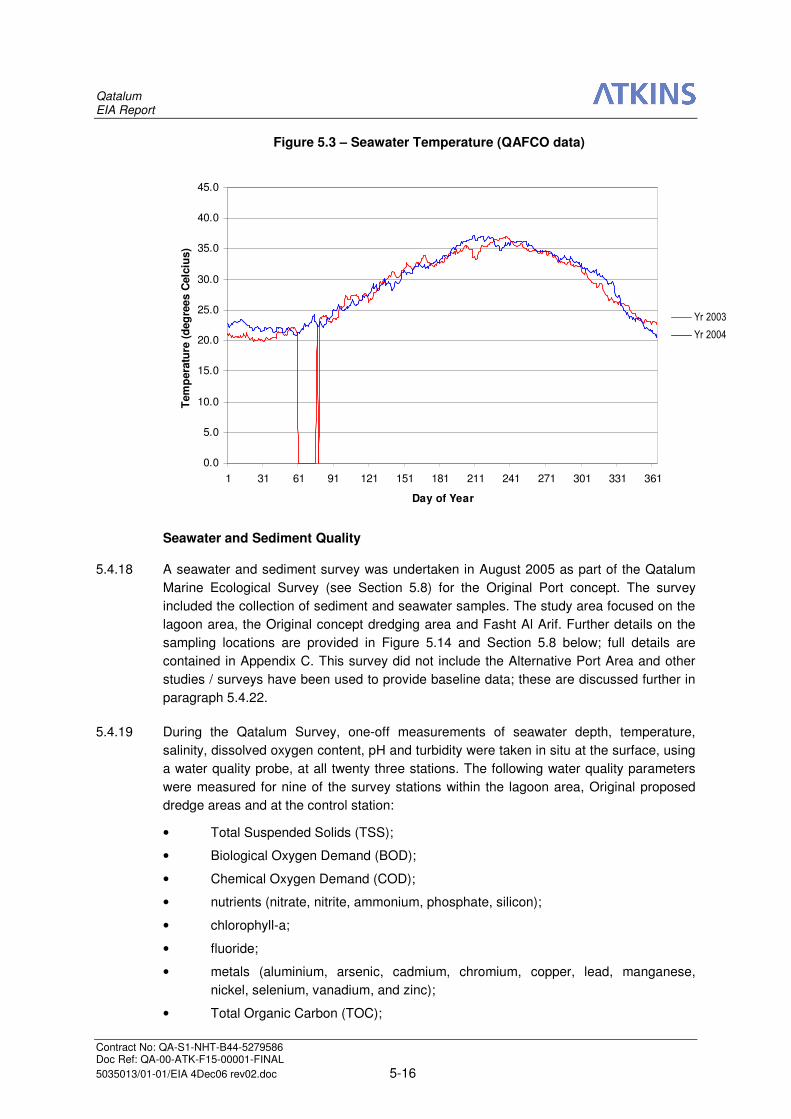
5.4.17 Temperature measurements, taken off the MIC coast during the three year SARC study,
indicate that sea temperature is influenced by a number of discharges from cooling water
outfalls, with water temperatures varying from 18.3°C (February) to 35.3°C (September)33
.
This temperature range is broadly consistent with seawater temperature data obtained
from QAFCO for use in the Qatalum Project. QAFCO has provided two years of seawater
temperature data, measured a little further south of the proposed Qatalum facilities; these
data are presented graphically in Figure 5.3.
Qatalum EIA Report
Contract No: QA-S1-NHT-B44-5279586 Doc Ref: QA-00-ATK-F15-00001-FINAL
5035013/01-01/EIA 4Dec06 rev02.doc 5-16
Figure 5.3 – Seawater Temperature (QAFCO data)
0.0
5.0
10.0
15.0
20.0
25.0
30.0
35.0
40.0
45.0
1 31 61 91 121 151 181 211 241 271 301 331 361
Day of Year
Tem
pera
ture
(d
eg
rees C
elc
ius)
Yr 2003
Yr 2004
Seawater and Sediment Quality
5.4.18 A seawater and sediment survey was undertaken in August 2005 as part of the Qatalum
Marine Ecological Survey (see Section 5.8) for the Original Port concept. The survey
included the collection of sediment and seawater samples. The study area focused on the
lagoon area, the Original concept dredging area and Fasht Al Arif. Further details on the
sampling locations are provided in Figure 5.14 and Section 5.8 below; full details are
contained in Appendix C. This survey did not include the Alternative Port Area and other
studies / surveys have been used to provide baseline data; these are discussed further in
paragraph 5.4.22.
5.4.19 During the Qatalum Survey, one-off measurements of seawater depth, temperature,
salinity, dissolved oxygen content, pH and turbidity were taken in situ at the surface, using
a water quality probe, at all twenty three stations. The following water quality parameters
were measured for nine of the survey stations within the lagoon area, Original proposed
dredge areas and at the control station:
• Total Suspended Solids (TSS);
• Biological Oxygen Demand (BOD);
• Chemical Oxygen Demand (COD);
• nutrients (nitrate, nitrite, ammonium, phosphate, silicon);
• chlorophyll-a;
• fluoride;
• metals (aluminium, arsenic, cadmium, chromium, copper, lead, manganese,
nickel, selenium, vanadium, and zinc);
• Total Organic Carbon (TOC);
Qatalum EIA Report
Contract No: QA-S1-NHT-B44-5279586 Doc Ref: QA-00-ATK-F15-00001-FINAL
5035013/01-01/EIA 4Dec06 rev02.doc 5-17
• Total Petroleum Hydrocarbons (TPH);
• Polyaromatic Hydrocarbons (PAH); and
• BTEX (benzene, toluene, ethyl benzene, xylene).
5.4.20 Data for the concentration of oil and grease in seawater were requested by SCENR in
March 2006; although this was not one of the parameters analysed for in the Qatalum
Survey, the survey carried out for the Gabbro Expansion EIA in 20052, which covered
approximately the same geographical area (see Appendix C, Figure 1.3) as the Qatalum
survey, reported results for oil and grease and these have been incorporated into this
report.
5.4.21 The following sediment quality parameters were measured for samples collected at twelve
survey stations in the tidal lagoon and proposed dredge area:
• grain size analysis;
• metals (aluminium, cadmium, chromium, copper, lead, manganese, nickel,
selenium, vanadium, and zinc);
• Total Organic Carbon (TOC);
• Total Petroleum Hydrocarbons (TPH); and
• Polychlorinated Biphenyls (PCB) and Polyaromatic Hydrocarbons (PAH).
5.4.22 Data for the concentrations of mercury, iron and cobalt in sediments were requested by
SCENR in March 2006; although these were not analysed for in the Qatalum Survey, the
recent survey carried out for the Gabbro Expansion EIA in 2005 and earlier Gabbro EIA
reports34,35&36
included these metals and these findings have been incorporated into
Appendix C.
5.4.23 Seawater and sediment surveys have been undertaken by SARC between 2001 and
200333
and Atkins in 200034
as part of the EIA for dredging of the marine navigation
channel. Transect D of the SARC survey is located in the vicinity of the Alternative Port
Jetty and this has been used as the most relevant SARC survey reference point for the
Alternative Port site. Samples from the Atkins 200034
survey were also taken in the vicinity
of the Alternative Port area, including the Alternative possible dredging areas. Both of
these studies have therefore been drawn upon to determine baseline conditions at the at
the Alternative Port site. The Atkins and SARC studies, other assessments (see those
listed above in paragraph 5.2.4) and the Qatalum Marine Survey for the Original Port have
been reviewed to validate conclusions drawn for both Port sites and to provide a regional
context.
Seawater Quality
5.4.24 The chemical characteristics of Gulf Waters are distinct from those of typical open ocean
waters. The minimal volume of riverine discharges into the Gulf, the arid nature of the
surrounding land mass, the relatively shallow water depths and the large number of
petroleum-related industries further contribute to the unique nature of Gulf waters.
Qatalum EIA Report
Contract No: QA-S1-NHT-B44-5279586 Doc Ref: QA-00-ATK-F15-00001-FINAL
5035013/01-01/EIA 4Dec06 rev02.doc 5-18
Salinity
5.4.25 Due to the relatively shallow water and limited circulation pattern within the water column
off Mesaieed, the water is characterised by high salinity when compared to other eastern
coastal zones of Qatar, which are typically in the range of 39 to 41 ppt. The SARC study33
indicated that salinity levels off the Qatari coast varied between 40 and 50 ppt. The
SCENR standard for baseline seawater quality ranges from 33 to 45 ppt. The high salinity
measure around MIC may be influenced by discharges of saline water from land based
industrial activities. The SARC survey results are comparable to those reported by Atkins
in 2000 and to the marine survey carried out in 2005 (see Appendix C).
Turbidity
5.4.26 Due to its influence on light transmission, water quality directly affects the primary
productivity of the water column and the benthic community. Water clarity is most directly
affected by suspended matter in the water column.
5.4.27 Marine waters off the coast of Qatar are generally clear, but can become very turbid during
periods of high winds. Results of Secchi readings undertaken by SARC33
indicate that the
water of the MIC near-shore and shallow sites are nearly completely illuminated. Dredging
of the main navigation channel has, however, reduced water clarity further offshore.
Readings of visibility at SARC Transect D were reported as between 6 and 8.8 m; this was
less turbid than the results for the SARC survey areas immediately to the north and south.
The average visibility for the whole marine covered by the SARC survey was 8.27 m. The
Atkins 200034
survey found that total suspended solids (TSS) in near-shore waters ranged
from <1.5 to 6 mg/l. Measurements to north, taken during the 2005 Qatalum Survey
indicated TSS levels of between 1 to 8 mg/l (see Appendix C). These are well below the
maximum permissible levels for seawater quality set in Qatar (30 mg/l).
Dissolved Oxygen
5.4.28 Dissolved oxygen (DO) concentrations in seawater are important because aerobic marine
organisms require oxygen for respiration. Anoxia or very low DO concentrations (i.e. less
than 4 mg/l) can stress or even kill organisms. DO levels off the MIC coast typically range
from 2.63 to 9.08 ml/l33
.
5.4.29 During the Qatalum Marine Survey at the Original Port Area, DO levels measured near the
surface varied from 4.90 to 6.83 mg/l (or 86.4 to 121.01%) saturation, which shows
compliance with the Qatari seawater standard for DO (>4 mg/l)4. This is supported by the
findings of the recent Gabbro EIA2, which reported DO concentrations for approximately
the same geographical area as ranging from 5.2-6.0 mg/l.
5.4.30 At Transect D within the SARC survey33
, DO levels were report to range from 4 to 8 ml/l,
with concentrations increasing after 2001. This again shows compliance with the Qatari
standard and is comparable with results from surveys undertaken by Atkins in 200034
.
5.4.31 According to SARC33
, the average DO concentration in the sea world-wide is 6 ml/l. This
and the various survey results demonstrate that marine waters off the coast of MIC are at
near oxygen saturation with no indication of oxygen depletion.
Qatalum EIA Report
Contract No: QA-S1-NHT-B44-5279586 Doc Ref: QA-00-ATK-F15-00001-FINAL
5035013/01-01/EIA 4Dec06 rev02.doc 5-19
Ammonia and Urea
5.4.32 For the offshore Gulf water the average ammonia levels are 0.75 µM/l33
; short term lethal
concentrations (LC) of ammonia range between ~33 µM/l and ~100 µM/l and the 96 hour
LC-50 ranges from ~22 µM/l to 173 µM/l, with toxicity increasing with decreasing oxygen
levels. The maximum level recorded off the MIC coast between 2001 and 2003 was 56.9
µM/l of ammonia and 45.4 µM/l of urea. SARC33
concluded that the main source of
ammonia and urea in the MIC area is the QAFCO discharge. At Transect D within the
SARC survey, maximum levels were 15.8 µM/l ammonia and 12.2 µM/l urea.
Concentrations of ammonia in the water samples analysed during 2005 Qatalum Marine
Survey were reported to be below the detection limit (<0.1 mg/l). Although ammonia and
urea levels were found to be high near the Alternative Port Area, relative to average levels
in the Gulf, the ranges recorded are well below the lethal levels.
5.4.33 The SARC study33
did not record measurements for nitrate, nitrite or phosphate.
Concentrations of these compounds at the stations assessed in the Qatalum 2005 Survey
ranged from 1.8 to 2.1 mg/l for nitrate, <0.1 mg/l for nitrite, <0.1 to 0.2 mg/l for phosphate.
These concentrations are much lower than Qatari Standards for baseline seawater quality
indicating that the survey sites for the Original Port Area are uncontaminated with respect
to nutrient levels.
Total Petroleum Hydrocarbons
5.4.34 TPH levels across the entire SARC33
survey area averaged 0.247 ppm in surface water
and 0.226 ppm in bottom water. SARC concluded that the water in the MIC marine
environment was generally contaminated with oil, which was attributed to ship traffic
activities, oil loading/unloading and land based industrial sources. The measured TPH
levels showed patchy distribution, indicating both inland and marine sources. Most of the
high TPH concentrations were observed towards the QAPCO discharge, mooring buoys
for oil tanker loading and the Small Boat Harbour, which is close to the Alternative Port
Area. TPH measurements along taken from samples along SARC Transect D ranged from
0.075 to 0.662 ppm, with average recorded levels of below 0.2 ppm.
5.4.35 TPH concentrations recorded during the Qatalum Marine Survey were found to be below
detection limits; suggesting that the seawater in the vicinity of the Original Port Area is not
contaminated with hydrocarbons. Water quality at the Alternative Port Area is therefore
likely to be more polluted with TPHs than the Original Port Area.
5.4.36 SARC report that elsewhere in the Gulf, TPH concentrations have been recorded as
ranging from 0.0004 ppm to 0.0057 ppm (for the Bahraini coast) and 0.0001 to 0.03 ppm
(for the UEA coast). SARC also report that background levels for the Qatar coast are
0.001 ppm. By comparison, TPH levels are therefore relatively high off parts of the MIC
coast.
Qatalum EIA Report
Contract No: QA-S1-NHT-B44-5279586 Doc Ref: QA-00-ATK-F15-00001-FINAL
5035013/01-01/EIA 4Dec06 rev02.doc 5-20
PCBs
5.4.37 Analysis was undertaken in the 2000 Atkins Survey for the EIA for the navigation channel
dredging project identified only PCB 1254 at detectable levels. Concentrations were
highest in surface waters (2.5µg/l and 1.79µg/l). Detectable concentrations were also
reported in bottom water but not at locations designated for dredging. There are no
environmental quality standards for PCBs in water relevant to Qatar, but for comparison a
chronic guideline value of 0.03µg/l for PCBs, provided by the USEPA, suggests that there
is some ecotoxicological risk to marine life, associated in particular with bioaccumulation
up the food-chain. Neither the Qatalum Survey nor the SARC survey analysed samples for
PCBs and so these can not be used to provide a comparison.
Sediment Quality
5.4.38 The composition of sediments is important as they help to determine likely issues
associated with potential contamination. Studies have shown that the content of
contaminants, particularly heavy metal and organic compounds, in sediments is primarily
governed by the grain size of the sediment. In general, organic chemicals are associated
with organic carbon present in the sediment, and hence the higher the proportion of
organic carbon, the greater is the potential for sorption, (either absorption or adsorption),
of organic contaminants to the sediment matrix. For metals, adsorption is generally
controlled by electrostatic association with negatively charged clay minerals, consequently
the higher the proportion of clay minerals (generally defined as the <63 µm fraction
comprising fine silts) present in a sample, the greater the potential for metal adsorption.
Hence, the highest metals concentrations are often measured in fine silt/clay samples.
Total Organic Carbon (TOC)
5.4.39 SARC reported TOC concentrations in marine sediments in the MIC area as being
generally low (average of 0.84%). TOC levels along transect D of the SARC survey, TOC
ranged from 0.19 to 25%. The 25% value (recorded in Feb 2002) is very high; however,
this level was only found in one sample from the whole data set and is not remotely
approached in the other samples. It is therefore likely that this is a one-off or anomalous
reading. If this high result is excluded from the data set. The average TOC level for
Transect D averages at <1%. The Atkins 2000 survey 34
also showed levels below 1% in
proximity to the Alternative Port Area.
5.4.40 TOC concentrations recorded during the Qatalum Survey ranged from 2.5 % to 6.0%,
which are typical of coastal marine deposits. However, the concentrations showed no
distinct pattern and no obvious correlation with grain size (i.e. highest organic carbon was
not associated with the finest sediment fractions).
5.4.41 In general, it is concluded that the overall results from the various surveys do not suggest
any unusually high levels of organic matter or organic contamination.
Qatalum EIA Report
Contract No: QA-S1-NHT-B44-5279586 Doc Ref: QA-00-ATK-F15-00001-FINAL
5035013/01-01/EIA 4Dec06 rev02.doc 5-21
Total Petroleum Hydrocarbons (TPHs)
5.4.42 TPH inputs to the Gulf are extremely high and are mainly attributed to chronic spills from
heavy tanker transport activity and from major spills44
. Lighter fractions of TPH biodegrade
naturally in warm waters; hence, in the majority of cases, any TPH found in sediments are
likely to result from more recalcitrant TPH compounds, or from local sources / recent
pollution events.
5.4.43 TPH concentrations recorded by SARC between 2001 and 2003 in the MIC area were
found to be high and were positively correlated with the small size fractions of sediment,
such as silts33
. Concentrations ranged from 1.38 to 676 mg/kg across the three year
survey period, with an average of 69.11 mg/kg for the whole SARC survey area. The
general trend observed was that of a gradual decrease in TPH concentration from north to
south along the MIC coast. In general, offshore sediments would seem to be less
contaminated than near-shore sediments.
5.4.44 At SARC Transect D, TPH levels averaged 140 mg/kg (ranging from 17.13 to 676 mg/kg).
This would suggest that, in comparison with other parts of the MIC, TPH level in sediments
in vicinity of the Alternative Port Area are high; however, the Atkins survey33
did not detect
TPH in the proximity of the Alternative Port location and dredging areas SARC have
suggested that the high levels at Transect D could be associated with dredging vessel
activities in the north.
5.4.45 The low contamination levels in the north were confirmed by survey 2005 Qatalum Survey,
which revealed Gasoline Range Hydrocarbons (GRH) were not present above the limit of
detection (<0.01 µg/kg); Diesel Range Hydrocarbons (DRH) were observed from <0.02 to
0.05 µg/kg and the heavy fraction was not recorded above the limit of detection (<5
mg/kg).
5.4.46 The results suggest that there is a patchy distribution of contaminants within the MIC area,
which may vary significantly locally.
5.4.47 A comparison of TPH levels with other studies conducted in similar industrial areas of the
Gulf may be made. Concentrations recorded in the Safania Industrial Area in Kuwait
during 2002 ranged from 6.7 to 2067 mg/kg and those recorded across the Gulf have
ranged from no detection to 1448 mg/kg33
. Consequently, it can be concluded that
concentrations of hydrocarbons in sediments from the survey site are considerably lower
than some values reported elsewhere in the Gulf.
5.4.48 The Dutch sediment quality guidelines provide two standards for TPH; a short term
Maximum Permissible Concentration (MPC) of 1 mg/kg and a longer term No Effect
Concentration (NEC) of 0.05 mg/kg. Levels that could be found at the Alternative Port
Area are therefore far in excess of these values.
5.4.49 As part of the Alternative harbour concept pre-dredging monitoring programme, TPH
levels in the footprint of works will be investigated further. If high levels are found,
mitigation measures will be adopted to eliminate or minimise the negative effects
associated with the redistribution of the sediments to less contaminated areas. As
discussed above, since TPH contamination is thought to be localised in near-shore areas,
it should be possible to avoid any significantly high levels of contamination.
Qatalum EIA Report
Contract No: QA-S1-NHT-B44-5279586 Doc Ref: QA-00-ATK-F15-00001-FINAL
5035013/01-01/EIA 4Dec06 rev02.doc 5-22
Metals
5.4.50 Metals tend to accumulate in soils and sediments as they are not subject to bacterial
attack or, if they are, the time scales for the stabilization of such metals are extremely
long. Many trace metals are required by living organisms in minute concentrations for
various metabolic processes. At higher concentrations, some trace metals are toxic and
pose a threat to health, reproduction and survival of organisms.
5.4.51 Interim sediment quality guidelines have been adopted by Environment Canada for a
range of toxic substances, including metals18 (see Table 2.5). In addition, as discussed
above, the Dutch guidelines19 also apply to metals.
5.4.52 Metal concentrations measured during the three year study conducted by SARC33
generally increased moving from the north of MIC to the south. Iron and lead levels were
found to occur at elevated concentrations in the vicinity of the QASCO berth. Beryllium
and mercury levels were also determined to be high in certain areas.
5.4.53 At transect D of the SARC survey, levels of chromium, zinc, lead and copper were all
below international guidance values. Slightly elevated levels of nickel, cobalt, cadmium
and mercury were recorded. It must be noted, however, that high values are not consistent
across the data set with a single high value being recorded for most of these metals.
Mercury levels were highest in 2001 (above guidance values), but levels mostly reduced to
within Dutch and Canadian standards in following years.
5.4.54 Results of sediment analysis from the 2000 survey34 show that there was significant metal
contamination of sediments at many of the sampled locations in the industrial, inner and
outer navigation channel areas, particularly associated with fine sands and silt. This
included contamination with iron, manganese, nickel, lead and zinc (Zn) at levels at which
chronic effects on marine life have been documented by studies elsewhere in the world.
5.4.55 In the Qatalum 2005 Survey, aluminium concentrations were the highest for all of the
reported metals, which would be expected given that aluminium is a major constituent of
the alumino-silicate clay mineral fractions in silts and clays. The low solubility and
bioavailability of aluminium in these fractions would not be expected to cause adverse
effects. Most of the other metals determined in the Qatalum survey were found to be
present in concentrations below the limits of detection and all were within the Dutch and
Canadian standards.
5.4.56 Aluminium can be used to normalise metal concentrations, since it is naturally present in
marine sediments in high concentrations; it exhibits a strong correlation between grain size
and metal content (i.e. higher concentrations are observed in finer fractions, as expected
for trace metals) and its concentrations are unlikely to be influenced by pollutant inputs.
Normalisation to aluminium has been reported in Appendix C.
5.4.57 Results from the reviewed surveys and assessments would suggest that there is a patchy
distribution of metal contamination within sediment in the MIC area, which may vary
significantly according to locality.
Qatalum EIA Report
Contract No: QA-S1-NHT-B44-5279586 Doc Ref: QA-00-ATK-F15-00001-FINAL
5035013/01-01/EIA 4Dec06 rev02.doc 5-23
5.4.58 As for TPH, the pre-dredging monitoring programme for the Alternative Port concept, will
further investigate metal concentrations in the footprint of works. If high levels are found,
mitigation measures will be adopted to eliminate or minimise the negative effects
associated with the redistribution of the sediments to less contaminated areas. As
discussed above, since TPH contamination is thought to be localised in near-shore areas,
it should be possible to avoid any significantly high levels of contamination.
PCBs
5.4.59 PCB 1254 and 1260 were recorded in all sites collected for the SARC surveys between
2001 and 200333
. Both increased opposite to cooling water discharges and their existence
was suggested to be related to chlorination of cooling water. Concentrations across the
MIC marine area were reported as a mean of approximately 2.9 µg/g. Concentrations at
SARC Transect D were consistent with this mean value. The results from the 2003 survey
revealed that all sites had relatively low PCB levels, ranging from not detectable to 2.278
µg/l. The Qatalum 2005 survey determined that total PCBs were not present above the
limit of detection and so the Original Port Area is not contaminated.
5.5 METEOROLOGY AND CLIMATE
General Climatic Conditions
5.5.1 The south east coast of the Qatar peninsula is typical of typical dry coastal region with an
arid climate. Qatar has a hot subtropical summer climate, with high temperatures, heavy
humidity and high UV radiation levels occurring between April and October. The winter
(November to February) is general more pleasant with lower temperatures and less
humidity. The general climatic conditions of the region are presented in Table 5.3.
Table 5.3 – General Climatic Conditions
Climatic Condition
Temperature & Pressure
Average Maximum Shade Temperature 36oC
Maximum Shade Temperature 49ºC
Average Minimum Shade Temperature 20ºC
Minimum Shade Temperature 3ºC
Maximum Sun Radiation Temperature 84ºC
Average Barometric Pressure 0.98 Bar
Relative Humidity
Absolute Maximum Humidity 100%
Absolute Minimum Humidity 0%
Average Morning Humidity 71%
Average Afternoon Humidity 43 %
Rainfall
Qatalum EIA Report
Contract No: QA-S1-NHT-B44-5279586 Doc Ref: QA-00-ATK-F15-00001-FINAL
5035013/01-01/EIA 4Dec06 rev02.doc 5-24
Climatic Condition
Maximum Annual Rainfall 200 mm
Average Rainfall 81 mm
Minimum Annual Rainfall 13 mm
Wind
Prevailing Wind Direction NW to NNW
5.5.2 In the winter, the climate of the Arabian Gulf is characterised by extra-tropical weather
systems (cold fronts) that generate north westerly winds (known as ‘shamal’) over the
open waters of the Gulf. At a local level, the strength and direction of the shamal winds is
strongly influenced by the topography of the coast, particularly at lower elevations. The
shamal winds generally persist for 2 to 5 days and are the strongest in the region, with
maximum wind speeds of around 45 m/s.
5.5.3 Severe sand storms combined with Northerly winds may occur especially during the period
March to May, with a duration of 4-5 days during daylight hours. These sand storms
(“Shamal”) take two distinct forms, which can occur separately or together. In the first, the
whole atmosphere becomes charged with fine dust, combined with a moderate wind. The
second form occurs at stronger wind speeds and involves heavier sand particles. The
atmosphere can be both salt and sand-laden, with particles down to 2 microns in size.
5.5.4 Throughout the inter-monsoon season (April-October), the prevailing light winds are
occasionally interrupted by ‘nashi’, winds from the north east originating in the Zagros
mountains of Iran that blow for 3 to 5 days. ‘Suhaili’ (south-westerly winds) and ‘kaus’
(south-easterly winds that precede cold fronts) are rarer and much more localised,
generally lasting a few hours each45
.
5.5.5 The most appropriate meteorological station with adequate records in the format required
for the dispersion modelling study is Doha Airport. This station is located at 25.25ºN,
51.57ºE, and is approximately 45 kilometres to the north of Mesaieed. Meteorological
conditions are expected to be similar at the two sites, due to their location on the east
coast of Qatar and the generally flat terrain in the region.
Visibility and Cloud Cover
5.5.6 Data relating to cloud cover is not particularly well documented in the region; however it is
understood that cloud amounts are typically small, with an average coverage of 1/8 to 3/8.
The heaviest cloud cover (6/8 to 8/8) is observed between June and September.
5.5.7 Visibility is affected by sand storms (as noted above) and, particularly in coastal regions,
by morning fog. These tend to peak in frequency at different times. Generally, visibility is
affect by sand storms in the summer and by fog in the winter months.
Qatalum EIA Report
Contract No: QA-S1-NHT-B44-5279586 Doc Ref: QA-00-ATK-F15-00001-FINAL
5035013/01-01/EIA 4Dec06 rev02.doc 5-25
Temperature
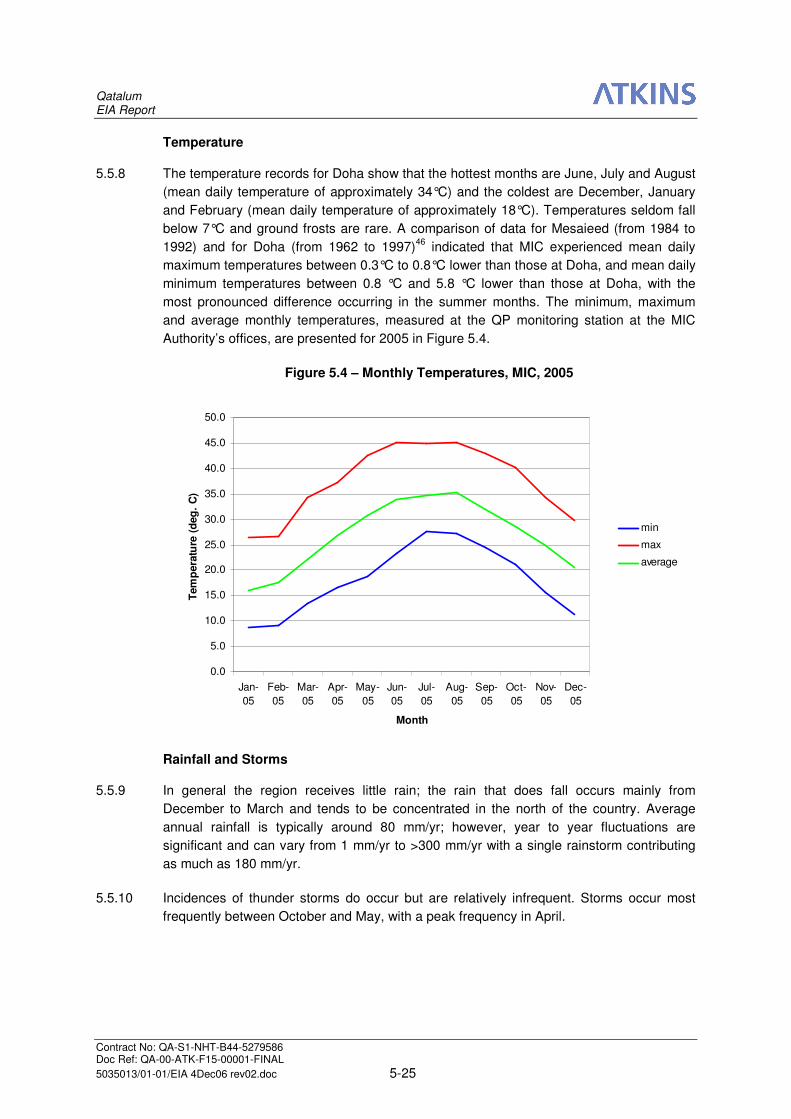
5.5.8 The temperature records for Doha show that the hottest months are June, July and August
(mean daily temperature of approximately 34°C) and the coldest are December, January
and February (mean daily temperature of approximately 18°C). Temperatures seldom fall
below 7°C and ground frosts are rare. A comparison of data for Mesaieed (from 1984 to
1992) and for Doha (from 1962 to 1997)46
indicated that MIC experienced mean daily
maximum temperatures between 0.3°C to 0.8°C lower than those at Doha, and mean daily
minimum temperatures between 0.8 °C and 5.8 °C lower than those at Doha, with the
most pronounced difference occurring in the summer months. The minimum, maximum
and average monthly temperatures, measured at the QP monitoring station at the MIC
Authority’s offices, are presented for 2005 in Figure 5.4.
Figure 5.4 – Monthly Temperatures, MIC, 2005
0.0
5.0
10.0
15.0
20.0
25.0
30.0
35.0
40.0
45.0
50.0
Jan-
05
Feb-
05
Mar-
05
Apr-
05
May-
05
Jun-
05
Jul-
05
Aug-
05
Sep-
05
Oct-
05
Nov-
05
Dec-
05
Month
Tem
pera
ture
(d
eg
. C
)
min
max
average
Rainfall and Storms
5.5.9 In general the region receives little rain; the rain that does fall occurs mainly from
December to March and tends to be concentrated in the north of the country. Average
annual rainfall is typically around 80 mm/yr; however, year to year fluctuations are
significant and can vary from 1 mm/yr to >300 mm/yr with a single rainstorm contributing
as much as 180 mm/yr.
5.5.10 Incidences of thunder storms do occur but are relatively infrequent. Storms occur most
frequently between October and May, with a peak frequency in April.
Qatalum EIA Report
Contract No: QA-S1-NHT-B44-5279586 Doc Ref: QA-00-ATK-F15-00001-FINAL
5035013/01-01/EIA 4Dec06 rev02.doc 5-26
Wind
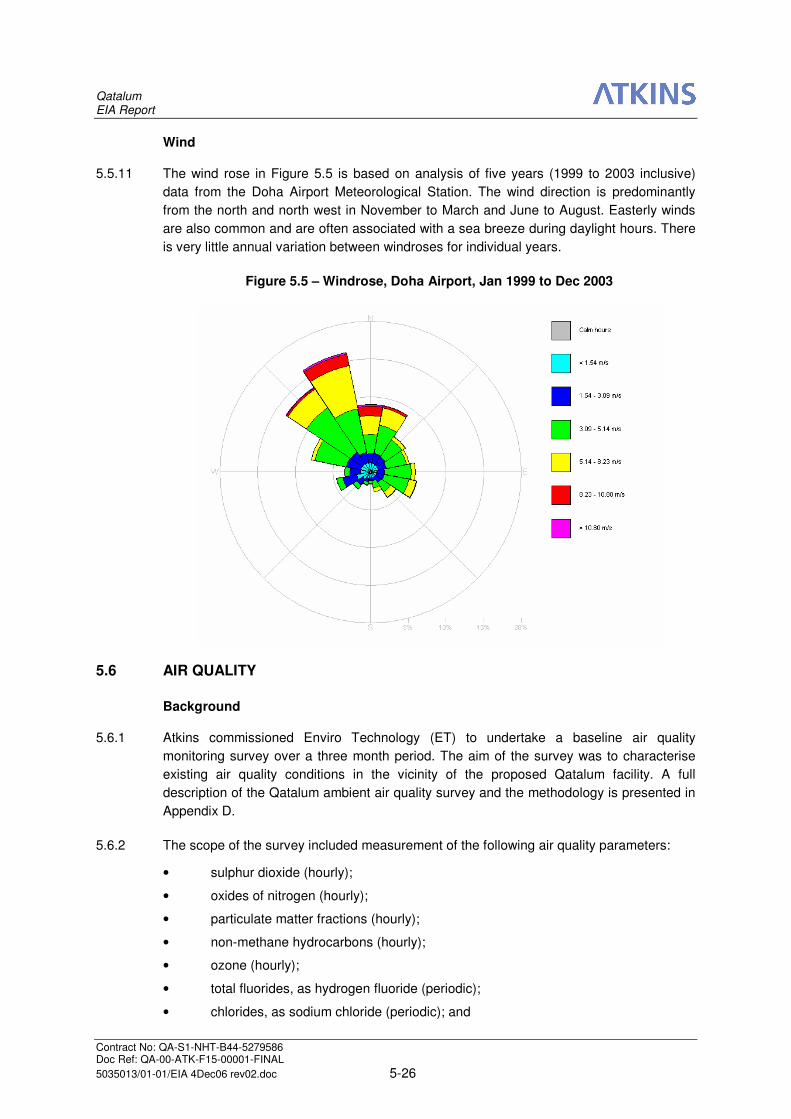
5.5.11 The wind rose in Figure 5.5 is based on analysis of five years (1999 to 2003 inclusive)
data from the Doha Airport Meteorological Station. The wind direction is predominantly
from the north and north west in November to March and June to August. Easterly winds
are also common and are often associated with a sea breeze during daylight hours. There
is very little annual variation between windroses for individual years.
Figure 5.5 – Windrose, Doha Airport, Jan 1999 to Dec 2003
5.6 AIR QUALITY
Background
5.6.1 Atkins commissioned Enviro Technology (ET) to undertake a baseline air quality
monitoring survey over a three month period. The aim of the survey was to characterise
existing air quality conditions in the vicinity of the proposed Qatalum facility. A full
description of the Qatalum ambient air quality survey and the methodology is presented in
Appendix D.
5.6.2 The scope of the survey included measurement of the following air quality parameters:
• sulphur dioxide (hourly);
• oxides of nitrogen (hourly);
• particulate matter fractions (hourly);
• non-methane hydrocarbons (hourly);
• ozone (hourly);
• total fluorides, as hydrogen fluoride (periodic);
• chlorides, as sodium chloride (periodic); and
Qatalum EIA Report
Contract No: QA-S1-NHT-B44-5279586 Doc Ref: QA-00-ATK-F15-00001-FINAL
5035013/01-01/EIA 4Dec06 rev02.doc 5-27
• polycyclic aromatic hydrocarbons (periodic).
5.6.3 A description of the environmental significance of these substances is provided in
Appendix D, Annex B.
5.6.4 In addition to the results from the Qatalum survey, ambient air quality data have been
purchased from the MIC Authority and provided by QP; these data are discussed further
below.
Qatalum Air Quality Survey
5.6.5 The monitoring station was located approximately 20 m north of Crushed Stone Indoor
Substation 10704, in the Gabbro Berth area of MIC, approximately 1 km from the Qatalum
Site boundary (see Figure 5.6). This site was selected as it was considered to be
representative of the location of the proposed Qatalum Site. Monitoring was undertaken
for the period 21st September 2005 until 17
th January 2006 inclusive. The survey
methodology and subsequent results are presented in full in Appendix D. The results are
summarised and compared to the SCENR air quality standards in Table 5.4; for averaging
periods where SCENR standards are not available the draft MIC Guidelines have been
used, as indicated. Air quality standards are discussed in more detail in Section 2.6 of this
report.
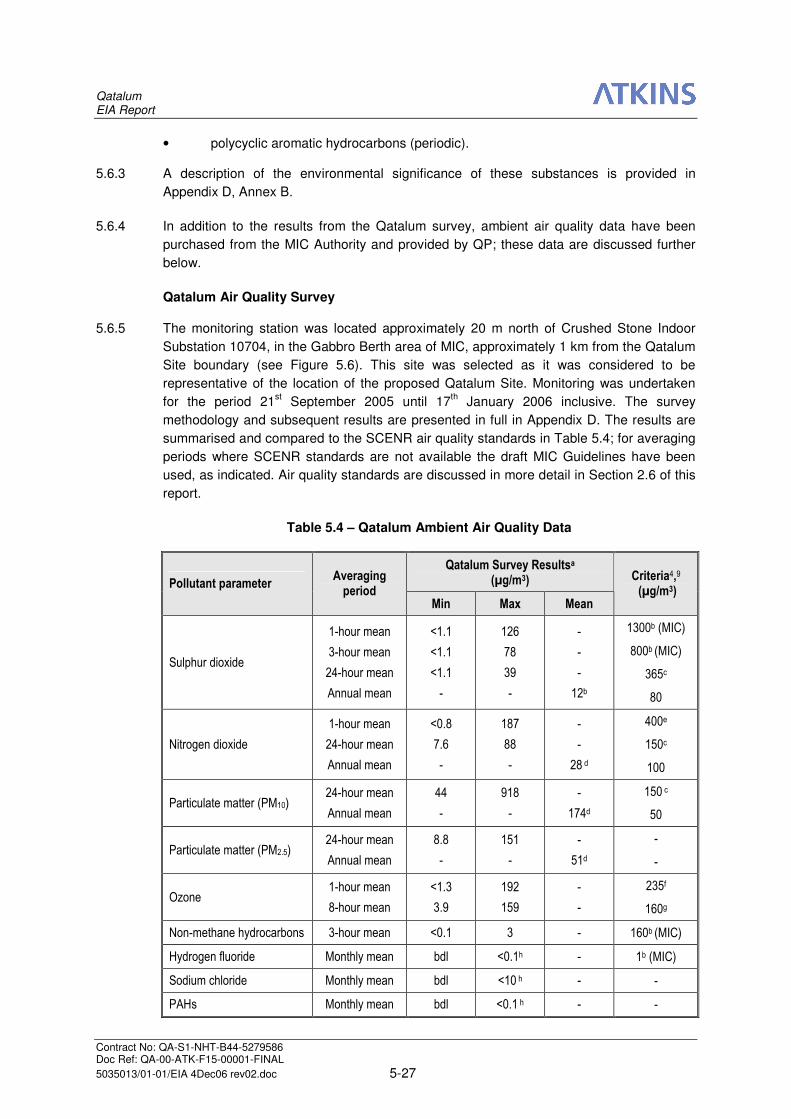
Table 5.4 – Qatalum Ambient Air Quality Data
Qatalum Survey Resultsa (µg/m3) Pollutant parameter
Averaging period
Min Max Mean
Criteria4,9 (µg/m3)
Sulphur dioxide
1-hour mean
3-hour mean
24-hour mean
Annual mean
<1.1
<1.1
<1.1
-
126
78
39
-
-
-
-
12b
1300b (MIC)
800b (MIC)
365c
80
Nitrogen dioxide
1-hour mean
24-hour mean
Annual mean
<0.8
7.6
-
187
88
-
-
-
28 d
400e
150c
100
Particulate matter (PM10) 24-hour mean
Annual mean
44
-
918
-
-
174d
150 c
50
Particulate matter (PM2.5) 24-hour mean
Annual mean
8.8
-
151
-
-
51d
-
-
Ozone 1-hour mean
8-hour mean
<1.3
3.9
192
159
-
-
235f
160g
Non-methane hydrocarbons 3-hour mean <0.1 3 - 160b (MIC)
Hydrogen fluoride Monthly mean bdl <0.1h - 1b (MIC)
Sodium chloride Monthly mean bdl <10 h - -
PAHs Monthly mean bdl <0.1 h - -
Qatalum EIA Report
Contract No: QA-S1-NHT-B44-5279586 Doc Ref: QA-00-ATK-F15-00001-FINAL
5035013/01-01/EIA 4Dec06 rev02.doc 5-28
Notes:
“-“ denotes no value
Bdl – below detection limit
a Mean values are only meaningful for the annual averaging period, for all other averaging period the
minimum and maximum measured values have been presented.
b The draft, non-statutory MIC Guideline values, 1-hr, 3-hr and 24-hr criteria are not to be exceeded
more than once a year.
c 99.7th percentile of daily averages during the period of one calendar year (1 exceedence of 24-hourly
standard per annum permitted).
d It is assumed that the 119 day sampling period is sufficiently representative of long-term conditions to
allow comparison with the annual mean criteria.
e 99.9th percentile of 1 hour measurements during the period of one calendar year (9 exceedences of 1-
hourly standard per annum permitted).
f 99.7th percentile (3 exceedences of 1-hourly standard per annum permitted but not in the same 24
hour period).
g 98th percentile (22 exceedences of 8-hourly standard per annum permitted).
h Approximate value - all of the samples collected for fluoride, chloride and PAH analysis were found to
be below the limits of analytical detection; thus, approximate maximum values have been derived
based on these detection limits.
5.6.6 The measured concentrations of sulphur dioxide and nitrogen dioxide were well below the
Qatari environmental criteria at all times. There are no SCENR criteria for hydrocarbons;
however, the results from the Qatalum air quality survey showed these compounds to be
present at very low concentrations and well below the draft MIC Guidelines9.
5.6.7 Hourly mean concentrations of ozone were well below the applicable criterion at all times;
however, the highest recorded 8-hour mean was only just below the applicable criterion.
5.6.8 The maximum recorded 24-hourly mean concentration of PM10 was well above the
applicable criteria. The SCENR criterion of 150 µg/m3, as a 24-hourly mean, was
exceeded 54 times during the 119 day monitoring period. Assuming conditions during the
monitoring period were representative of long-term conditions, this gives a pro rata
number of exceedences of the 24-hourly mean of 166 days per year, or 45% of the time.
The annual mean PM10 concentration is expected to be in the order of 350% of the annual
mean SCENR criteria. There are currently no air quality criteria for PM2.5 in Qatar,
5.6.9 The high concentrations of particulate fractions are not atypical of an arid environment,
such as Mesaieed and the Qatar peninsula in general. Although no particle morphology
has been determined, it is likely that the majority of particulates are of non-anthropogenic
(mineral) origin. The SCENR criteria make no derogation for particulates of mineral origin;
however, for areas with this type of climate, there are few, if any, practicable measures for
controlling non-anthropogenic dust sources.
5.6.10 For all hydrogen fluoride samples analysed, the concentration of this substance were
found to be below the limits of analytical detection and within the proposed draft MIC
Guideline9.
5.6.11 There are currently no SCENR criteria for NaCl or PAH; however, for all of the samples
collected for chloride and PAH analysis, the concentrations of these substances were
found to be below the limits of analytical detection.
Qatalum EIA Report
Contract No: QA-S1-NHT-B44-5279586 Doc Ref: QA-00-ATK-F15-00001-FINAL
5035013/01-01/EIA 4Dec06 rev02.doc 5-29
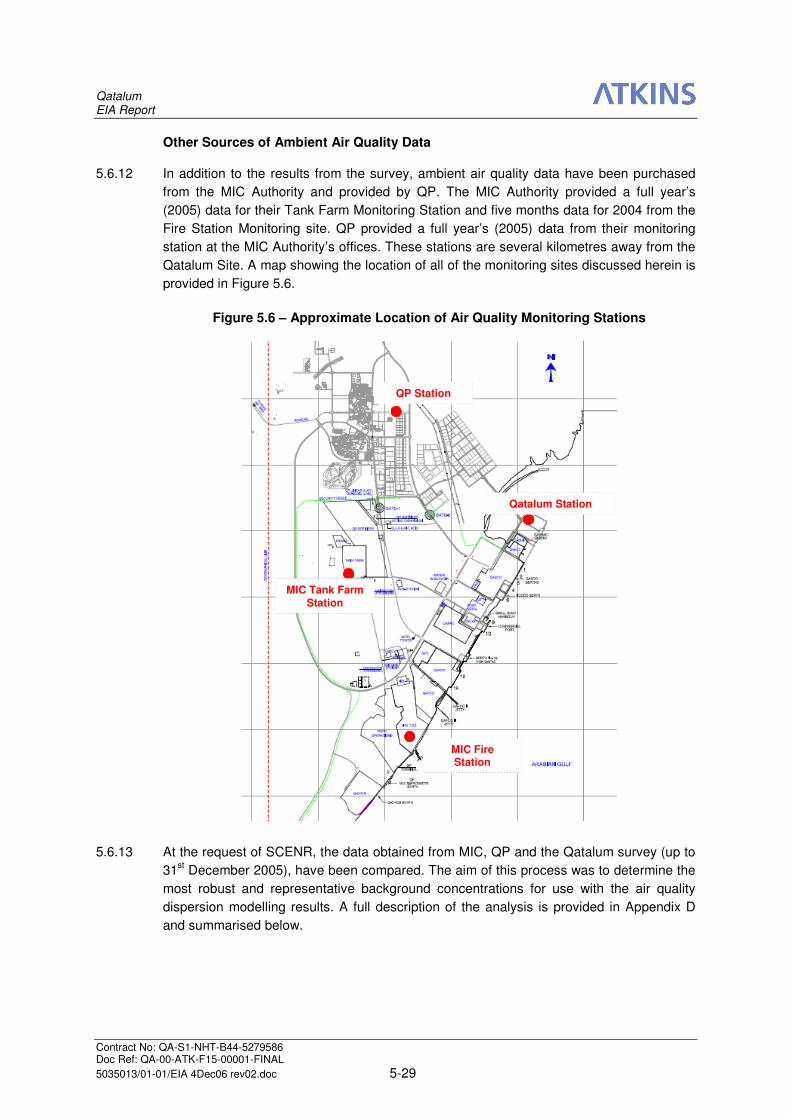
Other Sources of Ambient Air Quality Data
5.6.12 In addition to the results from the survey, ambient air quality data have been purchased
from the MIC Authority and provided by QP. The MIC Authority provided a full year’s
(2005) data for their Tank Farm Monitoring Station and five months data for 2004 from the
Fire Station Monitoring site. QP provided a full year’s (2005) data from their monitoring
station at the MIC Authority’s offices. These stations are several kilometres away from the
Qatalum Site. A map showing the location of all of the monitoring sites discussed herein is
provided in Figure 5.6.
Figure 5.6 – Approximate Location of Air Quality Monitoring Stations
QP Station
MIC Fire Station
MIC Tank Farm
Station
Qatalum Station
QP Station
MIC Fire Station
MIC Tank Farm
Station
Qatalum Station
5.6.13 At the request of SCENR, the data obtained from MIC, QP and the Qatalum survey (up to
31st December 2005), have been compared. The aim of this process was to determine the
most robust and representative background concentrations for use with the air quality
dispersion modelling results. A full description of the analysis is provided in Appendix D
and summarised below.
Qatalum EIA Report
Contract No: QA-S1-NHT-B44-5279586 Doc Ref: QA-00-ATK-F15-00001-FINAL
5035013/01-01/EIA 4Dec06 rev02.doc 5-30
5.6.14 The pollutant parameters of interest that are common to all data sets are sulphur dioxide,
nitrogen dioxide, particulate matter (PM10) and ozone. The Qatari standards for the first
three parameters include a 24 hour mean averaging period, whilst the nearest averaging
period for ozone is an 8 hour mean. The period of overlap between the data sets (with the
exception of the MIC Fire Station data) was from 21st September 2005 to 31
st December
2005. Thus, the comparative analysis focused on these pollutants and averaging periods
as recorded over the three and a half month overlap period.
5.6.15 The Atkins and QP data are robust and well validated data sets. The MIC Tank Farm data
did not appear to be validated; clearly erroneous readings had not been removed or
adjusted following calibration and instrument drift correction. In addition, significant
proportions of the data were reported as negative values, at concentrations below the
effective limit of detection or at improbably constant values. None of the Tank farm station
monitoring instruments appeared to have been calibrated during the overlap period. Thus,
data from the Tank Farm should be treated with extreme caution and these data have not
been considered further for use in the EIA; however, they were included for comparative
purposes in the comparison study in Appendix D. The MIC Fire Station data was of similar
quality; this, coupled with the fact that these data are for a different year (2004) to the
other data sets resulted in these data not been considered further.
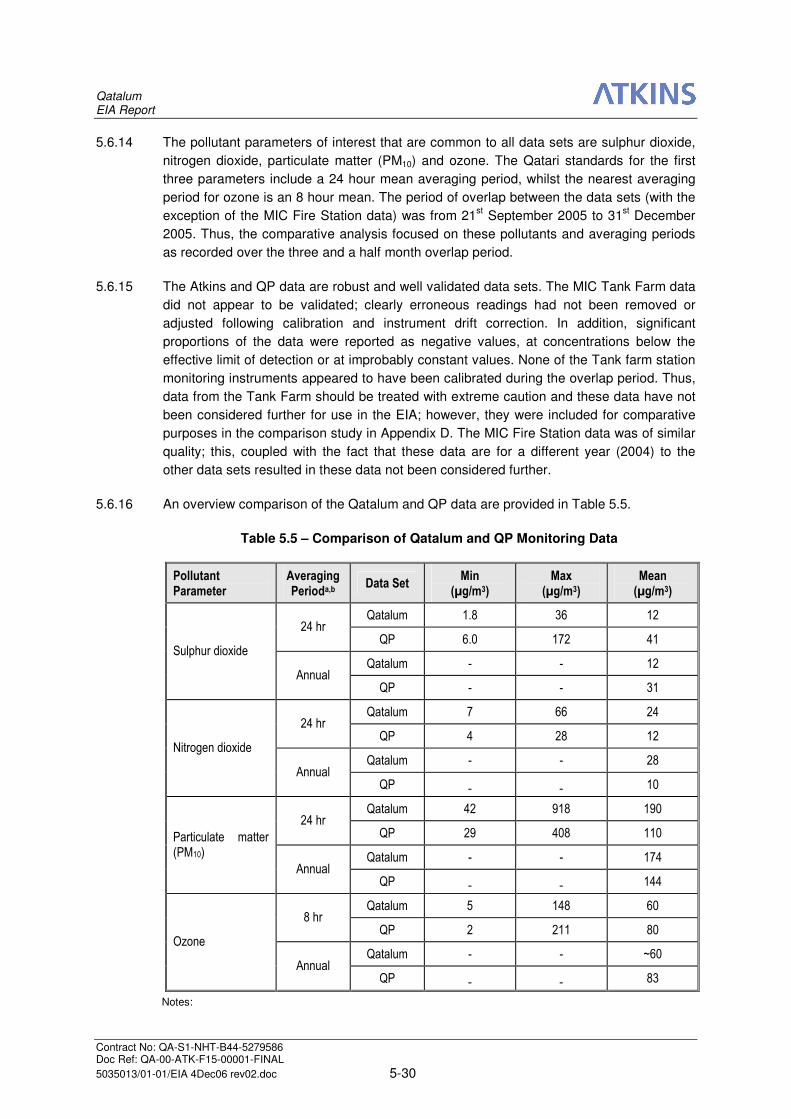
5.6.16 An overview comparison of the Qatalum and QP data are provided in Table 5.5.
Table 5.5 – Comparison of Qatalum and QP Monitoring Data
Pollutant Parameter
Averaging Perioda,b
Data Set Min
(µg/m3) Max
(µg/m3) Mean (µg/m3)
Qatalum 1.8 36 12 24 hr
QP 6.0 172 41
Qatalum - - 12 Sulphur dioxide
Annual QP - - 31
Qatalum 7 66 24 24 hr
QP 4 28 12
Qatalum - - 28 Nitrogen dioxide
Annual QP - - 10
Qatalum 42 918 190 24 hr
QP 29 408 110
Qatalum - - 174
Particulate matter (PM10)
Annual QP - - 144
Qatalum 5 148 60 8 hr
QP 2 211 80
Qatalum - - ~60 Ozone
Annual QP - - 83
Notes:
Qatalum EIA Report
Contract No: QA-S1-NHT-B44-5279586 Doc Ref: QA-00-ATK-F15-00001-FINAL
5035013/01-01/EIA 4Dec06 rev02.doc 5-31
a All data presented for daily and 8 hour averaging periods are from 21st Sept – 31st December 2005,
thus there will be some discrepancies between the Qatalum data in this Table compared to that in
Table 5.4, since the data in Table 5.4 also include measurements made in January 2006.
b The Qatalum annual averages are estimated on the basis of the 119 day monitoring period being
representative of a full year. The QP annual averages have been determined from the full 2005 data
set, thus there may be discrepancies between the results for annual averaging periods compared to the
mean values for shorter averaging periods.
5.6.17 Annual average sulphur dioxide concentrations are 2 to 3 times higher at the QP station
than at the Qatalum station, whereas the converse is true for nitrogen dioxide. The ozone
measured results are more comparable. Measured PM10 concentrations are notably higher
at the Qatalum Site, probably due to the undeveloped, dry and dusty nature of the site.
Overall, the results of the comparison demonstrate that there is a larger variation that
might typically be expected between the data sets.
5.6.18 Statistical tools were employed to determine whether there was any direct correlation
between the data sets. The correlation analysis showed that the greatest correlation was
observed for nitrogen dioxide; however, overall the correlation between the data sets was
poor, suggesting that there are genuine differences in local air quality between the two
monitoring locations. It is reasonable to assume that the Qatalum monitoring site data
provide the most reliable indication of air quality at the Qatalum Site, due to the closer
proximity of that monitoring station to the site.
Summary
5.6.19 In conclusion, the period (annual) average pollutant concentrations from the Qatalum
monitoring station may be reasonably assumed to approximate to annual average
background conditions at the Qatalum Site. However, to ensure that a conservative
approach is taken, the highest of the Qatalum and QP monitoring data will be used to
represent background concentrations for use in combination with the results from the
atmospheric dispersion modelling; these are summarised in Table 5.6.
Table 5.6 – Summary of Background Air Quality Data for use with Modelling Results
Pollutant Parameter Long-term Average
Baseline Concentration (µg/m3)
Sulphur dioxide 31
Nitrogen dioxide 28
Particulate matter (PM10) 174
Hydrogen fluoride <0.1
PAHs <0.1
Qatalum EIA Report
Contract No: QA-S1-NHT-B44-5279586 Doc Ref: QA-00-ATK-F15-00001-FINAL
5035013/01-01/EIA 4Dec06 rev02.doc 5-32
5.7 TERRESTRIAL ECOLOGY AND BIRDS
5.7.1 A preliminary terrestrial ecology survey was carried out in April 2005, the objective of the
survey was to:
• undertake an initial assessment of the Main Site and the information currently
available with regard to baseline terrestrial ecology; and
• carry out a preliminary desk review of plant species present that may be sensitive
to/indicators of fluoride emissions.
5.7.2 As a result of the initial survey, further consultations with key groups/individuals were held
and a winter bird survey was carried out. The text presented hereunder is a summary of
the findings from:
• a review of previous environmental studies of other developments in the vicinity of
the proposed Qatalum Site;
• a literature review on the ecology of Qatar;
• the initial ecological field survey conducted by an Atkins ecologist in April 2005;
• various consultations;
• the winter bird survey, conducted in January - February 2006; and
• site walkovers, conducted in August 2006, of the locations identified for the
Alternative Port Area concept, the construction workers’ camp and the potential
area for the storage / dewatering of dredged materials.
5.7.3 Full details of the consultations, literature review and survey methodology, including a full
report of the winter waterbird survey, can be found in Appendix E; a summary is included
in the following Sections.
Ecological Setting of the Site
5.7.4 The proposed Qatalum Main Site area is located on undeveloped land within an existing
heavily industrialised area. Part of the site has previously been reclaimed. With the
exception of a reedbed and lagoon (discussed further below), the site hosts very little
vegetation or features of ecological interest.
5.7.5 Within the proposed site boundary is an area of artificially created reedbed associated with
the MIC sewage treatment works (see Figure 3.6 and Figure 5.8). To the south east of the
proposed site is an artificially created marine “lagoon”, which was formed by the enclosure
of the southern end of a previously open bay, as a result of the construction of the Gabbro
Berth and Causeway.
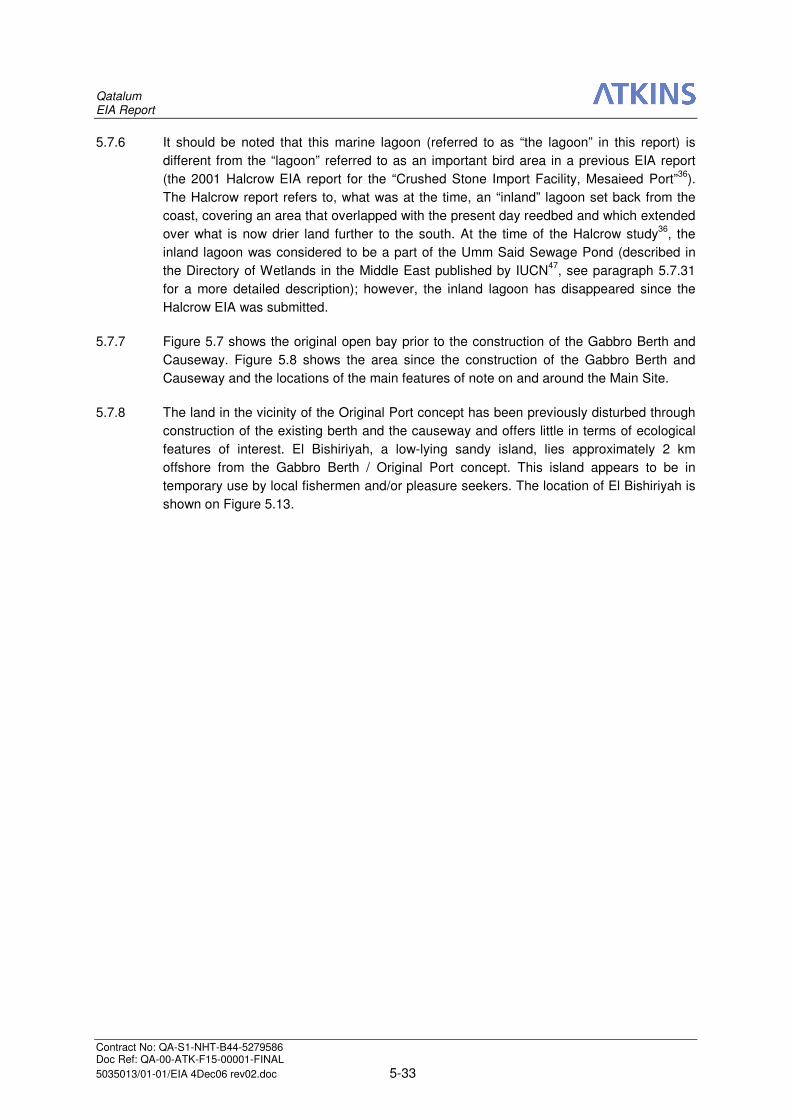
Qatalum EIA Report
Contract No: QA-S1-NHT-B44-5279586 Doc Ref: QA-00-ATK-F15-00001-FINAL
5035013/01-01/EIA 4Dec06 rev02.doc 5-33
5.7.6 It should be noted that this marine lagoon (referred to as “the lagoon” in this report) is
different from the “lagoon” referred to as an important bird area in a previous EIA report
(the 2001 Halcrow EIA report for the “Crushed Stone Import Facility, Mesaieed Port”36
).
The Halcrow report refers to, what was at the time, an “inland” lagoon set back from the
coast, covering an area that overlapped with the present day reedbed and which extended
over what is now drier land further to the south. At the time of the Halcrow study36
, the
inland lagoon was considered to be a part of the Umm Said Sewage Pond (described in
the Directory of Wetlands in the Middle East published by IUCN47
, see paragraph 5.7.31
for a more detailed description); however, the inland lagoon has disappeared since the
Halcrow EIA was submitted.
5.7.7 Figure 5.7 shows the original open bay prior to the construction of the Gabbro Berth and
Causeway. Figure 5.8 shows the area since the construction of the Gabbro Berth and
Causeway and the locations of the main features of note on and around the Main Site.
5.7.8 The land in the vicinity of the Original Port concept has been previously disturbed through
construction of the existing berth and the causeway and offers little in terms of ecological
features of interest. El Bishiriyah, a low-lying sandy island, lies approximately 2 km
offshore from the Gabbro Berth / Original Port concept. This island appears to be in
temporary use by local fishermen and/or pleasure seekers. The location of El Bishiriyah is
shown on Figure 5.13.
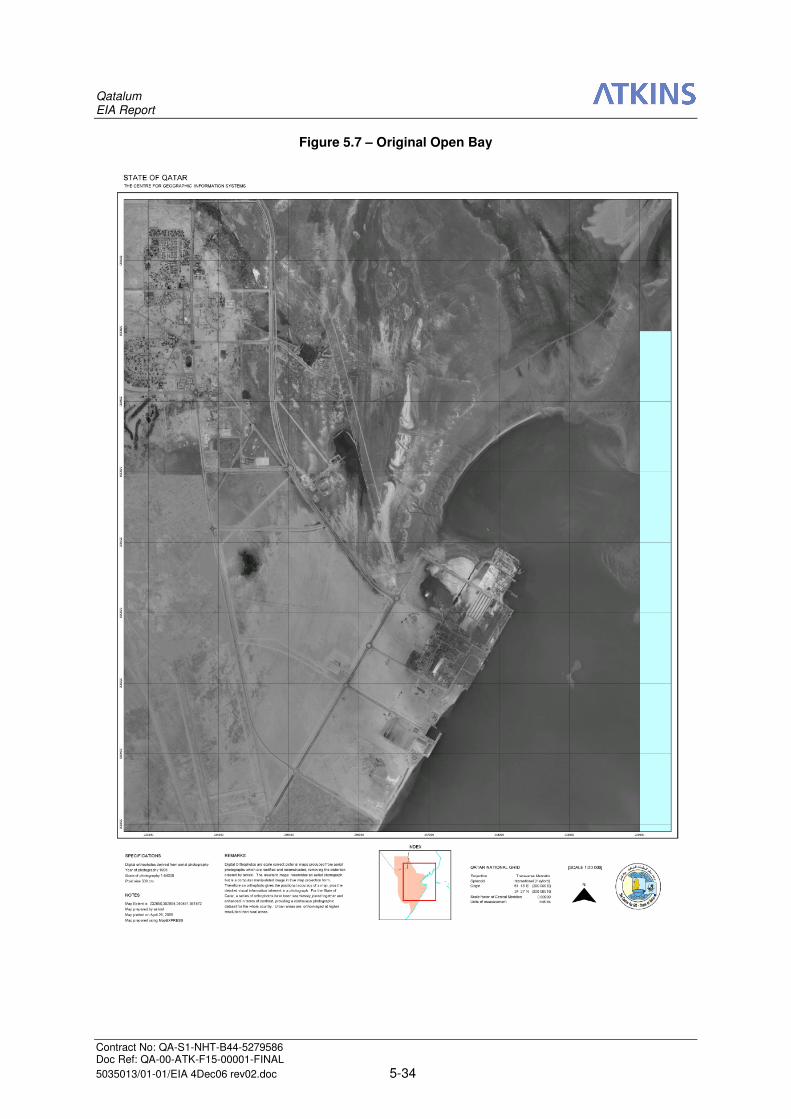
Qatalum EIA Report
Contract No: QA-S1-NHT-B44-5279586 Doc Ref: QA-00-ATK-F15-00001-FINAL
5035013/01-01/EIA 4Dec06 rev02.doc 5-34
Figure 5.7 – Original Open Bay
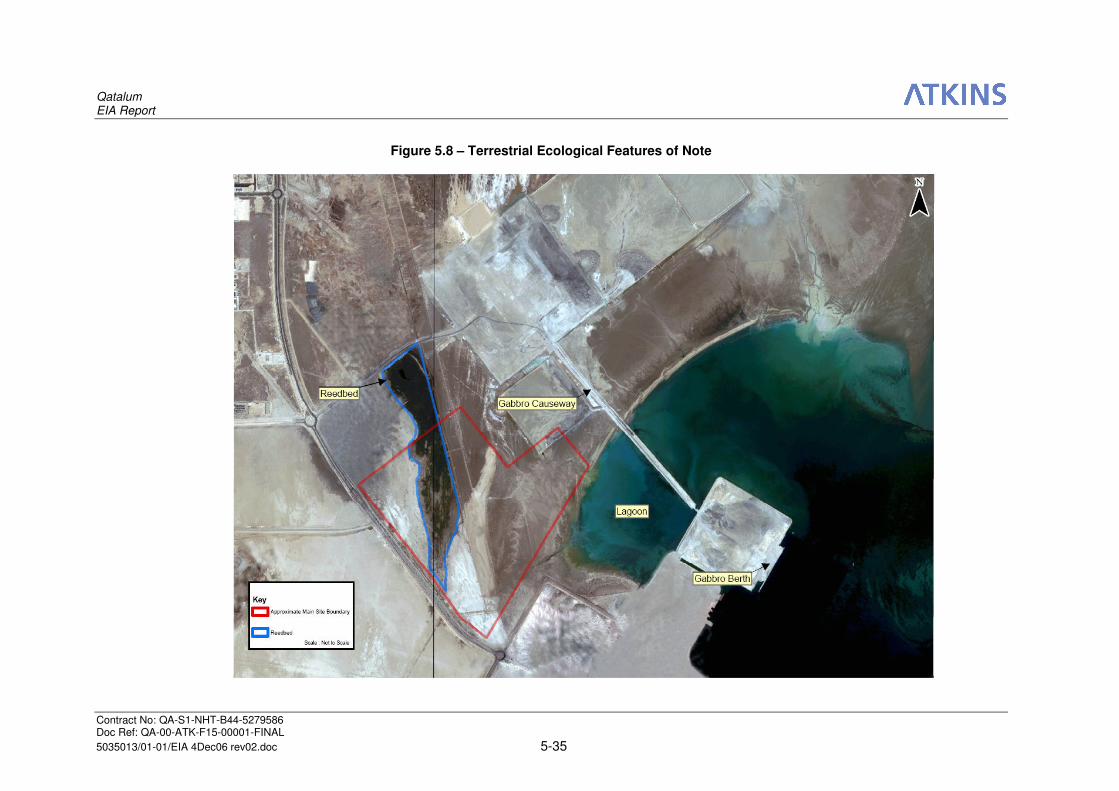
Qatalum EIA Report
Contract No: QA-S1-NHT-B44-5279586 Doc Ref: QA-00-ATK-F15-00001-FINAL
5035013/01-01/EIA 4Dec06 rev02.doc 5-35
Figure 5.8 – Terrestrial Ecological Features of Note
Qatalum EIA Report
Contract No: QA-S1-NHT-B44-5279586 Doc Ref: QA-00-ATK-F15-00001-FINAL
5035013/01-01/EIA 4Dec06 rev02.doc 5-36
5.7.9 The onshore area set aside for the Alternative Port facilities (see Figure 3.4), including the
service corridor, is a flat, sandy, area. It is understood that this area is at least partly
reclaimed, however, the present day surface appears to be relatively undisturbed ground.
Since access to the area has been limited, the halophytic vegetation is in reasonable
condition and land cover, in terms of vegetation, is reasonable in comparison to
neighbouring coastal areas. However, because this habitat is isolated within an industrial
area already earmarked for development, it is of lower conservation value than an
equivalent area along an open stretch of coast. Figure 5.9 presents an overview
photograph of the Alternative Port Area, showing the Small Boat Harbour in the forefront,
the port operation office (the red tower-like building), the MIC electrical substation (behind
the port operation office) and the QASCO steel works on the far right. Figure 5.10 provides
a closer view of the land surface and vegetation; the view is looking north east towards the
substation, along side which the Qatalum service corridor would run.
Figure 5.9 – Overview of the Alternative Port Area
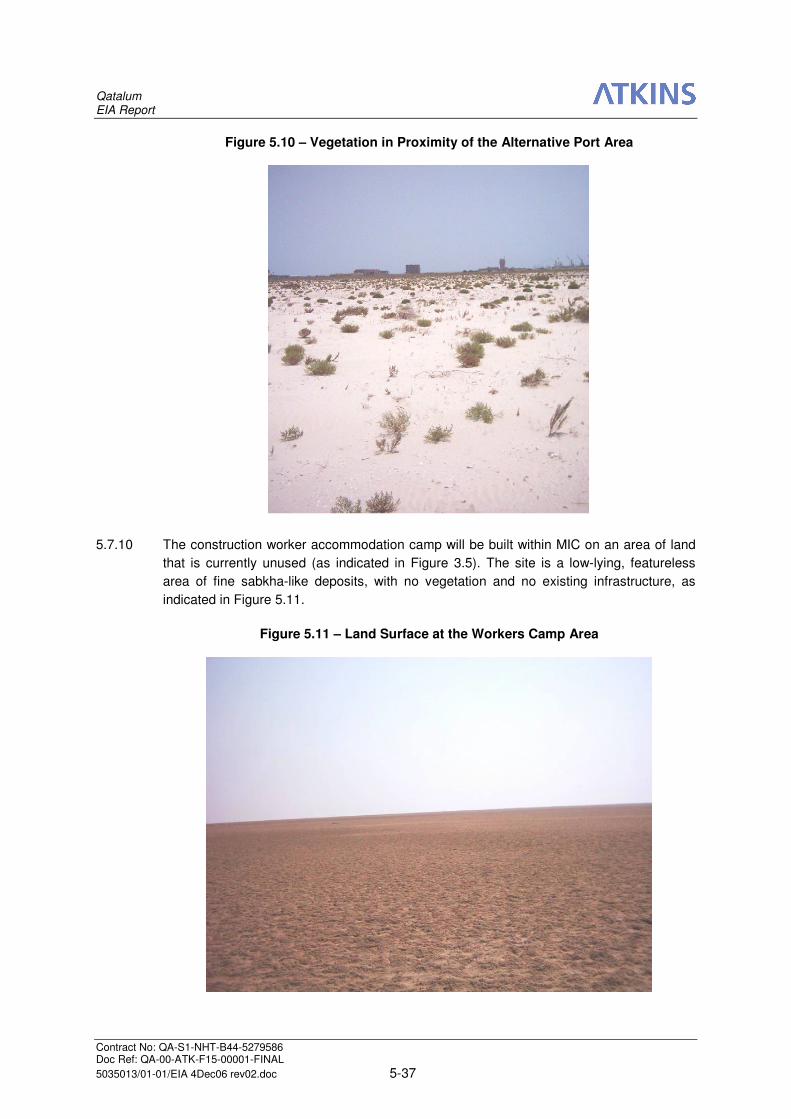
Qatalum EIA Report
Contract No: QA-S1-NHT-B44-5279586 Doc Ref: QA-00-ATK-F15-00001-FINAL
5035013/01-01/EIA 4Dec06 rev02.doc 5-37
Figure 5.10 – Vegetation in Proximity of the Alternative Port Area
5.7.10 The construction worker accommodation camp will be built within MIC on an area of land
that is currently unused (as indicated in Figure 3.5). The site is a low-lying, featureless
area of fine sabkha-like deposits, with no vegetation and no existing infrastructure, as
indicated in Figure 5.11.
Figure 5.11 – Land Surface at the Workers Camp Area
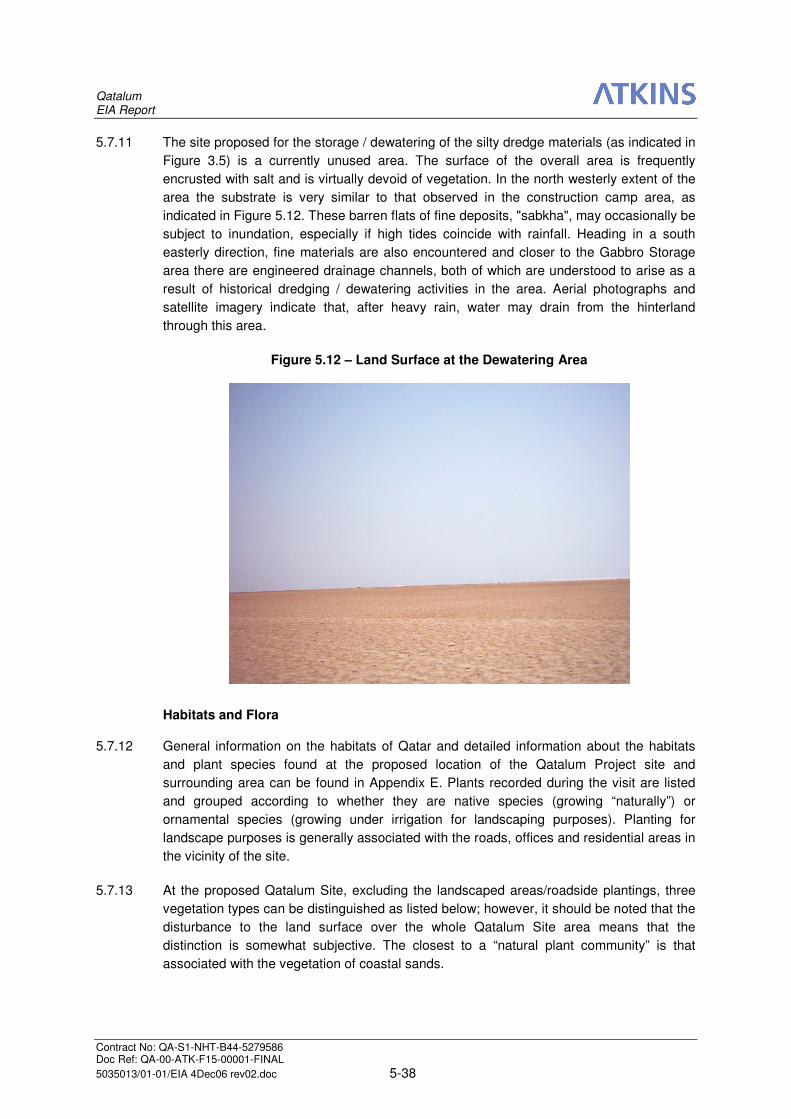
Qatalum EIA Report
Contract No: QA-S1-NHT-B44-5279586 Doc Ref: QA-00-ATK-F15-00001-FINAL
5035013/01-01/EIA 4Dec06 rev02.doc 5-38
5.7.11 The site proposed for the storage / dewatering of the silty dredge materials (as indicated in
Figure 3.5) is a currently unused area. The surface of the overall area is frequently
encrusted with salt and is virtually devoid of vegetation. In the north westerly extent of the
area the substrate is very similar to that observed in the construction camp area, as
indicated in Figure 5.12. These barren flats of fine deposits, "sabkha", may occasionally be
subject to inundation, especially if high tides coincide with rainfall. Heading in a south
easterly direction, fine materials are also encountered and closer to the Gabbro Storage
area there are engineered drainage channels, both of which are understood to arise as a
result of historical dredging / dewatering activities in the area. Aerial photographs and
satellite imagery indicate that, after heavy rain, water may drain from the hinterland
through this area.
Figure 5.12 – Land Surface at the Dewatering Area
Habitats and Flora
5.7.12 General information on the habitats of Qatar and detailed information about the habitats
and plant species found at the proposed location of the Qatalum Project site and
surrounding area can be found in Appendix E. Plants recorded during the visit are listed
and grouped according to whether they are native species (growing “naturally”) or
ornamental species (growing under irrigation for landscaping purposes). Planting for
landscape purposes is generally associated with the roads, offices and residential areas in
the vicinity of the site.
5.7.13 At the proposed Qatalum Site, excluding the landscaped areas/roadside plantings, three
vegetation types can be distinguished as listed below; however, it should be noted that the
disturbance to the land surface over the whole Qatalum Site area means that the
distinction is somewhat subjective. The closest to a “natural plant community” is that
associated with the vegetation of coastal sands.
Qatalum EIA Report
Contract No: QA-S1-NHT-B44-5279586 Doc Ref: QA-00-ATK-F15-00001-FINAL
5035013/01-01/EIA 4Dec06 rev02.doc 5-39
• Vegetation of Coastal Sands. This corresponds closely to the Halopeplis
perfoliata community described by Batanouny48
and occurs along the southern
and eastern shoreline of the lagoon, with the halophytes Halopeplis perfoliata,
Halocnemum strobilaceum, Salsola imbricata and Suaeda vermiculata growing
closest to the shoreline. This is merged with a “less halophytic” community of
Zygophyllum qatarense, Z. simplex and Herniaria hemistemon set a little further
back from the shore on ground that is slightly higher and therefore less likely to be
inundated by the sea. The latter two species also occur together, along with
Halopeplis perfoliata, on made ground further to the west;
• Reedbed Vegetation. Almost entirely dominated by the 3 m tall reed Phragmites
australis. This is associated with the discharge of treated sewage effluent from the
adjoining MIC sewage treatment plant;
• Vegetation Fringing the Reedbed, including disturbed ground. The grasses
Aeluropus lagopoides and Polypogon monspeliensis, the rush Juncus rigidus
(=arabicus) and the chenopods Suaeda vermiculata and Halopeplis perfoliata are
perhaps the more natural part of this community, growing on land that is
sometimes inundated by the surplus treated sewage effluent when it spreads
beyond the main reedbed. The more disturbed ground, sometimes raised, typically
hosts salt-tolerant species such as the grasses Sporobolus ioclados and S.
spicatus, the succulent shrubs Suaeda vermiculata and S. aegyptiaca and small
shrubs/trees such as Tamarix sp. and the naturalised mesquite Prosopis juliflora.
5.7.14 The surface of the remainder of the site and its immediate environs is either heavily
disturbed or comprises made ground. Much of the land is criss-crossed either by graded or
black-top roads (e.g. the road to the Gabbro Berth) or informal tracks. Alongside the roads,
much of the surface “soil” has been scraped to provide material for construction. The land
cover in terms of vegetation is therefore very limited. However, scattered plants will and do
grow on this made/disturbed ground.
5.7.15 Vegetation at the Alternative Port Area can be classified as “Vegetation of Coastal Sands”,
with typical salt-tolerant species present that can exist in harsh, arid conditions. It is
estimated that the percentage cover of vegetation varies from approximately 0% to as
much as 40% in some locations, with members of the Chenopodiaceae (goosefoot) family
being the most abundant. Annuals, including grasses, might appear after rain.
5.7.16 As noted previously, the majority of the storage / dewatering area for dredged material and
the workers construction camp area are essentially devoid of vegetation.
Plant Species that May be Sensitive to Fluoride
5.7.17 The Qatalum facility will emit fluorides to the atmosphere which, depending on ambient
concentrations and deposition rates, could potentially have an impact on local vegetation.
The terrestrial ecological survey conducted at MIC identified various species of plants,
both indigenous and introduced. As part of the baseline ecological assessment, a desk
based literature review was undertaken to determine the sensitivities of the plant species
identified at MIC to atmospheric fluoride. A study was also undertaken to determine
whether any of the existing vegetation could act as indicator species for fluorides. The
details of this are provided in Appendix E and summarised below.
Qatalum EIA Report
Contract No: QA-S1-NHT-B44-5279586 Doc Ref: QA-00-ATK-F15-00001-FINAL
5035013/01-01/EIA 4Dec06 rev02.doc 5-40
5.7.18 It was found that the sensitivity to atmospheric fluoride of plant species found at MIC
varies from sensitive to very tolerant. Of the landscaping and ornamental plants, the most
sensitive species are Aloe vera (a member of the Liliacae family), described as “sensitive”,
the Canna lily (Canna sp.) and Date palm (Phoenix dactylifera), classified as “sensitive to
intermediate”. Prickly pear and Oleander are described as being very tolerant species.
Jezierska-Madziar and Pińskwar49
found that fluoride contamination of a reservoir in a
polluted region of Poland caused significant accumulation of fluoride in its common reeds
(Phragmites australis), with submerged parts of the reeds being affected most severely;
this species of reed is present at MIC.
5.7.19 Lilies and palms are mentioned in Weinstein and Davison50
as being bio-indicator species
for fluorides; however, the particular varieties of these plants identified at MIC are not
listed in the literature. Prior to start-up of the plant, it is recommended that further
investigation of Aloe vera, canna lily and date palm is considered to determine their
suitability as bio-indicators of fluoride emissions at MIC.
Non-Avian Fauna
5.7.20 Mesaieed supports at least three species of mammal, most of which are likely to be
widespread and locally common in Qatar. These include Red Fox, Vulpes vulpes, Cape or
Brown Hare, Lepus capensis and Sundervall’s Jird, Meriones crassus. Feral cat and feral
or domestic dog may also be present. Red Fox and Cape Hare both have wide world
ranges (as do feral dog and feral cat). The range for Sundevall’s Jird extends across North
Africa and the Arabian Peninsula to Afganistan and Pakistan. None of these species were
recorded in the study area during the ecological studies for the Qatalum project; however,
the Sundevall’s Jird is understood to have been recorded in the area during previous
studies.
5.7.21 The recent Gabbro Expansion EIA2 reported that large and small canid footprints were
observed along the bank of the lagoon along the Gabbro Causeway. The authors were
unable to identify which species were present but concluded that the footprints could be
those of Fennec fox, Ruppell’s sand fox, or Jackal; however, according to publication “The
Mammals of Arabia”51
, Fennec fox, Ruppell’s fox and Jackal are not present in Qatar, so it
is thought more likely that the footprints were those of the Arabian red fox or feral dog.
5.7.22 Previous studies of the area have indicated that snakes and lizards, such as the spiny
tailed lizard, could be present in the study area. None of these were observed during the
April 2005 preliminary ecology survey, during the January-February 2006 winter waterbird
survey, nor during the August 2006 site walkovers; however, sandy hummocks (which
form around the growing stems of plants and which can be important for reptiles, small
mammals and invertebrates) were observed during the April 2005 and August 2006
surveys, so smaller animals, in low numbers, can be assumed to occur on the Main Site
and at the Alternative Port Area.
Qatalum EIA Report
Contract No: QA-S1-NHT-B44-5279586 Doc Ref: QA-00-ATK-F15-00001-FINAL
5035013/01-01/EIA 4Dec06 rev02.doc 5-41
Birds
5.7.23 Since the Qatalum Site is located in a coastal site area, there are a range of habitats
present which are potentially suitable for waterbird species, e.g. reedbed, beach/intertidal
areas/lagoon and shallow inshore waters. At an early stage in the Qatalum Project,
concerns were raised by SCENR relating to the value of the marine lagoon area, to
migratory birds. The preliminary terrestrial ecological survey and data collection exercise
also identified the artificial reedbed as an area of interest to local bird watchers and as an
area that could support breeding bird populations; however, limited information was
obtained at this time in relation to the use and significance of the area to bird populations.
In addition, no recent or site specific bird count data could be obtained for the Project area
and its immediate environs. A comprehensive project (The Coastal Atlas Project) has been
planned as a joint venture between SCENR, UNESCO and a number of universities, which
will include an ecological survey of the entire coastline of Qatar; however, the results of
this are not anticipated within the time frame of the Qatalum EIA.
5.7.24 In order to obtain recent, localised bird count data and to enable the sensitivity/value of the
Project site to be determined with respect to birds, a winter survey was commissioned.
The survey took place in late January 2006 (as January is the period when winter
waterbird populations should be at their highest numbers in the Gulf) and included four
main geographical areas, as indicated on Figure 5.13:
• the proposed Qatalum Site (area C), with a focus on the marine lagoon area and
the reedbed area; and
• waterbirds utilising the coastline up to 10 km to the north and south of the
proposed Qatalum Site; including
- Al Wakra to the north (area A),
- the coastal strip between Al Wakra southwards towards Mesaieed (area
B);
- the port frontage of the commercial port and Q-Chem southwards to the
Sealine Resort (area D).
5.7.25 The bird count results are summarised in Table 5.7 and a brief discussion is presented
thereafter.
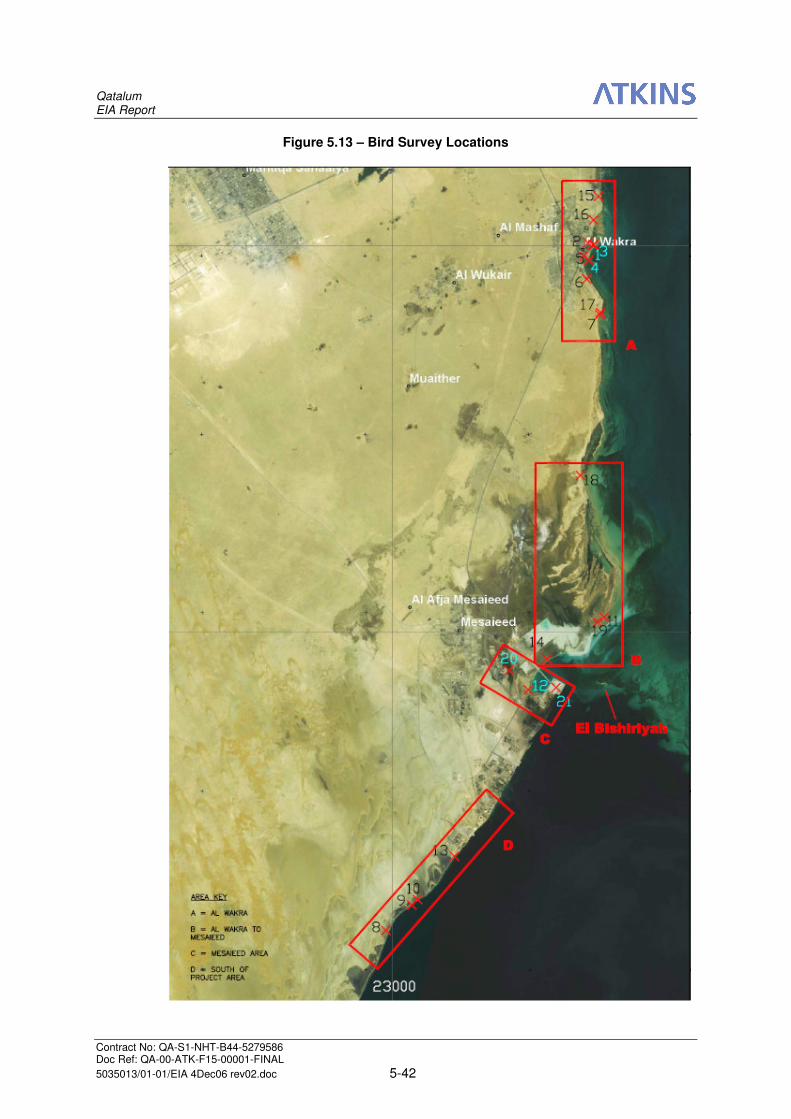
Qatalum EIA Report
Contract No: QA-S1-NHT-B44-5279586 Doc Ref: QA-00-ATK-F15-00001-FINAL
5035013/01-01/EIA 4Dec06 rev02.doc 5-42
Figure 5.13 – Bird Survey Locations
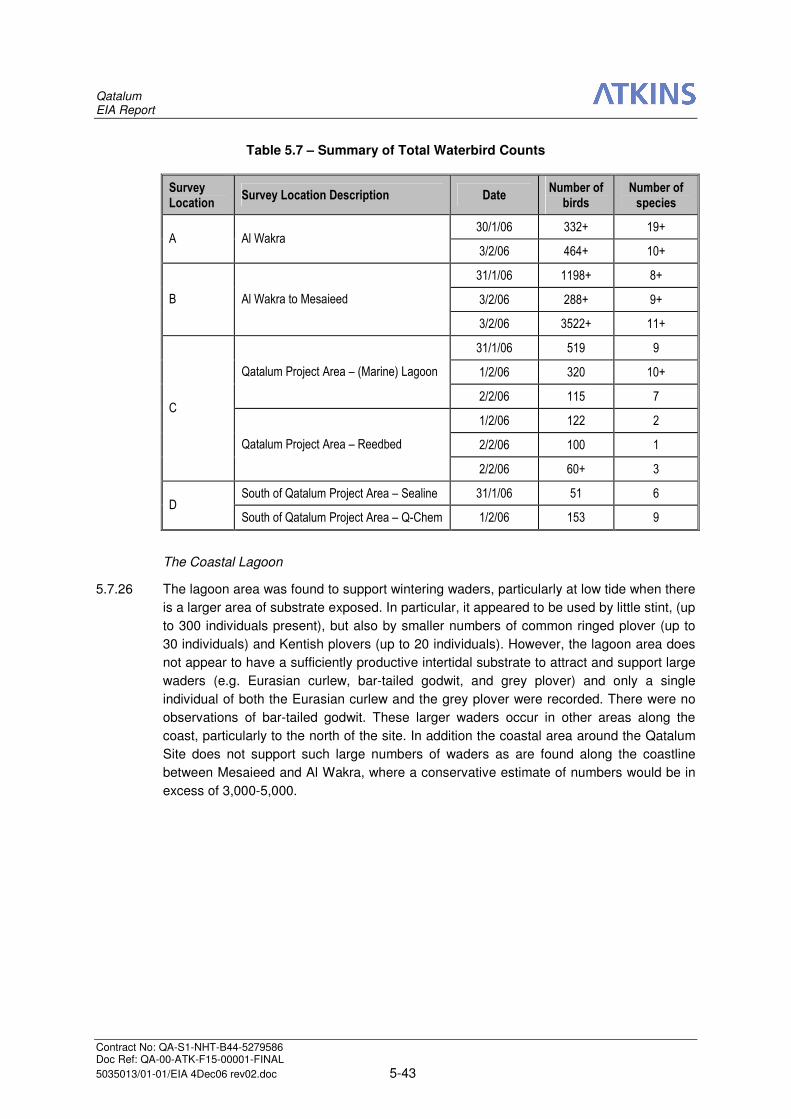
Qatalum EIA Report
Contract No: QA-S1-NHT-B44-5279586 Doc Ref: QA-00-ATK-F15-00001-FINAL
5035013/01-01/EIA 4Dec06 rev02.doc 5-43
Table 5.7 – Summary of Total Waterbird Counts
Survey Location
Survey Location Description Date Number of birds
Number of species
30/1/06 332+ 19+ A Al Wakra
3/2/06 464+ 10+
31/1/06 1198+ 8+
3/2/06 288+ 9+ B Al Wakra to Mesaieed
3/2/06 3522+ 11+
31/1/06 519 9
1/2/06 320 10+ Qatalum Project Area – (Marine) Lagoon
2/2/06 115 7
1/2/06 122 2
2/2/06 100 1
C
Qatalum Project Area – Reedbed
2/2/06 60+ 3
South of Qatalum Project Area – Sealine 31/1/06 51 6 D
South of Qatalum Project Area – Q-Chem 1/2/06 153 9
The Coastal Lagoon
5.7.26 The lagoon area was found to support wintering waders, particularly at low tide when there
is a larger area of substrate exposed. In particular, it appeared to be used by little stint, (up
to 300 individuals present), but also by smaller numbers of common ringed plover (up to
30 individuals) and Kentish plovers (up to 20 individuals). However, the lagoon area does
not appear to have a sufficiently productive intertidal substrate to attract and support large
waders (e.g. Eurasian curlew, bar-tailed godwit, and grey plover) and only a single
individual of both the Eurasian curlew and the grey plover were recorded. There were no
observations of bar-tailed godwit. These larger waders occur in other areas along the
coast, particularly to the north of the site. In addition the coastal area around the Qatalum
Site does not support such large numbers of waders as are found along the coastline
between Mesaieed and Al Wakra, where a conservative estimate of numbers would be in
excess of 3,000-5,000.
Qatalum EIA Report
Contract No: QA-S1-NHT-B44-5279586 Doc Ref: QA-00-ATK-F15-00001-FINAL
5035013/01-01/EIA 4Dec06 rev02.doc 5-44
5.7.27 The deeper water of the lagoon itself provides feeding opportunities for small numbers of
greater flamingo (a maxima of 14 recorded), but again, numbers are small compared to
those further along the coast to the north of MIC (where up to 180+ were recorded). Within
the lagoon, flamingos were only observed feeding in deep water (almost the entire leg
length was submerged), whereas elsewhere along the coast, the majority of birds fed in
much shallower water (‘ankle’ deep). As both the lagoon and its shoreline are largely
undisturbed, if this area is suitable for large wader species to feed, it would be expected
that such species would have been present. Although this survey represents only a
snapshot of potential wintering waterbird use, it was undertaken at a time of year when
wintering bird numbers were expected to be close to their maximum. As a result of the
survey, consultations and the literature review, it has been concluded that the lagoon does
not appear to comprise a significant high tide roost site.
Other Coastal Areas
5.7.28 At Al Wakra, numbers of waterbirds varied between 332+ and 464+ individuals, but this
represented counts at a site at which there was almost continual disturbance by people; in
addition, the lower count corresponded to a ‘high tide count’, during which birds would be
expected to select less disturbed sites for roosting.
5.7.29 The counts of waterbirds between MIC and Al Wakra varied between 288+ and 3522+
individuals. The considerable variability between these counts probably represents
differences in the amount of the coastline covered by the surveys, the state of the tide, and
differences in the degree of completeness in the counting procedure. At any given time,
only short sections of the coastline between Al Wakra and MIC were counted, largely due
to reasons of inaccessibility. The higher count figure is probably closer to a more accurate
number of waterbirds using the coast in this area as, due to the extent of this section of the
survey area, it is likely that the counts are underestimates. The counts of waterbirds from
the Qatalum project area are considered to be more accurate, due to the ‘confined nature’
of the site.
El Bishiriyah Island
5.7.30 El Bishiriyah was viewed from the Gabbro Berth during the survey. The island appears to
be low-lying sandy and with little vegetative cover, suggesting that, if it is used at all by
birds, it could be used as an offshore winter waterbird roost, or possibly as a breeding site
for terns. Due to the distance of the island from the shoreline, it was not possible to
definitively ascertain the presence or absence of birds on the island. A number of
individuals were contacted with respect to knowledge of bird data for El Bishiriyah;
however, no information was uncovered regarding any birds that may be present here.
The Reedbed
5.7.31 The artificially created reedbed area, associated with the neighbouring sewage treatment
plant, has been identified in several references as an important area for birds. This
reedbed area has previously been referred to as “Umm Said Pools” or “Umm Said Sewage
Pond”47&52
. Over ten years ago53
, the reedbed area was described as “the largest bed of
reeds in Qatar”; “correspondingly rich in bird life”; “of interest for its breeding, passage and
wintering waterbirds” and “one of the few significant areas of fresh water marsh vegetation
in Qatar”. The area does not have any kind of protected status under Qatari legislation.
Qatalum EIA Report
Contract No: QA-S1-NHT-B44-5279586 Doc Ref: QA-00-ATK-F15-00001-FINAL
5035013/01-01/EIA 4Dec06 rev02.doc 5-45
5.7.32 Previous publications also make reference to the fact that the water level of this reedbed
fluctuates throughout the year and that towards the end of the summer months many of
the outer pools dry out. During the winter waterbird survey, very few areas of open water
were identified; consequently there was a corresponding lack of waterbird species
recorded (especially as compared with historical waterbird data from 1991-1997 for this
site from Wetlands International). This implies that there has been a drying out of the
reedbed since this data was collected and the time of the present study. This is supported
by anecdotal information from the MIC Authority, who advised that the treated sewage
effluent is used for irrigation of the MIC landscaping in the summer, in the winter any
surplus treated effluent is released to the reedbed. Any future plans and decisions relating
to MIC expansion and the increase of landscaping/irrigation water requirements will further
affect the future of the reedbed.
5.7.33 The reedbed was found to support wintering species of passerine (rather than waterbirds),
and may be of some value as a breeding site, particularly for reedbed species. However, it
is clear from the historical data that the value of this area for wintering waterbird species
has declined since the early 1990s; the pools have become progressively “infilled” with
vegetation and, as noted above, appear to be drying out around the periphery. There are
similar wetland areas in Qatar, with reedbeds “fed”, at least in part, by inputs of liquid
effluent; however, there are no bird count data available for these sites. Nationally, the
most important site in this context is the Prison Pools, just off the Salwa Road, some
12 km from Doha. A partial bird count was undertaken at this location as part of the
Qatalum survey and the following waterbirds were recorded: 35 Grey Heron and 100+
Great Cormorant, along with smaller numbers of Teal, Shoveler, Mallard and Wigeon. At
least 7 species of waders were recorded, with 100+ birds present. On other occasions, up
to 37 Western Marsh Harriers have been recorded roosting in the reedbeds at this site
(Jamie Buchan, personal communication).
5.7.34 It is concluded that the reedbed area has declined as a resource for wintering waterbird
populations since the 1990s; minimal use of this wetland area by waterbirds was observed
during the 2006 survey. This is considered to be due to progressive drying out of the
reedbed. The reedbed is now probably of more value to wintering passerine species,
breeding species and passage migrants than it is to waterbirds.
Protected Areas
5.7.35 None of the habitats or areas within the proposed Qatalum Site or in the vicinity of the site
are legally protected, nor have they been nominated for inclusion as Biosphere Reserves
according to studies by UNESCO for SCENR. The Umm Said Pools (reedbed area) had,
10 years ago, been recognised by BirdLife International as an Important Bird Area in the
Middle East52
; although this is a significant designation it has no legal status; the pools
have now all but disappeared and their “importance” for birds appears to have
substantially declined.
Qatalum EIA Report
Contract No: QA-S1-NHT-B44-5279586 Doc Ref: QA-00-ATK-F15-00001-FINAL
5035013/01-01/EIA 4Dec06 rev02.doc 5-46
Summary
5.7.36 The proposed Qatalum Main Site and both Port concepts are located in an existing heavily
industrialised area with, for the most part, little reported vegetation or areas of ecological
significance. It was clear from the preliminary site visit and review of available data that,
though parts of the proposed Main Site and Original Port Area, (i.e. artificial reedbed and
lagoon) are of some biodiversity/nature conservation value, much of the area is in far from
a pristine condition, as result of previous development activities at the MIC Industrial Area.
Although the “Umm Said Pools” (reedbed area) has been listed historically as an
“Important Bird Area in the Middle East”, the value of this site appears to have degraded
overtime and neither this, nor any of the habitats or areas within/around the Qatalum Site,
are legally protected, nor have they been nominated for inclusion as Biosphere Reserves
as a result of recent studies conducted by UNESCO.
5.7.37 Similarly, the proposed areas for storage / dewatering of dredge materials and the
construction workers’ camp are essentially devoid of vegetation and are not considered to
be areas of any particular ecological significance.
5.8 MARINE ECOLOGY
Background
5.8.1 A marine survey and desktop study was carried out for the Qatalum Project Original port
concept in August 2005. Full details of the survey and the desktop study are presented in
Appendix C, a summary is provided below. The aims of the marine survey were to:
• establish a baseline for the marine biological environment in the vicinity of the
Project site, to supplement the findings of the 2004 SARC Survey33
;
• undertake a reconnaissance level baseline survey of the marine ecological
environment of the reef (Fasht Al Arif);
• identify any sensitive marine ecological habitats and/or important species within
the study areas; and
• establish a baseline for sediment and seawater quality in the vicinity of the Project
site (see Section 5.4 above for the results of this element of the survey).
5.8.2 The survey comprised an investigation of marine and coastal ecology and water and
sediment quality within the following areas (see Figure 5.14):
• Three survey stations (Stations 1, 2, 3) within the lagoon enclosed by the Gabbro
Causeway;
• 15 survey stations (Stations 4 to 18) within the proposed dredging area (total area
comprised 2 km2);
• Four survey stations (Stations 19 to 22) on the Fasht Al Arif reef; and
• One monitoring and control station, located towards the south east of the Fasht Al
Arif reef and away from human activities directly associated with the MIC area
(Station 23).

Qatalum EIA Report
Contract No: QA-S1-NHT-B44-5279586 Doc Ref: QA-00-ATK-F15-00001-FINAL
5035013/01-01/EIA 4Dec06 rev02.doc 5-47
5.8.3 A team of two Atkins marine scientists, a support safety diver and cox, were present
aboard the vessel for the duration of the survey. The Scientific and Applied Research
Centre (SARC) provided the survey vessel, air tanks, safety diver, cox and general
assistance. The survey was conducted by SCUBA diving in subtidal habitats to record and
collect sediment, seawater and biota samples and by snorkelling in shallower waters, of
<1 m depth.
5.8.4 Identification of epifaunal, algal and seagrass species was made in situ, during each dive,
at each sample station, along a transect of approximately 20 m length. The following
elements were reported:
• habitat type - percentage cover;
• flora – percentage cover for algal and seagrass communities; and
• fauna – species identification and abundance of benthic epifauna, fish, marine
mammals and turtles.
5.8.5 A visual record was taken along the line transect at each survey station using an
underwater video camera. Full species survey records are provided in Annex B of
Appendix C. A DVD has been prepared from the footage from the video camera; this can
be made available on request.
5.8.6 In addition to the marine survey, a review of available literature and other survey results
has been undertaken; the most relevant information sources are discussed in more detail
in Appendix C and included:
• Ecological Survey of the Marine and Coastal Environment of Mesaieed Industrial
City, undertaken by Scientific and Applied Research Centre (SARC)33
. This
reported a survey conducted during six sampling cruises in May and November
2001, February and September 2002 and January and June 2003;
• Gabbro Berth Expansion at Mesaieed Port EIA report2, produced by COWI. This
reported the findings of a marine survey carried out in October 2005, which
covered a similar area to that of the Qatalum Survey;
• Consultancy Services for Environmental Studies of Proposed Dredging Works
Port Mesaieed, Qatar and subsequent environmental monitoring study reports for
Dragomar International A.G34&35
, issued in 2001;
• Crushed Stone Import facility, Mesaieed Port Environmental Impact Assessment
report, produced for QP by Halcrow in 200136
; and
• New Midrex DRI Plant for QASCO, Mesaieed: Detailed Environmental Impact
Assessment, report for Midrex Technologies Inc.37
.
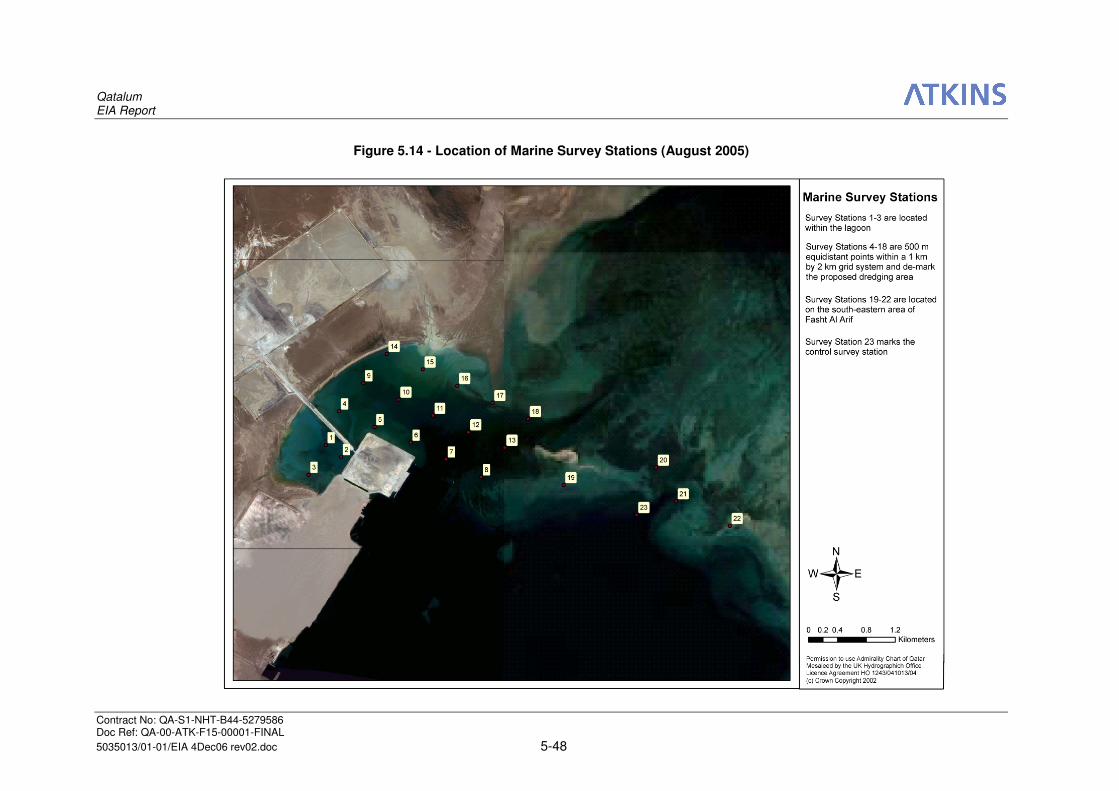
Qatalum EIA Report
Contract No: QA-S1-NHT-B44-5279586 Doc Ref: QA-00-ATK-F15-00001-FINAL
5035013/01-01/EIA 4Dec06 rev02.doc 5-48
Figure 5.14 - Location of Marine Survey Stations (August 2005)
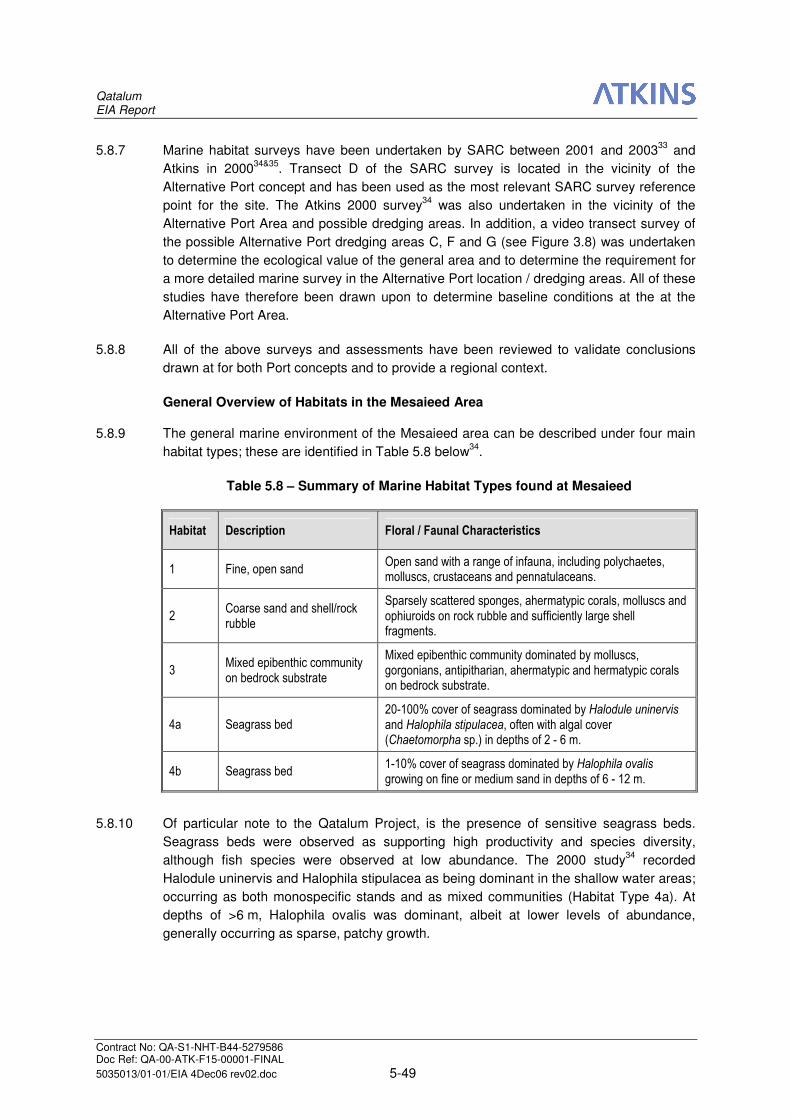
Qatalum EIA Report
Contract No: QA-S1-NHT-B44-5279586 Doc Ref: QA-00-ATK-F15-00001-FINAL
5035013/01-01/EIA 4Dec06 rev02.doc 5-49
5.8.7 Marine habitat surveys have been undertaken by SARC between 2001 and 200333
and
Atkins in 200034&35
. Transect D of the SARC survey is located in the vicinity of the
Alternative Port concept and has been used as the most relevant SARC survey reference
point for the site. The Atkins 2000 survey34
was also undertaken in the vicinity of the
Alternative Port Area and possible dredging areas. In addition, a video transect survey of
the possible Alternative Port dredging areas C, F and G (see Figure 3.8) was undertaken
to determine the ecological value of the general area and to determine the requirement for
a more detailed marine survey in the Alternative Port location / dredging areas. All of these
studies have therefore been drawn upon to determine baseline conditions at the at the
Alternative Port Area.
5.8.8 All of the above surveys and assessments have been reviewed to validate conclusions
drawn at for both Port concepts and to provide a regional context.
General Overview of Habitats in the Mesaieed Area
5.8.9 The general marine environment of the Mesaieed area can be described under four main
habitat types; these are identified in Table 5.8 below34
.
Table 5.8 – Summary of Marine Habitat Types found at Mesaieed
Habitat Description Floral / Faunal Characteristics
1 Fine, open sand Open sand with a range of infauna, including polychaetes, molluscs, crustaceans and pennatulaceans.
2 Coarse sand and shell/rock rubble
Sparsely scattered sponges, ahermatypic corals, molluscs and ophiuroids on rock rubble and sufficiently large shell fragments.
3 Mixed epibenthic community on bedrock substrate
Mixed epibenthic community dominated by molluscs, gorgonians, antipitharian, ahermatypic and hermatypic corals on bedrock substrate.
4a Seagrass bed 20-100% cover of seagrass dominated by Halodule uninervis and Halophila stipulacea, often with algal cover (Chaetomorpha sp.) in depths of 2 - 6 m.
4b Seagrass bed 1-10% cover of seagrass dominated by Halophila ovalis growing on fine or medium sand in depths of 6 - 12 m.
5.8.10 Of particular note to the Qatalum Project, is the presence of sensitive seagrass beds.
Seagrass beds were observed as supporting high productivity and species diversity,
although fish species were observed at low abundance. The 2000 study34
recorded
Halodule uninervis and Halophila stipulacea as being dominant in the shallow water areas;
occurring as both monospecific stands and as mixed communities (Habitat Type 4a). At
depths of >6 m, Halophila ovalis was dominant, albeit at lower levels of abundance,
generally occurring as sparse, patchy growth.
Qatalum EIA Report
Contract No: QA-S1-NHT-B44-5279586 Doc Ref: QA-00-ATK-F15-00001-FINAL
5035013/01-01/EIA 4Dec06 rev02.doc 5-50
5.8.11 All habitats types identified at MIC are typical of the southern Arabian Gulf region and are
likely to extend well into neighbouring waters. The distribution of seagrass in the Arabian
Gulf is generally limited to depths of less than 12 m below chart datum due to the turbid
conditions that prevail, particularly during winter months34
. It has been reported that
seagrass beds are extensive along the coasts of Qatar; however, the Gulf exhibits a low
diversity of seagrass species in comparison with the Red Sea and the Arabian Sea40
.
There are no environmentally sensitive or protected areas in the immediate vicinity of the
MIC inshore coastal belt; however, as noted, seagrass beds are present in the area and
these can be affected by marine construction and dredging activities
Marine Habitats at the Original Port Area
5.8.12 During the marine survey carried out for the QASCO project in September 200437
,
ecological species diversity and sensitivity were seen to increase outside and eastwards of
the 500 m dredged navigation channel, where dense areas of seagrass beds (80 to 97%
coverage) were observed; dominated by Halophila stipulacea. These seagrass beds were
observed to support a range of epifaunal species, with gastropods, colonial ascidians and
sponges most frequently occurring. The survey recorded species diversity varying from 11
to 18 species at high diversity stations, although it was noted that fewer species were
present than would be expected. Macroalgal species were recorded. Fish species
observed were relatively limited, with the dominant species observed being the goby.
5.8.13 The Gabbro survey2 determined that the seabed was covered in seagrass over
approximately two thirds of the study area, with Halophila stipulacea being the dominant
species. The highest density seagrass cover was found to the east of the existing Gabbro
Berth. Seagrass to the north of the study area was found to be less extensive. The north
west portion of the study area was described as being densely covered by epiphytes and
silt and as seeming somewhat unhealthy. No or very little seagrass was found in the
lagoon area behind the Gabbro Causeway. A total of 36 different species of benthic fauna
were identified in the study area, these were dominated by worms but also included
crustaceans, echindoderms, Brachiopoda, snails, bivalves, Sipuncula and sponges. No
macroalgae were observed throughout the survey.
5.8.14 The findings of the Qatalum Survey reflect and support the findings from the other marine
surveys that have been undertaken and discussed herein. No ecologically important
mammals were observed within the Qatalum Survey area. Similarly, no commercially
important fish species were found to be present. Of the areas surveyed in the Qatalum
survey, the highest overall species diversity across all stations surveyed were recorded at
Stations 21, (21 species), and 22, (23 species) on the Fasht Al Arif. The Original Port
dredge area stations demonstrated greater species diversity than those surveyed in the
lagoon. A graphical representation of species diversity at the survey stations it presented
in Figure 5.15.

Qatalum EIA Report
Contract No: QA-S1-NHT-B44-5279586 Doc Ref: QA-00-ATK-F15-00001-FINAL
5035013/01-01/EIA 4Dec06 rev02.doc 5-51
Figure 5.15 – Overall Species Diversity (Qatalum Survey 2005)
0 5 10 15 20 25
123456789
10111213141516171819202122
control
Sta
tio
n
No of Species
Seagrass
Algae
Cnidaria
Mollusca
Porifera
Chordata (Ascideans)
Echniodermata
Crustacea
Fish
Qatalum EIA Report
Contract No: QA-S1-NHT-B44-5279586 Doc Ref: QA-00-ATK-F15-00001-FINAL
5035013/01-01/EIA 4Dec06 rev02.doc 5-52
5.8.15 Seagrass was observed over much of the study area. The proposed dredge area provided
the richest seagrass habitats. Within this area, seagrass cover increased with distance
from the coastline (i.e. Stations 7, 10, 11, 17 and 18) and at Stations situated away from
the alluvial fan (Stations 14 and 15). A map showing seagrass distribution and density
across the study area is presented in Figure 5.16.
5.8.16 The lagoon stations were found to be sparsely populated and impoverished sites, the
majority of the seabed was exposed, with little or no plant cover and few faunal species
present. This is likely to be due to the high levels of silt, low flow and slightly higher salinity
in these areas. Sparse and patchy seagrass coverage (1-21%) was observed in the
lagoon; however the seagrass was in much poorer condition than that within the Original
Port dredge area, where individual leaves/blades were observed to be much longer and
larger. Also, the seagrass in the lagoon was present as monospecific strands, unlike the
mixed communities observed in the dredge area. Benthic fauna species numbers and
diversity were low and are considered insufficient to support significant bird colonies. No
fish nurseries were observed.
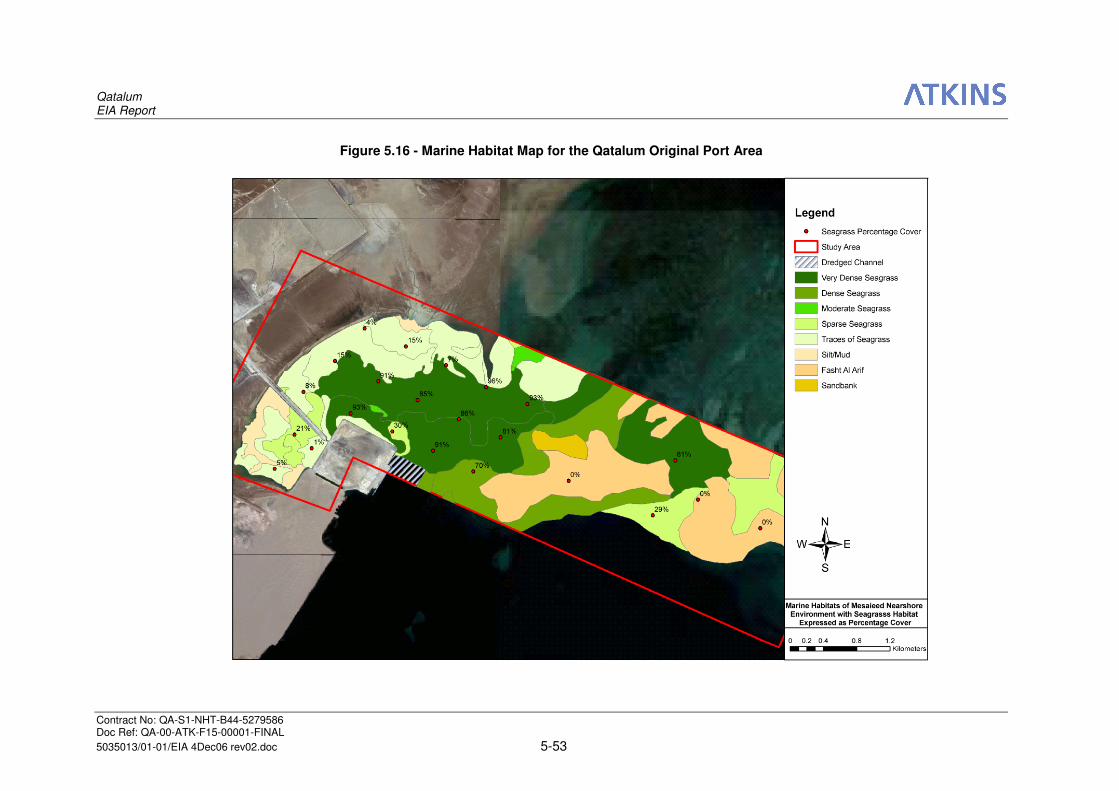
Qatalum EIA Report
Contract No: QA-S1-NHT-B44-5279586 Doc Ref: QA-00-ATK-F15-00001-FINAL
5035013/01-01/EIA 4Dec06 rev02.doc 5-53
Figure 5.16 - Marine Habitat Map for the Qatalum Original Port Area
Qatalum EIA Report
Contract No: QA-S1-NHT-B44-5279586 Doc Ref: QA-00-ATK-F15-00001-FINAL
5035013/01-01/EIA 4Dec06 rev02.doc 5-54
Marine Habitats at the Alternative Port Area
5.8.17 Much of the Mesaieed near-shore marine environment is degraded, as result of previous
development activities at MIC. This is supported by the SARC study33
of the MIC coastline,
which observed that macrobenthic fauna and flora were present at lower species diversity
and abundance than in comparison with other areas around the Qatar coast.
5.8.18 The SARC survey results for Transect D are indicative of the type of ecology that is
located in near-shore areas to the south of the Fasht Al Arif. Table 5.9 provides a
summary of the results of the SARC survey at Transect D.
5.8.19 The 2000 Atkins marine survey34
showed that marine habitat in proximity to the Alternative
Port, and nearby possible dredging areas, consists of a range of infauna, including
polychaetes, molluscs, crustaceans and pennatulaceans. There is a patchy distribution of
1-10% cover of seagrass dominated by H. ovalis (dominant due to the water depths here).
5.8.20 A video survey of possible dredging areas C, F & G (see Figure 3.8), carried out by MIC,
demonstrates that these areas are largely barren, thus supporting the results of the 2000
survey.
5.8.21 At Alternative Port concept possible dredging area E, less than 20% cover of seagrass is
found34
, dominated by Halodule uninervis and Halophila stipulacea, mixed with
filamentous green alga (Chaetomorpha sp.) in winter months in particular. This possible
dredging area is considered more sensitive than other areas identified and is located
closer to the dense seagrass beds off the Fasht Al Arif.
5.8.22 The results from various surveys suggest that the habitats in the Alternative port site and
associated potential dredging areas are of limited ecological value and are consistent with
the Type 1 and 4b habitats described in Table 5.8. The habitat quality to the south
(Alternative Port Area) is notably poorer than that observed in the north; this would be
expected in deeper waters (for seagrass) but it may also indicate a correlation between
seagrass growth and the presence of contaminated sediments.
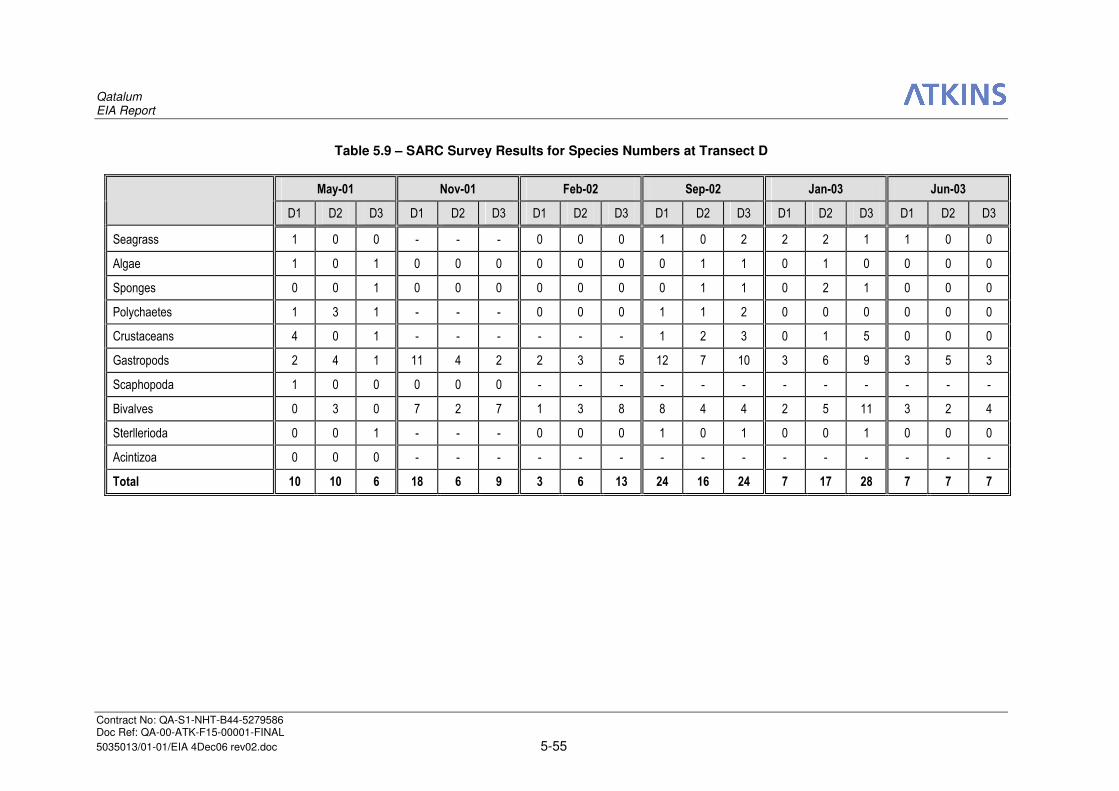
Qatalum EIA Report
Contract No: QA-S1-NHT-B44-5279586 Doc Ref: QA-00-ATK-F15-00001-FINAL
5035013/01-01/EIA 4Dec06 rev02.doc 5-55
Table 5.9 – SARC Survey Results for Species Numbers at Transect D
May-01 Nov-01 Feb-02 Sep-02 Jan-03 Jun-03
D1 D2 D3 D1 D2 D3 D1 D2 D3 D1 D2 D3 D1 D2 D3 D1 D2 D3
Seagrass 1 0 0 - - - 0 0 0 1 0 2 2 2 1 1 0 0
Algae 1 0 1 0 0 0 0 0 0 0 1 1 0 1 0 0 0 0
Sponges 0 0 1 0 0 0 0 0 0 0 1 1 0 2 1 0 0 0
Polychaetes 1 3 1 - - - 0 0 0 1 1 2 0 0 0 0 0 0
Crustaceans 4 0 1 - - - - - - 1 2 3 0 1 5 0 0 0
Gastropods 2 4 1 11 4 2 2 3 5 12 7 10 3 6 9 3 5 3
Scaphopoda 1 0 0 0 0 0 - - - - - - - - - - - -
Bivalves 0 3 0 7 2 7 1 3 8 8 4 4 2 5 11 3 2 4
Sterllerioda 0 0 1 - - - 0 0 0 1 0 1 0 0 1 0 0 0
Acintizoa 0 0 0 - - - - - - - - - - - - - - -
Total 10 10 6 18 6 9 3 6 13 24 16 24 7 17 28 7 7 7
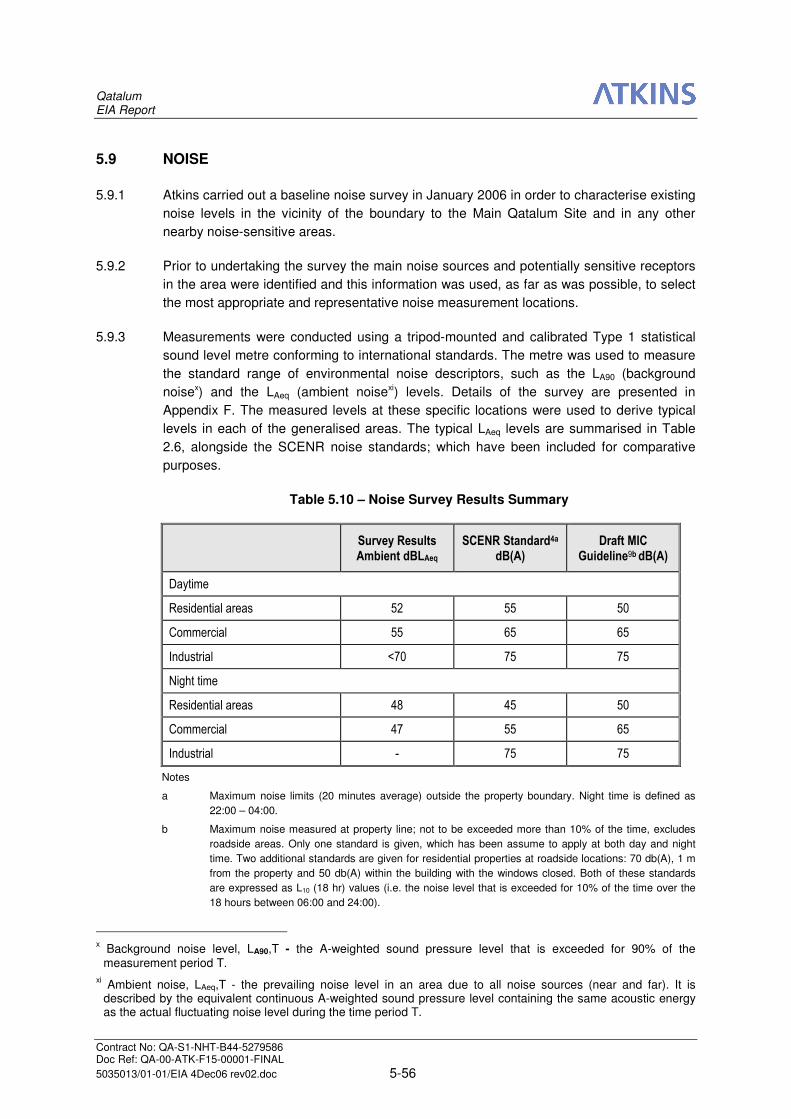
Qatalum EIA Report
Contract No: QA-S1-NHT-B44-5279586 Doc Ref: QA-00-ATK-F15-00001-FINAL
5035013/01-01/EIA 4Dec06 rev02.doc 5-56
5.9 NOISE
5.9.1 Atkins carried out a baseline noise survey in January 2006 in order to characterise existing
noise levels in the vicinity of the boundary to the Main Qatalum Site and in any other
nearby noise-sensitive areas.
5.9.2 Prior to undertaking the survey the main noise sources and potentially sensitive receptors
in the area were identified and this information was used, as far as was possible, to select
the most appropriate and representative noise measurement locations.
5.9.3 Measurements were conducted using a tripod-mounted and calibrated Type 1 statistical
sound level metre conforming to international standards. The metre was used to measure
the standard range of environmental noise descriptors, such as the LA90 (background
noisex) and the LAeq (ambient noisexi) levels. Details of the survey are presented in
Appendix F. The measured levels at these specific locations were used to derive typical
levels in each of the generalised areas. The typical LAeq levels are summarised in Table
2.6, alongside the SCENR noise standards; which have been included for comparative
purposes.
Table 5.10 – Noise Survey Results Summary
Survey Results Ambient dBLAeq
SCENR Standard4a
dB(A) Draft MIC
Guideline9b dB(A)
Daytime
Residential areas 52 55 50
Commercial 55 65 65
Industrial <70 75 75
Night time
Residential areas 48 45 50
Commercial 47 55 65
Industrial - 75 75
Notes
a Maximum noise limits (20 minutes average) outside the property boundary. Night time is defined as
22:00 – 04:00.
b Maximum noise measured at property line; not to be exceeded more than 10% of the time, excludes
roadside areas. Only one standard is given, which has been assume to apply at both day and night
time. Two additional standards are given for residential properties at roadside locations: 70 db(A), 1 m
from the property and 50 db(A) within the building with the windows closed. Both of these standards
are expressed as L10 (18 hr) values (i.e. the noise level that is exceeded for 10% of the time over the
18 hours between 06:00 and 24:00).
x Background noise level, LA90,T - the A-weighted sound pressure level that is exceeded for 90% of the measurement period T.
xi Ambient noise, LAeq,T - the prevailing noise level in an area due to all noise sources (near and far). It is described by the equivalent continuous A-weighted sound pressure level containing the same acoustic energy as the actual fluctuating noise level during the time period T.
Qatalum EIA Report
Contract No: QA-S1-NHT-B44-5279586 Doc Ref: QA-00-ATK-F15-00001-FINAL
5035013/01-01/EIA 4Dec06 rev02.doc 5-57
5.9.4 The results of the noise level survey indicate that typical levels within the receptor areas
are in accordance with the World Bank and Qatari standards during the day, but slightly
exceed the SCENR residential standard at night. This is due to a limited number of areas
within the residential area that are currently influenced by localised noise sources.
5.10 WASTE MANAGEMENT AND DISPOSAL
Waste Treatment and Disposal
5.10.1 The State of Qatar has steadily improved its waste management practices and established
legislation to control pollution and protect the environment (see Section 2.6).
5.10.2 There is presently only one operational waste disposal facility within MIC. That is the
Mesaieed Municipal Waste Disposal Site (MMWDS), which is located approximately 10 to
15 km south west of the proposed Qatalum plant.
5.10.3 The MMWDS is licensed to receive non-hazardous industrial wastes (e.g. construction
rubble, metal, plastics, wood, soil, tyres, paint tins, industrial filter elements and empty
chemical drums) and domestic waste (e.g. plastic, glass, boxes, packaging and soil).
However, it is not licensed to accept hazardous waste. There is thus no facility within MIC
which can presently accept hazardous waste.
5.10.4 In order to address this issue, a new hazardous waste facility, the Mesaieed Hazardous
Waste Treatment Centre (MHWTC), is being constructed by the MIC Authority at a site
approximately 15 km northwest of Mesaieed. The new facility is designed to treat and
dispose of hazardous wastes from facilities across Qatar, along with non-hazardous
industrial and domestic wastes arising from MIC. It is understood that waste treatment
capabilities at the facility will include neutralisation, solidification and stabilisation, land-
filling, landfarming and incineration. The MHWTC is still under construction and
development; however, it is understood that it will be operational by the time the Qatalum
Project commences construction and operation.
5.10.5 In light of the present absence of hazardous waste treatment and disposal facilities within
MIC, industries operating within the area generally store hazardous waste on their own
premises pending completion of the MHWTC.
Resource and Recovery Operations
5.10.6 Commercial recycling in Qatar is limited, although the commercial recycling of plastic,
wood and scrap metal does occur. The practice, however, is not regulated and a key
environmental issue is the fate of non-recycled portion of any wastes generated. Existing
waste management practices at MIC Industrial Area do include the recycling of plastic
drums and bottles, steel drums, batteries, waste oil and paper.
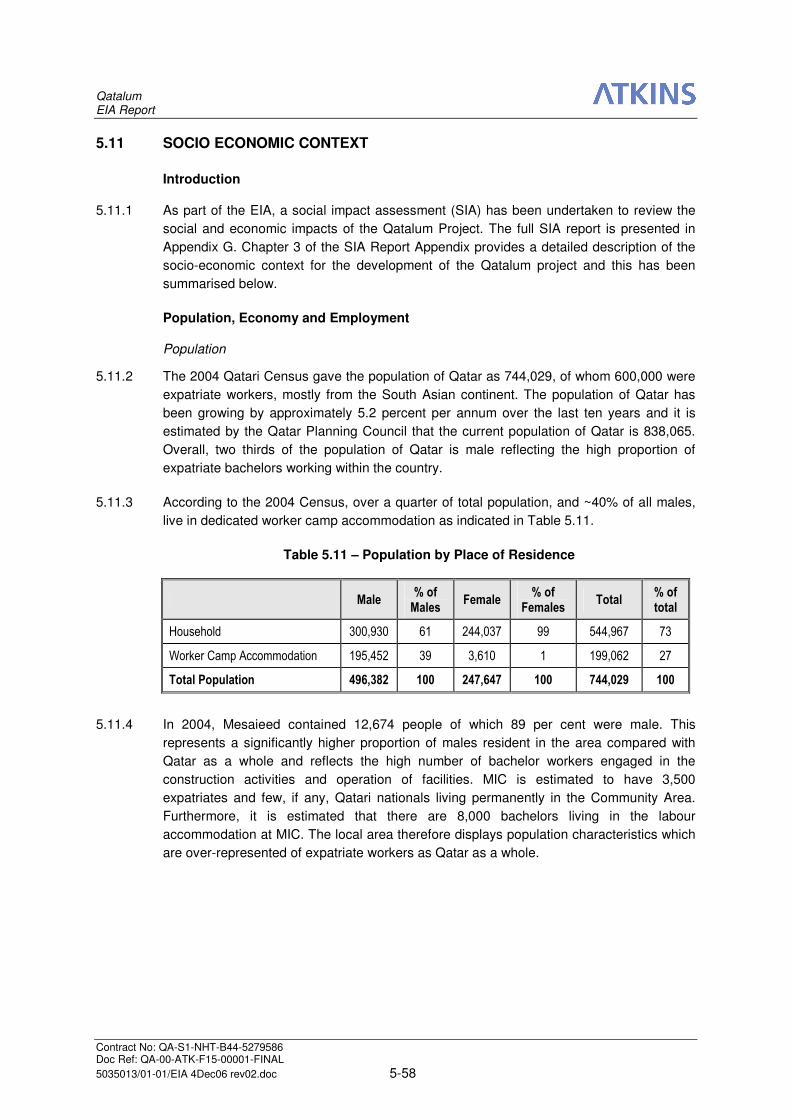
Qatalum EIA Report
Contract No: QA-S1-NHT-B44-5279586 Doc Ref: QA-00-ATK-F15-00001-FINAL
5035013/01-01/EIA 4Dec06 rev02.doc 5-58
5.11 SOCIO ECONOMIC CONTEXT
Introduction
5.11.1 As part of the EIA, a social impact assessment (SIA) has been undertaken to review the
social and economic impacts of the Qatalum Project. The full SIA report is presented in
Appendix G. Chapter 3 of the SIA Report Appendix provides a detailed description of the
socio-economic context for the development of the Qatalum project and this has been
summarised below.
Population, Economy and Employment
Population
5.11.2 The 2004 Qatari Census gave the population of Qatar as 744,029, of whom 600,000 were
expatriate workers, mostly from the South Asian continent. The population of Qatar has
been growing by approximately 5.2 percent per annum over the last ten years and it is
estimated by the Qatar Planning Council that the current population of Qatar is 838,065.
Overall, two thirds of the population of Qatar is male reflecting the high proportion of
expatriate bachelors working within the country.
5.11.3 According to the 2004 Census, over a quarter of total population, and ~40% of all males,
live in dedicated worker camp accommodation as indicated in Table 5.11.
Table 5.11 – Population by Place of Residence
Male % of Males
Female % of
Females Total
% of total
Household 300,930 61 244,037 99 544,967 73
Worker Camp Accommodation 195,452 39 3,610 1 199,062 27
Total Population 496,382 100 247,647 100 744,029 100
5.11.4 In 2004, Mesaieed contained 12,674 people of which 89 per cent were male. This
represents a significantly higher proportion of males resident in the area compared with
Qatar as a whole and reflects the high number of bachelor workers engaged in the
construction activities and operation of facilities. MIC is estimated to have 3,500
expatriates and few, if any, Qatari nationals living permanently in the Community Area.
Furthermore, it is estimated that there are 8,000 bachelors living in the labour
accommodation at MIC. The local area therefore displays population characteristics which
are over-represented of expatriate workers as Qatar as a whole.
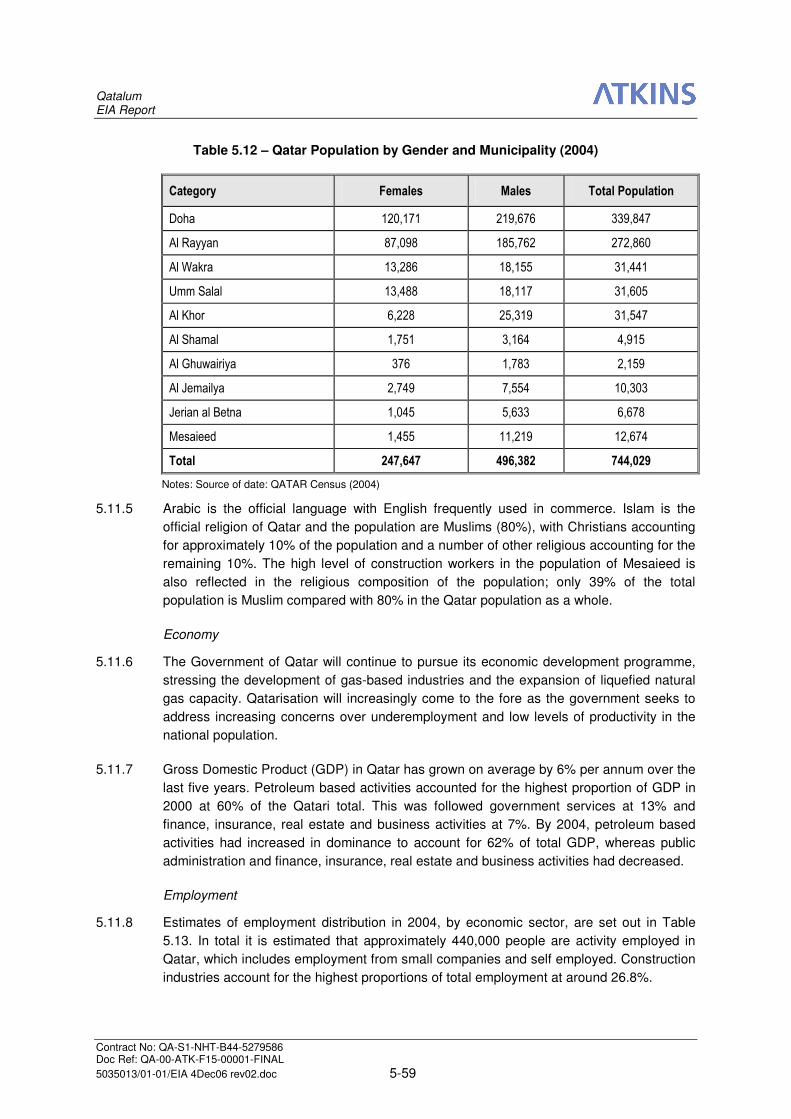
Qatalum EIA Report
Contract No: QA-S1-NHT-B44-5279586 Doc Ref: QA-00-ATK-F15-00001-FINAL
5035013/01-01/EIA 4Dec06 rev02.doc 5-59
Table 5.12 – Qatar Population by Gender and Municipality (2004)
Category Females Males Total Population
Doha 120,171 219,676 339,847
Al Rayyan 87,098 185,762 272,860
Al Wakra 13,286 18,155 31,441
Umm Salal 13,488 18,117 31,605
Al Khor 6,228 25,319 31,547
Al Shamal 1,751 3,164 4,915
Al Ghuwairiya 376 1,783 2,159
Al Jemailya 2,749 7,554 10,303
Jerian al Betna 1,045 5,633 6,678
Mesaieed 1,455 11,219 12,674
Total 247,647 496,382 744,029
Notes: Source of date: QATAR Census (2004)
5.11.5 Arabic is the official language with English frequently used in commerce. Islam is the
official religion of Qatar and the population are Muslims (80%), with Christians accounting
for approximately 10% of the population and a number of other religious accounting for the
remaining 10%. The high level of construction workers in the population of Mesaieed is
also reflected in the religious composition of the population; only 39% of the total
population is Muslim compared with 80% in the Qatar population as a whole.
Economy
5.11.6 The Government of Qatar will continue to pursue its economic development programme,
stressing the development of gas-based industries and the expansion of liquefied natural
gas capacity. Qatarisation will increasingly come to the fore as the government seeks to
address increasing concerns over underemployment and low levels of productivity in the
national population.
5.11.7 Gross Domestic Product (GDP) in Qatar has grown on average by 6% per annum over the
last five years. Petroleum based activities accounted for the highest proportion of GDP in
2000 at 60% of the Qatari total. This was followed government services at 13% and
finance, insurance, real estate and business activities at 7%. By 2004, petroleum based
activities had increased in dominance to account for 62% of total GDP, whereas public
administration and finance, insurance, real estate and business activities had decreased.
Employment
5.11.8 Estimates of employment distribution in 2004, by economic sector, are set out in Table
5.13. In total it is estimated that approximately 440,000 people are activity employed in
Qatar, which includes employment from small companies and self employed. Construction
industries account for the highest proportions of total employment at around 26.8%.

Qatalum EIA Report
Contract No: QA-S1-NHT-B44-5279586 Doc Ref: QA-00-ATK-F15-00001-FINAL
5035013/01-01/EIA 4Dec06 rev02.doc 5-60
Table 5.13 – Employment Distribution in Qatar
Category Employment Numbers
2004 Approximate % Of Total
Employment
Agriculture &Fishing 12,025 2.7
Mining & Quarrying 17,997 4.1
Manufacturing 40,038 9.2
Electricity, Gas & Water Connections 4,364 1.0
Construction 117,049 26.8
Wholesale, Retail Trade & Car Repairs 54,438 12.4
Hotels and Restaurants 10,280 2.4
Transport, Storage & Communication 15,218 3.5
Financial intermediaries 4,766 1.1
Real Estate & Renting Services 11,858 2.7
Public Administration 53,438 12.2
Education 19,877 4.5
Health & Social Work 11,554 2.6
Community & Personal Services 10,130 2.3
Domestic Services 53,358 12.2
Other 1,171 0.3
Total 437,561 100
Notes: Source of data: QATAR Planning Council (2006)
5.11.9 Table 5.14 shows the distribution of Qataris in employment and the percentage of Qataris
within the total work force for each sector. Approximately 50,000 Qataris currently work,
with nearly 55 percent employed in public administration, and a further 19 percent
employed in education. Of the 50,000 Qataris in the workforce approximately 15,000 are
women. Therefore the incidence of Qataris generally, and Qatari women in particular, in
the private sector is very small.
5.11.10 Qataris account for 11 percent of the current workforce in the country. The engagement of
Qataris in the manufacturing sector is particularly low with less than 2% of the total
manufacturing workforce accounted for by Qataris. The sectors within which Qataris are
most active are public administration (52%), education (48%) and utilities supply (33%).
Overall, 77% of Qataris are employed in Government Administration whilst a further 13%
are employed in Government Establishments.
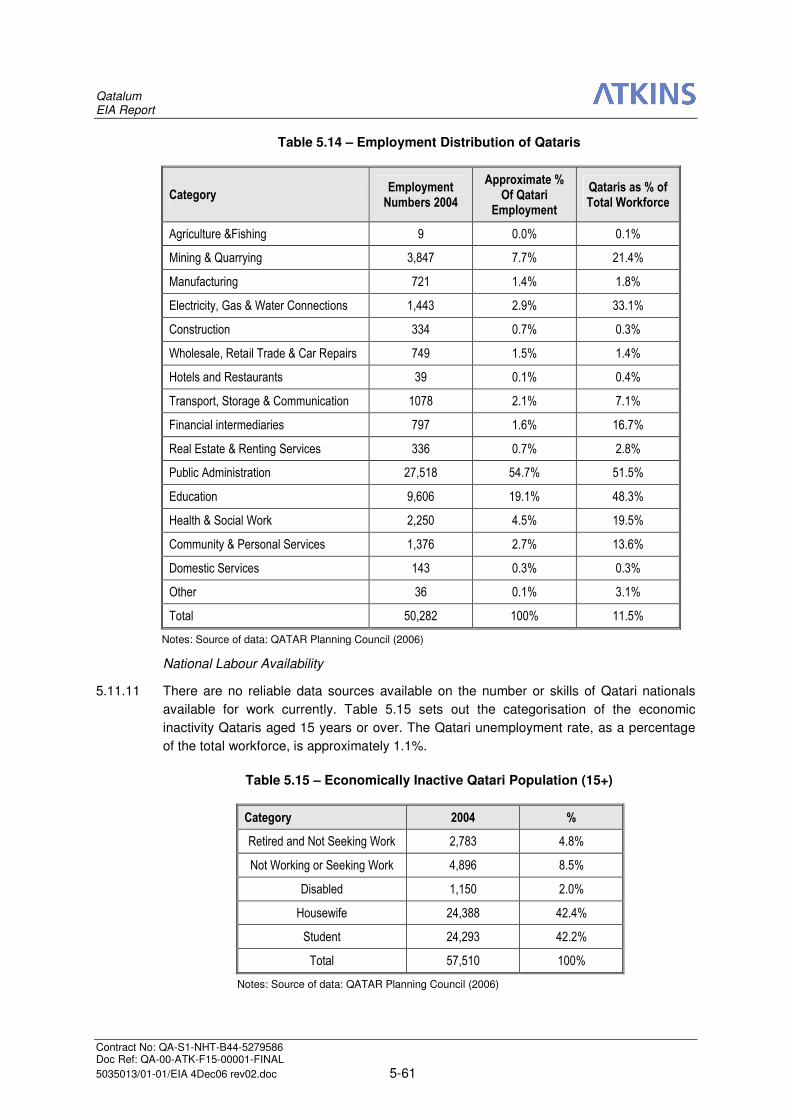
Qatalum EIA Report
Contract No: QA-S1-NHT-B44-5279586 Doc Ref: QA-00-ATK-F15-00001-FINAL
5035013/01-01/EIA 4Dec06 rev02.doc 5-61
Table 5.14 – Employment Distribution of Qataris
Category Employment Numbers 2004
Approximate % Of Qatari
Employment
Qataris as % of Total Workforce
Agriculture &Fishing 9 0.0% 0.1%
Mining & Quarrying 3,847 7.7% 21.4%
Manufacturing 721 1.4% 1.8%
Electricity, Gas & Water Connections 1,443 2.9% 33.1%
Construction 334 0.7% 0.3%
Wholesale, Retail Trade & Car Repairs 749 1.5% 1.4%
Hotels and Restaurants 39 0.1% 0.4%
Transport, Storage & Communication 1078 2.1% 7.1%
Financial intermediaries 797 1.6% 16.7%
Real Estate & Renting Services 336 0.7% 2.8%
Public Administration 27,518 54.7% 51.5%
Education 9,606 19.1% 48.3%
Health & Social Work 2,250 4.5% 19.5%
Community & Personal Services 1,376 2.7% 13.6%
Domestic Services 143 0.3% 0.3%
Other 36 0.1% 3.1%
Total 50,282 100% 11.5%
Notes: Source of data: QATAR Planning Council (2006)
National Labour Availability
5.11.11 There are no reliable data sources available on the number or skills of Qatari nationals
available for work currently. Table 5.15 sets out the categorisation of the economic
inactivity Qataris aged 15 years or over. The Qatari unemployment rate, as a percentage
of the total workforce, is approximately 1.1%.
Table 5.15 – Economically Inactive Qatari Population (15+)
Category 2004 %
Retired and Not Seeking Work 2,783 4.8%
Not Working or Seeking Work 4,896 8.5%
Disabled 1,150 2.0%
Housewife 24,388 42.4%
Student 24,293 42.2%
Total 57,510 100%
Notes: Source of data: QATAR Planning Council (2006)
Qatalum EIA Report
Contract No: QA-S1-NHT-B44-5279586 Doc Ref: QA-00-ATK-F15-00001-FINAL
5035013/01-01/EIA 4Dec06 rev02.doc 5-62
Governance and Social Structure
Overview
5.11.12 The rule of the State of Qatar is hereditary in the family of Al Thani, who settled in Qatar
peninsula early in the 18th century. The Emir is the Head of the State, who, according to
the Amended Provisional Basic Statute of rule in the country, holds legislative power and
issues the laws, proposed by the Council of Ministers, after consulting the Advisory
Council.
5.11.13 The constitution of the State of Qatar has passed through transitional stages, starting in
1970, when the first provisional system of governance was enacted. This system was
revised in 1972 after the national independence, and amended to address the
requirements and responsibilities of this new stage. Thereafter, the features and objectives
of the State's policies and affiliations were defined at the regional, Arabic and Islamic
levels.
Ministerial Responsibility
5.11.14 Most of the Ministries in the Qatar Government have responsibilities covering the various
aspects of the Qatalum Project; these include:
• Ministry of Economy and Commerce – responsible for formulation and
implementation of growth strategies for Qatar and industrial and commercial
strategy formulation and implementation for the country;
• Ministry of Civil Affairs and Housing – responsible for finding Qatari labour for
employment in all activities, influence on training available, particularly at
vocational level and for vocational studies institutes. Welfare of women and
children and promotion of women’s employment outside the home, women’s
associations and payment of social welfare entitlements. Overall provision of
housing;
• Ministry of Interior – responsible for approving visas for visitors to the country;
• Ministry of Health – responsible for the design, implementation, and management
of health services to the Qatari population throughout the country; and
• Ministry of Education – responsible for the provision of primary and secondary
education to Qatari children along with all University education provision and
quality and teacher training.
Local Government
5.11.15 QP/MIC Authority Management Team undertakes the role of local government for the
Mesaieed area. There is however, no formal consultation, participation or election process
for the expatriate workers currently working and living in the area.
Education and Education Services
5.11.16 The education level of Qataris aged over 15 years is high; approximately 21 percent are
educated to degree level or higher. Overall adult literacy rates are high, with 94% of males
and 87% of females being literate; only an average 10% of the population is illiterate.
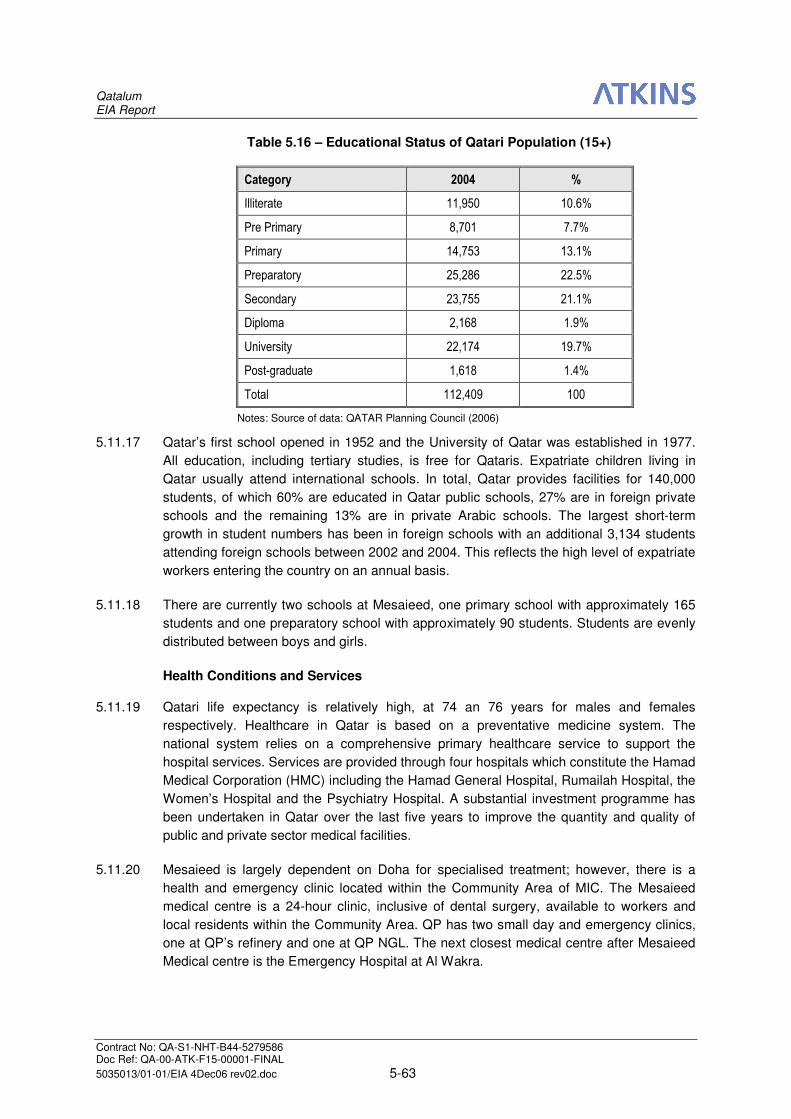
Qatalum EIA Report
Contract No: QA-S1-NHT-B44-5279586 Doc Ref: QA-00-ATK-F15-00001-FINAL
5035013/01-01/EIA 4Dec06 rev02.doc 5-63
Table 5.16 – Educational Status of Qatari Population (15+)
Category 2004 %
Illiterate 11,950 10.6%
Pre Primary 8,701 7.7%
Primary 14,753 13.1%
Preparatory 25,286 22.5%
Secondary 23,755 21.1%
Diploma 2,168 1.9%
University 22,174 19.7%
Post-graduate 1,618 1.4%
Total 112,409 100
Notes: Source of data: QATAR Planning Council (2006)
5.11.17 Qatar’s first school opened in 1952 and the University of Qatar was established in 1977.
All education, including tertiary studies, is free for Qataris. Expatriate children living in
Qatar usually attend international schools. In total, Qatar provides facilities for 140,000
students, of which 60% are educated in Qatar public schools, 27% are in foreign private
schools and the remaining 13% are in private Arabic schools. The largest short-term
growth in student numbers has been in foreign schools with an additional 3,134 students
attending foreign schools between 2002 and 2004. This reflects the high level of expatriate
workers entering the country on an annual basis.
5.11.18 There are currently two schools at Mesaieed, one primary school with approximately 165
students and one preparatory school with approximately 90 students. Students are evenly
distributed between boys and girls.
Health Conditions and Services
5.11.19 Qatari life expectancy is relatively high, at 74 an 76 years for males and females
respectively. Healthcare in Qatar is based on a preventative medicine system. The
national system relies on a comprehensive primary healthcare service to support the
hospital services. Services are provided through four hospitals which constitute the Hamad
Medical Corporation (HMC) including the Hamad General Hospital, Rumailah Hospital, the
Women’s Hospital and the Psychiatry Hospital. A substantial investment programme has
been undertaken in Qatar over the last five years to improve the quantity and quality of
public and private sector medical facilities.
5.11.20 Mesaieed is largely dependent on Doha for specialised treatment; however, there is a
health and emergency clinic located within the Community Area of MIC. The Mesaieed
medical centre is a 24-hour clinic, inclusive of dental surgery, available to workers and
local residents within the Community Area. QP has two small day and emergency clinics,
one at QP’s refinery and one at QP NGL. The next closest medical centre after Mesaieed
Medical centre is the Emergency Hospital at Al Wakra.
Qatalum EIA Report
Contract No: QA-S1-NHT-B44-5279586 Doc Ref: QA-00-ATK-F15-00001-FINAL
5035013/01-01/EIA 4Dec06 rev02.doc 5-64
5.11.21 One of the most significant health complaints is asthma; this is not uniquely linked to the
Mesaieed Area, it is a general health problem throughout Qatar - most likely due to the
high levels of suspended fine particulates in the atmosphere.
History and Culture
5.11.22 Limited data exist on the human use of the MIC area prior to the industrial developments.
Anecdotal reports suggest that fishing was commonplace; although fishing is now
forbidden in the area of Mesaieed port and approach channels.
5.11.23 A significant investment programme is currently underway to improve and develop Qatar’s
arts and cultural education and interpretation. US$150 million has been invested in the
Museum of Islamic Arts project and a further US$125 in the Qatar National Library.
Additionally, a Photographic Museum is due for completion and a Cultural Village is to be
located in West Bay area of Doha. The complex is to include mosques and traditional
souqs as well as recreational facilities.
Archaeology
5.11.24 Archaeological evidence suggests human existence in the Arabian Peninsula since early
Pleistocene and Lower Palaeolithic times. Qatar, being part of the Arabian mainland, is
thought to have been inhabited by man during these times. Surveys produced in the 1960s
by Danish archaeologists revealed Qatar to be one of the richest Stone Age54
.
5.11.25 As part of the preparation of the Community Area Master Plan for MIC it was established
that no sites of archaeological importance existed in either the community area or the
industrial area. However, Mesaieed is recognised as an area of archaeological
significance dating back 1 million years. During the 1960s survey, the Danish
Archaeological team collected flint artefacts from an excavation site in Mesaieed, possibly
a site where flint tools where made. Pointed blade implements and arrowheads were also
recorded; however, further detailed information is not available for the Mesaieed sites.
National Infrastructure
5.11.26 In 2005, Qatar started its first public transport system, which continues to become more
sophisticated as a result of the additional transport routes being added to the network.
Private car ownership or company-provided transport is the dominant form of
transportation. The road network is based on a system of ring and radial roads within
which the roads are categorised as follows (State of Qatar, 2000):
• Primary Roads of strategic importance, which are mainly dual carriageways
covering approximately 640 km in length;
• Secondary Roads, generally dual carriageways, covering approximately 524 km;
• Tertiary Roads (also known as District Distributors, Local Distributors and Access
Roads), which are approximately 374 km in length; and
• Local Roads.
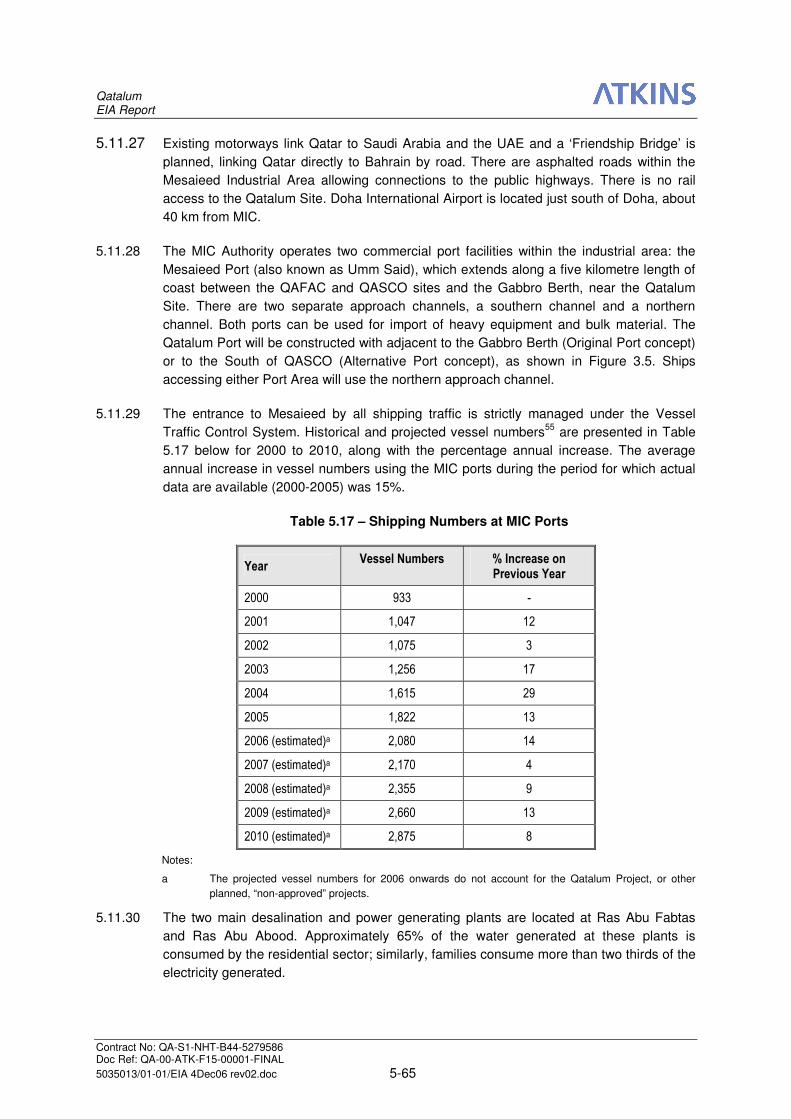
Qatalum EIA Report
Contract No: QA-S1-NHT-B44-5279586 Doc Ref: QA-00-ATK-F15-00001-FINAL
5035013/01-01/EIA 4Dec06 rev02.doc 5-65
5.11.27 Existing motorways link Qatar to Saudi Arabia and the UAE and a ‘Friendship Bridge’ is
planned, linking Qatar directly to Bahrain by road. There are asphalted roads within the
Mesaieed Industrial Area allowing connections to the public highways. There is no rail
access to the Qatalum Site. Doha International Airport is located just south of Doha, about
40 km from MIC.
5.11.28 The MIC Authority operates two commercial port facilities within the industrial area: the
Mesaieed Port (also known as Umm Said), which extends along a five kilometre length of
coast between the QAFAC and QASCO sites and the Gabbro Berth, near the Qatalum
Site. There are two separate approach channels, a southern channel and a northern
channel. Both ports can be used for import of heavy equipment and bulk material. The
Qatalum Port will be constructed with adjacent to the Gabbro Berth (Original Port concept)
or to the South of QASCO (Alternative Port concept), as shown in Figure 3.5. Ships
accessing either Port Area will use the northern approach channel.
5.11.29 The entrance to Mesaieed by all shipping traffic is strictly managed under the Vessel
Traffic Control System. Historical and projected vessel numbers55
are presented in Table
5.17 below for 2000 to 2010, along with the percentage annual increase. The average
annual increase in vessel numbers using the MIC ports during the period for which actual
data are available (2000-2005) was 15%.
Table 5.17 – Shipping Numbers at MIC Ports
Year Vessel Numbers % Increase on
Previous Year
2000 933 -
2001 1,047 12
2002 1,075 3
2003 1,256 17
2004 1,615 29
2005 1,822 13
2006 (estimated)a 2,080 14
2007 (estimated)a 2,170 4
2008 (estimated)a 2,355 9
2009 (estimated)a 2,660 13
2010 (estimated)a 2,875 8
Notes:
a The projected vessel numbers for 2006 onwards do not account for the Qatalum Project, or other
planned, “non-approved” projects.
5.11.30 The two main desalination and power generating plants are located at Ras Abu Fabtas
and Ras Abu Abood. Approximately 65% of the water generated at these plants is
consumed by the residential sector; similarly, families consume more than two thirds of the
electricity generated.
Qatalum EIA Report
Contract No: QA-S1-NHT-B44-5279586 Doc Ref: QA-00-ATK-F15-00001-FINAL
5035013/01-01/EIA 4Dec06 rev02.doc 5-66
5.11.31 Two thirds of the population of Qatar are connected to the drainage network, placing
pressure on the drainage department to expand the sewerage system, particularly over
the more densely populated areas.
National and Regional Development
Qatar Master Plan 2025
5.11.32 The Ministry of Economy and Commerce set out the vision for the Qatar economy as
follows ‘Deregulated and diversified economy with sustainable growth and able to
integrate onto the global economy.’ The Ministry has a mission to support the opening and
diversification of the economy leading to the development of a vibrant private sector able
to complete regionally and internationally. The Ministry identifies the mechanism of
achieving this mission through:
• planning and preparing for the future;
• providing the best-in class business environment in Qatar;
• integrating Qatar into the global economy;
• promoting and supporting local and foreign investments;
• supporting the employment and the development of Qatari in the private sector;
and
• positioning the Ministry as a role model in terms of efficiency and quality of
services.
5.11.33 The Qatari Urban Planning and Development Authority is in the process of preparing a
comprehensive long-term Master Plan for Qatar that will guide the physical development
of Qatar to 2025. This Master Plan for Qatar will cover all aspects of development and will
consolidate existing Master Plans (Education City, Pearl of the Gulf, Lusail development,
New International Airport, Doha Port, etc) into one integrated blueprint for future
development of the country.
5.11.34 The aspirational targets for growth within the Master Plan are currently under review
however indicative growth targets driven by non-oil GDP growth the targets for economic
growth over the next twenty years are equivalent to 7.4% per annum.
Mesaieed Industrial City Master Plans
5.11.35 There are two Master Plans for Mesaieed Industrial City, one for the Community Area and
one for the Industrial Area.
5.11.36 The Master Plan for the Community Area has been prepared and consists of the full range
of housing, retail, leisure, recreation, health, education and other community facilities
necessary to sustain a large scale industrial area. The Plan has provision for a permanent
population of 24,700, which is expected by 2028; however, the driver of the change in
population of the MIC Community Area is the further development of the Industrial Area.
5.11.37 The Industrial Area Master Plan is currently under preparation, the plan has not yet been
approved and further details are not available.