5. freight forecasting and demand management
TRANSCRIPT

19
5.1 Understanding what to measureEvery type of building generates a freight task. Every weekday, approximately one commercial vehicle travels into the Sydney CBD for every 20 people living or working inside the city. Of course, not everyone requires one-twentieth of a truck or van on a typical day, however morning coffees, lunches, stationery and office supplies, business documents, groceries, maintenance activities and waste removal requirements all add up.
There are several ways to measure the activity of freight and servicing vehicles. Each measurement tells its own story about the task. Table 3 outlines these different measurements.
According to a 2014 TfNSW CBD cordon count, approximately 35,000 commercial vehicles come into the Sydney CBD each weekday. Drivers of these vehicles park in loading docks or at the kerb to complete their tasks. For this reason, loading dock driveway counts are not a definitive record of all freight activity.
To assess total activity accurately, measurements of a building’s freight task need to include both on-street activity and off-street loading dock activity. TfNSW’s assessments show that between 10 and 25 per cent of a building’s servicing activity is conducted on the adjacent street, for a variety of reasons that are outlined in Table 4.
Assessment of on-street activity should not focus only on compliant behaviour in loading zones. In congested areas, delivery and service vehicle drivers may parking in other zones, at times illegally. All this traffic, however, is generated by the survey building and hence needs to be captured to develop a comprehensive understanding of demand.It is also important to capture smaller movements as well such as bicycle couriers deliveries and walking couriers. These movements also form part of the freight demand generated by a building.
Consider
Whether a driver uses a loading dock or kerbside parking to complete their freight or servicing task, planners need to record both activities as attributable to the building.
This section provides guidance to assist planners, developers and other stakeholders measure freight activity in a building or precinct. It outlines several methods TfNSW and other authorities have used in recent years to measure and assess on- and off-street freight activity.
5. Freight forecasting and demand management
Table 3 Ways of measuring freight and servicing activity
Freight activity measurement Explanation
Vehicles approaching and entering the CBD
This has been measured previously via cordon counts at 15 CBD entry points, with the help of the Sydney Coordinated Adaptive Traffic System (SCATS). SCATS uses sensors that enable general traffic counts. Additional surveillance of specific vehicle types is required to support this measurement.
Circulation of traffic in the CBD Using a method similar to the one described above, this is measured by assessing how vehicles move in the CBD, often as they search for parking to complete deliveries.
Vehicles using kerbside loading zones Data from parking ticket machines provides an indication of kerbside loading zone activity in the Sydney CBD. TfNSW has also undertaken video assessments to measure this activity.
Vehicles using off-street loading facilities
This is measured by carpark data and driveway counts capturing loading dock activity.

20
Reasons for on-street servicing Explanation
Loading dock accessibility • Driveway is difficult to navigate• Dock entrance height is too low• Dock is not open when needed e.g. security restrictions• The street location of the dock entrance: it may be in a congested location, in a
one-way system or all of the above.
The availability of loading zones adjacent to the building
If a loading zone is available adjacent to a building, then a driver may use it for speedier delivery.
Amount of dwell time required If the delivery is simple – a courier consignment of one small and light parcel, for instance – the driver may try to find a space on the street near the building rather than spending time entering a loading dock.
Making deliveries to several neighbouring buildings
If a driver has multiple deliveries for different buildings in the same vicinity, they may elect to park on a street within walking distance of all destinations, rather than going in and out of multiple docks.
A booking is required If the delivery company is required to make a booking to access the loading dock but has not, the driver may need to park on a nearby street.
Table 4 Reasons delivery drivers use on-street parking
5.2 Measuring on-street activityThis section profiles some common on-street loading zone activities and discusses ways to compile and use information about these activities for better planning.
5.2.1 A day in the life of an on-street loading zoneFigure 7 illustrates the typical weekday profile of freight activity in an on-street loading zone in the Sydney CBD. The pattern it displays is consistent with other centres in Sydney and other cities around the world that have no access restrictions on freight and servicing vehicles. Figure 7 does not include overnight activity, which can account for as much as 10-12 per cent of total activity.
A noticeable trend between 2016 and 2019 is the growth in early morning activity, particularly between 6am and 7am. Loading zone activities in this hour increased by 72 per cent over the three year period. The earlier start probably translates into an earlier finish, with less loading zone activity occurring in the afternoon by 2019.
Figure 7 Loading zone activity in the Sydney CBD (City of Sydney)

21
In the Sydney CBD, loading zones are provided to freight and servicing operators throughout the day. The availability of these zones changes throughout the day depending on public transport, general traffic and commercial vehicle demand. It is easier to provide most loading zone capacity between the AM and PM peak periods. In peak periods, public transport movements take priority in kerbside lanes.
As Figure 7 shows, loading zone demand decreases in the afternoon. After 3pm, the main freight and servicing activity in loading zones is typically couriers collecting consignments from businesses.
Figure 8 illustrates the provision of and demand for loading zone space in the Sydney CBD. It suggests there is still spare capacity in the early mornings prior to the AM peak, and in the early afternoons prior to the PM peak. In the middle of the day, however, the demand for loading zones exceeds operational capacity.
Figure 8 Weekday loading zone provision and demand by period of the day

22
CASE STUDY A tale of two CBDs
Sydney and Parramatta CBDs are at different stages of evolution. Sydney is continuing its evolution as a global CBD, while Parramatta is transforming from a district centre into a major CBD. As a result, parking provision and freight and servicing behaviour is markedly different in each city.
Parramatta is already a significant city in metropolitan Sydney, supporting 257,000 residents and 185,000 jobs in 2020 (City of Parramatta [CoP] 2020). It is expected to grow considerably in the next 20 years as part of a three-city strategy for Greater Sydney, in which it is referred to as the Central River City. The population is expected to increase by 79.5 per cent between 2020 and 2041 (CoP 2020). The city will also grow as an employment centre. TfNSW expects its corresponding freight task to grow substantially each year, matching residential and jobs growth.
Figure 9 illustrates the differences in loading zone use in the two cities across the day. These graphs are based on assessments conducted by TfNSW in the Sydney and Parramatta CBDs in March 2016 and October 2017 respectively. The most noticeable difference is that private vehicles account for an average of 43 per cent of loading zone use in Parramatta, compared to an average of 26 per cent in Sydney.
However, what this graph does not show is that in Parramatta, only 49 per cent of commercial vehicles using on-street parking are completing their activities in signposted loading zones. The majority of commercial vehicles use other types of kerbside parking.
In the past, the Sydney CBD provided similar levels of on-street parking to Parramatta. Today, however, the Sydney CBD has virtually no general on-street parking, meaning most freight activity is conducted from loading zones.
In this and other assessments, it is important to remember that loading zones are not always the sole location of freight activity.
Deliveries in George Street, Parramatta

Figure 9 Comparison of loading zone use in Parramatta and Sydney CBDs
5.2.2 Methods to assess on-street activityThis section sets out a methodology for analysing on-street freight demand and kerbside activity. It is based on TfNSW’s own work surveying Sydney streets for delivery and servicing activity. It aims to help planners and developers understand why this activity occurs as it does, measure its scale and plan for it appropriately.
This method involves collecting both quantitative and qualitative data. This combination enhances the evaluation of street activity by ensuring the limitations of certain types of data are balanced by the strengths of others.
The following sections list ways for planners, developers and other stakeholders to collect data about on-street freight and servicing activity.
5.2.2.1 Loading zone ticket or sensor data
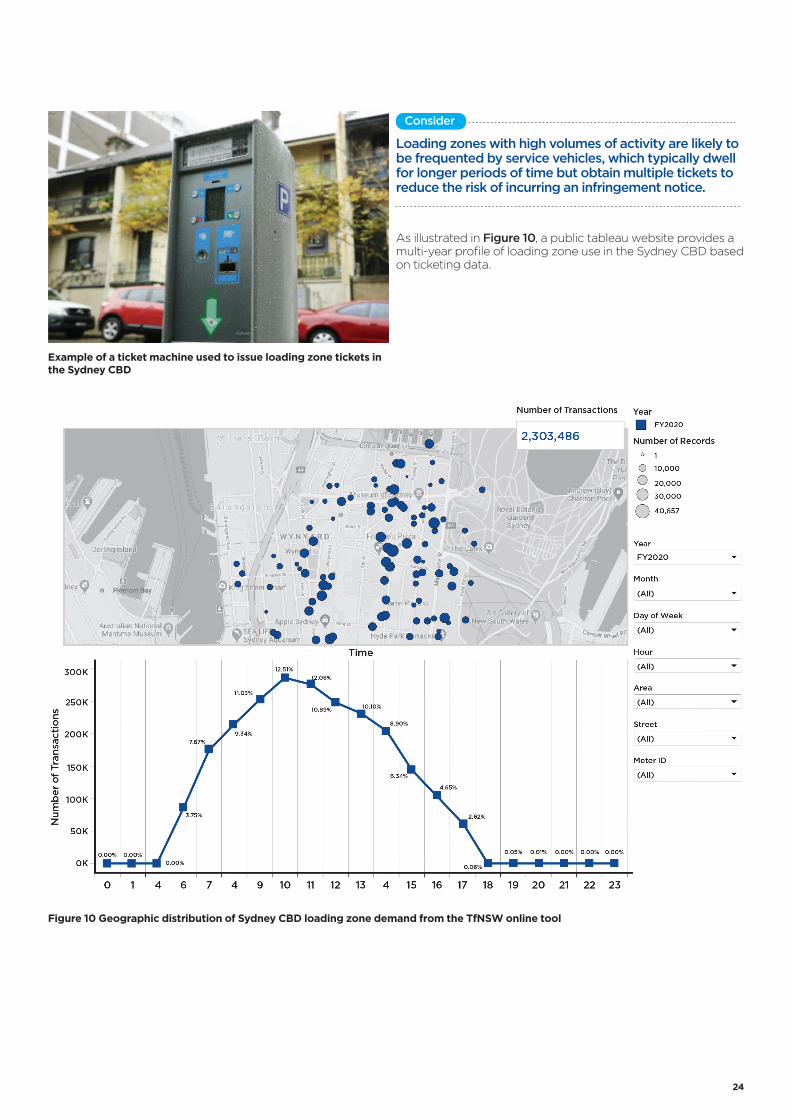
In the Sydney CBD, many loading zones are managed using kerbside ticket machines. In these zones, drivers are required to display a ticket on their vehicle to park and make deliveries. These tickets contain the event date, time, meter number and street or area in which the parking activity occurs. With such infrastructure in place, the machines can be a consistent source of ongoing data. The data from these ticket machine transactions can provide insights into the geographical distribution of freight and servicing volume, as demonstrated in Figure 10. It can also help stakeholders build an hourly or even monthly profile of loading zones (if the dataset has sufficient historical data). This is useful for understanding the impacts of wide scale initiatives.
Although ticketing data is helpful for measuring actual vehicle volumes in loading zones, it does not directly identify types of vehicles, driver behaviours, or departure and dwell times. To get a complete picture, it is crucial to complement ticketing data with other forms of quantitative data, such as kerbside surveys. Solutions that capture vehicle registration and/or use in-ground sensors can provide more information.
23
24
Example of a ticket machine used to issue loading zone tickets in the Sydney CBD
Consider
Loading zones with high volumes of activity are likely to be frequented by service vehicles, which typically dwell for longer periods of time but obtain multiple tickets to reduce the risk of incurring an infringement notice.
As illustrated in Figure 10, a public tableau website provides a multi-year profile of loading zone use in the Sydney CBD based on ticketing data.
Figure 10 Geographic distribution of Sydney CBD loading zone demand from the TfNSW online tool

25
A video survey should ideally cover an entire study area, preferably for a full 24-hour, seven-day week – 168 hours in total. It should be conducted at a time of year with representative traffic flows, pedestrian footfall, and delivery and servicing conditions. Wherever possible, surveys should not be undertaken during public holidays, school holidays or other major events.
When defining the study area for the video survey, researchers should identify all potential parking locations – including private parking and rear accesses – to ensure they capture all kerbside activity. Other factors to consider include the nature of the land uses, such as any nearby events or construction projects, which may reduce the accuracy or reproducibility of the video survey results.
Camera location and resolution are particularly important to the success of video surveys. Camera angles should be reviewed before an assessment is commenced to ensure, as far as possible, that the entire kerb is visible and there are no obstacles obstructing the view. The best results are captured when a camera is pointing diagonally across a street. Reviewers should be able to clearly identify the type of vehicle on camera, the time of its arrival and departure, and the driver’s activity – for instance, whether they are delivering parcels to an office or tools for a construction site.
The video survey should record the following information for all vehicles stopping at the kerbside in a study area:
• location• date and time of arrival• date and time of departure• length of stay• vehicle type• trip purpose and/or movement type• kerbside zone used• where possible, some commentary on what delivery and
servicing vehicle drivers were doing – for example, waste collection or material delivery.
Researchers should also ensure they comply with their obligations under the NSW Privacy and Personal Information Protection Act 1998 in the design of the survey and collection of data.
An example of a camera used for data capture mounted on a light pole
5.2.2.2 Kerbside video assessment
Video surveys can generate large amounts of data and provide researchers with valuable insights into kerbside behaviours in their study area. They can provide not only data on the number and type of movements, but also insights into driver behaviours and compliance levels.
Example of video footage captured over a three hour period as part of a kerbside survey conducted by TfNSW showing the driver of a ute parking for longer than the permitted time.

26
5.2.2.3 Manual survey of freight vehicle parking
The purpose of a manual survey is twofold: to capture the number and type of movements; and to develop a broader understanding of the variables that affect kerbside delivery and servicing activity. A manual survey should be conducted across a large enough area to ensure data is representative. While it may not be possible to conduct a manual survey for 24 hours each day over seven consecutive days, at a minimum, surveys should focus on peak days and peak times (see the profile in Figure 7 for guidance).
As with a video survey, for each movement a manual survey should capture:
• location• date and time of arrival• date and time of departure• length of stay• vehicle type• trip purpose and/or movement type
o kerbside zone usedo where possible, some commentary on what delivery
and servicing vehicle drivers were doing – for example, waste collection or material delivery.
The availability of nearby parking at a destination can influence the behaviour of drivers and should therefore be captured in the survey where possible. Researchers should also identify illegal behaviours such as overstaying.
5.2.2.4 Ethnographic research
Ethnographic research refers to any kind of research where researchers observe and/or interact with subjects in the subjects’ real-life environments. The most useful form of ethnographic research to help understand the last mile freight and servicing task is a motion study or “ride along”.
In a motion study, researchers shadow a courier driver for a day to capture quantitative data about their movements. To ensure that their presence does not affect the driver’s ability to carry out their normal tasks or affect the results of the study in any other way, researchers can use geo-tracking devices (see Figure 11), audio-recording devices and dashboard cameras. The type of data that should be captured includes:
• stop number and type (loading zone, dock)• location (nearest address or latitude and longitude)• parcel information, including:
o number of customers serviced at stopo number of B2C/B2B parcelso number of parcel pickupso number of failed deliveries
• time information, including:o arrival timeo departure timeo parking duration/dwell timeo time spent driving in cityo time spent driving to/from cityo unproductive driving time, e.g. circling the block,
looking for a space
• distance information, including:o driving distanceo unproductive driving distance, e.g. circling the block,
looking for a spaceo walking distance.

27
5.2.2.5 Interviews and surveys for businesses
Before conducting face-to-face interviews and undertaking surveys, it is important to evaluate how qualitative feedback will capture attitudes, behaviours and perspectives in relation to kerbside assessment.
In designing questions, it is vital to convey the purpose of the interview or survey and ensure the questions clearly identify what is being asked. For example, some participants may not be familiar with delivery and servicing activity and kerbside behaviours. Relevant terms and concepts should be explained in order for participants to provide informed responses. This may include explaining the configuration of the kerbside in the immediate vicinity of the focus area so that participants think about that space and how it is used.
Interviewers should consider whether to conduct interviews and surveys with those who are generating freight (procuring goods and services) as well as the freight and servicing providers servicing the building.
For larger surveys and those focussing on behavioural insights and other more subjective measures, it is recommended that a professional research provider is engaged to ensure that the information gathered is consistent and robust.
Figure 11 An example of delivery activity captured using a geo-tracking tool
28
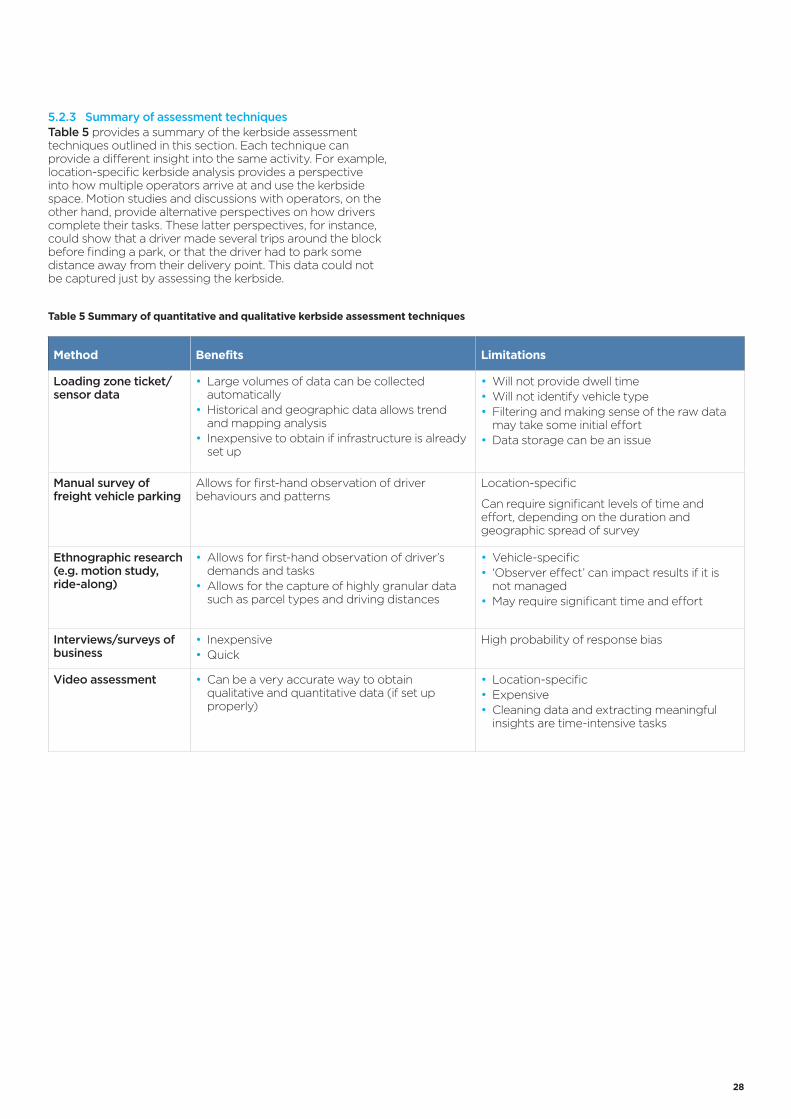
Table 5 Summary of quantitative and qualitative kerbside assessment techniques
Method Benefits Limitations
Loading zone ticket/sensor data
• Large volumes of data can be collected automatically
• Historical and geographic data allows trend and mapping analysis
• Inexpensive to obtain if infrastructure is already set up
• Will not provide dwell time• Will not identify vehicle type• Filtering and making sense of the raw data
may take some initial effort• Data storage can be an issue
Manual survey of freight vehicle parking
Allows for first-hand observation of driver behaviours and patterns
Location-specific
Can require significant levels of time and effort, depending on the duration and geographic spread of survey
Ethnographic research (e.g. motion study, ride-along)
• Allows for first-hand observation of driver’s demands and tasks
• Allows for the capture of highly granular data such as parcel types and driving distances
• Vehicle-specific• ‘Observer effect’ can impact results if it is
not managed • May require significant time and effort
Interviews/surveys of business
• Inexpensive• Quick
High probability of response bias
Video assessment • Can be a very accurate way to obtain qualitative and quantitative data (if set up properly)
• Location-specific• Expensive• Cleaning data and extracting meaningful
insights are time-intensive tasks
5.2.3 Summary of assessment techniquesTable 5 provides a summary of the kerbside assessment techniques outlined in this section. Each technique can provide a different insight into the same activity. For example, location-specific kerbside analysis provides a perspective into how multiple operators arrive at and use the kerbside space. Motion studies and discussions with operators, on the other hand, provide alternative perspectives on how drivers complete their tasks. These latter perspectives, for instance, could show that a driver made several trips around the block before finding a park, or that the driver had to park some distance away from their delivery point. This data could not be captured just by assessing the kerbside.

29
CASE STUDY Assessing behaviours of different loading zone user types
While arduous to process accurately, the data generated by one week of kerbside video surveillance can provide a wealth of helpful insights. Results from a 2018 video assessment of the Sydney CBD show:
• delivery vehicles dwelled for an average of 27 minutes, with 75 per cent of parking events being less than the 30 minute limit
• service vehicles dwelled for an average of 63 minutes, with more than 50 per cent of parking events taking more than 30 minutes. Approximately 15 per cent of parking events took more than two hours
• private vehicles, which can use loading zones for dropping off and picking up passengers, dwelled for an average of 15 minutes. Approximately 50 per cent of parking events took less than five minutes.
Figure 12 Dwell time results from 2018 TfNSW video assessment in the Sydney CBD
ServiceDelivery Passenger
40%
70%
90%
30%
60%
10%
50%
80%
100%
20%
0%
90 to 120
25 to 30
5 - 10
10 - 15
45 to 60
15 to 20
120+
30 to 45
0 - 5
60 to 90
20 to 25
Minutes of dwell time

30
5.3 Measuring off-street activityEvaluating the freight and servicing tasks of existing buildings can provide valuable insights to help planners and developers design new developments. This section profiles common loading dock characteristics and activities, and discusses ways stakeholders can compile and use data about these activities to improve planning.
The daily loading dock profile illustrated in Figure 13 is typical of many commercial buildings in the CBD, and shows that loading docks and kerbside loading zones share a similar daily profile. In this graph, movements are grouped into three-hour periods with activity typically peaking in the morning in response to customer requirements. In most cases, the customer must be present to receive a delivery. Delivery times often vary, being influenced by traffic conditions as well as drivers’ delivery schedules. However, it is reasonable to conclude that most deliveries to businesses in the city are completed between 6am and 12pm.
5.3.1 A typical day in the loading dock of a commercial building
Figure 13 Profile of deliveries into a large CBD commercial development
31
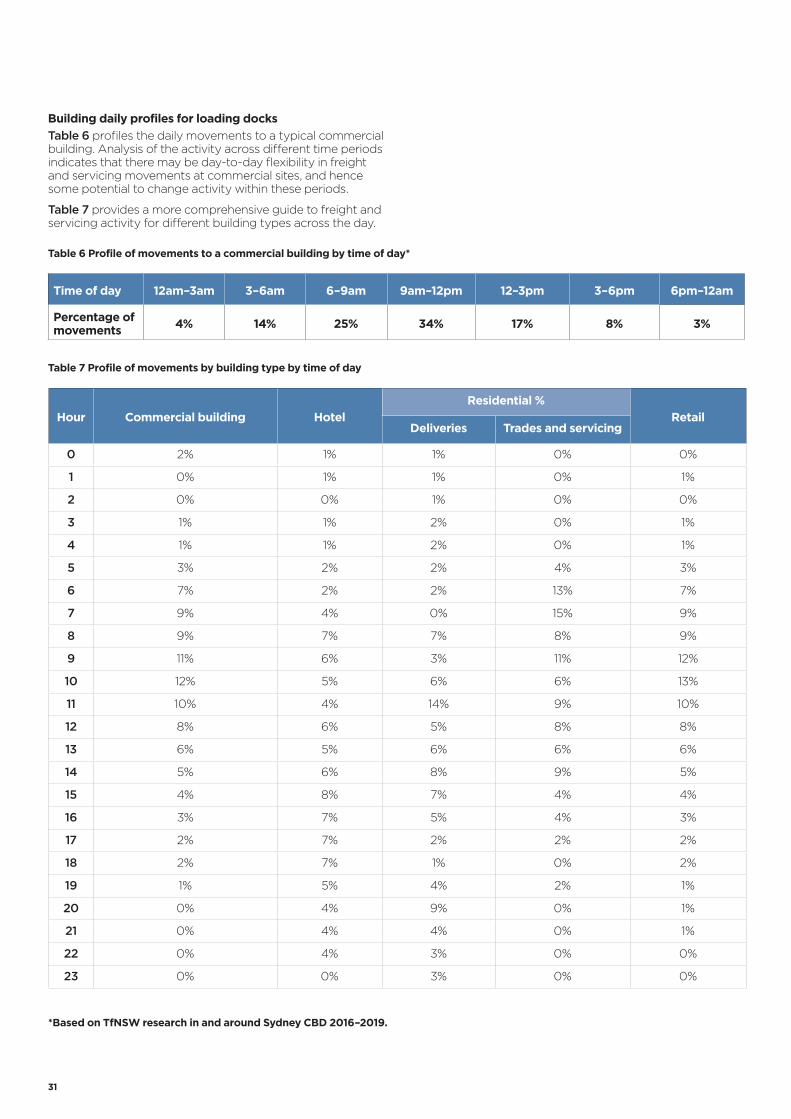
Table 7 Profile of movements by building type by time of day
Hour Commercial building Hotel
Residential %
RetailDeliveries Trades and servicing
0 2% 1% 1% 0% 0%
1 0% 1% 1% 0% 1%
2 0% 0% 1% 0% 0%
3 1% 1% 2% 0% 1%
4 1% 1% 2% 0% 1%
5 3% 2% 2% 4% 3%
6 7% 2% 2% 13% 7%
7 9% 4% 0% 15% 9%
8 9% 7% 7% 8% 9%
9 11% 6% 3% 11% 12%
10 12% 5% 6% 6% 13%
11 10% 4% 14% 9% 10%
12 8% 6% 5% 8% 8%
13 6% 5% 6% 6% 6%
14 5% 6% 8% 9% 5%
15 4% 8% 7% 4% 4%
16 3% 7% 5% 4% 3%
17 2% 7% 2% 2% 2%
18 2% 7% 1% 0% 2%
19 1% 5% 4% 2% 1%
20 0% 4% 9% 0% 1%
21 0% 4% 4% 0% 1%
22 0% 4% 3% 0% 0%
23 0% 0% 3% 0% 0%
*Based on TfNSW research in and around Sydney CBD 2016–2019.
Building daily profiles for loading docks
Table 6 profiles the daily movements to a typical commercial building. Analysis of the activity across different time periods indicates that there may be day-to-day flexibility in freight and servicing movements at commercial sites, and hence some potential to change activity within these periods.
Table 7 provides a more comprehensive guide to freight and servicing activity for different building types across the day.
Table 6 Profile of movements to a commercial building by time of day*
Time of day 12am–3am 3–6am 6–9am 9am–12pm 12–3pm 3–6pm 6pm–12am
Percentage of movements
4% 14% 25% 34% 17% 8% 3%

32
5.3.2 Loading dock assessmentBy profiling multiple buildings in Sydney, TfNSW has developed a good understanding of how to assess different buildings’ freight and servicing tasks. Together with TfNSW traffic generation rates, and traffic generation rates included in some Development Control Plans (DCPs), the assessment methods described in the following sections aim to give planners and developers a good indication of a building’s likely freight and servicing profile.
The loading dock in any new building needs to be large enough to manage the freight and servicing task the building is likely to generate over its lifecycle. This includes variations in its level of occupancy over time, and the type and number of its tenants. Accordingly, when assessing a loading dock to build its freight and servicing profile, it is important to account for:
• potential land use types (commercial, retail, residential, hotel or mixed-use)
• total building size – the space used (or gross floor area) for each land use type
• the number of tenancies in a building – multiple tenants are likely to generate more demand than one tenant occupying the same floor space
• types of businesses in a building – a three-star hotel without a restaurant will generate less freight demand than a five-star hotel with multiple restaurants.
Table 8 sets out the key characteristics to consider when profiling a loading dock and its accessibility.
Table 8 Information to capture to develop an accurate loading dock profile
Reasons for on-street servicing Explanation
Vehicle timing Document the arrival time, total dwell time and departure time of freight and servicing vehicles coming to the building.
Vehicle frequency Count vehicle arrivals to determine the frequency of activity, remembering that constraints on dock size can generate more deliveries by smaller vehicles than would be necessary if larger vehicles could be accommodated.
Vehicle type Profile the vehicles used for different types of deliveries, including their length and height.
Vehicle purpose While this is less straightforward to assess, an understanding of vehicles’ purposes will assist planners. For example, one trade vehicle parked on a renovation site all day could take up the same amount of space as 20 or more delivery vehicles making short stops throughout the day.
Daily profiles Account for minor day-to-day fluctuations in freight and servicing volume. Ideally, at least two days’ worth of data should be captured to build a profile.
The following sections outline specific ways to collect data on loading dock activity. It should be noted that these methods primarily record the number of vehicles servicing a building. It is important to keep in mind that one vehicle, especially a courier vehicle, entering a large commercial tower could be making deliveries to a number of different tenants in the same building.
5.3.2.1 Driveway count
A video count of vehicles entering a driveway provides an accurate record of off-street activity and enables a 24 hour, multi-day count. Depending on the angle and resolution of the camera, it may also be possible to establish the dwell time of each vehicle, which gives an indication of dock utilisation.
There are a number of ambiguities that can arise when undertaking a video driveway count:
• it is not always clear whether a vehicle is a freight, servicing or private vehicle. Signage, dwell time and any visible equipment carried on a vehicle may give an indication of its purpose
• some commercial vehicles such as utes and vans may also be used as private vehicles. Arrival and departure time, as well as any equipment being carried, may give a clearer indication of the vehicle’s purpose
• some private vehicles may also be used as freight and service vehicles. For example, a cleaner may use a car to travel to a customer’s location. Dwell time may give an indication of the vehicle’s purpose.
If a manual driveway count is undertaken, it should focus on the busiest period between 8am and 1pm, as the constraints that planners and developers need to consider will arise during this time.
In addition, it should not be assumed that because a building has a loading dock, all its freight and servicing activity is accommodated in the dock. In most cases, a portion of freight and servicing movements will still use on-street parking. As such, stakeholders should consider using the on-street assessment techniques set out in the previous section to supplement their off-street assessment.
5.3.2.2 Loading dock manager log
In some buildings, loading docks managers and attendants may log vehicle activity. However, where such logs exist, they may be handwritten or incomplete.
5.3.2.3 Loading dock booking records
Some large buildings have management systems that record booked and actual vehicle movements. These systems are designed for managing delivery activities, but they can also provide planners with details about what vehicle or company is making deliveries to which tenant. This information is particularly useful if it includes both booked and actual arrival times, as some companies may have block bookings that they do not always use.

33
5.3.2.4 Building tenants’ surveys
In commercial buildings, tenants can be asked to keep a record of their deliveries. This approach works well with smaller businesses but is more challenging in buildings with multiple tenants or large corporations, where many people may be placing orders. A differentiating factor of this approach is that it can provide information on multiple orders arriving by the same delivery vehicle. A driveway count of vehicles does not identify this. Particularly with eCommerce orders, coincidental drops of multiple orders going to the same destination can be common. Where possible, courier companies plan for coincidental drops to improve efficiency.
Table 9 Summary of quantitative and qualitative loading dock assessment techniques
Method Benefits Limitations
Driveway count • For off-street facilities, it provides a full record of arriving and departing vehicles and allows for assessment of dwell time and vehicle type.
• When using video, it enables a 24-hour understanding of activity, although manual assessment across a 4–5-hour peak period can also provide a good understanding.
• The quantity of items and number of consignments will not be captured.
• It needs a supporting, ideally concurrent, on-street assessment.
• It may be difficult to distinguish the purpose of vehicles where they are unmarked.
• Assessing individual dwell time is a time-consuming process.
• Driveways shared between the carparks and docks can complicate assessments.
Loading dock manager log
• An accurate log will provide a record of activity.
• The quality of the records might be inconsistent.
Loading dock booking system record
• It may provide a ready and accurate record.• It is likely to record information about the
purpose of the delivery.• If recorded, bookings and actual arrivals can
be compared.
• It might only be available for a small number of large, busy docks, offering no insight into the profiles of smaller buildings.
Building residents’ questionnaires
• It can provide insight into the type of freight and servicing movements as well as the number.
• It can link delivery details with annualised procurement records and help planners and managers design operational improvements.
• It requires consistent record-keeping by people who are already busy servicing their customers.
• It is better applied in a discrete building with a small number of interfaces than in a large commercial development.

34
5.3.3 Dock design standardsAustralian Standard AS 2890.2 (Standards Australia 2018) sets out the design and engineering standards for loading docks, including height and bay size. While it is a good resource for planners and developers, the standard does not provide trip generation rates or guidance on the number of spaces to allocate in a new dock.
TfNSW’s Guide to Traffic Impact Assessments includes figures for provision of loading docks based on assessed trip generation rates. Some councils also include trip generation rates within their DCPs. These rates are based on a reasonable number of vehicles likely to arrive in a given area and the space that should be provided for them. However, they offer no insight into the type of vehicle arriving, when it will arrive or for how long it will dwell.
5.3.4 Example: assessment of activity to support a loading dock design
The following approach describes a methodology for assessing loading dock activity. It is based on the assumption that the assessor has collated evidence from the sources described in Sections 5.2 and 5.3, and prorated this data to the size and profile of the building being planned.
Whether a driver uses a loading dock or kerbside parking to complete their freight or servicing task, planners need to record both activities as attributable to the building.
The steps below describe the process.
5.3.4.1 Dwell time demand
Table 10 shows a profile generated using data from the busiest hour of activity at a large CBD commercial development (Figure 13). In this example, the dock needs to accommodate approximately 23 vehicles every hour between 9am and 12pm. The profile also includes a supplementary estimate of on-street freight and servicing vehicle movements the building is likely to generate in the same period.
Table 10 Example of the loading dock profile at a large commercial building in the CBD
Number of vehicles in the busiest hour
Average dwell time
Total demand
Small – item deliveries from vans or SRVs
11 15 minutes 165 minutes
Large – item deliveries from MRVs
9 30 minutes 270 minutes
Trade/service providers
3 120 minutes 360 minutes*
Total 23 795 minutes
* This assessment only considers movements during the busiest hour. However, it is assumed that some other vehicles, which arrived before this period, may still be parked.
The example profile demonstrates that:
• nine of the 23 vehicles are MRVs requiring larger parking spaces and adequate room to manoeuvre. Deliveries from these vehicles are typically larger and take an average of 30 minutes to complete
• 11 vehicles are delivery vans or SRVs. These require smaller parking spaces and swept paths, and have shorter dwell times of 15 minutes on average
• the other three vehicles are service vehicles. These have an average dwell time of two hours. However, this time can vary significantly: an emergency locksmith may be onsite for 30 minutes; a plumber may stay several hours; workers completing a fit-out may park all day, every day for several weeks. The assessment assumes that some vehicles are still there from the previous hour and their presence reduces dock capacity.
5.3.4.2 Number of dock spaces required
Table 10 indicates a total dwell time demand of 795 minutes for the hour-long period. If vehicles were to arrive at precise intervals and dwell for the estimated average time, the example loading dock would require 13–14 spaces to accommodate the 23 movements forecast for the busiest hour. The dock would also need to provide large parking spaces and enough manoeuvring room to accommodate bigger vehicles.
5.3.4.3 Operational efficiency during the busiest period
In reality, vehicles do not arrive at precise intervals or dwell for a uniform time. The 23 vehicles forecast to arrive during the busiest hour will arrive somewhat randomly and their dwell time will vary. This randomness and variation mean the maximum practical capacity of the loading dock is likely to be less than its theoretical capacity.
Generally, operational capacity is estimated to be 75 to 80 per cent of designed capacity. Thus, the example loading dock, while theoretically requiring 14 spaces to accommodate demand during the busiest hour, would in fact require 18 spaces to operate efficiently, including bays large enough to accommodate the bigger vehicles.
5.3.4.4 Implications of constrained space
In the building used as an example in Figure 13 and in this section, the loading dock contains just 12 spaces. This means it will become congested during busiest periods, causing drivers to either queue or seek alternative parking, for instance in kerbside loading zones.
In the long term, this dock will develop a poor reputation, and freight and servicing vehicle drivers will be more likely to seek out on-street parking instead of using it. In more extreme circumstances, suppliers may be reluctant to deliver to the location at all, or negotiate special terms for a delivery to be made.
5.3.4.5 Evaluation of proposed dock
To avoid negative outcomes and provide adequate capacity, a proposal for a new loading dock should address the questions set out in Table 11.

35
5.3.4.6 Example dock evaluations
Table 12 and Table 13 show worked examples of how a planner or developer might respond to these questions. In the example in Table 12, the dock has two HRV/MRV spaces, two SRV spaces and seven spaces for smaller vehicles. In the example in Table 13, the dock has one MRV space, two SRV spaces and six spaces for smaller vehicles.
In the tables:
• green indicates utilisation is less than 75 per cent and the dock can function effectively
• amber indicates utilisation is between 75–100 per cent and additional management strategies are needed to enable the dock to function efficiently
• red indicates utilisation is over 100 per cent and the dock cannot meet demand, even with additional management strategies in place.
In the Table 12 example, high utilisation in the busiest hour overall and the peak period for MRVs and SRVs could limit deliveries and result in vehicles queueing. While the dock may be able to accommodate short-term spikes in demand, longer periods in which demand exceeds capacity are far more challenging. The example in Table 12 is deemed ‘acceptable’ on the basis that additional management strategies can be implemented to manage the dock during peak demand periods. These mitigation measures are detailed in Section 6.
The example in Table 13 is deemed unacceptable. This facility does not have the capacity to accommodate the MRV and SRV movements the building generates. It is likely that drivers will either be forced to queue or find on-street parking to make deliveries to the building.
Table 11 Loading dock assessment criteria
Proposed dock spaces:
Number of HRV, MRV, SRV, and vans/utes spaces
For HRVs, MRVs and SRVs (larger vehicles) For total vehicle movements
Is demand in the busiest hour likely to be manageable with these spaces?
Yes/No/Maybe Utilisation of space = %
Yes/No/Maybe Utilisation of space = %
Is peak period demand (9am to 12pm) likely to be manageable with these spaces?
Yes/No/Maybe Utilisation of space = %
Yes/No/Maybe Utilisation of space = %
Is total daily demand (12 hours per day) likely to be manageable?
Yes/No/Maybe Utilisation of space = %
Yes/No/Maybe Utilisation of space = %
Proposed dock spaces:
2 HRVs/MRVs, 2 SRVs, 7 vans/utes
For HRVs, MRVs and SRVs For total vehicle movements
Is peak hour demand likely to be manageable?
(Potentially) Utilisation of space = 95%
(Potentially) Utilisation of space = 80%
Is peak period demand (9am to 12pm) likely to be manageable?
(Potentially) Utilisation of space = 80%
(Yes) Utilisation of space = 75%
Is total daily demand (12 hours per day) likely to be manageable?
(Yes) Utilisation of space = 55%
(Yes) Utilisation of space = 50%
Table 12 Example of operationally acceptable results for dock planning by vehicle types
Proposed dock spaces
1 MRV, 2 SRV, 6 vans/utes
For HRVs, MRVs and SRVs For total vehicle movements
Is peak hour demand likely to be manageable?
(No) Utilisation of space = 120%
(Potentially) Utilisation of space = 100%
Is peak period demand (9am to 12pm) likely to be manageable?
(Potentially) Utilisation of space = 95%
(Potentially) Utilisation of space = 90%
Is total daily demand (12 hours per day) likely to be manageable?
(Yes) Utilisation of space = 70%
(Yes) Utilisation of space = 65%
Table 13 Example of operationally unacceptable results for dock planning by vehicle types

36
5.3.4.7 Mitigation measures
Mitigation measures can be employed where it is not practical or feasible to build more dock space to meet the demand from freight and servicing vehicles. Sections 6 and 8 of this document outline some of these measures. It is important to note that such measures, while saving in the capital outlay involved in expanding or building new docks, do increase operational costs.
5.3.4.8 Profiling demand by usage type
As well as building the assessments shown above, planners can create profiles by plotting the demands of each type of user in a building’s loading dock. Where Figure 13 focuses on vehicle types, Figure 14 shows the profile of a loading dock by user type. The dock in this example requires eight spaces to operate effectively during the peak period (8am–11am). Profiling a loading dock’s activities by its user types can help planners and developers understand how much space each user needs, where there are constraints and potential mitigation measures. It also highlights the impact that longer dwell times can have on dock capacity and management of available spaces.
Figure 14 Profile of loading dock activity by user type in a mixed use development