5 grade curriculum space systems: stars and the s ar system5th grade curriculum space systems: stars...
TRANSCRIPT

5th Grade Curriculum
Space Systems: Stars and the Solar System
An electronic copy of this lesson in color that can be edited is available at the website below, if you
click on Soonertarium Curriculum Materials and login in as a guest. The password is “soonertarium”.
http://moodle.norman.k12.ok.us/course/index.php?categoryid=16
PART 2 – BRIGHTNESS OF THE STARS
-PRELIMINARY MATH BACKGROUND: Students may need to review place values since this lesson uses numbers in the hundred thousands. There are
two website links to online education games to review place values in the section.
-ACTIVITY - HOW MUCH BIGGER IS ONE NUMBER THAN ANOTHER NUMBER? This activity involves having students listen to the sound that different powers of 10 of BBs makes in a pan, and
dividing large groups into smaller groups so that students get a sense for what it means to say that 1,000 is 10 times
bigger than 100. Astronomy deals with many big numbers, and so it is important for students to have a sense of what
these numbers mean so that they can compare large distances and big luminosities.
-ACTIVITY – WHICH STARS ARE THE BRIGHTEST IN THE SKY? This activity involves introducing the concepts of luminosity and apparent magnitude of stars. The constellation
Canis Major was chosen as an example because Sirius has a much smaller luminosity but a much bigger apparent
magnitude than the other stars in the constellation, which leads to the question what else effects the brightness of a
star in the sky.
-ACTIVITY – HOW DOES LOCATION AFFECT THE BRIGHTNESS OF STARS? This activity involves having the students test how distance effects apparent magnitude by having them shine
flashlights at styrene balls at different distances. After seeing that the values of the distance of the different stars could
explain the discrepancies in luminosity and apparent magnitude in Canis Major’s stars the students are asked to make
predictions about which stars in Orion are the closest given the luminosity and apparent magnitude of the stars in Orion.
-ACTIVITY – HOW CLOSE ARE WE TO THE STARS AND THE PLANETS? This activity involves having the students predict what to place the planets relative to the sun in a scale model.
The students then plot out the correct locations and compare them to their original predictions. The students are then
asked to think about where the next closest star after the sun would be on the model to see the huge gap after the solar
system.
The McDonald Observatory in Texas has developed classroom activities & resources available at
(http://mcdonaldobservatory.org/teachers/classroom), and this activity was taken from
http://mcdonaldobservatory.org/sites/default/files/ScaleDistancesSolarSystem-teacher.pdf
-ACTIVITY – WHY DO WE NOT SEE ALL OF THE STARS DURING THE DAYTIME? In this activity students investigate how having more light around makes it harder to pick out dim sources of
light. The sun, the moon, and even lights around town reduce the apparent magnitude of the stars.

NGSS Standards for 5th Grade Curriculum http://www.nextgenscience.org/5ss-space-systems-stars-solar-system
Students who demonstrate understanding can:
5-ESS1-1. Support an argument that differences in the apparent brightness of the sun compared to other stars is due to their relative distances from the Earth. [Assessment Boundary: Assessment is limited to relative distances, not sizes, of stars. Assessment does not include other factors that affect apparent brightness (such as stellar masses, age, stage).]
Disciplinary Core Ideas
ESS1.A: The Universe and its Stars • The sun is a star that appears larger and brighter than other stars because it is closer. Stars range greatly
in their distance from Earth. (5-ESS1-1)
Science and Engineering Practices
Analyzing and Interpreting Data Analyzing data in 3–5 builds on K–2 experiences and progresses to introducing quantitative approaches to collecting data and conducting multiple trials of qualitative observations. When possible and feasible, digital tools should be used.
• Represent data in graphical displays (bar graphs, pictographs and/or pie charts) to reveal patterns that indicate relationships. (5-ESS1-2)
Engaging in Argument from Evidence Engaging in argument from evidence in 3–5 builds on K–2 experiences and progresses to critiquing the scientific explanations or solutions proposed by peers by citing relevant evidence about the natural and designed world(s).
• Support an argument with evidence, data, or a model. (5-PS2-1),(5-ESS1-1)
Crosscutting Concepts
Patterns • Similarities and differences in patterns can be used to sort, classify, communicate and analyze simple rates
of change for natural phenomena. (5-ESS1-2) Cause and Effect
• Cause and effect relationships are routinely identified and used to explain change. (5-PS2-1) Scale, Proportion, and Quantity
• Natural objects exist from the very small to the immensely large. (5-ESS1-1)

PRELIMINARY MATH BACKGROUND:
The lesson is intended to give students more intuition about what the size of different numbers practically
represents. For example, comparing 10 to 1,000 or 10 to 100,000. This will be done by connecting the numbers to scale
models that help students visualize how much bigger one number is than another number. The place value of numbers
should be reviewed with students so that they will be able to make comparisons between the sizes of different large
numbers without actually doing the long division to divide the numbers out. You can use a calculator after the students
have compared the numbers to check the comparison and get a more exact value.
http://www.math-aids.com/cgi/pdf_viewer_8.cgi?script_name=place_value_chart.pl&x=158&y=21
Below are two online math games that help students review place values. These could be done with the class if
you have a smartboard, projector for your computer, or access to a computer lab.
This website has the students click to throw a football to a receiver. If they throw it at the right time, the
receiver catches it, and the student gets the opportunity to answer a place value question to earn points. It is a little
hard to get it to the receiver, but the questions do go up to the billions so it is a good review.
http://www.math-play.com/football-math-place-value-game/football-math-place-value.html
This website has the students push the right and left arrow keys to make a racecar avoid other racecars, oil
slicks, and potholes. When the car hits a blue icon a place value question pops up and students earn or lose points
based on how they answer the question.
http://www.math-play.com/math-racing-place-value-game/math-racing-place-value-game.html
ACTIVITY - HOW MUCH BIGGER IS ONE NUMBER THAN ANOTHER NUMBER?
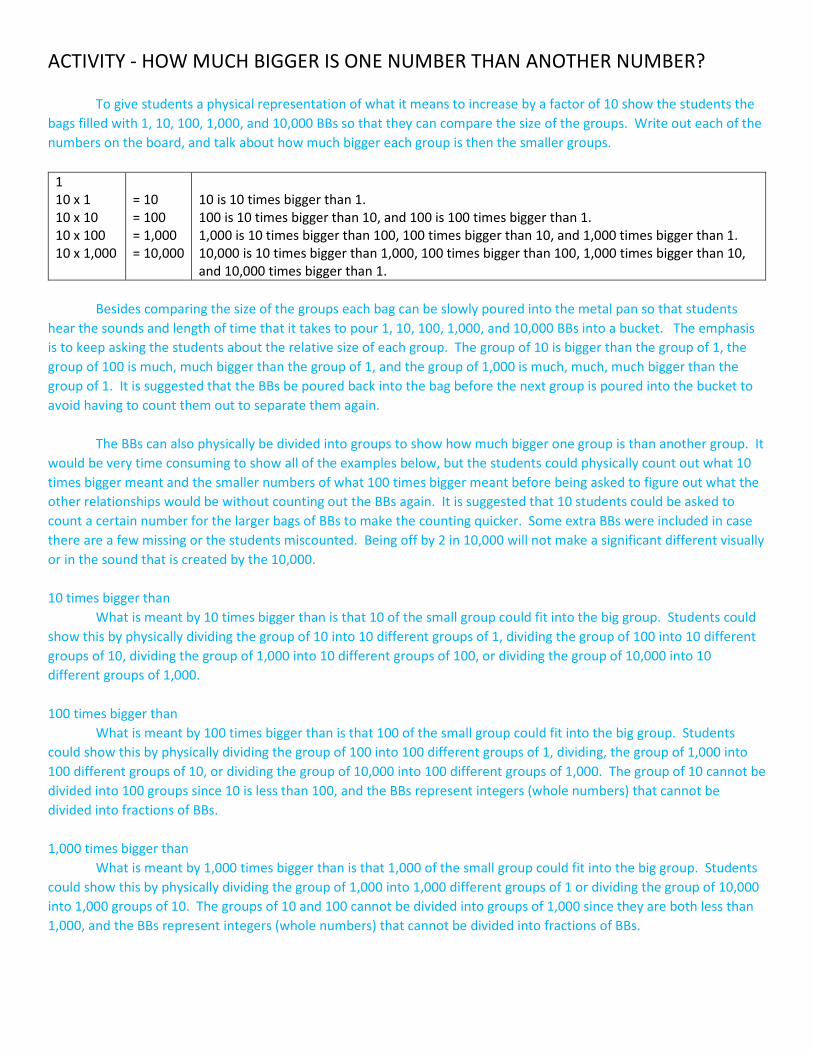
To give students a physical representation of what it means to increase by a factor of 10 show the students the
bags filled with 1, 10, 100, 1,000, and 10,000 BBs so that they can compare the size of the groups. Write out each of the
numbers on the board, and talk about how much bigger each group is then the smaller groups.
1
10 x 1
10 x 10
10 x 100
10 x 1,000
= 10
= 100
= 1,000
= 10,000
10 is 10 times bigger than 1.
100 is 10 times bigger than 10, and 100 is 100 times bigger than 1.
1,000 is 10 times bigger than 100, 100 times bigger than 10, and 1,000 times bigger than 1.
10,000 is 10 times bigger than 1,000, 100 times bigger than 100, 1,000 times bigger than 10,
and 10,000 times bigger than 1.
Besides comparing the size of the groups each bag can be slowly poured into the metal pan so that students
hear the sounds and length of time that it takes to pour 1, 10, 100, 1,000, and 10,000 BBs into a bucket. The emphasis
is to keep asking the students about the relative size of each group. The group of 10 is bigger than the group of 1, the
group of 100 is much, much bigger than the group of 1, and the group of 1,000 is much, much, much bigger than the
group of 1. It is suggested that the BBs be poured back into the bag before the next group is poured into the bucket to
avoid having to count them out to separate them again.
The BBs can also physically be divided into groups to show how much bigger one group is than another group. It
would be very time consuming to show all of the examples below, but the students could physically count out what 10
times bigger meant and the smaller numbers of what 100 times bigger meant before being asked to figure out what the
other relationships would be without counting out the BBs again. It is suggested that 10 students could be asked to
count a certain number for the larger bags of BBs to make the counting quicker. Some extra BBs were included in case
there are a few missing or the students miscounted. Being off by 2 in 10,000 will not make a significant different visually
or in the sound that is created by the 10,000.
10 times bigger than
What is meant by 10 times bigger than is that 10 of the small group could fit into the big group. Students could
show this by physically dividing the group of 10 into 10 different groups of 1, dividing the group of 100 into 10 different
groups of 10, dividing the group of 1,000 into 10 different groups of 100, or dividing the group of 10,000 into 10
different groups of 1,000.
100 times bigger than
What is meant by 100 times bigger than is that 100 of the small group could fit into the big group. Students
could show this by physically dividing the group of 100 into 100 different groups of 1, dividing, the group of 1,000 into
100 different groups of 10, or dividing the group of 10,000 into 100 different groups of 1,000. The group of 10 cannot be
divided into 100 groups since 10 is less than 100, and the BBs represent integers (whole numbers) that cannot be
divided into fractions of BBs.
1,000 times bigger than
What is meant by 1,000 times bigger than is that 1,000 of the small group could fit into the big group. Students
could show this by physically dividing the group of 1,000 into 1,000 different groups of 1 or dividing the group of 10,000
into 1,000 groups of 10. The groups of 10 and 100 cannot be divided into groups of 1,000 since they are both less than
1,000, and the BBs represent integers (whole numbers) that cannot be divided into fractions of BBs.
ACTIVITY – WHICH STARS ARE THE BRIGHTEST IN THE SKY?
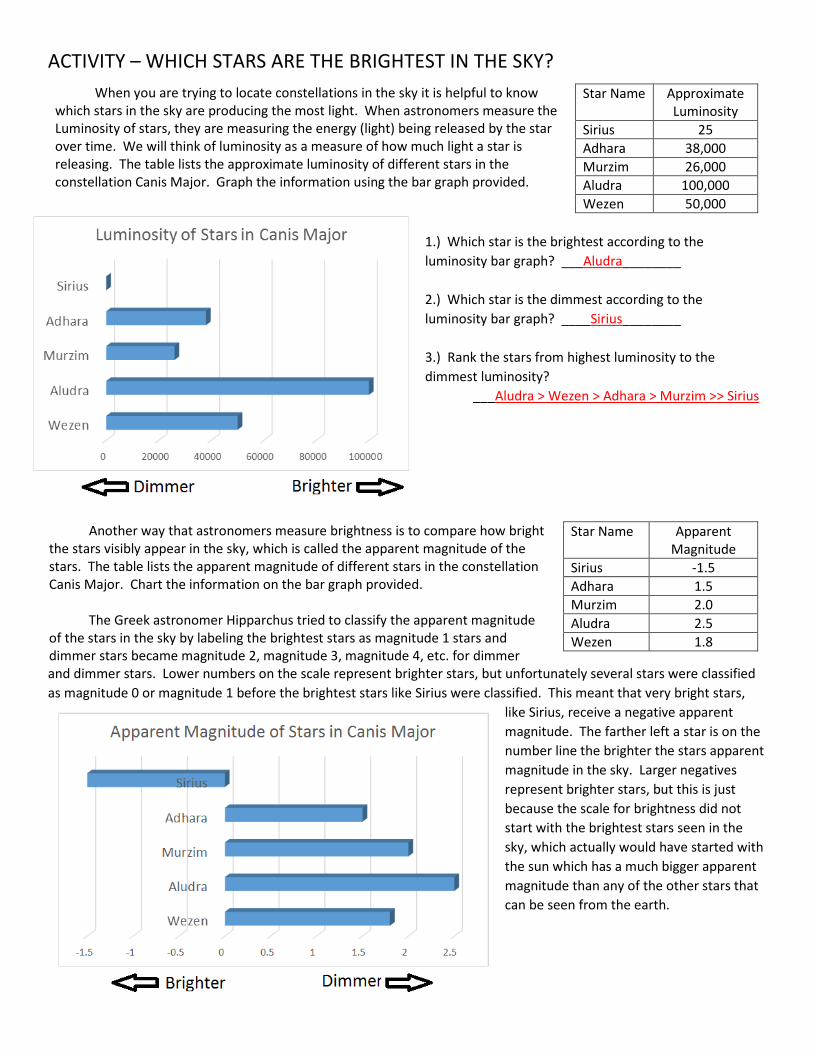
When you are trying to locate constellations in the sky it is helpful to know
which stars in the sky are producing the most light. When astronomers measure the
Luminosity of stars, they are measuring the energy (light) being released by the star
over time. We will think of luminosity as a measure of how much light a star is
releasing. The table lists the approximate luminosity of different stars in the
constellation Canis Major. Graph the information using the bar graph provided.
Star Name Approximate
Luminosity
Sirius 25
Adhara 38,000
Murzim 26,000
Aludra 100,000
Wezen 50,000
1.) Which star is the brightest according to the
luminosity bar graph? ___Aludra________
2.) Which star is the dimmest according to the
luminosity bar graph? ____Sirius________
3.) Rank the stars from highest luminosity to the
dimmest luminosity?
___Aludra > Wezen > Adhara > Murzim >> Sirius
Another way that astronomers measure brightness is to compare how bright
the stars visibly appear in the sky, which is called the apparent magnitude of the
stars. The table lists the apparent magnitude of different stars in the constellation
Canis Major. Chart the information on the bar graph provided.
The Greek astronomer Hipparchus tried to classify the apparent magnitude
of the stars in the sky by labeling the brightest stars as magnitude 1 stars and
dimmer stars became magnitude 2, magnitude 3, magnitude 4, etc. for dimmer
Star Name Apparent
Magnitude
Sirius -1.5
Adhara 1.5
Murzim 2.0
Aludra 2.5
Wezen 1.8
and dimmer stars. Lower numbers on the scale represent brighter stars, but unfortunately several stars were classified
as magnitude 0 or magnitude 1 before the brightest stars like Sirius were classified. This meant that very bright stars,
like Sirius, receive a negative apparent
magnitude. The farther left a star is on the
number line the brighter the stars apparent
magnitude in the sky. Larger negatives
represent brighter stars, but this is just
because the scale for brightness did not
start with the brightest stars seen in the
sky, which actually would have started with
the sun which has a much bigger apparent
magnitude than any of the other stars that
can be seen from the earth.

4.) Which star is the brightest according to the apparent magnitude bar graph? ___Sirius_____________
5.) Which star is the dimmest according to the apparent magnitude bar graph? ____Aludra__________________
6.) Rank the stars from highest to lowest apparent magnitude? __Sirius >> Adhara >Wezen > Adhara > Murzim > Aludra
Discussion Questions:
7.) Are the stars with the highest luminosity also the stars that appear brightest in the night sky? ____No_____
The data is actually correct. Sometimes the stars that release the most light do not look like the brightest stars
in the night sky. To show the contrast between the luminosity and the apparent magnitude the two quantities are
diagramed side by side below. The diagram on the left represents the luminosity of the stars, and the diagram on the
right represents the apparent magnitude of the stars. The size of the white dots represents the brightness of the stars in
the constellation Canis Major with respect to luminosity and apparent magnitude respectively.
Luminosity
Apparent Magnitude
8.) Can anyone hypothesize (give a possible explanation) of how stars that are actually very bright can appear dim in the
night sky. In other words, what other factors besides a stars luminosity (how much light a star releases) could affect the
stars apparent magnitude (how bright the star appears in the sky).
Give the students time to think and respond. All answers should be encouraged. It would be a good idea to
record the different ideas on the board. Leave it as an open question that will continue to be investigated in the next
activity.

ACTIVITY – WHICH STARS ARE THE BRIGHTEST IN THE SKY? When you are trying to locate constellations in the sky it is helpful to know which
stars in the sky are producing the most light. When astronomers measure the
Luminosity of stars, they are measuring the energy being released by the star over time.
We will think of luminosity as a measure of how much light a star is releasing. The table
lists the approximate luminosity of different stars in the constellation Canis Major.
Graph the information using the bar graph provided.
Star Name Approximate
Luminosity
Sirius 25
Adhara 38,000
Murzim 26,000
Aludra 100,000
Wezen 50,000
1.) Which star is the brightest according to the luminosity
bar graph? ___________________________________
2.) Which star is the dimmest according to the luminosity
bar graph? ___________________________________
3.) Rank the stars from highest luminosity (1) to the
dimmest luminosity (5)?
1 = ________________
2 = ________________
3 = ________________
4 = ________________
5 = ________________
Another way that astronomers measure brightness is to compare how bright
the stars visibly appear in the sky, which is called the apparent magnitude of the
stars. The table lists the apparent magnitude of different stars in the constellation
Canis Major. Chart the information on the bar graph provided.
The Greek astronomer Hipparchus tried to classify the apparent magnitude
of the stars in the sky by labeling the brightest stars as magnitude 1 stars and
dimmer stars became magnitude 2, magnitude 3, magnitude 4, etc. for dimmer
Star Name Apparent
Magnitude
Sirius -1.5
Adhara 1.5
Murzim 2.0
Aludra 2.5
Wezen 1.8
and dimmer stars. Lower numbers on the scale represent brighter stars, but unfortunately several stars were classified
as magnitude 0 or magnitude 1 before the brightest stars like Sirius were classified. This meant that very bright stars,
like Sirius, receive a negative apparent magnitude. The farther left a star is on the number line the brighter the stars
apparent magnitude in the sky. Larger negatives represent brighter stars, but this is just because the scale for brightness
did not start with the brightest stars seen in the sky, which actually would have started with the sun which has a much
bigger apparent magnitude than any of the other stars that can be seen from the earth.
4.) Which star is the brightest according to the
apparent magnitude bar graph? _____________
5.) Which star is the dimmest according to the
apparent magnitude bar graph? _____________
6.) Rank the stars from highest to lowest
apparent magnitude?
1 = ________________
2 = ________________
3 = ________________
4 = ________________
5 = ________________

Discussion Questions:
7.) Are the stars with the highest luminosity also the stars that appear brightest in the night sky? _________
The data is actually correct. Sometimes the stars that release the most light do not look like the brightest stars
in the night sky. To show the contrast between the luminosity and the apparent magnitude the two quantities are
diagramed side by side below. The diagram on the left represents the luminosity of the stars, and the diagram on the
right represents the apparent magnitude of the stars. The size of the white dots represents the brightness of the stars in
the constellation Canis Major with respect to luminosity and apparent magnitude respectively.
Luminosity
Apparent Magnitude
8.) Can anyone hypothesize (give a possible explanation) of how stars that are actually very bright can appear dim in the
night sky. In other words, what other factors besides a stars luminosity (how much light a star releases) could affect the
stars apparent magnitude (how bright the star appears in the sky).

ACTIVITY – HOW DOES LOCATION AFFECT THE BRIGHTNESS OF STARS?
Materials for each group:
1 Flashlight 1 Styrene ball 1 Small Ruler
Safety:
-Check that the students have a clear path to walk backwards.
-Remind the students to not look directly into the flashlights.
-Provide a secondary source of light in the room for when the overhead lights are turned off.
Set up designated stations with a styrene ball and a flashlight on the outside of the room where it will be
relatively dark when the lights are turned off. It is better to set up the styrene balls on the outside of the class so that
one groups light will not hit another groups styrene ball.
Have the students turn the flashlights on, and turn the light off. The teacher or a designated student should
stand by the lights to turn them on after each question so that students can record their answers and read the next
question.
1.) Point the flashlight at the styrene ball, and record what happens to the styrene ball.
The styrene ball becomes brighter.
The teacher can explain that this is because the styrene balls are reflective, which means that the light from the
flashlight bounces off of the surface like a mirror does. The ball appears brighter when more of the light is reflected to
our eyes.
2.) Explore what happens to the brightness of the styrene ball when the flashlight is moved to different locations, and
write down your observations in the space provided below.
Give the students a few minutes to explore moving the flashlight to different locations, then turn the lights on
and have the students record their observations as they discuss them in their groups before going over the discussion
questions as a class in the next section.
Students should have some indication that the brightness of the styrene ball decreases as the flashlight
moves away from the ball and that the brightness of the styrene ball increases as the flashlight moves towards
the ball.
Discussion Questions:
3.) What variable changed during the different trials?
The distance between the styrene ball and the flashlight.
4.) In the activity what represented the luminosity of the star (how much light a star releases)?
The luminosity was represented by the amount of light that the flashlight released at different positions.
5.) How was the luminosity affected by the changing variable listed in question 3?
The luminosity of the star remained constant for all of the trials because the brightness of the flashlight
did not change.

6.) In the activity what represented the apparent magnitude of the star (how bright a star appeared in the sky)?
The apparent magnitude was represented by how bright the styrene ball became when the flashlight
was at different positions.
7.) How was the apparent magnitude affected by the changing variable listed in question 3?
The apparent magnitude of the star decreased as the distance increased between the styrene ball and
the flashlight.
8.) What happened to the amount of the light that the styrene ball received from the flashlight as the flashlight moved
away from the styrene ball?
Demonstration Hint:
Place the styrene ball at the front of the classroom, and walk the flashlight to the back of the room. Ask the
students what happens to the size of the circle of light on the wall as the flashlight is moved back. “It gets bigger.” Ask
the students how much of the flashlight’s light goes to the styrene ball when flashlight is close. “Most of it, or almost all
of it.” Ask the students how much of the flashlight’s light goes to the styrene ball when the flashlight is far away from
the styrene ball. “Very little of it, or close to none of it.” Now go back to the original question to ask what happens to
the amount of light that hits the styrene ball as the flashlight is moved away from the styrene ball. “The amount of light
that reflects off the styrene ball decreases as the flashlight is moved away from the styrene ball. The amount of light
released by the flashlight is the same, but the amount of that light that goes to the styrene ball as the ball moves away
decreases.
9.) Explain how it is possible that some stars that are actually very bright can appear dim in the night sky. Include the
terms luminosity and apparent magnitude in your explanation.
Distance is another factor that effects the apparent magnitude of a star. The farther a star is from earth
the dimmer it will appear because less of the light from the star hits the planet and more of the light from the
star goes off in other directions. So, a star with high luminosity can have a lower apparent magnitude than a
star with a lower luminosity if it is farther from the earth than the star with lower luminosity.
Comparison of Luminosity:
The explanation for how the values were obtained for the discussion of the ratios of luminosity values is given
below, but it is recommended that the results just be given to the students for the purpose of the discussion. To model
the luminosity of the stars make groups of around 1, 1,000, 1,500, 2,000, and 4,000 BBs, and write these numbers on the
board for the students to reference. The exact number will not matter since there is such a big difference between the
numbers. If you have an electronic scale that reads grams you can weigh 10 BBs and then multiply this weight by 100 to
see how much 1,000 BBs should weigh. You can then pour BBs into the container until you reach this amount.
Ask the students to use their notes and pick which group of BBs represents Sirius’ luminosity (the group of 1)
and which group represents Aludra’s luminosity (the group of 4,000).
Ask the students to calculate how much bigger Aludra’s luminosity is compared to Sirius’ luminosity (the group
of 1 will go into the group of 4,000 four thousand times).
The following list relates how many times more light the other stars in Canis Major release into the night sky
than Sirius.
Adhara is 1,520 times brighter than Sirius.
Murzim is 1,040 times brighter than Sirius.
Wezen is 2,000 times brighter than Sirius.
Aludra is 4,000 times brighter than Sirius.
How to Calculate the Ratio of Luminosity:
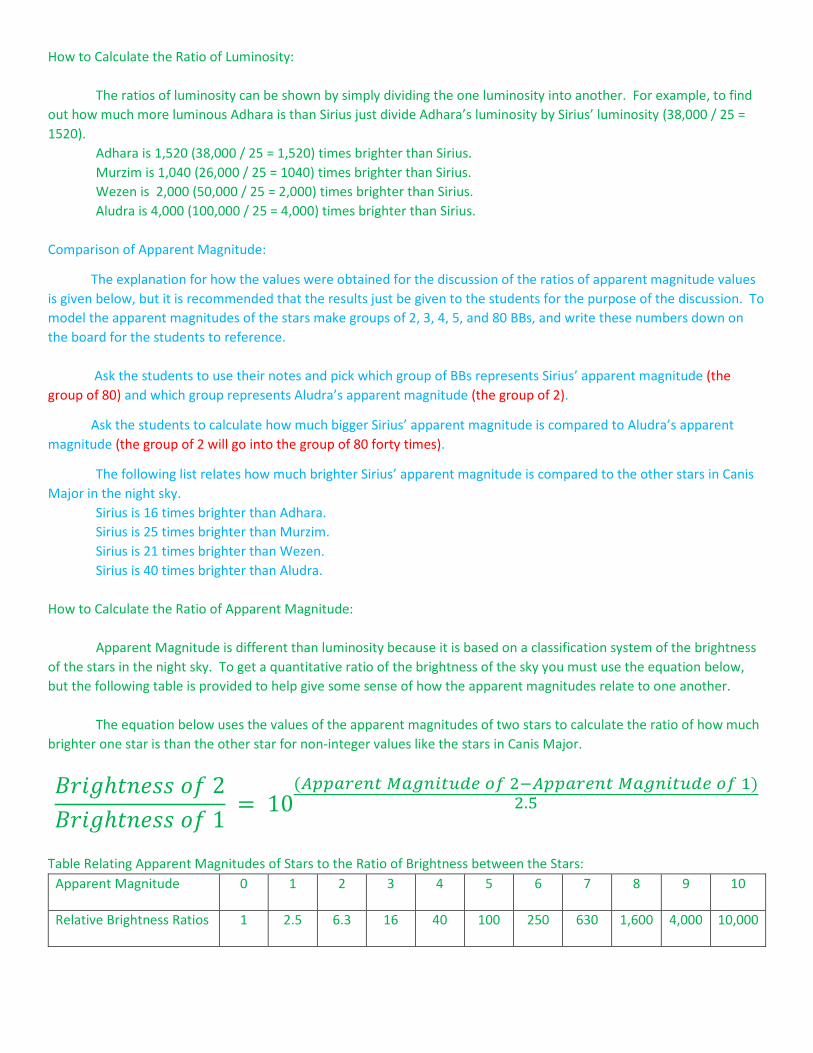
The ratios of luminosity can be shown by simply dividing the one luminosity into another. For example, to find
out how much more luminous Adhara is than Sirius just divide Adhara’s luminosity by Sirius’ luminosity (38,000 / 25 =
1520).
Adhara is 1,520 (38,000 / 25 = 1,520) times brighter than Sirius.
Murzim is 1,040 (26,000 / 25 = 1040) times brighter than Sirius.
Wezen is 2,000 (50,000 / 25 = 2,000) times brighter than Sirius.
Aludra is 4,000 (100,000 / 25 = 4,000) times brighter than Sirius.
Comparison of Apparent Magnitude:
The explanation for how the values were obtained for the discussion of the ratios of apparent magnitude values
is given below, but it is recommended that the results just be given to the students for the purpose of the discussion. To
model the apparent magnitudes of the stars make groups of 2, 3, 4, 5, and 80 BBs, and write these numbers down on
the board for the students to reference.
Ask the students to use their notes and pick which group of BBs represents Sirius’ apparent magnitude (the
group of 80) and which group represents Aludra’s apparent magnitude (the group of 2).
Ask the students to calculate how much bigger Sirius’ apparent magnitude is compared to Aludra’s apparent
magnitude (the group of 2 will go into the group of 80 forty times).
The following list relates how much brighter Sirius’ apparent magnitude is compared to the other stars in Canis
Major in the night sky.
Sirius is 16 times brighter than Adhara.
Sirius is 25 times brighter than Murzim.
Sirius is 21 times brighter than Wezen.
Sirius is 40 times brighter than Aludra.
How to Calculate the Ratio of Apparent Magnitude:
Apparent Magnitude is different than luminosity because it is based on a classification system of the brightness
of the stars in the night sky. To get a quantitative ratio of the brightness of the sky you must use the equation below,
but the following table is provided to help give some sense of how the apparent magnitudes relate to one another.
The equation below uses the values of the apparent magnitudes of two stars to calculate the ratio of how much
brighter one star is than the other star for non-integer values like the stars in Canis Major.
����ℎ��� �� 2
����ℎ��� �� 1 = 10
(�������� ��������� �� !�������� ��������� �� ") .%
Table Relating Apparent Magnitudes of Stars to the Ratio of Brightness between the Stars:
Apparent Magnitude 0 1 2 3 4 5 6 7 8 9 10
Relative Brightness Ratios 1 2.5 6.3 16 40 100 250 630 1,600 4,000 10,000

The table shows that if the apparent magnitude decreases by 1 the relative brightness of the star is 2.5 times
bigger. Comparing an apparent magnitude of 4 to an apparent magnitude of 5 is a difference of 1, which means that the
apparent magnitude 4 star is 2.5 (= 100/40) brighter than the apparent magnitude 4 star.
-A star with an apparent magnitude of 0 is 2.5 times brighter than a star with an apparent magnitude of 1.
-A star with an apparent magnitude of 0 is also 2.5 x 2.5 = 6.3 times brighter than a star with an apparent
magnitude of 2.
-A star with apparent magnitude of 0 is also 2.5 x 2.5 x 2.5 x 2.5 x 2.5 =100 times brighter than a star with an
apparent magnitude of 5.
-A star with apparent magnitude 4 is 2.5 x 2.5 x 2.5 x 2.5 = 40 times brighter than a star with an apparent
magnitude of 5 (1,600/40 = 40).
10.) Combining the information about Sirius’ luminosity and apparent magnitude compared to Aludra’s luminosity and
apparent magnitude what would you hypothesize about Sirius’ distance from the earth compared to Aludra’s distance
from the earth? Explain.
The students should hypothesize that Sirius is closer to the earth than the other stars in the
constellation Canis Major. Sirius’ luminosity (how much light it released) was 4,000 times smaller than Aludra’s
luminosity, but Sirius’ apparent magnitude (brightness in the night sky) was 40 times greater than Aludra’s
apparent magnitude. This could be explained by Sirius being much closer to the earth than Aludra. By being
closer much more of Sirius’ light goes to the earth, and by being farther away only a small part of Aludra’s light
goes to the earth.
Remind the students that the styrene balls became dimmer as the flashlight moved away. The flashlight was still
just as bright, but as the flashlight mover away the light was spread over a bigger area which meant that less of it went
to the styrene ball.
Ask a few of the students to volunteer to share their responses with the class, and then share that the distance
from the earth to Sirius is around 10 lightyears and that the distance from the earth to Aludra is around 2,000 lightyears.
The earth is much closer Sirius than to Aludra. If you write these numbers on the board, the students should be able to
determine that Aludra is 200 times further away from the earth than Sirius.
The following table summarizes the luminosity, apparent magnitude, and distance of each of the stars in the
constellation Canis Major. The distances are measured in lightyears, which is how far light travels in one year. The
speed of light is 300 million meters per second, and the total distance traveled in one light year is equal to
9,470,000,000,000,000m.
Star Luminosity Rank of
Luminosity
Apparent
Magnitude
Rank of Apparent
Magnitude
Distance
(light years)
Distance
Sirius 25 5 -1.5 1 10 5
Adhara 38,000 3 1.5 2 430 4
Murzim 26,000 4 2.0 4 500 3
Aludra 100,000 1 2.5 5 2,000 1
Wezen 50,000 2 1.8 3 1,800 2


Use the diagrams below to answer the following questions:
11.) What star in Orion releases the most light? ____Alnilam______
12.) What two stars in Orion appear the brightest in the night sky? ____Betelgeuse and Rigel___
13.) Which star would you hypothesize is the furthest from the earth? Explain.
Students should hypothesize that Alnilam is the furthest from the earth. Alnilam releases the most light,
but it does not appear as the brightest star in the constellation.
After having a few of the students share their answers you can write the following table on the board to discuss.
Stars Luminosity Apparent Magnitude Distance (Lightyears)
Alnilam 375,000 1.7 1,300
Betelgeuse 120,000 .5 640
Rigel 120,000 .2 860
The size of the white dots represents the brightness of the stars in the constellation Orion. The diagram on the
left represents the luminosity of the stars, and the diagram on the right represents the apparent magnitude of the stars.
Luminosity
Apparent Magnitude
Canis Major was chosen for the first part of the exercise because of the huge contrast between the luminosity
and distance of Sirius and Aludra, but the constellation Orion was chosen because it is one of the most recognizable
constellations in the night sky. Doing Part 3 “Who Can See Orion When?” of Kinesthetic Astronomy would help students
review the kinesthetic circle and show them how to find Orion in the night sky if it is the right time of the year.

ACTIVITY – HOW DOES LOCATION AFFECT THE BRIGHTNESS OF STARS?
1.) Point the flashlight at the styrene ball, and record what happens to the styrene ball. __________________________
2.) Explore what happens to the brightness of the styrene ball when the flashlight is moved to different locations, and
write down your observations in the space provided below.
Discussion Questions:
3.) What variable changed during the different trials? ______________________________________
4.) In the activity what represented the luminosity of the star (how much light a star releases)?
5.) How was the luminosity affected by the changing variable listed in question 3?
6.) In the activity what represented the apparent magnitude of the star (how bright a star appeared in the sky)?
7.) How was the apparent magnitude affected by the changing variable listed in question 3?
8.) What happened to the amount of the light that the styrene ball received from the flashlight as the flashlight moved
away from the styrene ball?
9.) Explain how it is possible that some stars that are actually very bright can appear dim in the night sky. Include the
terms luminosity and apparent magnitude in your explanation.
10.) Combining the information about Sirius’ luminosity and apparent magnitude compared to Aludra’s luminosity and
apparent magnitude what would you hypothesize about Sirius’ distance from the earth compared to Aludra’s distance
from the earth? Explain.

Use the diagrams below to answer the following questions:
11.) What star in Orion releases the most light? ___________________
12.) What two stars in Orion appear the brightest in the night sky? _____________________________
13.) Which star would you hypothesize is the furthest from the earth? Explain.
The size of the white dots represents the brightness of the stars in the constellation Orion. The diagram on the
left represents the luminosity of the stars, and the diagram on the right represents the apparent magnitude of the stars.
Luminosity
Apparent Magnitude

ACTIVITY – HOW CLOSE ARE WE TO THE STARS AND THE PLANETS?
Since distance effects how bright objects appear in the sky it is important to get a sense of how close the
stars are to the earth. This activity relates how close the earth is to the sun and the other planets compared to
how close the earth is to the next nearest star. The sun is the only star in our solar system, and the next star is
very, very far away.
Materials needed (per group of 2 students):
A 24” sentence strip, or a strip of paper 3” wide by 24” long.
Pencil
1.) Place the piece of paper on your desk in front of you vertically (so that it is tall instead of fat). In very
small letters, write “Sun” on the very top edge of the strip and “Pluto” on the very bottom edge.
Encourage students to use small print, especially for the Sun. And instruct them to NOT use
circles to depict object, just letters.
2.) Fold the strip in half (top to bottom) and open it up again, showing the crease.
Ask the students what object in the Solar System might belong on the crease. Maybe there isn’t
an object there. Ask what other astronomical objects make up the solar system. Usually, students will
respond with the order of the planets – My Very Education Mother Just Served Us Nine Pizzas… or
more recently – My Very Educated Mother Just Served Us Nachos. (See note below about Pluto’s new
“Dwarf Planet” status). You may want to write M,V,E,M,J,S,U,N,P on the board as a reminder.
3.) What planet do you think might belong on the crease (halfway from the Sun to Pluto)? Write your guess
on the crease.
If there is time available, you may collect a few strips and tape them to the board and have the
class vote on which planet they think is accurate. Next, reveal the answer and hand back the strips.
4.) Write in the rest of the planets on the strip of paper, making sure you put them in order and keep their
relative locations where you think they should be.
5.) When your teacher provides the “answer key”, write down the answers on the other side of the paper.
Compare the correct answers to your own. How did you do?
Read the following key to the class, or write it down on the board.
To Make the Answer Key:
1.) Turn strip over and refold halfway between Sun and Pluto. On the crease, write Uranus.
2.) Fold Pluto to Uranus. Write Neptune.
3.) Fold Sun to Uranus. Write Saturn.
4.) Fold Sun to Saturn. Write Jupiter.
5.) Fold Sun to Jupiter. Write No Planet or Asteroid Belt.
6.) Fold Sun to Asteroid Belt. Write Mars.
7.) Fold Sun to Mars. Write Venus.
8.) Write Mercury in between Sun and Venus.
9.) Ask students which planet is missing. Write in Earth in between Venus and Mars.

6.) We have seen that the planets orbit the sun, which is the only star in our solar system. Where would you
put the next nearest star (Proxima Centauri) using the same scale as was used for the planets?
After taking a few student guesses you can explain that Proxima Centauri is 40,000,000,000,000km
from the sun, which is 267,379.68 times further away from the sun than the Earth, which corresponds to
13,558.8ft on the scale used in the activity or over 45 football fields away from the dot that the students used to
mark the dot on 24” sentence strip. In other words, all of the stars other than the sun are very, very far away.
At highway speeds of 60mph you would need to drive 24 hours a day, 365 days per year for 473 centuries to
reach Proxima Centauri.
Distance from the Sun * .
Planet (AU)** (Kilometers)
Mercury 0.3871 57,900,000
Venus 0.7233 108,200,000
Earth 1 149,600,000
Mars 1.5237 227,900,000
Jupiter 5.2028 778,300,000
Saturn 9.5388 1,427,000,000
Uranus 19.18 2,869,000,000
Neptune 30.0611 4,497,100,000
Pluto 39.44 5,900,000,000
Proxima Centauri 267,379.68 40,000,000,000,000 * Although the orbits of all planets are almost circular, their actual shapes are ellipses. The numbers given
are the average distance from the sun to the planet, called the semi-major axis of their ellipse.
** AU stands for Astronomical Unit. It represents the average distance from the Sun to the Earth.
“Dwarf Planet”:
In August of 2006, the International Astronomical Union voted to redefine Pluto as a “dwarf planet”.
The reason this was done is because around the year 2000 astronomers were beginning to find other objects in
our solar system that were very much like Pluto, one of which (Eris) is even bigger than Pluto. If Pluto was to
still be called a “planet”, then all of these new objects were going to need to be called “planets” as well, and
our list of planets would begin to grow indefinitely. A line had to be drawn somewhere. Astronomers decided
that the best definition for a planet would have to exclude Pluto. The new definition of a “planet” in the solar
system is a celestial body that: 1) is in orbit around the Sun, 2) has enough mass to obtain a nearly round shape,
and 3) has ‘cleared the neighborhood’ around its orbit. The newly created term “dwarf planet” was defined
similarly, except for the 3rd part, meaning that it hasn’t been able to clear out other bodies of comparable size
from its orbital zone. Pluto hasn’t cleared out other ‘large’ objects from its orbital zone, hence it is now called
a “dwarf planet”.
Pluto’s unique orbit:
Pluto’s orbital path around the Sun is very far from being circular, its elliptical orbit is much more
eccentric than the eight planets. At times, Pluto is 49 AU from the Sun and at other times it is only 29 AU
from the Sun, bringing it slightly closer to the Sun than Neptune (though they will never collide). In addition,
Pluto’s orbit is highly inclined (tilted about 17°) relative to the orbital plane of the planets (the ecliptic).

ACTIVITY – HOW CLOSE ARE WE TO THE STARS AND THE PLANETS?
1.) Place the piece of paper on your desk in front of you vertically (so that it is tall instead of fat). In very
small letters, write “Sun” on the very top edge of the strip and “Pluto” on the very bottom edge.
2.) Fold the strip in half (top to bottom) and open it up again, showing the crease.
3.) What planet do you think might belong on the crease (halfway from the Sun to Pluto)? Write your guess
on the crease.
4.) Write in the rest of the planets on the strip of paper, making sure you put them in order and keep their
relative locations where you think they should be.
5.) When your teacher provides the “answer key”, write down the answers on the other side of the paper.
Compare the correct answers to your own. How did you do?
6.) We have seen that the planets orbit the sun, which is the only star in our solar system. Where would you
put the next nearest star (Proxima Centauri) using the same scale as was used for the planets?
ACTIVITY – WHY DO WE NOT SEE ALL OF THE STARS DURING THE DAYTIME?
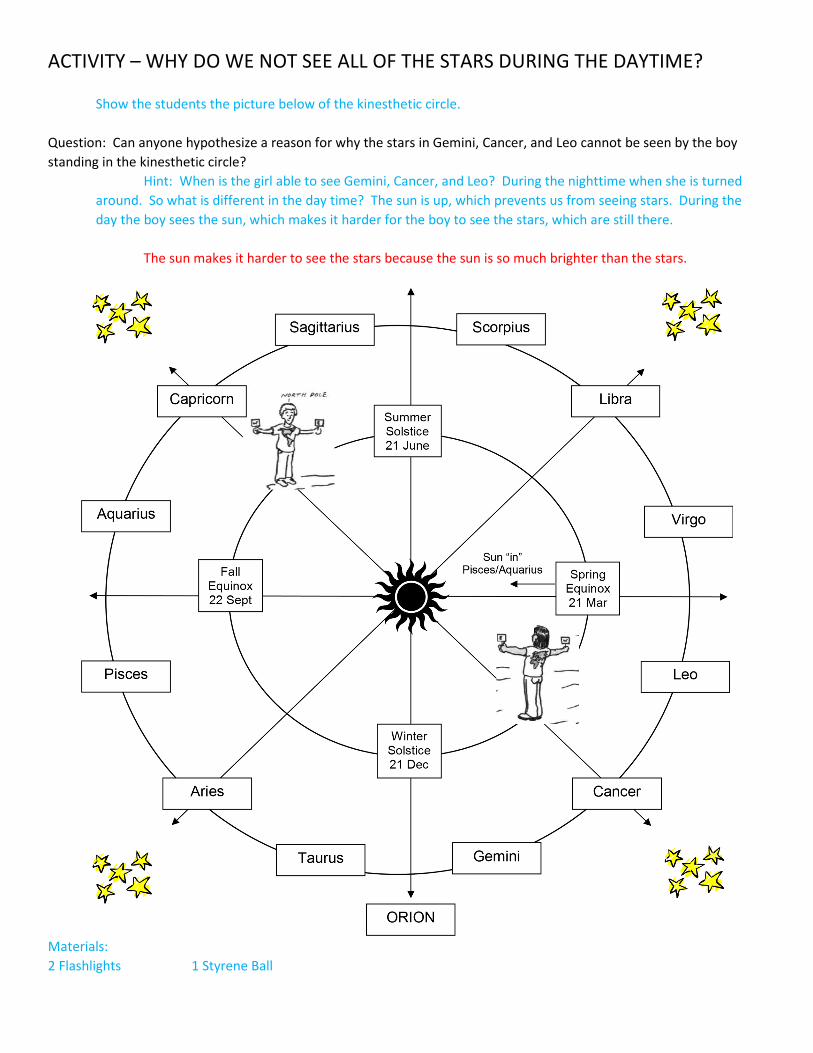
Show the students the picture below of the kinesthetic circle.
Question: Can anyone hypothesize a reason for why the stars in Gemini, Cancer, and Leo cannot be seen by the boy
standing in the kinesthetic circle?
Hint: When is the girl able to see Gemini, Cancer, and Leo? During the nighttime when she is turned
around. So what is different in the day time? The sun is up, which prevents us from seeing stars. During the
day the boy sees the sun, which makes it harder for the boy to see the stars, which are still there.
The sun makes it harder to see the stars because the sun is so much brighter than the stars.
Materials:
2 Flashlights 1 Styrene Ball

Safety:
-Check that the students have a clear path to walk backwards.
-Remind the students to not look directly into the flashlights.
-Provide a secondary source of light in the room for when the overhead lights are turned off.
Set up designated stations with a styrene ball and a flashlight on the outside of the room where it will be
relatively dark when the lights are turned off. It is better to set up the styrene balls on the outside of the class so that
one groups light will not hit another groups styrene ball.
Directions:
Have the students turn the flashlights on, and turn the light off. The teacher or a designated student should
stand by the lights to turn them on after each question so that students can record their answers and read the next
question.
1.) Have one member of the group step off twenty feet from the styrene ball.
2.) Have the person who stepped off twenty feet point the flashlight towards the styrene ball.
3.) Move the beam of the flashlight onto the styrene ball and off of the styrene ball and record your observations.
The beam of the flashlight lights up the surface of the styrene ball.
4.) Have another member of the group step off one foot from the styrene ball.
5.) Have the person who stepped off the one foot point the flashlight towards the styrene ball.
6.) Move the beam of the flashlight onto the styrene ball and off of the styrene ball and record your observations.
The beam of the flashlight lights up the surface of the styrene ball more brightly than the flashlight at 20 feet.
7.) Turn both flashlights on at the same time, and point them directly towards the styrene ball. Turn off the flashlight at
one foot, and record your observations.
When the flashlight at one foot was turned off, the styrene ball became much dimmer.
8.) Turn both flashlights on again at the same time, and point them directly towards the styrene ball. Turn off the
flashlight of 20 feet, and record your observations.
When the flashlight at 20 feet was turned off, the brightness of the styrene ball stayed about the same.
9.) How can these observations be used to explain why we do not see all of the stars at night?
The sun is so much closer than the other stars that the light from the other stars does not significantly affect
how bright the sky is during the day. When the sun is gone during the night, the stars do make a significant difference in
how much light there is in the sky since the amount of light is less than during the day.
Remind students of how much closer the earth is to the sun than it is to the next nearest star. If the earth is
modeled to be 1 inch from the sun, the earth would be 22,280 feet away or over 4.2 miles.
10.) The luminosity scale was based off the sun, which means that the sun was assigned a luminosity of 1, which is 25
times less than the luminosity of Sirius. However, the sun’s apparent magnitude in the sky is -26.7 (Remember that
larger negative numbers represent brighter stars.), which means that the sun is 12 billion times brighter in the sky than
Sirius. Explain why the sun appears brighter in the sky even though it releases less light than Sirius.
The sun is much closer to the earth than Sirius. This means that a larger part of sun’s light goes to the earth, and
a larger part of Sirius’ light does not come to the earth. So, the sun appears much brighter than Sirius.

11.) Do you think that the stars are still there during the daytime, and can you still see them?
After taking a few answers from the students you can confirm that the stars are still there during the daytime. If
you can see them depends on if you mean with just your eyes or with a telescope. Some stars can be seen during the
daytime with the naked eye, but to see most stars you would need a telescope pointed to an exact location to magnify
the light from the star. The following website has video of an amateur astronomer taking daytime pictures of stars with
his telescope: http://sky.velp.info/daystars.php
Not being able to see the stars because of other light in the sky is referred to as light pollution. Our eyes are
able to adjust to how much light is around them. In the dark our pupils will become larger to let more light into them,
but in the light our pupils shrink to limit the amount of light coming into them. When there is a lot of light around from
the sun it is harder to see dimmer objects, like the other stars.
It can take several minutes for your eyes to
adjust to the dark. You can have the students look at
the fluorescent lights before turning the lights off for a
few minutes. The room should appear very dark at
first, but the students should be able to make out more
details after a few minutes. This will work much better
in a room with no windows so that the students’ eyes
can adjust to the dark. It is a good idea to stand by the
lights so that they can quickly be turned back on if
there are any problems.
Another reason that we do not see the stars
during the day is that the atmosphere scatters the light
from sun, which causes the sky to appear blue, which
makes it hard to pick out the faint light from the stars.
http://www.quickmeme.com/img/9c/9cb177d38587ea38124252
47ac2aaa89980d2d3a49f26b3564b4548647647a96.jpg
12.) What is the next brightest object in the sky after the sun?
The moon is the second brightest object in the night sky.
During a full moon the apparent magnitude of the moon is -12.9. In fact, the moon is so bright that it can be
seen in the sky with the sun. The full moon can be so bright that only the brightest stars can be seen at night around it.
It creates a form of natural light pollution just like the sun where so much light comes into our eyes that we are not able
to pick up dimmer sources of light.
You can google images like the ones below to show students pictures of the moon during the day.
http://ak.picdn.net/shutterstock/videos/615967/previe
w/stock-footage-hunters-walk-along-a-ridge-with-a-full-
moon-in-the-daytime-sky.jpg
http://3.bp.blogspot.com/-
JIu2aYNrZKc/TZ31qW0S9hI/AAAAAAAAEX4/SxQ_6ShlZ18/
s1600/DSC00686.JPG

The moon does not create its own light like stars such as the sun. The moon reflects the sun’s light like the light
from the flashlight reflecting off of a styrene ball. Many more stars can be seen at new moon than at full moon because
the sky is so much darker at new moon, which is why observers will schedule their observations around what phase the
moon is in at that time. Having the full moon in the sky lowers the apparent magnitude of the other stars in the sky
because our eyes adjust to the larger amount of light put off by the full moon.
The phases of the moon is a 7th grade standard, but if you would like to show your students why the moon has
phases you can watch the following video and have the students use the styrene balls outside with the sun or inside with
the lamp to show how the positions of the earth, moon, and sun create the phases of the moon. The sun’s light is
always covering half the moon (except during a lunar eclipse). If the moon is between the earth and the sun the earth
sees the dark side of the moon (new moon). If the moon is on the opposite side of the earth from the sun, then the
earth sees the bright side of the moon (full moon). As the
https://www.youtube.com/watch?v=7QxIoRNPXUI#t=39
http://www.moonconnection.com/images/moon_phases_diagram.jpg
13.) Why can less stars be seen in the city than in the country?
The city lights brighten the sky, which washes out the dimmer stars. Light pollution drastically changes the
appearance of the night sky.
Globe at Night (http://www.globeatnight.org/) is a website that has volunteers make observations of the
constellations at their locations to create a picture of light pollution across the world. The site has templates of
constellations with different numbers of stars based on the darkness of the skies. The following website shows Orion:
http://www.globeatnight.org/resources/GaN2014_ActivityGuides_English_N/GaN2014_ActivityGuide_Orion_N.pdf

The following website shows the data collected for 2013, and you are able to zoom in all of the way to an address and
look up a specific observation. The site would use your students data, but the data is not uploaded onto the map until
the following year. http://www.globeatnight.org/map/?2013
Additional Information:
The sun and the moon are definitely the brightest objects in the sky, but the other planets in the solar system
can also be very bright. The other planets in the solar system can also be seen in the night sky or sometimes even during
the day because they reflect the sun’s light. Along with not producing their own light another difference between
planets and stars is that the planets do not follow the same path as the stars in the sky. The word planet literally means
“wandering star” because the other planets move through the constellations during the night rather than remaining part
of the fixed pattern of stars. This occurs because we are on the earth rotating around the sun with the planets, while
the stars other than the sun are extremely far away.
You can google images like the ones below to show students pictures of the planets during the night and even
during the day.
http://en.es-static.us/upl/2013/09/venus-saturn-mercury-
spica-Peter-Wong-Adelaide-Australia-9-26-2013-
e1380582869273.jpg
http://wordlesstech.com/wp-content/uploads/2012/07/A-
Morning-Line-of-Stars-and-Planets-2.jpg
To put things in perspective the apparent magnitude of the sun is -27, the apparent magnitude of the moon is -
12.9, the apparent magnitude of Venus is -4.6, the apparent magnitude of Jupiter is -2.9, and the apparent magnitude of
Mars is also -2.9.
One last interesting piece of information is that the international space station actually has an apparent
magnitude of -3, which is brighter than the brightest star in the night sky, which is Sirius with an apparent magnitude of
-1.5). The reason that the apparent magnitude is so high is because it is so close to the earth.
The following link has additional information on why we do not see all of the stars during the day:
http://scienceline.ucsb.edu/getkey.php?key=2974
The following article is from the website Moon Phases Info, and it does a good job of summarizing the
information about light pollution in the sky.
http://www.moonphases.info/why-stars-cant-be-seen-during-the-day.html

Why Stars Can’t Be Seen During the Day
Ever wonder where the stars go during the day? What causes them to disappear when the sun comes out? Well,
the answer is no magical mystery. The stars actually do not go anywhere during the day. They always remain in the same
spot. The sun is visible to us because it is the star closest to the Earth. It appears to rise and set, but in actuality it’s the
rotation of the Earth around the sun. When our part of the Earth is facing the sun during the day, the blue light that
radiates from the sun scatters through the atmosphere and is what causes our sky to be blue. This light is so bright that
it makes it hard to see anything else in the sky. Due to this, it is only during the night when we are not facing the sun
that the rest of the stars in the sky get to be visible and shine. When the darkness in the sky increases, the number of
stars visible and their apparent magnitude also increase. This is the same thing as having a flashlight pointed at you
during the dark night versus in pure daylight. The light will not affect you much during the day. However, it will be easy
to pick out the light during the night.
Moreover, although the stars are a lot more visible at night, those who live in urban and polluted cities such as
New York City or Los Angeles will have a hard time seeing many stars at night. This is due to the fact that the city lights
affect your eyes in a way that desensitizes them to be able to see the dimmer stars in the sky. You might only be able to
see the big dipper and a few other stars. Light pollution occurs when light from all of the houses and streets gather
together and cover the sky like an invisible drape that allows us to only see the brightest stars. However, if you go
somewhere rural and dark, it is amazing how many stars will be visible to you in the sky. Furthermore, air pollution, the
amount of H2O, CO2 and other green house gases in the atmosphere can also affect one’s chances of observing the stars
in a city.

ACTIVITY – WHY DO WE NOT SEE ALL OF THE STARS DURING THE DAYTIME?
Question: Can anyone hypothesize a reason for why the stars in Gemini, Cancer, and Leo cannot be seen by the boy
standing in the kinesthetic circle?
Directions:
1.) Have one member of the group step off twenty feet from the styrene ball.
2.) Have the person who stepped off twenty feet point the flashlight towards the styrene ball.
3.) Move the beam of the flashlight onto the styrene ball and off of the styrene ball and record your observations.

4.) Have another member of the group step off one foot from the styrene ball.
5.) Have the person who stepped off the one foot point the flashlight towards the styrene ball.
6.) Move the beam of the flashlight onto the styrene ball and off of the styrene ball and record your observations.
7.) Turn both flashlights on at the same time, and point them directly towards the styrene ball. Turn off the flashlight at
one foot, and record your observations.
8.) Turn both flashlights on again at the same time, and point them directly towards the styrene ball. Turn off the
flashlight of 20 feet, and record your observations.
9.) How can these observations be used to explain why we do not see all of the stars at night?
10.) The luminosity scale was based off the sun, which means that the sun was assigned a luminosity of 1, which is 25
times less than the luminosity of Sirius. However, the sun’s apparent magnitude in the sky is -26.7 (Remember that
larger negative numbers represent brighter stars.), which means that the sun is 12 billion times brighter in the sky than
Sirius. Explain why the sun appears brighter in the sky even though it releases less light than Sirius.
11.) Do you think that the stars are still there during the daytime, and can you still see them?
Not being able to see the stars because of other light in the sky is referred to as light pollution. Our eyes are
able to adjust to how much light is around them. In the dark our pupils will become larger to let more light into them,
but in the light our pupils shrink to limit the amount of light coming into them. When there is a lot of light around from
the sun it is harder to see dimmer objects, like the other stars.
12.) What is the next brightest object in the sky after the sun?
During a full moon the apparent magnitude of the moon is -12.9. In fact, the moon is so bright that it can be
seen in the sky with the sun. The full moon can be so bright that only the brightest stars can be seen at night around it.
It creates a form of natural light pollution just like the sun where so much light comes into our eyes that we are not able
to pick up dimmer sources of light.
The moon does not create its own light like stars such as the sun. The moon reflects the sun’s light like the light
from the flashlight reflecting off of a styrene ball. Many more stars can be seen at new moon than at full moon because
the sky is so much darker at new moon, which is why observers will schedule their observations around what phase the
moon is in at that time. Having the full moon in the sky lowers the apparent magnitude of the other stars in the sky
because our eyes adjust to the larger amount of light put off by the full moon.
13.) Why can less stars be seen in the city than in the country?