5. housing market trends and recent policies
TRANSCRIPT

90
© Institute for Fiscal Studies, 2014
5. Housing market trends and recent
policies
Daniel Chandler and Richard Disney (IFS)
Summary
In the last year, the government has initiated a number of housing policies including
equity loans and mortgage guarantees via the ‘Help to Buy’ programme and a
revamped ‘Right to Buy’ scheme for council house tenants. In the short run, these
policies were introduced to stimulate demand for housing and to revitalise the
construction industry. They also reflect a longer-term objective, dating back to at
least the 1980s, of encouraging wider homeownership.
Whether influenced by these policies or by faster-than-forecast growth in economic
activity, the UK housing market has picked up significantly in the past year, with
prices increasing across most of the UK in 2013. However, prices remain about 9%
below their previous peak in nominal terms, and 25% below in real terms. Only in
London have prices reached their previous nominal peak – although they are still
17% lower in real terms. Other indicators of housing market activity have also seen
a marked upturn.
There is concern among commentators as to whether a housing ‘bubble’ is
developing in the UK. A bubble – as opposed to simply an upturn in prices – arises
when price trajectories are driven largely by speculative buying based on expected
future price increases, rather than by economic ‘fundamentals’ such as improving
underlying economic conditions and easier access to finance. On balance, the data
currently available do not provide clear evidence of a housing bubble, even in
London – though the likelihood of a bubble is greatest there.
The ‘Help to Buy’ scheme aims to increase homeownership by reducing the deposit
required to purchase a house, either via an equity loan (which directly reduces
monthly repayments) or via insurance to lenders on high loan-to-value mortgages.
Help to Buy will likely exert an upwards pressure on prices. Whether this ultimately
makes it more difficult for first-time buyers to access homeownership depends on
whether this boost to price expectations leads to an increase in supply. The
government should consider targeting the policy on first-time buyers and/or
reducing the cap on eligible property values (currently £600,000) in order to
increase the policies’ impact on affordability. In addition, if the government is
concerned about a potential house price bubble, it should consider reducing the cap
for both schemes and/or restricting the mortgage guarantee to new builds.
‘Right to Buy’ has been an extremely influential factor behind the expansion of
homeownership since the early 1980s. Given the excess demand for public housing
in some localities, there can be a trade-off between the goal of promoting
homeownership through council house sales and retaining sufficient public housing
to meet demand. The government seems to have signalled a major shift towards the
goal of increasing homeownership, by raising maximum discounts across the
country. As yet, it is unclear whether the policy will achieve the desired balance
between increasing homeownership and minimising reductions in social housing.
Housing market trends and recent policies
91
5.1 Introduction
The past year has seen a sharp revival in activity and rising prices in the UK housing
market. UK house prices, having fallen by 19% in nominal terms between 2007Q3 and
2009Q1, grew by 7.3% over 2013, rising to about 9% below their previous peak by
2013Q4. There was also a substantial increase in the number of housing market
transactions and in the construction of new homes: the number of housing market
transactions rose to almost 100,000 per month in 2013Q4, well above its low of 52,000 in
January 2009, though still below the average of 119,000 per month between 1997 and
2007.
The upturn in the housing market has coincided with the announcement and (partial)
introduction of two major government schemes designed to stimulate housing demand
and revitalise the construction industry: ‘Help to Buy: equity loan’, which provides
interest-free equity loans on new builds and ‘Help to Buy: mortgage guarantee’, which
offers insurance to lenders of high loan-to-value mortgages (up to 95%) on new and old
properties. Both schemes are open to existing owners as well as first-time buyers, on
properties worth up to £600,000. The government has committed to providing up to
£3.5 billion in equity loans over three years, and to a contingent liability of up to
£12 billion, which it estimates is sufficient to insure up to £130 billion of mortgages
(equivalent to 10% of the current stock of household mortgage debt). The government
has also attempted to stimulate homeownership by revitalising the ‘Right to Buy’ policy
for council housing, and to encourage house building by simplifying planning regulations.
There is considerable debate about how to interpret recent trends in the housing market
and the impact of government policy on these trends. Concerns have been raised as to the
risks to financial and macroeconomic stability arising from the ongoing rise in house
prices, particularly in London, and about the implications of rising prices for the long-
term challenge of affordability for those wanting to get into the housing market.
Moreover, given the apparent acceleration of activity and price growth since the
announcement of ‘Help to Buy’, there is concern that current policy will exacerbate these
trends.
All this raises the issue of whether the Chancellor should be changing course in his
forthcoming Budget. Should he be worrying about a housing ‘bubble’ and therefore
reining back on some of the measures designed to stimulate the market? Are there
particular changes he could make to the Help to Buy and Right to Buy schemes? This
chapter seeks to address these issues.
The remainder of the chapter is structured as follows. Section 5.2 examines possible
rationales for government intervention in the housing market. Section 5.3 describes
recent trends in the housing market – particularly prices and other indicators of activity,
and how these differ between regions – before assessing whether this evidence supports
claims that the UK is experiencing a housing bubble. Section 5.4 evaluates three flagship
policies aimed at stimulating the housing market and increasing homeownership: the
Help to Buy: equity loan and mortgage guarantee schemes and the revamped Right to Buy
policy. Section 5.5 concludes.

The IFS Green Budget: February 2014
92
5.2 Government intervention in the housing market
Public policy towards the housing market has sought to achieve (at least one of) three
distinct goals: to provide shelter and accommodation for all families; to encourage
homeownership; and to encourage construction as a tool of counter-cyclical
macroeconomic policy.
Traditionally, social housing has existed to ensure the availability of accommodation of an
acceptable standard and at ‘affordable’ prices for all. It has been the province of local
authorities, supported by central government through the provision of capital grants. In
addition, benefit payments have been available to poor families in both social and
privately rented accommodation. From the 1920s until the early 1980s, local authorities
built large amounts of new social housing each year, with annual completions of local
authority dwellings averaging over 150,000 per year between 1950 and 1980, while
housing associations built around 14,000 per year. Building by local authorities declined
throughout the 1980s and 1990s to just 350 dwellings per year during the 2000s.
Housing associations now play a more important role, building an average of 25,000 per
year during the 2000s.1
The use of government policy to promote homeownership is a more recent development.
Initially, the tax system was used for this purpose. In 1969, mortgage payments were
granted tax relief. Although this incentive was abolished in 2000, the tax system
continues to favour owner-occupation over other forms of housing tenure.2 Housing is
also treated favourably relative to many other assets in the sense that capital gains on
owner-occupied houses are exempt from tax – though this favourable treatment is
counterbalanced by stamp duty land tax, a transaction tax on residential housing which
raises significant revenue (around £4.9 billion in 2012–13).3
In 1980, the introduction of a statutory ‘Right to Buy’ policy requiring local authorities to
sell council houses at a discount to eligible tenants marked a significant shift in
government policy towards homeownership. The policy was subsequently extended to
other forms of social housing through ‘Right to Acquire’. Between 1981 and 2003, the
stock of council-owned properties as a proportion of the total housing stock fell from
27% to just over 11%.4
More recently, government policy has sought to ensure that the supply of new housing
delivered by the market keeps pace with rising demand. As discussed in Box 5.1, the
relationship between supply and demand ultimately determines the price of housing and,
as such, policies to encourage new supply are important both for ensuring decent and
affordable shelter and accommodation and for widening access to homeownership.
1 Table 2.2 of C. Jones and A. Murie, The Right to Buy: Analysis and Evaluation of a Housing Policy,
Blackwell, Oxford, 2006; DCLG, live table 241, ‘House building: permanent dwellings completed, by tenure’, https://www.gov.uk/government/uploads/system/uploads/attachment_data/file/259907/LiveTable241.xls.
2 See Chapter 16 of J. Mirrlees et al., Tax by Design, OUP for IFS, Oxford, 2011,
http://www.ifs.org.uk/mirrleesreview/design/ch16.pdf.
3 Data for stamp duty on residential property transactions only. See HMRC, UK Stamp Tax Statistics 2012-13,
September 2013 (http://www.hmrc.gov.uk/statistics/stamp-duty/stamp-tax-sep13.pdf). Receipts were 16% higher in 2012–13 than in 2011–12.
4 Table 4.1 of C. Jones and A. Murie, The Right to Buy: Analysis and Evaluation of a Housing Policy,
Blackwell, Oxford, 2006.

Housing market trends and recent policies
93
Box 5.1. The economics of housing
At the most basic level, the price of housing reflects the balance of demand and supply:
all else equal, an increase in demand will raise the price of housing, while an increase in
supply will see prices fall.
The demand for housing is influenced by a range of factors, the most important of which
are population size, the structure and spatial allocation of the population, real income
levels, the price of housing relative to other goods, services and assets, and the
availability of mortgage credit. Expectations of future price increases are also important
in inducing potential buyers into the market: rising prices increase the expected benefit
to getting into the market (because asset values are appreciating) while also increasing
the expected costs of delaying (because down-payment costs are also rising). Evidence
suggests that price expectations are heavily influenced by recent trends – a feature of
the housing market that tends to exacerbate price volatility.a
In the long run, growing real incomes and demographic change are likely the most
fundamental drivers of housing demand.b The UK has certainly seen a growing
population and, until recently, growing real incomes. There has also been a long-term
trend towards smaller household units, such that there are more households in the
market for a given population size (although changing house prices and availability of
housing finance also affect household composition choices).c A long-run trend towards
greater financial liberalisation has also increased access to credit for house purchases.
Finally, housing assets may have become more attractive relative to other assets such as
occupational pensions, given low interest rates and falling annuity rates. In the short
run, the cost of borrowing (determined by the interest rate) and the availability of credit
(determined primarily by the lending requirements set by banks) have had an important
impact on housing demand.
In the short run, the overall supply of housing is relatively fixed. This means that short-
term increases in demand typically feed through into rising prices. Over longer periods,
the responsiveness of supply to changes in house prices will depend above all on the
supply of land, which in turn depends on the planning system, and on the
competitiveness, capacity and incentives faced by the construction industry. In a 2003–
04 review, Kate Barker suggested that, even over longer periods, UK housing supply was
not responding to price signals and that in large part this reflected constraints
embedded in the planning system.d
Given these longer-term pressures on demand, the long-run increases in the real price of
owner-occupied housing in the UK and in the ratio of the value of housing wealth to
income are likely to continue.
a For a discussion, see the 2008 special issue of Oxford Review of Economic Policy (24:1) on housing policy,
especially J. Muellbauer and A. Murphy, ‘Housing markets and the economy: an assessment’. b Typical estimates of the ‘income elasticity of demand’ for housing lie in the range 0.5 to 0.8. For a summary
of the empirical literature, S. Malpezzi and S. Wachter, ‘Housing demand’, in International Encyclopedia of
Housing and Home, Elsevier, 2012. See also J. Ermisch, J. Findlay and K. Gibb, ‘The price elasticity of housing
demand in Britain: issues of sample selection’, Journal of Housing Economics, 1996, 5, 64–86. c See, for example, pages 32–4 in Office for National Statistics, 2011 Census: Population and Household
Estimates for England and Wales, March 2011, 2012, http://www.ons.gov.uk/ons/dcp171778_270487.pdf. d For a discussion, see K. Barker, Review of Housing Supply – Delivering Stability: Securing Our Future
Housing Needs, Interim Report, HM Treasury, 2003,
http://webarchive.nationalarchives.gov.uk/+/http:/www.hm-
treasury.gov.uk/consultations_and_legislation/barker/consult_barker_index.cfm#report.
The IFS Green Budget: February 2014
94
Finally, policies to encourage homeownership may be used as an instrument for counter-
cyclical macroeconomic policy. This is one potential explanation of current government
policy: when there is spare capacity in the construction industry – as was the case
following the 2008 recession – the case for boosting housing demand as a form of
economic stimulus looks attractive. Funds for the provision of social housing could also
be increased to this end.
In Section 5.4, we consider how these policy goals relate to the recent ‘Help to Buy’
schemes and the revamped ‘Right to Buy’ policy. In particular, we seek to clarify the
objectives of these policies: are they designed to address short-term problems, such as
spare capacity in the construction industry or market failures in the mortgage markets,
and/or longer-term objectives such as increasing access to homeownership. Moreover,
we examine whether they are likely to achieve these objectives.
5.3 Trends in the housing market
Trends in house prices
The past year has seen a strengthening of the UK housing market, with prices growing in
most regions and a range of indicators of housing market activity showing marked
increases. While this has been welcomed by some as a symptom of wider economic
recovery, rising house prices have also raised two distinct concerns: first, that rising
prices might indicate the development of a house price ‘bubble’, which in turn could
burst, leading to financial instability and (potentially) hitting household consumption;
and second, that even without a bubble, rising prices might put homeownership beyond
the reach of many and could worsen the affordability of basic shelter and
accommodation. Box 5.2 reviews, very briefly, the reasons why house prices might matter
for the wider economy and for questions of equity and ‘affordability’.
Box 5.2. Why do house prices matter?
House prices can have a range of economic and distributional effects.
Most obviously, house prices may influence overall activity via their effect on the
construction industry. In addition, house prices may affect household behaviour. For
example, there is a strong correlation between house prices and households’
consumption. However, it is not clear how far this reflects the causal influence of house
prices on consumption (i.e. higher prices increase consumption via a ‘wealth effect’) or
the fact that house prices and consumption are driven by common causes (e.g. a cut in
interest rates might increase both house prices and consumption). House prices also
affect household levels of savings and debt, both through the direct impact of
mortgages and because mortgages may substitute for other (unsecured) forms of debt.
House prices may also affect labour market decisions, via their impact on household
wealth.
The nature and direction of these relationships are not straightforward, and a full
discussion is beyond the scope of this chapter. Nonetheless, recognising the links
between house prices and wider economic activity is crucial for understanding the
implications of rising prices for the wider economy – whether or not they result from a
‘bubble’.a
Rising prices also have distributional effects. In particular, concerns about ‘affordability’
typically refer to the possibility that rising house prices will put homeownership out of

Housing market trends and recent policies
95
reach for certain groups. This is a particular issue in the UK, where rising house prices
over the 1990s and 2000s seem to have caused, at least in part, a decline in
homeownership, with the proportion of households in England and Wales that owned
their own home falling from 69% to 64% between 2001 and 2011.b
The distribution of homeownership raises issues of equity. Wealth is highly unequally
distributed in the UK, and the unequal distribution of housing wealth is an important
component of this. Moreover, housing wealth is an important source of inheritance and
a mechanism by which wealth is transferred from one generation to the next. Finally,
higher prices may also spill over into the level of private rents. If other forms of social
and public housing are not easily available, access to housing in general will become
more difficult and/or more expensive.
a We will address some of these issues concerning the wider implications of the housing market for economic
activity in a forthcoming IFS publication to be released shortly. b Office for National Statistics, ‘A century of home ownership and renting in England and Wales’,
http://www.ons.gov.uk/ons/rel/census/2011-census-analysis/a-century-of-home-ownership-and-renting-in-
england-and-wales/short-story-on-housing.html.
Prices across the UK are yet to recover from the largest decline on record
The recent upturn in the housing market follows the deepest and sharpest decline in
house prices since at least the 1950s, when reliable data on house prices begin. The price
of a ‘typical’ house, as measured by the average of the Nationwide and Halifax house price
indices, fell from a peak of £192,000 in the third quarter of 2007 to £155,000 in the first
quarter of 2009 – a fall of 19% in just 1½ years. This compares with a fall of around 16%
during the last house price crash between 1989 and 1993, a period of 3½ years from
Figure 5.1. Average UK house prices since 1988
Note: The average nominal house price is the average of the Nationwide and Halifax quarterly house price
indices. The real house price is deflated using the CPI all-items index, taking 2013Q1 as the base. The Halifax
measure for 2013Q4 has been estimated as the average of the monthly figures for October to December 2013,
because the figure for 2013Q4 is not yet available
Source: Nationwide, ‘UK house prices since 1952’,
http://www.nationwide.co.uk/~/media/nationwide.co.uk/pdf/hpi/downloads/UK_house_price_since_1952.xls
; Halifax, table 1 (All(SA)) in ‘Historical house price data’,
http://www.lloydsbankinggroup.com/media1/economic_insight/halifax_house_price_index_page.asp; CPI is
ONS series D7BT.
0
50,000
100,000
150,000
200,000
250,000
19
88
19
89
19
90
19
91
19
92
19
93
19
94
19
95
19
96
19
97
19
98
19
99
20
00
20
01
20
02
20
03
20
04
20
05
20
06
20
07
20
08
20
09
20
10
20
11
20
12
20
13
Ave
rag
e p
rice
(£
)
Nominal
Real (2013 prices)

The IFS Green Budget: February 2014
96
peak to trough using the same index.5 In the fourth quarter of 2013, nominal prices for
the UK have recovered to about 9% below their previous peak.6 (See Figure 5.1.)
Figure 5.1 also shows the evolution of real house prices, i.e. the nominal price deflated by
the consumer price index (CPI). This measures the price of housing relative to other
goods. The broad trend of the real house price index is similar to that of the nominal
index: a fall from 1989 into the early 1990s, a long boom from the mid- to late 1990s up
to 2007, and then a sharp crash in 2008. Since 2007, the real index has fallen further and
for longer than the nominal index, to a low of 29% below its 2007Q3 peak in 2012Q4.
That real prices continued to decline over 2010–12 reflects the fact that, over this period,
inflation averaged about 3.5% while nominal house prices were largely flat.7 During
2013, house prices again started to outpace inflation, though in the 2013Q4 real prices
remained 25% below their previous peak.
London and Northern Ireland are two exceptions to the overall UK trend
Most regions have broadly followed the overall UK trend since 2007, with two exceptions
– Northern Ireland and London (see Figure 5.2).
Figure 5.2. Average nominal house prices: UK and selected regions
Note: The average nominal house price is the average of the Nationwide and Halifax quarterly house price
indices. London corresponds to ‘London’ for Nationwide and ‘Greater London’ for Halifax. Data go up to
2013Q3, as regional 2013Q4 data are not yet available for the Halifax index.
Source: Nationwide, ‘Regional quarterly indices (post '73)’,
http://www.nationwide.co.uk/~/media/nationwide.co.uk/pdf/hpi/downloads/All_prop.xls; Halifax, table 1
(All(SA)) in ‘Historical house price data’,
http://www.lloydsbankinggroup.com/media1/economic_insight/halifax_house_price_index_page.asp.
5 Halifax data are available only since 1983. Nationwide publishes an index going back to 1952, though there
were significant changes in the underlying methodology in 1983. Nonetheless, the only comparable fall in house prices since 1950 occurred between 1989 and 1993. A simple measure of average house prices going back to the 1930s shows another major decline of about 15% in the 1930s; see DCLG, live table 502, ‘Housing market: house prices from 1930, annual house price inflation, United Kingdom, from 1970’, https://www.gov.uk/government/statistical-data-sets/live-tables-on-housing-market-and-house-prices.
6 Unless stated otherwise, price data in this chapter are for the average of the Nationwide and Halifax house
price indices. See the online appendix for a more detailed discussion of the differences between different house price indices (http://www.ifs.org.uk/budgets/gb2014/gb2014_ch5_appendix.pdf).
7 CPI inflation was 3.3% in 2010, 4.5% in 2011 and 2.8% in 2012. See ONS series D7BT
(http://www.ons.gov.uk/ons/datasets-and-tables/data-selector.html?cdid=D7G7&dataset=mm23&table-id=1.2).
0
50
100
150
200
250
300
2003 2004 2005 2006 2007 2008 2009 2010 2011 2012 2013
20
03
pri
ce =
10
0
UK
London
Northern Ireland

Housing market trends and recent policies
97
Northern Ireland experienced a much more dramatic price crash, following a much more
extreme house price boom in the years immediately preceding the recession. This likely
reflects similarities with the housing market in the Republic of Ireland, where house
prices have suffered a similarly dramatic boom and bust.8 Given the differences between
the experience in Northern Ireland and that in the rest of the UK, we focus the remainder
of our discussion on Great Britain.
London has seen a stronger recovery than any other region.9 Most indices suggest
nominal house prices in London are above their pre-recession peak. They were 9% above
their previous peak in 2013Q3 according to Nationwide, 11% above according to the
Land Registry in September 2013, and 19% above according to the Office for National
Statistics (ONS) in 2013Q3.10 The Halifax, on the other hand, estimates that prices in
2013Q3 remain about 8% below their peak. Real prices in London remain 17% below
their 2007 peak, according to the average of Nationwide and Halifax.
As we shall see below, much discussion of whether or not there is a ‘bubble’ in the
London housing market relies on simple comparisons of nominal prices with their 2007
peak. The choice of house price index clearly has an important bearing on this question.
However, differences between these measures reflect a range of differences in the
underlying samples and in the methodology behind the indices, which are difficult to pick
apart (see the online appendix for a more detailed discussion of these differences11). The
Land Registry’s index is based on the most comprehensive data and is likely to be the
most accurate estimate.12 The ONS measure, on the other hand, is likely to overstate the
true increase in prices, because it is affected by changes in the composition of properties
being sold, with the higher price reflecting stronger sales activity and growth in the
‘prime’ London market in recent years. It is not clear what explains the difference
between the Halifax measure and the other indices. On balance, it seems likely that prices
in London are now above their nominal peak.
Although prices in London seem to have exceeded their 2007 peak in nominal terms, this
is not the case for the rest of the UK, as Figure 5.3 makes clear. Looking outside London
(and excluding Northern Ireland), prices have recovered more quickly in southern and
eastern England, and more slowly in northern England, Wales and Scotland.
8 Housing statistics for Ireland can be accessed at
http://www.environ.ie/en/Publications/StatisticsandRegularPublications/HousingStatistics/.
9 It is also interesting to note that prices in fact grew more slowly in London than in the rest of the UK in the
five years preceding the recession.
10 Data for each index are relative to the peak price in London for that index. Nationwide, Halifax and ONS
data are quarterly, whereas Land Registry data are only provided as a monthly index. Source: ONS, ‘House price index (HPI) reference tables’, table 14, http://www.ons.gov.uk/ons/rel/hpi/house-price-index/november-2013/rft-monthly-and-qtly-november-13.xls; Land Registry, ‘Indices (SA)’, http://www.landregistry.gov.uk/__data/assets/file/0003/67836/HPI_Tables.xls.
11 http://www.ifs.org.uk/budgets/gb2014/gb2014_ch5_appendix.pdf.
12 Although the Land Registry is probably the most accurate source of data, we have used the average of the
Nationwide and Halifax indices for two main reasons. First, they cover the whole of the UK, while the Land Registry only covers England and Wales. Second, they provide more timely data, because there is a time lag between mortgage offers being made (the data used by Nationwide and Halifax), a property being sold, and registration of this sale with the Land Registry (used for its price index).

The IFS Green Budget: February 2014
98
Figure 5.3. Nominal house prices compared with 2007
Note: See Figure 5.2. Compares average of Nationwide and Halifax indices in 2007Q3 and 2013Q3 (the latest
date for which regional quarterly data are available). Although Nationwide data are available for 2013Q4,
Halifax data are only available up to 2013Q3. 2007Q3 is the quarter in which the average of the Nationwide
and Halifax price indices reached its peak, though some regions peaked in 2007Q4.
Source: See Figure 5.2.
Prices are expected to continue growing in the short term
On average, the house price indices suggest that most regions saw positive growth
between 2012Q4 and 2013Q4. Average price growth for the UK as a whole was 7.3%,
with faster growth in London and slower growth elsewhere. Looking forward, prices are
widely expected to continue growing into 2014 and 2015. The Office for Budget
Responsibility (OBR) has developed an economic model that predicts house prices on the
basis of the underlying supply and demand dynamics in the housing market. It estimates
that house prices for the UK as a whole will rise by more than 5% in 2014 and 7% in
2015.13
Various measures of market expectations also indicate further price growth. The Royal
Institute of Chartered Surveyors (RICS)’s monthly poll of estate agents in England and
Wales shows that, as of December 2013, prices were expected to increase by more than
3% nationally over the following 12 months (compared with expectations of 0.1% price
growth in December 2012 for the subsequent 12 months) and by around 5% per year for
the next five years (up from 2.5% last year).14 A similar pattern is evident among
homeowners: the Knight Frank / Markit house price sentiment index (HPSI) measures
homeowners’ expectations of future price changes. The index has been a fairly reliable
leading indicator of changes in house prices since its inception in 2009, and it is now at a
13 OBR, Economic and Fiscal Outlook, December 2013,
http://cdn.budgetresponsibility.independent.gov.uk/Economic-and-fiscal-outlook-December-2013.pdf; OBR, ‘Supplementary forecast information release: house price model’, December 2013, http://budgetresponsibility.org.uk/wordpress/docs/House-price-model-Dec-13.pdf. The OBR model assumes (1) that any increase in prices raises expected prices and hence increases demand for housing and (2) that the elasticity of supply of housing is very low. The model suggests that current (2013) prices are roughly at their equilibrium level but predicts that policies such as ‘Help to Buy’ will raise prices.
14 RICS, ‘Residential Market Survey – December 2013’, January 2014,
http://www.rics.org/uk/knowledge/market-analysis/uk-residential-market-survey/rics-residential-market-survey-dec-2013/.
-18 -16 -14 -12 -10 -8 -6 -4 -2 0 2
London
South East
South West
East Anglia
UK
West Midlands
Wales
East Midlands
North West
Scotland
North
Yorkshire and Humberside
Percentage change in house prices

Housing market trends and recent policies
99
series high (when measured as a three-month series average), with homeowners
expecting strong growth in house prices over the next year.15
Other indicators of housing market activity
The decline in house prices starting in late 2007 was accompanied by an even more
dramatic decline in other indicators of housing market activity. These indicators have all
improved over the past year.
The numbers of housing transactions and mortgage approvals are rising
The number of monthly housing market transactions fell from a peak of almost 150,000
at the end of 2006 to a low of 52,000 in January 2009, before rising to 73,000 per month
over 2010–11. The past year has seen the number of transactions increase further,
reaching almost 100,000 per month in the fourth quarter of 2013, though this is still 16%
below the average for the decade between 1997 and 2007 of 119,000 per month.16 As
Figure 5.4 shows, the number of mortgage approvals for house purchase has followed a
very similar pattern, though as of November 2013 mortgage approvals were just under
71,000, 31% below the average for 1997–2007 of 103,000 per month.
Figure 5.4. Housing market activity since 2005
Note: ‘Transactions’ is the number of residential property transactions in the UK with a value of £40,000 or
above, seasonally adjusted. ‘Mortgage approvals’ is the monthly number of total sterling approvals for house
purchase to individuals in the UK, seasonally adjusted. Prior to 2005, HMRC data on transactions only cover
England and Wales.
Source: Transactions data from HMRC, ‘UK property transaction statistics’, 21 January 2014,
http://www.hmrc.gov.uk/statistics/transactions.htm. Mortgage approvals from Bank of England series
LPMVTVX,
http://www.bankofengland.co.uk/boeapps/iadb/fromshowcolumns.asp?Travel=NIxSCxSUx&FromSeries=1&To
Series=50&DAT=RNG&FD=1&FM=Jan&FY=1963&TD=20&TM=Jan&TY=2014&VFD=Y&html.x=25&html.y=15&
CSVF=TT&C=112&Filter=N.
15 Knight Frank and Markit, ‘Knight Frank/Markit House Price Sentiment Index (HPSI) – December 2013’,
December 2013, http://www.markiteconomics.com/Survey/PressRelease.mvc/f6f7d9cdcc0d4c49a7a6b3fb052aebb4.
16 Table 1 on page 20 of Bank of England, Inflation Report, November 2013,
http://www.bankofengland.co.uk/publications/Documents/inflationreport/2013/ir13nov.pdf.
0
20,000
40,000
60,000
80,000
100,000
120,000
140,000
160,000
20
05
20
06
20
07
20
08
20
09
20
10
20
11
20
12
20
13
20
14
Mo
nth
ly n
um
be
r o
f tr
an
sact
ion
s an
d m
ort
gag
e a
pp
rovals
Transactions
Mortgage approvals

The IFS Green Budget: February 2014
100
Residential construction is also on the increase
Construction is starting to respond to the increase in housing market activity and prices.
New housing starts and completions both increased during 2013, though in 2013Q3 they
remained 21% and 23%, respectively, below their quarterly average for 2000–07: see
Figure 5.5.
There is some evidence that construction companies have large stocks of residential sites
with planning permission. If obtaining planning permission typically constrains supply
(see Box 5.1), and companies are sitting on land that already has planning approval, then
one might expect supply to respond more rapidly to the recent upturn in prices than in
previous periods.
As of 31 March 2013, there were almost 6,500 schemes with unimplemented residential
planning permission in England and Wales (i.e. schemes with planning permission that
were either under construction or yet to start) – comprising almost 400,000 potential
new dwellings. Of these, 61% of schemes, and 48% of units, were unstarted, with the
remainder already under construction. However, the total number of unimplemented
schemes and of units have both fallen by about 25% since March 2008, largely because of
a decline in the number of planning applications being made. Although the total quantity
of dwellings with planning permission that are yet to begin construction is large (184,000
units in England and Wales, compared with 115,000 new-build completions in England in
201217), it is smaller than it was before 2008. This raises doubts as to whether there will
be a faster supply response than in previous periods.18
Figure 5.5. Housing market activity since 2000
Note: Permanent dwellings started and completed in England, quarterly, seasonally adjusted. Data include
private enterprises, housing associations and local authorities.
Source: DCLG, live table 222,
https://www.gov.uk/government/uploads/system/uploads/attachment_data/file/259904/LiveTable222.xls.
17 Table 1b of DCLG, ‘House building: September quarter 2013, England’, Statistical Release,
https://www.gov.uk/government/uploads/system/uploads/attachment_data/file/259891/House_Building_Release_-_Sept_Qtr_2013.pdf.
18 Local Government Association, An analysis of unimplemented planning permissions for residential
dwellings 2013, October 2013, http://www.local.gov.uk/documents/10180/11831/Unimplemented+planning+permissions+analysis/efb571d3-c869-4199-aaec-234f71eef76d.
0
10,000
20,000
30,000
40,000
50,000
60,000
20
00
20
01
20
02
20
03
20
04
20
05
20
06
20
07
20
08
20
09
20
10
20
11
20
12
20
13
Qu
art
erl
y n
um
be
r o
f st
art
s an
d
com
ple
tio
ns
Starts
Completions
Housing market trends and recent policies
101
It seems likely that the responsiveness of supply will continue to be constrained by the
planning system. Of course, the planning system has also changed over this period, with
the government introducing a range of measures aimed at simplifying the planning
process. How far these measures will lead housing supply to respond more quickly to
rising prices is yet to be seen.19
Is there a bubble in the housing market?
As the previous figures showed, there has been an increase in house prices and in housing
market activity alongside a more limited increase in housing supply. This has led a
Box 5.3. What is a bubble and how can we identify one?
The idea of a ‘bubble’ is that asset prices are driven by expectations of future price
increases rather than by the intrinsic value of the asset involved. A classic example of an
asset bubble is the famous Dutch ‘tulip mania’ in the seventeenth century, where tulip
bulbs were bought and sold at extraordinarily high prices not because of the intrinsic
value of the tulip but because investors expected shortly to sell the asset on at a profit.
The three elements of a classic bubble are: speculative buying for capital gain;
speculative lending of money not on the credit-worthiness of clients but on the
expectation of future price gains (even if the asset had to be repossessed and sold by the
lender); and a trajectory of explosive price increase followed by an equally spectacular
collapse.a
Broadly, there are two approaches used to test for bubbles. One is to seek to measure
whether a data series diverges in a systematic way from some long-run underlying
relationship. For example, we can seek to assess whether house prices are moving out of
line with what we would expect based on long-run trends in the demand for and supply
of housing services. Of course, this requires an assessment of the long-run trends. The
OBR makes such an assessment using an economic model of housing demand (based on
evolving demographics, real incomes and household preferences) and housing supply
(based on land prices, land availability and the availability of housing finance).b From
such a model, one can predict the ‘appropriate’ trajectory of house prices and test
whether the actual price is deviating from this.
A second approach to testing for bubbles is to investigate whether the behaviour of
economic agents is driven by fundamentals (e.g. purchasing a house as a medium- to
long-term asset for residential purposes) or by a desire to speculate on an asset’s value.
Examples of this include considering whether house purchasers are reporting that they
are buying primarily for capital gain (as Case and Shiller demonstrated had begun to
happen in the ‘hot’ housing markets in the United States in the mid-2000s) or whether
we observe lenders increasing the exposure of their loan book to risk because they
believe that even repossessed assets can be sold at a profit.
a For a general discussion of the nature of bubbles and their detection, see K. Case and R. Shiller, ‘Is there a
bubble in the housing market?’, Brookings Papers on Economic Activity, 2003, 299–362,
http://www.brookings.edu/about/projects/bpea/papers/2003/bubble-housing-market-case-shiller. b Office for Budget Responsibility, ‘Supplementary forecast information release: house price model’, December
2013, http://budgetresponsibility.org.uk/wordpress/docs/House-price-model-Dec-13.pdf.
19 For a discussion of planning related to housing, see L. Smith, Planning for Housing, House of Commons
Library, Standard Note SN/SC/3741, December 2013, http://www.parliament.uk/briefing-papers/sn03741.pdf.

The IFS Green Budget: February 2014
102
number of analysts and commentators to raise concerns that the housing market,
particularly in London, is in the early stages of a ‘bubble’.
The term ‘bubble’ is used quite loosely in popular debate, sometimes simply to refer to a
situation in which prices are increasing rapidly. However, a ‘boom’ in house prices does
not necessarily signal a ‘bubble’. In a bubble, price increases are being driven largely by
behaviour arising from the expectation of future price increases, whereas in a boom
prices are driven by a shift in economic ‘fundamentals’ (namely, the underlying drivers of
supply and demand for housing, as discussed earlier in Box 5.1).
It is, of course, difficult to know whether or not a particular market is in the grip of a
bubble, especially in its earlier stages. Box 5.3 discusses some of the economic literature
on bubbles, and the techniques that economists use to detect them. It is beyond the scope
of this chapter to provide a rigorous answer to the question of whether or not the UK
housing market is in a bubble. In what follows, therefore, we examine what evidence can
be adduced that is relevant to this question.
Of course, as discussed previously in Box 5.2, rapidly rising prices may have a range of
economic and distributional effects whether or not they are caused by a bubble. However,
the fact that, for example, certain groups may be priced out of homeownership is not
evidence of a bubble. It is simply evidence that certain groups are losing out from rising
prices.
Most measures of prices and activity in the housing market are still well below
their previous peaks
Much of the debate about whether or not there is a bubble in the housing market rests on
comparisons of price and activity levels with their previous peaks in 2007. In particular,
proponents of the view that there is a bubble point to the fact that, on some measures,
prices have exceeded previous highs. Implicit in this approach is the idea that 2007 was a
bubble, and that a return to the prices and activity levels seen in 2007 might herald
another house price crash. Although both nominal and real prices are frequently referred
to in this debate, and we discuss both below, real prices are typically the more
appropriate measure, because they tell us whether house prices are increasing over-and-
above the general rate of price inflation.
In the run-up to the 2007 crash, the housing market did exhibit some of the features
characteristic of a bubble: a rapid rise in prices relative to the growth of household
earnings and incomes, and a range of loose lending practices from mortgage providers,
such as self-certificated mortgages and loan-to-value ratios of 100% (or more) – both
justified by optimistic price expectations based on the relatively long period prior to
2007 of continued house price increases. However, available evidence is not conclusive as
to whether a bubble in fact arose. The OBR model of the housing market (see Box 5.3)
suggests that, in 2007, prices were not overvalued relative to underlying ‘equilibrium’
values (this model also suggests that prices are now roughly at their equilibrium level).20
In contrast, other work points to them being slightly overvalued.21 Nonetheless, 2007
20 See OBR, Economic and Fiscal Outlook, December 2013,
http://cdn.budgetresponsibility.independent.gov.uk/Economic-and-fiscal-outlook-December-2013.pdf; OBR, ‘Supplementary forecast information release: House price model’, December 2013, http://budgetresponsibility.org.uk/wordpress/docs/House-price-model-Dec-13.pdf.
21 See J. Muellbauer and A. Murphy, ‘Housing markets and the economy: the assessment’, Oxford Review of
Economic Policy, 2008, 24, 1–33.

Housing market trends and recent policies
103
remains an intuitive point of comparison, and one that has dominated much discussion in
the media.
By this imperfect criterion, only London – where nominal prices have exceeded their
previous peak on most measures – seems to be a particular source of concern. As we have
seen, at a national level, prices remain about 9% below their previous peak. However,
once we account for the effect of inflation, even prices in London remain 17% below their
previous peak.
Both nominal and real prices are below their long-term trends
This simple comparison with the 2007 peak ignores the long-term upward trend in
prices. A slightly more sophisticated approach, then, is to compare these indicators not
just with their 2007 peak, but with their longer-term trend. While a long-term rising
trend in prices may be a cause for concern – because, for example, it may signal a
structural imbalance between the demand for and supply of housing – long-term trends
in prices cannot, by definition, be termed a bubble.
An obvious starting point is to examine whether recent price growth is fast by historical
standards. Real prices grew by 5.1% between 2012Q4 and 2013Q4. This is significantly
lower than the average annual growth rate of real prices in the decade to 2007 of 9.9%,
but higher than the trend growth rate over the past 25 years of 3.6%. Performing the
same calculations for nominal prices reveals a similar result: nominal prices grew by
7.3% between 2012Q4 and 2013Q4, lower than the average growth rate of 11.6% in the
Figure 5.6. Real house prices compared with their long-term trend, UK
Note: Trend growth sees real house prices grow at a constant rate of 3.6% per year, 1988Q1 to 2013Q4.
Source: authors’ calculations using Nationwide and Halifax house price indices (see Figure 5.1), deflated using
the CPI taking 2013Q1 as the base.
-30
-20
-10
0
10
20
30
40
50
-150,000
-100,000
-50,000
0
50,000
100,000
150,000
200,000
250,000
19
88
19
89
19
90
19
91
19
92
19
93
19
94
19
95
19
96
19
97
19
98
19
99
20
00
20
01
20
02
20
03
20
04
20
05
20
06
20
07
20
08
20
09
20
10
20
11
20
12
20
13
% d
evia
tio
n f
rom
tre
nd
Ave
rag
e r
eal h
ou
se p
rice
(£
, 2
01
3 p
rice
s)
% deviation from trend Average real price (2013 prices) Trend (3.6% growth rate)

The IFS Green Budget: February 2014
104
decade to 2007, but slightly higher than the trend growth rate over the past 30 years of
6.3% per year.22
Figure 5.6 shows real prices compared with their trend for the past 25 years. The bars
show the percentage deviation of prices from the price predicted by the long-term trend.
Real prices for the UK as a whole are 16.6% below what would be predicted by their
longer-term trend (2013Q4). Performing the same calculations for nominal prices reveals
a similar result: nominal prices are currently 17.3% below their longer-term trend.
A similar picture is evident for London. Although nominal prices roughly reached their
2007Q3 level by 2013Q3, this is 11.7% below what would be predicted by their longer-
term trajectory. Real prices are 16.9% below their previous peak and 12.7% below their
longer-term trajectory.
Prices are growing more quickly than earnings in London
A widely used measure of the sustainability of house price levels is the ratio of prices to
earnings – a sharp rise in this ratio might reflect a housing bubble, insofar as sharply
increasing ratios of house prices to earnings are presumably unsustainable in the long
run. We might nonetheless expect the house-price-to-earnings ratio to rise over time,
albeit more steadily, for three reasons: first, if people are willing to spend a greater
proportion of their income on housing;23 second, if the finance for purchasing houses
becomes more readily available or cheaper; and third, because of the shift towards dual-
earning households, so a measure of the ratio of house prices to individual earnings may
underestimate household resources available to purchase properties. On the other hand,
while a rising trend of house prices to earnings may be sustainable over the short to
medium term, one would expect there to be a limit to the proportion of earnings that
households are willing to spend in order to own a home.
The ratio of price to earnings is particularly important for first-time buyers, as it has an
important bearing on whether or not they can afford to purchase a home. Figure 5.7
shows the ratio of the price paid by first-time buyers (according to Nationwide data) to
average earnings, for the UK and London over time, compared with long-run trends. A
number of points are worth noting. First, higher price levels in London are only partially
accounted for by higher earnings: although prices in London are 85% higher than the
average for the UK as a whole, median earnings for a full-time worker in 2013 were just
19% higher (though earnings and prices in London are likely to be skewed towards the
top end of their respective distributions).24 Second, the price-to-earnings ratio grew
faster in London between the mid-1990s and mid-2000s than in the UK as a whole. Third,
faster price growth in London since the recovery has not been driven by faster growth in
earnings. Indeed, the price–earnings ratio for first-time buyers has already reached its
previous peak in London, and it now lies above its longer-term trend.
22 Growth rates are annual growth rates measured on a quarterly basis. For example, the annual growth rate in
2013Q3 is the growth in prices between 2013Q3 and a year earlier (2012Q3). The average growth rate in the decade to 2007 is just the average of these growth rates for each quarter between 1998Q1 and 2007Q4 inclusive.
23 However, the evidence cited in note b in Box 5.1 suggests that, while housing is a normal good (i.e. demand
increases with income), the income elasticity of the demand for housing is less than 1.
24 Median gross weekly pay for full-time workers living in the area, ONS, Annual Survey of Hours and Earnings
- Resident Analysis, ‘Earnings by residence’, https://www.nomisweb.co.uk/reports/lmp/gor/2013265927/report.aspx.

Housing market trends and recent policies
105
Figure 5.7. Nominal house-price-to-earnings ratio for first-time buyers
Note: The ratio of house prices to earnings is calculated as the ratio of the (nominal) Nationwide first-time
buyer house price divided by mean gross earnings in each region.
Source: See Figure 5.1. Earnings data are from the ONS Annual Survey of Hours and Earnings, and pre-1998
the New Earnings Survey, where the NES data have been adjusted to create a consistent series. Mean earnings
for a full-time worker on adult rates are used. Quarterly earnings data are calculated using straight-line
interpolation; points after the last annual observation are extrapolated using average growth rates and hence
are subject to revision.
Low interest rates have kept mortgage interest payments low
The relationship between mortgage payments and household income is another useful
measure of the sustainability of house prices. If households cannot afford these payments,
they will fall into arrears and ultimately default on their mortgage, leading to potential
repossession of the property. If this happens to a large number of households, the market
could be flooded with properties that lenders want to sell quickly, bringing down prices.
Figure 5.8. Mortgage interest payments relative to incomes
Note: Individual ratio of mortgage interest (and no capital) payments to household net disposable income, for
those with a mortgage.
Source: Authors’ calculations based on the Living Costs and Food Survey (formerly the Expenditure and Food
Survey, formerly the Family Expenditure Survey).
0
1
2
3
4
5
6
7
8
19
83
19
84
19
85
19
86
19
87
19
88
19
89
19
90
19
91
19
92
19
93
19
94
19
95
19
96
19
97
19
98
19
99
20
00
20
01
20
02
20
03
20
04
20
05
20
06
20
07
20
08
20
09
20
10
20
11
20
12
20
13
Pri
ce-t
o-e
arn
ing
s ra
tio
London London trend
UK UK trend
0%
5%
10%
15%
20%
25%
19
74
19
76
19
78
19
80
19
82
19
84
19
86
19
88
19
90
19
92
19
94
19
96
19
98
20
00
20
02
20
04
20
06
20
08
20
10
Median interest payment as % of income
Proportion spending >25% of income on interest

The IFS Green Budget: February 2014
106
Figure 5.8 shows the average proportion of households’ net disposable income spent on
mortgage interest payments over time. Looking just at households with a mortgage, the
proportion of income currently spent on mortgage interest payments by the median
household (ranked in terms of mortgage interest payments) was just under 8% in 2011 –
its lowest level since 1979. The figure also shows the proportion of households with a
mortgage that are spending more than a quarter of their net disposable income on
mortgage interest payments. This figure stood at 5.4% in 2011 – its lowest since 2003,
and below the average since 1974 of 8.5%.
The proportion of income spent on mortgage payments is heavily influenced by interest
rates, which have been at historically low levels since 2008. Low interest rates have two
countervailing effects on mortgage payments, which typically balance each other out:
while they directly reduce interest payments on a given loan, they may induce
households to borrow larger amounts, therefore increasing their total monthly payments.
However, if sharply rising interest rates follow a period of rising house prices, this can
have a substantial impact on households’ ability to service their debts, leading to rising
arrears and repossessions. This is precisely what happened in the late 1980s and early
1990s in the UK, as illustrated in Figure 5.9. The sharp increase in mortgage payments in
the late 1980s and early 1990s coincided with, and may have caused, the large decline in
prices seen over the same period.
In contrast, the decline in prices since 2007 was not preceded or accompanied by a rise in
mortgage costs, in large part due to the loose monetary policies pursued by the Bank of
England, including a historically low base rate, and measures such as Funding for Lending
and Quantitative Easing. Relatively low housing costs are reflected in lower rates of
arrears and repossession, compared with the period from 1989 to the mid-1990s (see
Figure 5.9) – though the low rate of repossessions may also have reflected a change in
policies by lenders, conscious that a high rate of repossessions might increase short-term
losses by depressing market prices further.
Figure 5.9. Percentage of properties in the UK with mortgage arrears or
taken into possession
Note: Relatively low levels of arrears and repossessions since 2007 may reflect special forbearance policies on
the part of lenders, as well as government initiatives such as the Mortgage Rescue Scheme.
Source: DCLG, live table 1300, ‘Number of outstanding mortgages, arrears and repossessions, United
Kingdom, from 1969’, https://www.gov.uk/government/statistical-data-sets/live-tables-on-repossession-
activity.
0.0
0.5
1.0
1.5
2.0
2.5
19
83
19
84
19
85
19
86
19
87
19
88
19
89
19
90
19
91
19
92
19
93
19
94
19
95
19
96
19
97
19
98
19
99
20
00
20
01
20
02
20
03
20
04
20
05
20
06
20
07
20
08
20
09
20
10
20
11
20
12
% o
f p
rop
ert
ies
in a
rre
ars
at
en
d o
f p
eri
od
, o
r ta
ke
n i
nto
re
po
sse
ssio
n
du
rin
g p
eri
od
Mortgages 6–12 months in arrears
Mortgages 12 months or more in arrears
Properties taken into possession

Housing market trends and recent policies
107
However, interest rates are expected to increase over the next few years, and this will put
an upward pressure on households’ mortgage payments. It is difficult to say whether
these predicted increases in interest rates will increase mortgage defaults and ultimately
bring down house prices. Recent research has suggested that if the Bank of England base
rate rises as projected (from 0.5% in early 2014 to 3% by 2018), the proportion of
households with outstanding debts paying more than 50% of their disposable income on
debt interest and repayment would rise from 4% to 8–10% (compared with 6% in
2007).25
Why are prices growing faster in London?
The preceding analysis suggests that, on the basis of fairly simple comparisons with long-
term trends, London is the region most likely to be experiencing (the early stages of) a
housing market bubble. However, (at least) three features of the London economy and
housing market might explain the more rapid growth of house prices without reference
to a bubble:
a larger gap between population growth and the construction of new homes;
the stronger performance of London’s economy, on some measures, since 2007;
the high level of foreign investment in London.
The gap between population growth and the number of new homes in London is
greater than that for the rest of the UK, and seems to be increasing
In the long run, an important driver of demand for housing is the growth rate in the
population.26 Table 5.1 shows that population growth between 2001 and 2011 was faster
in London than elsewhere in England, but that the dwelling stock grew at similar rates:
while growth in the number of new homes outstripped population growth for England as
a whole, in London the reverse was true, with population growth significantly faster than
growth in the housing supply. This additional pressure on the housing stock likely put an
upward pressure on house prices, and might help explain why, for the first time in a
century, the average household size in London increased. In contrast, household size
continued to decline in the rest of England.
Table 5.1. The gap between supply and demand for houses in London
England London
Population growth 2001–11 7.2% 11.6%
Growth in dwelling stock, 2001–11 8.3% 8.7%
Note: Estimates of dwelling stock account for new builds and conversions, less demolitions.
Source: Population growth data from ONS, ‘2011 Census – population and household estimates for England
and Wales, March 2011’, 2012, http://www.ons.gov.uk/ons/rel/census/2011-census/population-and-
household-estimates-for-england-and-wales/stb-e-w.html. Dwelling stock data from ONS, live table 125,
‘Dwelling stock estimates by local authority district: 2001 to 2012’,
https://www.gov.uk/government/statistical-data-sets/live-tables-on-dwelling-stock-including-vacants.
25 M. Whittaker, Closer to the Edge? Debt Repayments in 2018 under Different Household Income and
Borrowing Cost Scenarios, Resolution Foundation, 2013, http://www.resolutionfoundation.org/publications/closer-edge-debt-repayments-2018-under-different-h/.
26 The ONS defines a ‘household’ as one person living alone, or a group of people (not necessarily related)
living at the same address with common housekeeping – that is, a shared living room or sitting room or at least one shared meal a day.
The IFS Green Budget: February 2014
108
These demographic pressures in London are set to intensify. Projections from the ONS,
based on the 2011 Census, suggest that London’s population will grow by 14.2% over the
decade from 2011, significantly faster than over the previous decade. The growth in
population for England as a whole will also increase, though by less far, to 8.6%.27 The
growth rate of new homes in London will have to exceed its pre-recession average
significantly in order to keep up with this population growth.
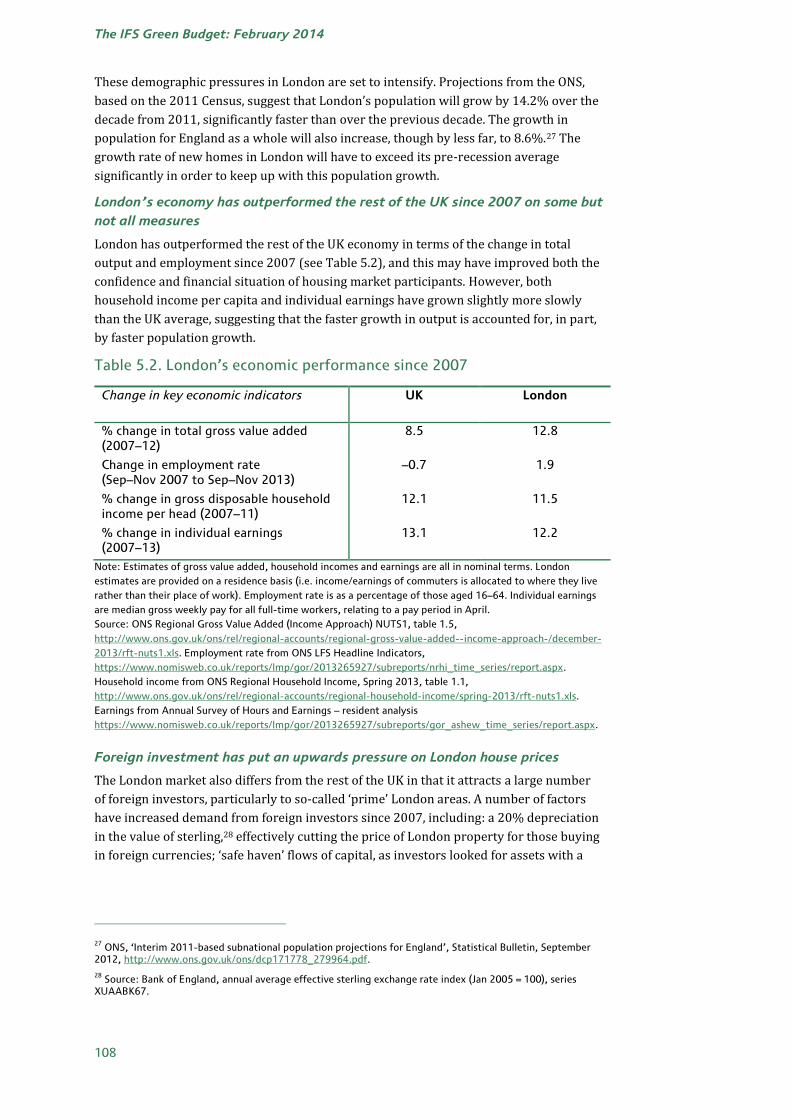
London’s economy has outperformed the rest of the UK since 2007 on some but
not all measures
London has outperformed the rest of the UK economy in terms of the change in total
output and employment since 2007 (see Table 5.2), and this may have improved both the
confidence and financial situation of housing market participants. However, both
household income per capita and individual earnings have grown slightly more slowly
than the UK average, suggesting that the faster growth in output is accounted for, in part,
by faster population growth.
Table 5.2. London’s economic performance since 2007
Change in key economic indicators UK London
% change in total gross value added (2007–12)
8.5 12.8
Change in employment rate (Sep–Nov 2007 to Sep–Nov 2013)
–0.7 1.9
% change in gross disposable household income per head (2007–11)
12.1 11.5
% change in individual earnings (2007–13)
13.1 12.2
Note: Estimates of gross value added, household incomes and earnings are all in nominal terms. London
estimates are provided on a residence basis (i.e. income/earnings of commuters is allocated to where they live
rather than their place of work). Employment rate is as a percentage of those aged 16–64. Individual earnings
are median gross weekly pay for all full-time workers, relating to a pay period in April.
Source: ONS Regional Gross Value Added (Income Approach) NUTS1, table 1.5,
http://www.ons.gov.uk/ons/rel/regional-accounts/regional-gross-value-added--income-approach-/december-
2013/rft-nuts1.xls. Employment rate from ONS LFS Headline Indicators,
https://www.nomisweb.co.uk/reports/lmp/gor/2013265927/subreports/nrhi_time_series/report.aspx.
Household income from ONS Regional Household Income, Spring 2013, table 1.1,
http://www.ons.gov.uk/ons/rel/regional-accounts/regional-household-income/spring-2013/rft-nuts1.xls.
Earnings from Annual Survey of Hours and Earnings – resident analysis
https://www.nomisweb.co.uk/reports/lmp/gor/2013265927/subreports/gor_ashew_time_series/report.aspx.
Foreign investment has put an upwards pressure on London house prices
The London market also differs from the rest of the UK in that it attracts a large number
of foreign investors, particularly to so-called ‘prime’ London areas. A number of factors
have increased demand from foreign investors since 2007, including: a 20% depreciation
in the value of sterling,28 effectively cutting the price of London property for those buying
in foreign currencies; ‘safe haven’ flows of capital, as investors looked for assets with a
27 ONS, ‘Interim 2011-based subnational population projections for England’, Statistical Bulletin, September
2012, http://www.ons.gov.uk/ons/dcp171778_279964.pdf.
28 Source: Bank of England, annual average effective sterling exchange rate index (Jan 2005 = 100), series
XUAABK67.

Housing market trends and recent policies
109
relatively certain value in light of the euro debt crises; and rising global equity prices,
making housing a relatively more attractive investment.29
Data on the extent of foreign investment and its impact on the London housing market
are relatively poor, and what data exist largely focus on the ‘prime’ London market.
Research by Knight Frank, an estate agent, suggests that in the 12 months to June 2013,
49% of ‘£1m+ sales in prime central London’ went to non-UK nationals, with 28% going
to non-UK residents. Foreign investors play a disproportionately large role in the market
for new-build properties, with 69% of new builds in ‘prime’ London in the two years to
June 2013 being bought by non-UK nationals and 49% by non-UK residents. The
proportion of new-build sales to non-UK residents fell to about 20% when including
‘inner’ London and 7% when including ‘outer’ London.30
It is difficult to assess the impact of foreign investment on the London market as a whole.
The Bank of England, using data from Knight Frank and Savills, estimates that foreign
purchases have accounted for around 3% of all transactions in London.31 The high value
of many foreign purchases suggests that this would be higher as a proportion of the total
value of all transactions. Clearly, the effect of foreign investment on prices will be
strongest in the particular market segments where it has a significant presence (prime
London properties and new builds). But there are likely to be much wider knock-on
effects – for example, as those who would previously have bought in ‘prime’ London
move further out, pushing prices up elsewhere, and so on.
London buyers have been able to borrow more, suggesting strong price
expectations
As discussed in Box 5.3, another way of testing for the presence of a bubble is to see
whether price expectations are a key aspect of behaviour. In particular, in a housing
bubble, we might expect buyers to pay more than they otherwise would for a property, in
expectation of making a speculative gain or out of concern that delaying their purchase
will only make it harder to purchase a house in the future.
There is little direct evidence on motivations for purchase in the UK (in contrast to the
high-quality surveys that have been carried out on understanding house price
expectations in the US). This means that, rather than looking at trends in expectations, we
have to look at trends in behaviour that might reveal something about underlying
expectations. In particular, evidence of high loan-to-value (LTV) ratios might suggest
strong price expectations, as the higher the LTV the greater the exposure to both gains
and losses. High loan-to-income multiples may suggest greater confidence of lenders, in
that, even if borrowers default on payments, lenders expect strong price growth will
allow them still to avoid losses.
29 For a discussion of the factors driving prices in the ‘prime’ London market, see Development Securities
PLC/Fathom Consulting, Prime Central London: One Year On, and Even Higher, 2013, http://www.developmentsecurities.co.uk/devsecplc/dlibrary/panda/PCL_Report_2013_v2.pdf.
30 Knight Frank, International Buyers in London, October 2013, http://my.knightfrank.com/research-
reports/international-buyers-in-london.aspx. The ‘prime’ London market typically refers to the best properties in the most expensive areas of central London, though there is no single agreed definition. Knight Frank defines ‘prime central London’ as Belgravia, Chelsea, Hyde Park, Islington, Kensington, Knightsbridge, Marylebone, Mayfair, Notting Hill, Regent’s Park, St John’s Wood, Riverside[,] the City and the City Fringe; and it defines ‘prime London’ as these areas plus Canary Wharf, Fulham, Hampstead, Richmond, Wandsworth, Wapping and Wimbledon (see http://my.knightfrank.co.uk/research-reports/prime-central-london-sales-index.aspx).
31 Page 24 of Bank of England, Financial Stability Report, November 2013,
http://www.bankofengland.co.uk/publications/Pages/fsr/2013/fsr34.aspx.

The IFS Green Budget: February 2014
110
Figure 5.10. Share of new mortgages for house purchase with loan-to-
income ratio greater than 4.5
Source: Chart 2.26 of Bank of England, Financial Stability Report, November 2013,
http://www.bankofengland.co.uk/publications/Pages/fsr/2013/fsr34.aspx.
The latest data (from 2012) do not indicate any significant increase in LTV ratios for first-
time buyers in London.32 LTV ratios dropped in London and across the UK in 2008–09
and remain lower than they were at their peak. On the other hand, loan-to-income ratios
have typically been rising faster in London than in the rest of the UK. For example, Bank
of England data suggest that the proportion of mortgages for house purchases with a
loan-to-income ratio greater than 4.5 in London has effectively doubled since 2009 and
far exceeds the previous peak – a much faster rate of growth than elsewhere in the
country (see Figure 5.10). However, it is not clear whether this indicates excessive
confidence among lenders about the trajectory of house prices in London.
Summary
The evidence we have been able to gather does not suggest that the features of a housing
bubble are present to any great extent in the UK housing market as a whole. In particular,
both nominal and real prices are still below both their previous peaks and the levels that
would be predicted by longer-term trends. Nevertheless, the Bank of England will be
tracking carefully the behaviour of lenders, the trajectory of house prices and the motives
of purchasers. The greater emphasis of the Bank on financial stability rather than simply
monetary policy targeting is welcome in this respect.
The market that should be a particular focus of concern in this respect is the London
market. As demonstrated here, the distinct aspects of activity in this market – the
proximity of nominal prices to their 2007 peak, a rising as opposed to stable ratio of
house prices to earnings (and, in fact, rising faster than its long-run trend would suggest),
and the rising number of high mortgage offers relative to income – indicate that the
likelihood of a bubble is greatest in London, and they warrant careful monitoring.
32 Council of Mortgage Lenders, Housing in London: Challenges and Solutions, November 2012,
http://www.cml.org.uk/cml/filegrab/Housing%20in%20London:%20challenges%20and%20solutions?ref=8479.
0
2
4
6
8
10
12
14
16
18
20
Jun
e 2
00
5
Oct
ob
er
20
05
Fe
bru
ary
20
06
Jun
e 2
00
6
Oct
ob
er
20
06
Fe
bru
ary
20
07
Jun
e 2
00
7
Oct
ob
er
20
07
Fe
bru
ary
20
08
Jun
e 2
00
8
Oct
ob
er
20
08
Fe
bru
ary
20
09
Jun
e 2
00
9
Oct
ob
er
20
09
Fe
bru
ary
20
10
Jun
e 2
01
0
Oct
ob
er
20
10
Fe
bru
ary
20
11
Jun
e 2
01
1
Oct
ob
er
20
11
Fe
bru
ary
20
12
Jun
e 2
01
2
Oct
ob
er
20
12
Fe
bru
ary
20
13
Jun
e 2
01
3
Pro
po
rtio
n o
f n
ew
mo
rtg
ag
es
wit
h lo
an
-to
-in
com
e r
ati
o >
4.5
London All
Housing market trends and recent policies
111
5.4 Recent innovations in housing policy
This section describes and evaluates three flagship policies introduced by the coalition
government since 2010 in order to stimulate homeownership. These are Help to Buy:
equity loan, Help to Buy: mortgage guarantee, and the reinvigorated Right to Buy policy
for council house tenants.33
Help to Buy
In the March 2013 Budget, the government announced a new policy called ‘Help to Buy’
designed to support homeownership. There are two distinct components of this policy:
‘Help to Buy: equity loan’ provides interest-free government loans of up to 20% to
purchasers of newly-built homes. It was launched in April 2013.
‘Help to Buy: mortgage guarantee’ provides mortgage lenders the option of
purchasing insurance for high loan-to-value (LTV) mortgages on all new and existing
properties. Participating lenders have been able to offer eligible mortgages since
October 2013, though government guarantees have only been in place since January
2014.
Both schemes will make it easier to buy a home with just a 5% deposit.
Eligibility for both schemes is essentially the same and fairly broad. The schemes are
open to existing homeowners as well as first-time buyers, and there is no restriction on
household income for eligibility. The schemes are for residential purposes and properties
cannot generally be sublet or rented out. In addition, they are not open to individuals who
own any other property at the time of purchase. Both schemes can be used to purchase
properties up to a value of £600,000. The major difference between the strands of the
policy is that Help to Buy: equity loan is specifically for newly-built properties.
Help to Buy: equity loan involves the direct provision by the government of up to
£3.5 billion in loans over three years from April 2013. Help to Buy: mortgage guarantee is
a form of government-provided insurance policy with a contingent liability to the
government capped at £12 billion, which will run for three years from January 2014.34
Help to Buy: equity loan
Policy details and objectives
Help to Buy: equity loan provides loans up to 20% of the value of new-build homes worth
up to £600,000, with no interest or charges for the first five years. In essence, the
government buys up to 20% of the purchaser’s property but charges no rent for five
years.35
33 See ‘Helping people to buy a home’, https://www.gov.uk/government/policies/helping-people-to-buy-a-
home.
34 Page 39 of HM Treasury, Budget 2013,
https://www.gov.uk/government/uploads/system/uploads/attachment_data/file/221885/budget2013_complete.pdf.
35 For a brief summary of the scheme, see https://www.gov.uk/government/policies/helping-people-to-buy-a-
home/supporting-pages/help-for-first-time-buyers. Help to Buy: equity loan builds on a similar scheme, FirstBuy, which also provided 20% equity loans on new properties. The major differences between the two policies are that Help to Buy significantly expanded eligibility, including home movers as well as first-time buyers, abolishing the household income cap of £60,000, and more than doubling the maximum eligible

The IFS Green Budget: February 2014
112
In the sixth year, the government charges a fee of 1.75% of the loan’s value. After this, the
fee increases every year by the retail price index (RPI) plus 1%, if this is positive. So, for
example, if RPI growth in the seventh year of homeownership is 3%, the interest payable
would increase by 4%, from 1.75% to 1.82%; in year 15, assuming RPI of 3% each year,
the interest rate on the loan would be 2.5%. This structure is designed to induce
borrowers to pay off the loan at some point.
The loan is fully repayable when the owner sells their home or at the end of their
mortgage, whichever comes first, although a minimum of 10% of the total property value
can be part repaid at any time after the first year of the loan. At the point of sale, owners
must repay the percentage equity loan that is outstanding. So, for example, someone who
takes out a 20% loan and does not make any repayments before selling will need to pay
back 20% of the market value on sale. A 10% part repayment prior to that time (for
example) will also be repaid as a 10% fraction of the current market value. Hence, the
government shares in any capital gain or loss.
The government has not spelled out the rationale for this scheme in any great detail.
However, it has at least two clear aims: to enable more people to access homeownership
and to increase the supply of new-build homes. The scheme will increase access to
homeownership in two ways:
reducing the minimum deposit to 5%;
reducing households’ monthly payments, because no interest is charged on the equity
loan for a set period of five years.
It aims to increase construction by increasing demand for new-build homes.
In addition, the policy is likely to act as a short-term measure to support capacity in the
construction industry, which, as we saw in Section 5.3, continues to operate below pre-
crisis levels.
The total public funding set aside for the Help to Buy: equity loan scheme is £3.5 billion
over the three years from April 2013. The government predicts that this sum will help up
to 74,000 home-buyers, implying an average loan of £47,000.36 Assuming these loans
represent the maximum of 20% of the total house price, this implies a house purchase
price of around £235,000, which is higher than the average of Nationwide and Halifax
house prices (around £171,000 in 2013Q3), though closer to the ONS average house price
(£246,000).
Evaluation of Help to Buy: equity loan
The Help to Buy: equity loan scheme is relatively new and any assessment of its impact is
necessarily preliminary. It can be evaluated in two facets: in terms of enhancing
affordability at the household level and in terms of stimulating new construction.
Data released in November 2013 covering the scheme’s first six months showed:37
property value from £280,000 to £600,000. It also represents a big increase in funding – from £490 million over two years (see http://hoa.org.uk/2012/09/government-to-extend-firstbuy-scheme/) to £3.5 billion over three years.
36 HM Treasury, Budget 2013, 39
(https://www.gov.uk/government/uploads/system/uploads/attachment_data/file/221885/budget2013_complete.pdf )
37 DCLG, ‘Help to Buy: equity loan scheme and NewBuy statistics: data to September 2013, England’,
https://www.gov.uk/government/uploads/system/uploads/attachment_data/file/260034/HelptoBuy_and_Ne
wBuy.pdf. Further data will be released on a quarterly basis, with the next release due in February 2014.

Housing market trends and recent policies
113
5,375 properties were bought with the support of the Help to Buy: equity loan
scheme. The total value of these equity loans was £208 million, with the value of the
properties sold under the scheme totalling £1.04 billion.
The average price of a property bought under the scheme was £194,167, with an
average equity loan of £38,703. Fewer than 15% of houses were purchased for more
than £250,000.
27.2% of completions were for households with a gross income between £30,001 and
£40,000 a year; 22.5% had an annual household income of between £20,001 and
£30,000. Fewer than 15% had incomes of £60,000 or more.
92 per cent of all loans were made to first-time buyers.
Affordability
How much difference does the scheme make to the typical household that has used it to
date, i.e. a household with an income of £35,000, taking out the average loan of almost
£39,000? To buy the same property with a 75% mortgage, the household would require
an extra deposit. This would add a further five years’ delay to the purchase, assuming
they saved an extra 20% of their income each year (considerably higher than the average
household saving rate). If the household instead bought the property with its 5% deposit
and a 95% mortgage, it would (assuming it would qualify for such a mortgage) be facing
immediate monthly repayments of around £1,090 per month, compared with £780 on a
typical 75% mortgage.38
Most households purchasing under the scheme have above-average incomes. However,
they have lower incomes than typical house purchasers – as would be expected given the
way in which the scheme is targeted on households that could not reasonably purchase
their home without this support. Over half (54%) of those purchasing through Help to
Buy: equity loan have a total gross household income of less than £40,000, compared
with 42% of those borrowing to purchase a home in 2012 (the last year for which such
data are available); and whereas 42% of those borrowing to buy a home had an income
over £50,000, this was the case for just 27% of those taking out equity loans.39
The official data also suggest that (a) the upper limit of £600,000 on a new house under
the scheme is not binding (i.e. most purchases are at a level well below this price) and (b)
that the majority of users of the scheme are first-time buyers. This should ameliorate the
concern that the scheme would be used by existing homeowners to purchase expensive
new properties, which would do little to address ‘affordability’.
Nevertheless, from the perspective of ‘affordability’, it is somewhat surprising that the
ceiling on prices was set at such a high level and that the scheme was not focused
explicitly on first-time buyers, as had been the case with the previous ‘FirstBuy’ scheme.40
Reducing the cap on prices and/or restricting the policy to first-time buyers would target
38 Calculations using the BBC Mortgage Calculator
(http://www.bbc.co.uk/homes/property/mortgagecalculator.shtml, accessed 18 December 2013) on the basis of a 25-year repayment mortgage, with an interest rate of 5% for a 95% mortgage and 4% for a 75% mortgage. These are based on typical fees for a two-year fixed-rate residential mortgage.
39 Family Resources Survey data for the latest available year (2011–12) suggest that over half of households
have a gross unequivalised income of less than £20,000 a year, compared with just 4.6% of households purchasing under the equity loan scheme. Data on incomes of those borrowing to purchase a home is from ONS, House Price Index, table 21, ‘Housing market: distribution of borrowers' incomes, United Kingdom, from 1990’, http://www.ons.gov.uk/ons/rel/hpi/house-price-index/november-2013/rft-annual-november-2013.xls.
40 See footnote 35 for a discussion of key differences between FirstBuy and Help to Buy: equity loan.

The IFS Green Budget: February 2014
114
the policy in this respect. In addition, if a potential bubble in the London housing market
is a concern, then one policy response would be to reduce the cap, as this is likely to have
the strongest impact in London, where prices are highest. However, it seems likely that
these changes would have a limited impact, given that most purchases to date are by first-
time buyers, and well below the cap.
Help to Buy and the housing market
Assessing the impact on new construction is more difficult. As discussed in Section 5.3,
there has been a marked increase in residential construction orders over the past year.
However, it is difficult to distinguish the increase in construction due to the direct impact
of the equity loan scheme on construction and its indirect effect on price expectations,
from those due to wider improvements in the economy and housing market. Official data
suggest that 18,050 reservations for new homes were made through Help to Buy: equity
loan in its first seven months (April–October 2013).41 To give a sense of scale, this
compares with around 44,150 new private housing completions in the two quarters
between April and September 2013.42
An important concern is whether this policy is simply subsidising existing would-be
purchasers of newly-built homes. The criteria for eligibility for Help to Buy are fairly
wide, and the terms of the scheme are such that most of those who are eligible have an
incentive to participate. The challenge for government is that it cannot distinguish
purchasers who would have bought a new home in the absence of the scheme (‘current
buyers’) from those who would not (‘additional buyers’). As a result, some of the
estimated 74,000 loans will go to current buyers and, in this sense, will be a deadweight
loss.
The extent of the deadweight loss from the scheme will depend on the fraction of the total
(estimated) 74,000 equity loans that go to ‘current buyers’, i.e. those who would have
bought a new home even without the scheme. The total number of current buyers each
year is presumably roughly equal to the number of private new-build completions
(around 90,000 in 2012, so in the region of 270,000 over three years). In one extreme
scenario, then, there are sufficient current buyers to absorb all the funding for the
scheme. On the other hand, significant numbers of current purchasers may not be eligible
for the scheme, including foreign investors, buy-to-lets, purchasers of second houses,
those who are assessed by the local Help to Buy agent as being in a position to obtain a
mortgage without requiring the equity loan,43 and those who want to purchase a house
worth more than £600,000. The greater the proportion of ‘current buyers’ who are not
eligible for the scheme, the more likely it is that the scheme will fund genuinely additional
purchases.
This question over deadweight costs arises in addition to the entirely separate question
of whether, if there are net new would-be purchasers as a result of the scheme, the
41 See DCLG, ‘New homes build Britain’s recovery’, November 2013,
https://www.gov.uk/government/news/new-homes-build-britains-recovery--2.
42 DCLG, House Building: September Quarter 2013, England, November 2013,
https://www.gov.uk/government/uploads/system/uploads/attachment_data/file/259891/House_Building_Release_-_Sept_Qtr_2013.pdf.
43 The basic criterion used in assessing whether this applies is the fact that a ‘typical’ mortgage multiple is 4.5
times current earnings: hence, for example, a household with an income of £30,000 seeking to buy a £120,000 property would probably be assessed as ineligible and not able to substitute the Help to Buy scheme for a mortgage provided from other sources. See page 10 of http://www.homesandcommunities.co.uk/sites/default/files/our-work/help_to_buy_buyers_guide_sept_2013.pdf.

Housing market trends and recent policies
115
additional housing construction will be sufficient to absorb the extra demand (rather
than pushing up prices). This will depend on the responsiveness of housing supply to
demand and prices, which, as discussed in Box 5.1 is subject to much debate and difficult
to predict.
Help to Buy: mortgage guarantee
Policy details and objectives
Help to Buy: mortgage guarantee is a scheme designed to boost the supply of high LTV
mortgages by existing mortgage providers, via the provision of government insurance
against potential losses.
The scheme works by offering lenders the option to purchase a government guarantee on
all approved mortgages with an LTV ratio of 80–95%. The guarantee will compensate
mortgage lenders for a portion of the net losses resulting if they repossess a property:
specifically, it will cover 95% of net losses down to 80% of the value of the property (but
none of the losses beyond this). The fee paid by participating lenders has been designed
so that the scheme is expected by the Treasury to be self-financing, covering expected
losses, the cost of capital of providing the guarantee, and the scheme’s administration
costs.44
The rules of the scheme are designed to ensure responsible lending and avoid moral
hazard – in particular, the risk that lenders use the scheme only for their most ‘risky’
loans. The scheme aims to ensure responsible lending by requiring lenders to
demonstrate that they have subjected borrowers to a range of affordability tests, and via
an audit process to ensure that lenders’ standard policies are being applied to loans
under the scheme. Lenders choose whether or not to participate in certain LTV bands.
However, once they decide to participate for a particular band, they must put all eligible
loans that they originate into the scheme. This prevents individual lenders using the
scheme to guarantee the riskiest loans within a given LTV band. However, it cannot
prevent lenders with the riskiest portfolios choosing to participate in the scheme whilst
those with lower-risk high LTV ratios choose not to.45
The scheme was fully launched in January 2014, though lenders were able to start
offering eligible mortgages from October 2013, with these loans transferred into the
scheme in January. The government has committed to making available up to £12 billion
in guarantees over three years, which it estimates will be sufficient to support
£130 billion of high LTV mortgages, albeit at an average LTV ratio somewhat below the
maximum of 95%.46 Useful benchmarks with which to compare these magnitudes are the
44 Page 11 of HM Treasury, ‘Help to Buy: mortgage guarantee scheme outline’, March 2013,
https://www.gov.uk/government/uploads/system/uploads/attachment_data/file/221897/help_to_buy_mortgage_guarantee_scheme_outline.pdf.
45 Current participants in the scheme as at December 2013 were Bank of Scotland, Royal Bank of Scotland, the
NatWest and the Halifax.
46 Page 39 of HM Treasury, Budget 2013,
https://www.gov.uk/government/uploads/system/uploads/attachment_data/file/221885/budget2013_complete.pdf. For a discussion of the average LTV ratio implied by these numbers, see C. Goodhart and M. Baker, ‘Help to Buy: more beneficial than the market thinks’, VOX, 18 October 2013, http://www.voxeu.org/article/help-buy-macroprudential-policy.
The IFS Green Budget: February 2014
116
totals of £29 billion of loans to first-time buyers in the four quarters to 2013Q2 and of
£83 billion in all loans made for owner-occupation over the same period.47
As with Help to Buy: equity loan, the scheme aims to improve affordability in the short
term by reducing the deposit required to buy a house. Unlike Help to Buy: equity loan,
however, the policy is not targeted at new builds. To the extent that the policy seeks to
generate new supply, then, it is presumably assumed that this will happen via boosting
confidence in the mortgage market and expectations of higher house prices.48
There are little data as yet on who is receiving mortgages via Help to Buy. The
government released provisional information in January 2014 looking at applications for
mortgages covered by the government guarantee during the first 12 weeks of the
scheme.49 In that time, more than 6,000 people had put in offers on a property and
applied for a Help to Buy mortgage. On average, they are looking to buy homes worth
£160,000 – just below the average house price of around £170,000 (as measured by
Nationwide and Halifax). More than three-quarters of applicants are from outside London
and the South East, and more than 80% are first-time buyers.
Evaluation of Help to Buy: mortgage guarantee
The mortgage guarantee scheme aims to address the reduction in the availability of high
LTV mortgages since the recession.50 Implicitly, therefore, the policy assumes (1) that a
greater fraction of new mortgages with an LTV ratio above 75% is a desirable object of
policy and (2) that the failure of financial institutions currently to offer such a high
fraction of high LTV mortgages arises from some form of market failure that can be
ameliorated by an intervention of this form.
The most plausible account as to why there may be a market failure is that a combination
of restructuring of balance sheets by banks and greater general uncertainty in financial
markets in the period since the financial crisis has led banks to an over-cautious
assessment of risk, resulting in either excessive risk premiums attached to high LTV loans
or a refusal to lend at high LTV ratios at all.
There is a range of evidence that the market for high LTV loans contracted in the post-
2007 period. Figure 5.11 shows that the proportion of new mortgages with an LTV ratio
over 90% fell from a high of 33% at the end of 2007, to just 13% of total mortgages
offered in June 2013. The proportion of loans with an LTV over 80% fell somewhat less,
47 Bank of England, ‘Mortgage lenders and administrators statistics: Q2 2013’, September 2013,
http://www.bankofengland.co.uk/pra/Documents/regulatorydata/mlar/2013q2/mlar2013q2statisticalrelease.pdf.
48 Help to Buy: mortgage guarantee builds on a similar scheme, NewBuy, launched in March 2012 which
enables participating lenders to offer high LTV mortgages on new-build properties through a housebuilder- and government-backed ‘mortgage indemnity’ scheme; see https://www.gov.uk/government/policies/increasing-the-number-of-available-homes/supporting-pages/newbuy-guarantee-scheme.
49 Prime Minister’s Office, ‘Help to Buy sees £1 billion of new loans and supports 6,000 applicants in 3 months’
2 January 2014, https://www.gov.uk/government/news/help-to-buy-sees-1-billion-of-new-loans-and-supports-6000-applicants-in-3-months.
50 The scheme is explicitly designed to address a cyclical issue, rather than a structural change in the mortgage
market. See paragraph 3.12 of HM Treasury, ‘Help to Buy: mortgage guarantee scheme outline’, March 2013, https://www.gov.uk/government/uploads/system/uploads/attachment_data/file/221897/help_to_buy_mortgage_guarantee_scheme_outline.pdf.

Housing market trends and recent policies
117
Figure 5.11. Volume of new mortgage lending by loan-to-value ratio
Source: Chart 2.24 of Bank of England, Financial Stability Report November 2013,
http://www.bankofengland.co.uk/publications/Pages/fsr/2013/fsr34.aspx.
from 51% to 40% over the same period. Data from the Council of Mortgage Lenders show
that, on average, 60% of mortgage advances to first-time buyers went to those with a
10% (or less) deposit during the period 1990–2007. This figure fell dramatically during
the recession, and it stood at 26% in 2013Q2.51 The median first-time buyer LTV ratio fell
from 90% during most of the 2000s to a low of 75% in 2009, before rising back to 80%
where it currently stands.52
Turning to the effects of the policy, we are interested, first, in what has happened to
lending at high LTV ratios in recent months and, second, in what has happened to the risk
premiums (as reflected in interest rates) attached to high LTV ratios after the Help to Buy
policies were announced. We would expect the direct effects of the policy to be an
increase in the fraction of high LTV ratio mortgages provided by mortgage lenders that
are participating in the scheme, and (potentially) a fall in associated interest rates. The
indirect effect of the policy might be to increase the availability of high LTV ratio
mortgages elsewhere in the housing market (i.e. among non-participating lenders)
and/or to lower the risk premiums attached to high LTV ratio mortgages, due to
competition from participating lenders. These potential impacts can be only partially
assessed in the time since the policy was announced in the 2013 Budget.
The current evidence suggests there has been an increase in the availability of high LTV
loans. The Bank of England’s latest quarterly survey of bank and building society lenders
reports a general increase in the availability of secured loans to households, and
particularly those looking for high LTV products, with the expectation of further
significant increases in the first quarter of 2014. The Bank reports that many lenders
attributed this increase in the availability of high LTV loans to participation in Help to
51 Direct communication with the Council of Mortgage Lenders.
52 HM Treasury, ‘Help to Buy: mortgage guarantee – context and rationale’, slide-pack provided to IFS. For
recent data, see Council of Mortgage Lenders, http://www.cml.org.uk/cml/media/press/3724.
0
50,000
100,000
150,000
200,000
250,000
300,000
350,000
Jun
e 2
00
6
Oct
ob
er
20
06
Fe
bru
ary
20
07
Jun
e 2
00
7
Oct
ob
er
20
07
Fe
bru
ary
20
08
Jun
e 2
00
8
Oct
ob
er
20
08
Fe
bru
ary
20
09
Jun
e 2
00
9
Oct
ob
er
20
09
Fe
bru
ary
20
10
Jun
e 2
01
0
Oct
ob
er
20
10
Fe
bru
ary
20
11
Jun
e 2
01
1
Oct
ob
er
20
11
Fe
bru
ary
20
12
Jun
e 2
01
2
Oct
ob
er
20
12
Fe
bru
ary
20
13
Jun
e 2
01
3
Mo
rtg
ag
es
pe
r q
uart
er
(fo
ur-
qu
art
er
mo
vin
g a
ve
rag
e)
90+%
80–90%
75–80%
0–75%
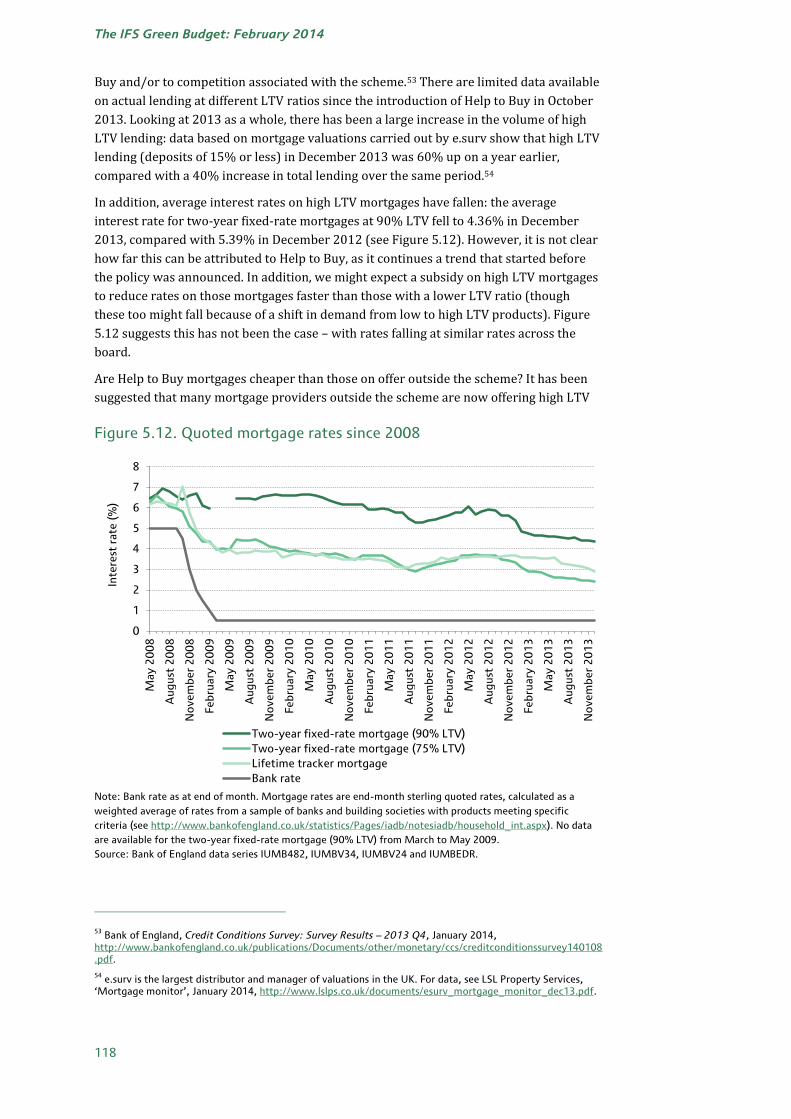
The IFS Green Budget: February 2014
118
Buy and/or to competition associated with the scheme.53 There are limited data available
on actual lending at different LTV ratios since the introduction of Help to Buy in October
2013. Looking at 2013 as a whole, there has been a large increase in the volume of high
LTV lending: data based on mortgage valuations carried out by e.surv show that high LTV
lending (deposits of 15% or less) in December 2013 was 60% up on a year earlier,
compared with a 40% increase in total lending over the same period.54
In addition, average interest rates on high LTV mortgages have fallen: the average
interest rate for two-year fixed-rate mortgages at 90% LTV fell to 4.36% in December
2013, compared with 5.39% in December 2012 (see Figure 5.12). However, it is not clear
how far this can be attributed to Help to Buy, as it continues a trend that started before
the policy was announced. In addition, we might expect a subsidy on high LTV mortgages
to reduce rates on those mortgages faster than those with a lower LTV ratio (though
these too might fall because of a shift in demand from low to high LTV products). Figure
5.12 suggests this has not been the case – with rates falling at similar rates across the
board.
Are Help to Buy mortgages cheaper than those on offer outside the scheme? It has been
suggested that many mortgage providers outside the scheme are now offering high LTV
Figure 5.12. Quoted mortgage rates since 2008
Note: Bank rate as at end of month. Mortgage rates are end-month sterling quoted rates, calculated as a
weighted average of rates from a sample of banks and building societies with products meeting specific
criteria (see http://www.bankofengland.co.uk/statistics/Pages/iadb/notesiadb/household_int.aspx). No data
are available for the two-year fixed-rate mortgage (90% LTV) from March to May 2009.
Source: Bank of England data series IUMB482, IUMBV34, IUMBV24 and IUMBEDR.
53 Bank of England, Credit Conditions Survey: Survey Results – 2013 Q4, January 2014,
http://www.bankofengland.co.uk/publications/Documents/other/monetary/ccs/creditconditionssurvey140108.pdf.
54 e.surv is the largest distributor and manager of valuations in the UK. For data, see LSL Property Services,
‘Mortgage monitor’, January 2014, http://www.lslps.co.uk/documents/esurv_mortgage_monitor_dec13.pdf.
0
1
2
3
4
5
6
7
8
Ma
y 2
00
8
Au
gu
st 2
00
8
No
ve
mb
er
20
08
Fe
bru
ary
20
09
Ma
y 2
00
9
Au
gu
st 2
00
9
No
ve
mb
er
20
09
Fe
bru
ary
20
10
Ma
y 2
01
0
Au
gu
st 2
01
0
No
ve
mb
er
20
10
Fe
bru
ary
20
11
Ma
y 2
01
1
Au
gu
st 2
01
1
No
ve
mb
er
20
11
Fe
bru
ary
20
12
Ma
y 2
01
2
Au
gu
st 2
01
2
No
ve
mb
er
20
12
Fe
bru
ary
20
13
Ma
y 2
01
3
Au
gu
st 2
01
3
No
ve
mb
er
20
13
Inte
rest
rate
(%
)
Two-year fixed-rate mortgage (90% LTV)
Two-year fixed-rate mortgage (75% LTV)
Lifetime tracker mortgage
Bank rate

Housing market trends and recent policies
119
loans at rates that are competitive with those under Help to Buy.55 This evidence,
admittedly anecdotal, suggests that there may have been indirect effects on the wider
mortgage market and some increase overall in high LTV ratios. To what extent this would
have happened as the economy began to recover in the absence of the policy is, of course,
hard to judge.
Wider issues
Help to Buy: mortgage guarantee has been widely criticised on the grounds that, by
boosting demand without any direct mechanism for increasing supply, the scheme will
increase prices, thereby worsening the underlying affordability problems that it is meant
to address. Estimating the effect of the policy on house prices is extremely difficult, in
part because the eventual take-up from the scheme is unknown and, moreover, because it
would need a detailed model of the housing market, which in turn would require
controversial assumptions about, for example, the responsiveness of housing supply.
Nonetheless, analysis by the OBR, based on its house price model discussed in Section 5.3,
suggests that a 1% addition to the stock of mortgage lending would increase prices by 1%
within a year, via its effect on price expectations and given its assumption of a limited
short-run supply response. The OBR has concluded that ‘a slow response of supply to
price signals … would mean additional mortgage lending feeds mainly into upward
pressure on house prices’.56 At one extreme, therefore, if the mortgage guarantee
programme is taken up to its maximum capacity, underpinning mortgage offers on the
scale of 10% of the current total stock of household mortgage debt, and if these mortgage
offers would not otherwise have been made (a strong assumption), then, according to the
OBR’s model, Help to Buy could lead to a 10% increase in house prices over three years.
However, if fewer mortgages are taken out through the scheme, and/or if some Help to
Buy mortgages would have been made in the absence of the policy, and/or if the supply
response is larger than expected, then the effect on prices will be more limited.
Overall assessment of Help to Buy
Help to Buy was developed and announced in a period when the housing market was
showing slow signs of recovery. In retrospect, given the sharp recovery of the UK
economy during 2013, and the concurrent improvement in the housing market, this
package of direct and indirect financial incentives might not have been necessary in order
to put the housing market on a trajectory towards historically ‘normal’ price and activity
levels. Indeed, the Bank of England’s decision at the end of November 2013 to announce
an end to the Funding for Lending Scheme for mortgage providers may be taken as
evidence that the Bank feels that existing policies of low interest rates, the Help to Buy
policy and the existing recovery in the housing market are sufficient for purpose.57
Nevertheless, it can be argued that the announcement of these policies was helpful in
inducing and then maintaining the housing market recovery.
However, there are questions as to whether the Help to Buy schemes are sufficiently
targeted, given their objective of increasing access to homeownership. Both schemes
55 http://www.thisismoney.co.uk/money/mortgageshome/article-2502772/The-best-5-deposit-mortgages-
beat-Help-Buy.html.
56 OBR, ‘Supplementary forecast information release: house price model’, December 2013,
http://budgetresponsibility.org.uk/wordpress/docs/House-price-model-Dec-13.pdf.
57 See http://www.bankofengland.co.uk/publications/Pages/news/2013/177.aspx.
The IFS Green Budget: February 2014
120
could be modified in ways that would target them more effectively at those who may not
otherwise be able to access homeownership. In particular, they could be restricted to
first-time buyers, and/or the cap on eligible property values could be reduced (which
would also be likely to target the scheme at first-time buyers, who typically buy cheaper
properties). However, as has already been noted, most lending through Help to Buy to
date has been well within the cap, and to first-time buyers, so it is not clear that these
changes would have a substantial impact.
In addition, concerns have been raised that Help to Buy will increase the risk of a house
price bubble. As discussed in Section 5.3, we do not believe there is clear evidence of a
housing bubble, though the risk of one developing is clearly highest in London. If the risk
of a bubble becomes a major concern, the government may want to consider two
modifications. First, a reduction in the cap on property value – for example, to £300,000
(half its current value) – would, in addition to targeting the policy on first-time buyers, be
likely to have the greatest impact on the London market, where the average price is over
£300,000. A more significant change would be to restrict the mortgage guarantee scheme
to lending on new-build properties. At present, the implicit mechanism by which Help to
Buy: mortgage guarantee will encourage greater housing supply is by raising house price
expectations. Restricting the scheme to mortgages on new builds would mitigate the risk
of providing a significant stimulus to demand without inducing an increase in supply,
thereby driving up prices.
Right to Buy
A second major reform introduced by the coalition government in order to increase
homeownership is a revamp of Right to Buy, a policy originally introduced in 1980 which
gave council housing tenants a right to buy their property at a heavily discounted rate
relative to market prices.58
At the heart of debates about Right to Buy is a tension between two competing goals with
respect to the role of social housing. The first goal, which motivated the introduction of
Right to Buy in 1980, is that of increasing homeownership, achieved by selling social
housing at a discount. As sales took place, however, this goal has increasingly come into
conflict with the (statutory) requirement for local authorities to provide housing to the
homeless and others in need of housing. Inasmuch as increasing homeownership through
Right to Buy reduces the stock of social housing, the policy makes it more difficult for
local authorities to meet obligations towards those in need of housing through social
housing provision, requiring them to provide accommodation through more expensive
means such as private rentals.
Background: Right to Buy, 1980–2010
Right to Buy (RTB) was a flagship policy of the Thatcher government, introduced in the
Housing Act of 1980. Under RTB, council tenants with at least three years’ tenure in their
council house gained a statutory right to buy their home at discounts ranging from 33%
to 50% of the market price depending on their length of tenure. In addition, local
authorities were required to make mortgages available to would-be purchasers, subject
to standard age limits and income requirements. The discount would be repayable if the
property was sold within five years of purchase.
58 For further detailed discussion and a more formal economic analysis of the policy, see G. Luo, R. Disney and
J. Gathergood, ‘The Right to Buy public housing in Britain: a welfare analysis’, mimeo, 2014 (available from the authors).

Housing market trends and recent policies
121
Figure 5.13. Annual Right to Buy sales in England
Note: Includes Right to Buy sales by local authorities and ‘preserved’ Right to Buy sales by registered social
housing associations (individuals may retain a ‘preserved’ Right to Buy if their home was transferred from a
local authority to another landlord (e.g. a housing association) while they were living in it), but excludes other
sales of social housing.
Source: DCLG, table 678, ‘Social housing sales: annual sales by scheme for England: 1980–81 to 2012–13’,
https://www.gov.uk/government/uploads/system/uploads/attachment_data/file/249037/Table_678.xls.
Council house sales under RTB averaged nearly 100,000 per year during the 1980s,
peaking following the introduction of the policy in 1980, and the liberalisation of
eligibility conditions and increased discounts in the mid-1980s (see Figure 5.13). Sales
continued through to the late 1990s, as new tenants became eligible by attaining
residency requirements and as councils that had implemented the policy more slowly
continued to sell social housing. In England, the total stock of council-owned properties
as a share of total dwellings fell from 27% in 1981 to just over 11% in 2003.59 The policy
was extended to tenants of properties owned by housing associations through the Right
to Acquire policy in 2003, albeit with tighter restrictions on eligibility and discounts.
The major beneficiaries of RTB were, unsurprisingly, the tenants who were able to buy
properties at heavily discounted rates. RTB brought about a significant shift in owner-
occupation in the UK, which increased from 59% in 1981 to 69% in 2003.60 Central
government was a beneficiary too, at least in the short run, in the sense that most receipts
from sales were effectively returned to the treasury.61 In the short run, councils fared less
well because they had access to just 25% of the capital receipts, though they also
benefited from savings due to reduced maintenance costs and no longer having to
subsidise rents.
On the other hand, the gradual decline in the council housing stock has created
difficulties. Of around 6.5 million council properties in 1979, around 2.8 million had been
59 ONS, live table 104, ‘Dwelling stock: by tenure, England (historical series)’,
https://www.gov.uk/government/statistical-data-sets/live-tables-on-dwelling-stock-including-vacants.
60 See previous footnote.
61 For further discussion of the operation of the policy, see House of Commons Library, ‘The Right to Buy’,
Research Paper RP99/36, 1999, http://www.parliament.uk/business/publications/research/briefing-papers/RP99-36/the-right-to-buy.
0
20,000
40,000
60,000
80,000
100,000
120,000
140,000
160,000
180,000
19
80
–8
1
19
82
–8
3
19
84
–8
5
19
86
–8
7
19
88
–8
9
19
90
–9
1
19
92
–9
3
19
94
–9
5
19
96
–9
7
19
98
–9
9
20
00
–0
1
20
02
–0
3
20
04
–0
5
20
06
–0
7
20
08
–0
9
20
10
–1
1
20
12
–1
3
An
nu
al R
igh
t to
Bu
y s
ale
s

The IFS Green Budget: February 2014
122
sold by the mid-2000s.62 Yet local authorities still have a statutory obligation to house the
homeless and those in pressing housing need. In some councils – particularly in
metropolitan areas – shortages of social housing led to longer waiting lists and housing of
families in unsuitable or more expensive properties.
Partly in response to these concerns about the availability of social housing, the incoming
Labour administration in 1997 tightened up the rules for selling council houses –
narrowing eligibility, reducing discounts, limiting access to public mortgages and
reducing the capacity of RTB buyers to sell their properties within a short period at a
profit. One of the most important of these changes was the reduction in maximum
discounts. Up to 1999, there was a national maximum discount of £50,000. In 1999, these
ceilings were reduced across the board, and applied differentially across regions: areas
with higher prices had higher ceilings, ranging from £38,000 in London to £22,000 in
northern England. In 2003, the policy on discount ceilings was changed further, so that
they could be reduced in areas where there was clear evidence of a public housing
shortage. This led to significant reductions in caps in areas of high pressure on public
housing, with nine local authorities in the South East and all but two London boroughs
reducing the ceiling to £16,000. Having increased from around 46,000 to 84,000 between
1997–98 and 2003–04, sales of social housing under RTB in England then fell rapidly,
reaching a low of just over 3,000 in 2009–10.63
Right to Buy: changes since 2010
The coalition government has sought to ‘reinvigorate’ RTB sales via large increases in
maximum discounts: in April 2012, these were raised to £75,000 in England, and the
maximum discount in London was raised further to £100,000 in March 2013. The
changes also reduced the qualifying period before tenants become eligible for RTB from
five to three years. These changes signal a reprioritisation towards the goal of increasing
homeownership, relative to the concern – more prominent under the previous
government – with managing the stock of social housing.
While increasing homeownership seems to be the primary goal of recent reforms, the
government has introduced changes designed to mitigate any further decline in the
availability of social housing. In particular, local authorities have been allowed to retain a
greater proportion of receipts from RTB sales,64 and there is a commitment to one-for-
one replacement, at a national level, of homes sold under RTB with homes provided at
‘affordable rents’ (i.e. rents at 80% or less of market rates).
These changes only apply to England: the Welsh government has maintained a maximum
discount of £16,000, while the Scottish government has announced its intention to end
RTB entitlements entirely, subject to the passage of the Housing (Scotland) Bill.65
62 Table 4.2 of C. Jones and A. Murie, The Right to Buy: Analysis and Evaluation of a Housing Policy,
Blackwell, Oxford, 2006.
63 Pages 3–4 of House of Commons Library, ‘Incentivising the Right to Buy’, Standard Note SN/SP/6251, 2014,
http://www.parliament.uk/business/publications/research/briefing-papers/SN06251/incentivising-the-right-to-buy; DCLG, table 678, ‘Social housing sales: annual sales by scheme for England’, https://www.gov.uk/government/uploads/system/uploads/attachment_data/file/249037/Table_678.xls.
64 Following a consultation, the government has decided on a model whereby local authorities can retain net
receipts of social housing only if they can commit to limit the contribution of these receipts to 30% of the total cost of new social housing. See House of Commons Library, ‘Reforming the Right to Buy in 2012 & 2013’, Standard Note, 2013.
65 See ‘Buying your Council House’, http://wales.gov.uk/topics/housing-and-regeneration/housing-
supply/buying-and-selling/council-house/?lang=en and ‘“Right to Buy” to be scrapped in Scotland’, http://www.bbc.co.uk/news/uk-scotland-23155904.
Housing market trends and recent policies
123
Evaluation: reforming Right to Buy
Right to Buy was one of the more politically popular policies of the Conservative
administrations of the 1980s and 1990s and it is understandable that, as part of a
package of measures to boost homeownership, the current administration would wish to
return to this topic after a period in which the policy appeared to have run out of steam.
However, with up to half of council housing in some areas having already been sold off,
there is much greater concern at present as to the implications of further sales of social
housing for local access to affordable housing. In evaluating the policy, then, we are
interested both in whether it has increased sales, and in whether the commitments to
one-for-one replacement and to allowing local authorities a greater role in replenishing
their social housing stock are likely to mitigate further pressures on the remaining social
housing.66
Data available to date suggest that the reinvigorated RTB policy has succeeded in
increasing sales of social housing. The government envisages that 20,000 additional RTB
sales will take place in England over the three-year period to 2015.67 There has indeed
been a marked upturn in sales, with Right to Buy sales increasing from an average of
3,600 between 2008–09 and 2011–12, to 8,400 in 2012–13. As is clear from Figure 5.13,
these remain below their levels in the mid-2000s, and well below the peaks in the 1980s
(though to some extent this might be expected given the smaller size and lower quality of
the remaining social housing stock).
It is not clear whether this increase in sales will be matched by sufficient new social
housing to maintain the current stock. The commitment to one-for-one replacement is
that, on a national basis, each property sold under the revamped Right to Buy will be
replaced by a property let at ‘affordable rent’. However, as a number of commentators
have noted, this commitment will not replace social housing on a like-for-like basis, and
may still lead to additional pressure on social housing.
One concern is that social housing will be replaced with properties let at a higher rent.
‘Affordable rent’ is a new category of social housing introduced by the current
government, which allows housing associations to charge rents up to 80% of market
rents. Affordable rents are typically much higher than so-called ‘social rents’: average
affordable rents in England in 2011–12 were 68% of market rents, while average social
rents were just 50% of market rents.68 If properties let at ‘social rents’ are replaced with
those at ‘affordable rents’, there will be a decline in the stock of social housing at the
lowest rents.
A second concern is that – because the commitment is to replace social housing one-for-
one at a national, as opposed to local, level – properties will be sold in desirable areas
where there may also be pressure on the social housing stock, and replaced in areas
where this will be cheaper but where the need is less pressing. Whether this happens will
depend, in large part, on the mechanism by which revenues from RTB are distributed to
66 For information on these commitments, see pages 8–10 of House of Commons Library, ‘Incentivising the
Right to Buy’, Standard Note SN/SP/6251, 2014, http://www.parliament.uk/business/publications/research/briefing-papers/SN06251/incentivising-the-right-to-buy.
67 House of Commons Library, ‘Incentivising the Right to Buy’, Standard Note SN/SP/6251, 2014,
http://www.parliament.uk/business/publications/research/briefing-papers/SN06251/incentivising-the-right-to-buy.
68 Table 4.C of DCLG, ‘Social housing lettings and sales in England, 2011/12: Continuous Recording (CORE)
data’, https://www.gov.uk/government/uploads/system/uploads/attachment_data/file/9362/2219871.xls.
The IFS Green Budget: February 2014
124
central or local government in order to build new ‘affordable’ properties. Following a
consultation, the proposal now being implemented by the government is that, if a local
authority can make the case that it requires and can implement a policy of replacing the
sale with an affordable property, it will enter into an agreement with the Department for
Communities and Local Government (DCLG) to do so; otherwise, the DCLG will retain the
receipts with the presumed intention to transfer them to a local authority in an area of
greater housing ‘need’. As the eventual outcome will depend on case-by-case
negotiations, it is too early to say whether the policy will generate the supply of social
housing where it is most needed.
5.5 Conclusion
The past year has seen strong growth in house prices and other measures of housing
market activity across the UK, following a period in which they fell further and faster than
any other time since the 1950s, before stabilising well below their previous peaks.
Rising house prices and increasing construction activity reflect, and to some extent are
driving, the wider economic recovery and, in this general sense, are welcome. However,
rising prices have raised concerns that the housing market, particularly in London, might
be in the early stages of a ‘bubble’ and therefore vulnerable to a downwards correction,
with potentially damaging economic consequences. In addition, even if rising prices
reflect a shift in economic ‘fundamentals’, there are concerns that if prices rise faster than
earnings, this will put homeownership beyond the reach of many.
The evidence for and against the existence of a house price bubble in the UK is
inconclusive. On the basis of the fairly simple historical comparisons that dominate much
of the debate – namely, how prices and other measures compare with their previous
peaks and with long-term trends – there is not, at least yet, clear evidence for a housing
bubble in the UK as a whole. Prices are about 9% below their 2007 peak in nominal terms
and 25% below in real terms, and about 17% below longer-term trends in both nominal
and real terms. London is at greatest risk of a housing bubble, in the sense that nominal
prices are just above their previous peak (though real prices remain 17% below).
Moreover, in contrast to the rest of the UK, London prices are rising significantly faster
than average earnings (and have moved above the level predicted by their long-run
trend), and purchasers are taking out larger loans relative to their incomes. On the other
hand, faster growth in London may also reflect special features of the London housing
market, including faster population growth, stronger economic performance (at least on
some measures), and demand from foreign investors. In any case, a more definitive
assessment of the sustainability of the UK and London housing markets is clearly needed
– one that goes beyond historical comparisons and is based on more sophisticated
modelling of supply and demand for housing.
The government has introduced a number of housing initiatives with overlapping
objectives. The Help to Buy scheme aims to make it possible for a wider range of
households to purchase a home, either directly via the provision of equity loans to
purchasers, or indirectly via the option of insurance for lenders of the high LTV
mortgages typically required by first-time buyers. In addition, the equity loan scheme is
specifically targeted at increasing the construction of new homes. A ‘revamped’ Right to
Buy policy has increased discounts on council homes, with the primary aim of increasing
sales.

Housing market trends and recent policies
125
It is too soon to evaluate these schemes in detail. The principal concern with respect to
the equity loan scheme is that it may not generate additional new construction. This is
because it is difficult, if not impossible, to distinguish applicants who would have bought
a new home without the scheme from those who would not. It is not clear there is much
more the government can do to mitigate this risk. The main concern with respect to the
mortgage guarantee scheme is that it will boost demand without inducing an increase in
supply, worsening the affordability problems it seeks to address. In the short term, the
scheme is likely to put an upwards pressure on prices. Whether supply will respond in
the medium term is far from clear. Targeting the policy on new homes might ameliorate
this concern. Both schemes could do more to improve affordability by targeting first-time
buyers and/or reducing the cap on property values (currently £600,000).
The government’s reforms to the Right to Buy policy for council tenants represent an
attempt to regenerate a policy that appeared to have run its course. The policy raises
discounts for buyers considerably, particularly in London where they had been tightened,
while introducing a mechanism by which (at least in principle) revenues from sales can
be returned to local authorities to build affordable housing. It is too early to say whether
these changes will better balance the twin goals of encouraging homeownership through
Right to Buy sales while managing pressures on social housing.