5 physiology renal and acid–base - shandong...
TRANSCRIPT

144 Board Review Series: Physiology
Renal and Acid–BasePhysiology5c h a p t e r
I. BODY FLUIDS
■ Total body water (TBW) is approximately 60% of body weight.
■ The percentage of TBW is highest in newborns and adult males and lowest in adult females andin adults with a large amount of adipose tissue.
A. Distribution of water (Figure 5-1 and Table 5-1)
1. Intracellular fluid (ICF)
■ is two-thirds of TBW.
■ The major cations of ICF are K+ and Mg2+.■ The major anions of ICF are protein and organic phosphates [adenosine triphosphate
(ATP), adenosine diphosphate (ADP), and adenosine monophosphate (AMP)].
2. Extracellular fluid (ECF)
■ is one-third of TBW.■ is composed of interstitial fluid and plasma.■ The major cation of ECF is Na+.■ The major anions of ECF are Cl– and HCO3
–.
a. Plasma is one-fourth of the ECF. Thus, it is one-twelfth of TBW (1/4 × 1/3).
■ The major plasma proteins are albumin and globulins.
b. Interstitial fluid is three-fourths of the ECF. Thus, it is one-fourth of TBW (3/4 × 1/3).
■ The composition of interstitial fluid is the same as that of plasma except that it haslittle protein. Thus, interstitial fluid is an ultrafiltrate of plasma.
3. 60-40-20 rule
■ TBW is 60% of body weight.■ ICF is 40% of body weight.■ ECF is 20% of body weight.
B. Measuring the volumes of the fluid compartments (see Table 5-1)
1. Dilution methoda. A known amount of a substance is given whose volume of distribution is the body fluid
compartment of interest.
■ For example:
(1) Tritiated water is a marker for TBW that distributes wherever water is found.(2) Mannitol is a marker for ECF because it is a large molecule that cannot cross cell
membranes and is therefore excluded from the ICF.
144
98761_Ch05_Chapter 05 5/7/10 6:26 PM Page 144

(3) Evans blue is a marker for plasma volume because it is a dye that binds to serumalbumin and is therefore confined to the plasma compartment.
b. The substance is allowed to equilibrate.c. The concentration of the substance is measured in plasma, and the volume of distribu-
tion is calculated as follows:
where:Volume = volume of distribution, or volume of the body
fluid compartment (L)Amount = amount of substance present (mg)
Concentration = concentration in plasma (mg/L)
d. Sample calculation
■ A patient is injected with 500 mg of mannitol. After a 2-hour equilibration period, theconcentration of mannitol in plasma is 3.2 mg/100 mL. During the equilibration peri-od, 10% of the injected mannitol is excreted in urine. What is the patient’s ECF volume?
VolumeAmount
Concentration�
VolumeAmount
ConcentrationAmount injected A
=
= − mmount excretedConcentration
mg mgmg
= −500 503 2. 1100
14 1mL
L= .
Chapter 5 Renal and Acid–Base Physiology 145
Intracellular Extracellular
Plasma Interstitial
Total body water
FIGURE 5-1 Body fluid compartments.
5-1t a b l e
Markers Used to Body Fluid Compartment Fraction of TBW* Measure Volume Major Cations Major Anions
TBW 1.0 Tritiated H2OD2OAntipyrene
ECF 1/3 Sulfate Na+ Cl−
Inulin HCO3−
Mannitol
Plasma 1/12 (1/4 of ECF) RISA Na+ Cl−
Evans blue HCO3−
Plasma protein
Interstitial 1/4 (3/4 of ECF) ECF–plasma Na+ Cl−
volume (indirect) HCO3−
ICF 2/3 TBW–ECF (indirect) K+ Organic phosphatesProtein
*Total body water (TBW) is approximately 60% of total body weight, or 42 L in a 70-kg man. ECF = extracellular fluid; ICF = intracellular fluid; RISA =radioiodinated serum albumin.
Body Water and Body Fluid Compartments
98761_Ch05_Chapter 05 5/7/10 6:26 PM Page 145

2. Substances used for major fluid compartments (see Table 5-1)a. TBW
■ Tritiated water, D2O, and antipyrene
b. ECF
■ Sulfate, inulin, and mannitol
c. Plasma
■ Radioiodinated serum albumin (RISA) and Evans blue
d. Interstitial
■ Measured indirectly (ECF volume–plasma volume)
e. ICF
■ Measured indirectly (TBW–ECF volume)
C. Shifts of water between compartments
1. Basic principlesa. At steady state, ECF osmolarity and ICF osmolarity are equal.b. To achieve this equality, water shifts between the ECF and ICF compartments.c. It is assumed that solutes such as NaCl and mannitol do not cross cell membranes and
are confined to ECF.2. Examples of shifts of water between compartments (Figure 5-2 and Table 5-2)
a. Infusion of isotonic NaCl—addition of isotonic fluid
■ is also called isosmotic volume expansion.
146 Board Review Series: Physiology
Diarrhea
Liters
Lost in desert
Liters
Adrenal insufficiency
Liters
Volume expansion
Volume contraction
Infusion ofisotonic NaCl
Liters
ExcessiveNaCl intake
Liters
SIADH
Liters
Osm
olar
ityO
smol
arity
ECFICF ECFICF ECFICF
ECFICF ECFICF ECFICF
FIGURE 5-2 Shifts of water between body fluid compartments. Volume and osmolarity of normal extracellular fluid (ECF)and intracellular fluid (ICF) are indicated by the solid lines. Changes in volume and osmolarity in response to various sit-uations are indicated by the dashed lines. SIADH = syndrome of inappropriate antidiuretic hormone.
98761_Ch05_Chapter 05 5/7/10 6:26 PM Page 146

(1) ECF volume increases, but no change occurs in the osmolarity of ECF or ICF.Because osmolarity is unchanged, water does not shift between the ECF and ICFcompartments.
(2) Plasma protein concentration and hematocrit decrease because the addition offluid to the ECF dilutes the protein and red blood cells (RBCs). Because ECFosmolarity is unchanged, the RBCs will not shrink or swell.
(3) Arterial blood pressure increases because ECF volume increases.b. Diarrhea—loss of isotonic fluid
■ is also called isosmotic volume contraction.
(1) ECF volume decreases, but no change occurs in the osmolarity of ECF or ICF.Because osmolarity is unchanged, water does not shift between the ECF and ICFcompartments.
(2) Plasma protein concentration and hematocrit increase because the loss of ECFconcentrates the protein and RBCs. Because ECF osmolarity is unchanged, theRBCs will not shrink or swell.
(3) Arterial blood pressure decreases because ECF volume decreases.c. Excessive NaCl intake—addition of NaCl
■ is also called hyperosmotic volume expansion.
(1) The osmolarity of ECF increases because osmoles (NaCl) have been added to the ECF.(2) Water shifts from ICF to ECF. As a result of this shift, ICF osmolarity increases until
it equals that of ECF.(3) As a result of the shift of water out of the cells, ECF volume increases (volume
expansion) and ICF volume decreases.(4) Plasma protein concentration and hematocrit decrease because of the increase in
ECF volume.d. Sweating in a desert—loss of water
■ is also called hyperosmotic volume contraction.
(1) The osmolarity of ECF increases because sweat is hyposmotic (relatively morewater than salt is lost).
(2) ECF volume decreases because of the loss of volume in the sweat. Water shifts outof ICF; as a result of the shift, ICF osmolarity increases until it is equal to ECFosmolarity, and ICF volume decreases.
Chapter 5 Renal and Acid–Base Physiology 147
5-2t a b l e
Hct and Type Key Examples ECF Volume ICF Volume ECF Osmolarity Serum [Na+]
Isosmotic volume Isotonic NaCl ↑ No change No change ↓ Hctexpansion infusion −[Na+]
Isosmotic volume Diarrhea ↓ No change No change ↑ Hctcontraction −[Na+]
Hyperosmotic volume High NaCl intake ↑ ↓ ↑ ↓ Hctexpansion ↑ [Na+]
Hyperosmotic volume Sweating ↓ ↓ ↑ −Hctcontraction Fever ↑ [Na+]
Diabetes insipidus
Hyposmotic volume SIADH ↑ ↑ ↓ −Hctexpansion ↓[Na+]
Hyposmotic volume Adrenal insufficiency ↓ ↑ ↓ ↑ Hctcontraction ↓[Na+]
− = no change; ECF = extracellular fluid; Hct = hematocrit; ICF = intracellular fluid; SIADH = syndrome of inappropriate antidiuretic hormone.
Changes in Volume and Osmolarity of Body Fluids
98761_Ch05_Chapter 05 5/7/10 6:26 PM Page 147

(3) Plasma protein concentration increases because of the decrease in ECF volume.Although hematocrit might also be expected to increase, it remains unchangedbecause water shifts out of the RBCs, decreasing their volume and offsetting theconcentrating effect of the decreased ECF volume.
e. Syndrome of inappropriate antidiuretic hormone (SIADH)—gain of water
■ is also called hyposmotic volume expansion.
(1) The osmolarity of ECF decreases because excess water is retained.(2) ECF volume increases because of the water retention. Water shifts into the cells; as
a result of this shift, ICF osmolarity decreases until it equals ECF osmolarity, andICF volume increases.
(3) Plasma protein concentration decreases because of the increase in ECF volume.Although hematocrit might also be expected to decrease, it remains unchangedbecause water shifts into the RBCs, increasing their volume and offsetting thediluting effect of the gain of ECF volume.
f. Adrenocortical insufficiency—loss of NaCl
■ is also called hyposmotic volume contraction.
(1) The osmolarity of ECF decreases. As a result of the lack of aldosterone in adreno-cortical insufficiency, there is decreased NaCl reabsorption, and the kidneysexcrete more NaCl than water.
(2) ECF volume decreases. Water shifts into the cells; as a result of this shift, ICF osmo-larity decreases until it equals ECF osmolarity, and ICF volume increases.
(3) Plasma protein concentration increases because of the decrease in ECF volume.Hematocrit increases because of the decreased ECF volume and because the RBCsswell as a result of water entry.
(4) Arterial blood pressure decreases because of the decrease in ECF volume.
II. RENAL CLEARANCE, RENAL BLOOD FLOW (RBF),AND GLOMERULAR FILTRATION RATE (GFR)
A. Clearance equation
■ indicates the volume of plasma cleared of a substance per unit time.■ The units of clearance are mL/min and mL/24 hr.
where:C = clearance (mL/min or mL/24 hr)U = urine concentration (mg/mL)V = urine volume/time (mL/min)P = plasma concentration (mg/mL)
■ Example: If the plasma [Na+] is 140 mEq/L, the urine [Na+] is 700 mEq/L, and the urineflow rate is 1 mL/min, what is the clearance of Na+?
CUVP
�
CU V
P
mEq L mLmE
NaNa
Na
+
+
+
=⎡⎣ ⎤⎦ ×
⎡⎣ ⎤⎦
=×700 1
140min
qq LmL= 5 min
148 Board Review Series: Physiology
98761_Ch05_Chapter 05 5/7/10 6:26 PM Page 148
B. RBF
■ is 25% of the cardiac output.
■ is directly proportional to the pressure difference between the renal artery and the renalvein, and is inversely proportional to the resistance of the renal vasculature.
■ Vasoconstriction of renal arterioles, which leads to a decrease in RBF, is produced by acti-vation of the sympathetic nervous system and angiotensin II. At low concentrations,angiotensin II preferentially constricts efferent arterioles, thereby “protecting” (increasing)the GFR. Angiotensin-converting enzyme (ACE) inhibitors dilate efferent arterioles and pro-duce a decrease in GFR; these drugs reduce hyperfiltration and the occurrence of diabet-ic nephropathy in diabetes mellitus.
■ Vasodilation of renal arterioles, which leads to an increase in RBF, is produced byprostaglandins E2 and I2, bradykinin, nitric oxide, and dopamine.
1. Autoregulation of RBF
■ is accomplished by changing renal vascular resistance. If arterial pressure changes,a proportional change occurs in renal vascular resistance to maintain a constantRBF.
■ RBF remains constant over the range of arterial pressures from 80 to 200 mm Hg(autoregulation).
■ The mechanisms for autoregulation include:
a. Myogenic mechanism, in which the renal afferent arterioles contract in response tostretch. Thus, increased renal arterial pressure stretches the arterioles, which contractand increase resistance to maintain constant blood flow.
b. Tubuloglomerular feedback, in which increased renal arterial pressure leads toincreased delivery of fluid to the macula densa. The macula densa senses the increasedload and causes constriction of the nearby afferent arteriole, increasing resistance tomaintain constant blood flow.
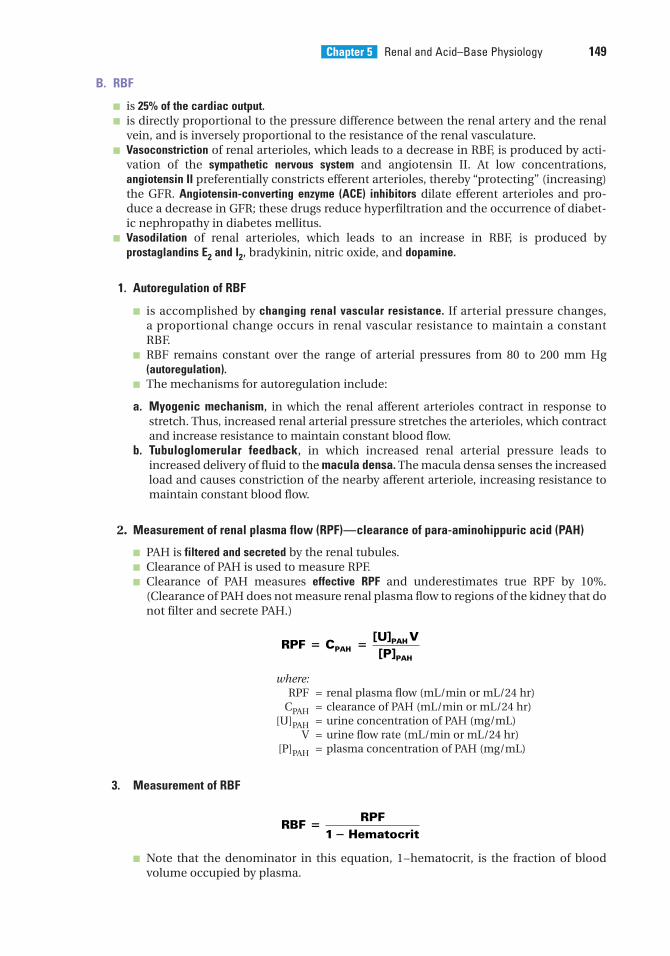
2. Measurement of renal plasma flow (RPF)—clearance of para-aminohippuric acid (PAH)
■ PAH is filtered and secreted by the renal tubules.■ Clearance of PAH is used to measure RPF.■ Clearance of PAH measures effective RPF and underestimates true RPF by 10%.
(Clearance of PAH does not measure renal plasma flow to regions of the kidney that donot filter and secrete PAH.)
where:RPF = renal plasma flow (mL/min or mL/24 hr)
CPAH = clearance of PAH (mL/min or mL/24 hr)[U]PAH = urine concentration of PAH (mg/mL)
V = urine flow rate (mL/min or mL/24 hr)[P]PAH = plasma concentration of PAH (mg/mL)
3. Measurement of RBF
■ Note that the denominator in this equation, 1–hematocrit, is the fraction of blood volume occupied by plasma.
RBFRPF
Hematocrit�
�1
RPF CU VPPAH
PAH
PAH
� �[ ][ ]
Chapter 5 Renal and Acid–Base Physiology 149
98761_Ch05_Chapter 05 5/7/10 6:26 PM Page 149

C. GFR
1. Measurement of GFR—clearance of inulin
■ Inulin is filtered, but not reabsorbed or secreted by the renal tubules.■ The clearance of inulin is used to measure GFR, as shown in the following equation:
where:GFR = glomerular filtration rate (mL/min or mL/24 hr)[U]inulin = urine concentration of inulin (mg/mL)V = urine flow rate (mL/min or mL/24 hr)[P]inulin = plasma concentration of inulin (mg/mL)
■ Example of calculation of GFR: Inulin is infused in a patient to achieve a steady-stateplasma concentration of 1 mg/mL. A urine sample collected during 1 hour has a vol-ume of 60 mL and an inulin concentration of 120 mg/mL. What is the patient’s GFR?
2. Estimates of GFR with blood urea nitrogen (BUN) and serum [creatinine]
■ Both BUN and serum [creatinine] increase when GFR decreases.■ In prerenal azotemia (hypovolemia), BUN increases more than serum creatinine and
there is an increased BUN/creatinine ratio (>20:1).■ GFR decreases with age, although serum [creatinine] remains constant because of
decreased muscle mass.
3. Filtration fraction
■ is the fraction of RPF filtered across the glomerular capillaries, as shown in the follow-ing equation:
■ is normally about 0.20. Thus, 20% of the RPF is filtered. The remaining 80% leaves theglomerular capillaries by the efferent arterioles and becomes the peritubular capillarycirculation.
■ Increases in the filtration fraction produce increases in the protein concentration of per-itubular capillary blood, which leads to increased reabsorption in the proximal tubule.
■ Decreases in the filtration fraction produce decreases in the protein concentration of peritubular capillary blood and decreased reabsorption in the proximal tubule.
4. Determining GFR–Starling forces (Figure 5-3)
■ The driving force for glomerular filtration is the net ultrafiltration pressure across theglomerular capillaries.
■ Filtration is always favored in glomerular capillaries because the net ultrafiltration pres-sure always favors the movement of fluid out of the capillary.
GFRU V
P
mg mL mL hr
inulin
inulin
=⎡⎣ ⎤⎦⎡⎣ ⎤⎦
= ×120 601mmg mL
mg mL mLmg mL
mL
= ×
=
120 11
120
min
min
Filtration fractionGFRRPF
�
GFRU VP
inulin
inulin
�[ ][ ]
150 Board Review Series: Physiology
98761_Ch05_Chapter 05 5/7/10 6:26 PM Page 150

■ GFR can be expressed by the Starling equation:
a. GFR is filtration across the glomerular capillaries.b. Kf is the filtration coefficient of the glomerular capillaries.
■ The glomerular barrier consists of the capillary endothelium, basement mem-brane, and filtration slits of the podocytes.
■ Normally, anionic glycoproteins line the filtration barrier and restrict the filtration ofplasma proteins, which are also negatively charged.
■ In glomerular disease, the anionic charges on the barrier may be removed, resultingin proteinuria.
c. PGC is glomerular capillary hydrostatic pressure, which is constant along the length ofthe capillary.
■ It is increased by dilation of the afferent arteriole or constriction of the efferent arteriole.
Increases in PGC cause increases in net ultrafiltration pressure and GFR.
d. PBS is Bowman’s space hydrostatic pressure and is analogous to Pi in systemic capillaries.
■ It is increased by constriction of the ureters. Increases in PBS cause decreases in netultrafiltration pressure and GFR.
e. πGC is glomerular capillary oncotic pressure. It normally increases along the length of theglomerular capillary because filtration of water increases the protein concentration ofglomerular capillary blood.
■ It is increased by increases in protein concentration. Increases in πGC cause decreasesin net ultrafiltration pressure and GFR.
f. πBS is Bowman’s space oncotic pressure. It is usually zero, and therefore ignored,because only a small amount of protein is normally filtered.
5. Sample calculation of ultrafiltration pressure with the Starling equation
■ At the afferent arteriolar end of a glomerular capillary, PGC is 45 mm Hg, PBS is 10 mm Hg,and πGC is 27 mm Hg. What are the value and direction of the net ultrafiltration pressure?
6. Changes in Starling forces—effect on GFR and filtration fraction (Table 5-3)
GFR K P Pf GC BS GC BS= −( ) − −( )⎡⎣ ⎤⎦π π
Net pressure P P
Net pressure mmHgGC BS GC= −( ) −
=π
45 −−( ) −= + (
10 27
8
mmHg mmHg
mmHg favoring filtration))
Chapter 5 Renal and Acid–Base Physiology 151
arteriole arteriole
Glomerularcapillary
Afferent Efferent
Bowman's space
PBS
PGC πGC
Proximaltubule
FIGURE 5-3 Starling forces across the glomerular capillar-ies. Heavy arrows indicate the driving forces across theglomerular capillary wall. PBS = hydrostatic pressure inBowman’s space; PGC = hydrostatic pressure in theglomerular capillary; πGC = colloidosmotic pressure in theglomerular capillary.
98761_Ch05_Chapter 05 5/7/10 6:26 PM Page 151

152 Board Review Series: Physiology
5-3t a b l e
Effect on GFR Effect on RPF Effect on Filtration Fraction
Constriction of afferent ↓ ↓ No changearteriole (e.g., sympathetic) (caused by ↓ PGC)
Constriction of efferent ↑ ↓ ↑arteriole (e.g., (caused by ↑ PGC) (↑ GFR/↓ RPF)angiotensin II)
Increased plasma [protein] ↓ No change ↓(caused by ↑ πGC) (↓ GFR/unchanged RPF)
Ureteral stone ↓ No change ↓(caused by ↑ PBS) (↓ GFR/unchanged RPF)
GFR = glomerular filtration rate; RPF = renal plasma flow.
Effect of Changes in Starling Forces on GFR, RPF, and
Filtration Fraction
Glomerularcapillary
Afferent Efferent arteriole
Filtered load
Bowman's space
PeritubularcapillaryExcretion
Reabsorption
Secretion
FIGURE 5-4 Processes of filtration, reabsorption, andsecretion. The sum of the three processes is excretion.
III. REABSORPTION AND SECRETION (FIGURE 5-4)
A. Calculation of reabsorption and secretion rates
■ The reabsorption or secretion rate is the difference between the amount filtered acrossthe glomerular capillaries and the amount excreted in urine. It is calculated with the following equations:
■ If the filtered load is greater than the excretion rate, then net reabsorption of the sub-stance has occurred. If the filtered load is less than the excretion rate, then net secre-
tion of the substance has occurred.
Filtered load GFR plasmaExcretionrate V u
= ×= ×
[ ][ rrine
absorptionrate Filtered load Excreti]
Re = − oonrateSecretionrate Excretionrate Filtered= − load
98761_Ch05_Chapter 05 5/7/10 6:26 PM Page 152

■ Example: A woman with untreated diabetes mellitus has a GFR of 120 mL/min, a plasma glucose concentration of 400 mg/dL, a urine glucose concentrationof 2500 mg/dL, and a urine flow rate of 4 mL/min. What is the reabsorption rate of glucose?
B. Transport maximum (Tm) curve for glucose—a reabsorbed substance (Figure 5-5)
1. Filtered load of glucose
■ increases in direct proportion to the plasma glucose concentration (filtered load ofglucose = GFR × [P]glucose).
2. Reabsorption of glucosea. Na+–glucose cotransport in the proximal tubule reabsorbs glucose from tubular fluid
into the blood. There are a limited number of Na+–glucose carriers.b. At plasma glucose concentrations less than 250 mg/dL, all of the filtered glucose can
be reabsorbed because plenty of carriers are available; in this range, the line for reab-sorption is the same as that for filtration.
c. At plasma glucose concentrations greater than 350 mg/dL, the carriers are saturated.Therefore, increases in plasma concentration above 350 mg/dL do not result in increasedrates of reabsorption. The reabsorptive rate at which the carriers are saturated is the Tm.
3. Excretion of glucosea. At plasma concentrations less than 250 mg/dL, all of the filtered glucose is reabsorbed
and excretion is zero. Threshold (defined as the plasma concentration at which glucosefirst appears in the urine) is approximately 250 mg/dL.
b. At plasma concentrations greater than 350 mg/dL, reabsorption is saturated (Tm).Therefore, as the plasma concentration increases, the additional filtered glucose can-not be reabsorbed and is excreted in the urine.
Filtered load GFR PlasmamL
= ×= ×
[ ]min
glucose120 4000480
mg dLmg
Excretion V Urine== ×=
min[ ]glucose
44 2500100480
mL mg dLmg
absorption mg
minmin
Re
×== mmin min
min−
=100
380mg
mg
Chapter 5 Renal and Acid–Base Physiology 153
Glu
cose
filtr
atio
n,ex
cret
ion,
rea
bsor
ptio
n (m
g/m
in)
Plasma [glucose] (mg/dL)
2000 400 600 800
Filte
red
Reabsorbed
Excre
ted
Threshold
Tm
FIGURE 5-5 Glucose titration curve. Glucose filtra-tion, excretion, and reabsorption are shown as afunction of plasma [glucose]. Shaded area indi-cates the “splay.” Tm = transport maximum.
98761_Ch05_Chapter 05 5/7/10 6:26 PM Page 153
4. Splay
■ is the region of the glucose curves between threshold and Tm.
■ occurs between plasma glucose concentrations of approximately 250 and 350 mg/dL.■ represents the excretion of glucose in urine before saturation of reabsorption (Tm) is
fully achieved.■ is explained by the heterogeneity of nephrons and the relatively low affinity of the
Na+−glucose carriers.
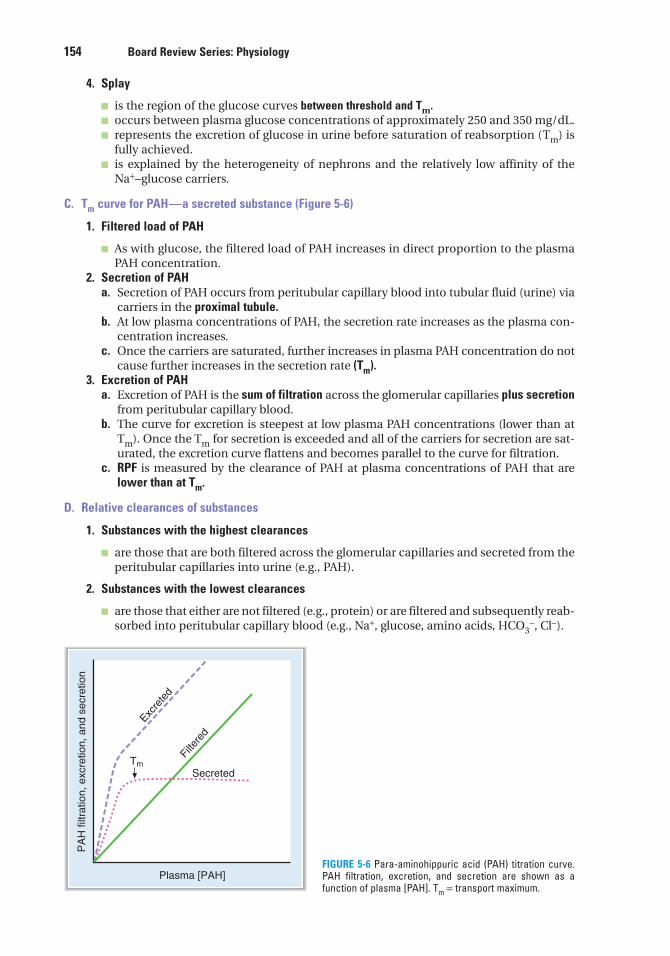
C. Tm curve for PAH—a secreted substance (Figure 5-6)
1. Filtered load of PAH
■ As with glucose, the filtered load of PAH increases in direct proportion to the plasmaPAH concentration.
2. Secretion of PAHa. Secretion of PAH occurs from peritubular capillary blood into tubular fluid (urine) via
carriers in the proximal tubule.b. At low plasma concentrations of PAH, the secretion rate increases as the plasma con-
centration increases.c. Once the carriers are saturated, further increases in plasma PAH concentration do not
cause further increases in the secretion rate (Tm).3. Excretion of PAH
a. Excretion of PAH is the sum of filtration across the glomerular capillaries plus secretionfrom peritubular capillary blood.
b. The curve for excretion is steepest at low plasma PAH concentrations (lower than atTm). Once the Tm for secretion is exceeded and all of the carriers for secretion are sat-urated, the excretion curve flattens and becomes parallel to the curve for filtration.
c. RPF is measured by the clearance of PAH at plasma concentrations of PAH that arelower than at Tm.
D. Relative clearances of substances
1. Substances with the highest clearances
■ are those that are both filtered across the glomerular capillaries and secreted from theperitubular capillaries into urine (e.g., PAH).
2. Substances with the lowest clearances
■ are those that either are not filtered (e.g., protein) or are filtered and subsequently reab-sorbed into peritubular capillary blood (e.g., Na+, glucose, amino acids, HCO3
−, Cl−).
154 Board Review Series: Physiology
PA
H fi
ltrat
ion,
exc
retio
n, a
nd s
ecre
tion
Filte
red
Secreted
Excre
ted
Plasma [PAH]
Tm
FIGURE 5-6 Para-aminohippuric acid (PAH) titration curve.PAH filtration, excretion, and secretion are shown as afunction of plasma [PAH]. Tm = transport maximum.
98761_Ch05_Chapter 05 5/7/10 6:26 PM Page 154

3. Substances with clearances equal to GFR
■ are glomerular markers.
■ are those that are freely filtered, but not reabsorbed or secreted (e.g., inulin).
4. Relative clearances
■ PAH > K+ (high-K+ diet) > inulin > urea > Na+ > glucose, amino acids, and HCO3−.
E. Nonionic diffusion
1. Weak acids
■ have an HA form and an A− form.■ The HA form, which is uncharged and lipid-soluble, can “back-diffuse” from urine to
blood.■ The A– form, which is charged and not lipid-soluble, cannot back-diffuse.■ At acidic urine pH, the HA form predominates, there is more back-diffusion, and there
is decreased excretion of the weak acid.■ At alkaline urine pH, the A– form predominates, there is less back-diffusion, and there is
increased excretion of the weak acid. For example, the excretion of salicylic acid can beincreased by alkalinizing the urine.
2. Weak bases
■ have a BH+ form and a B form.■ The B form, which is uncharged and lipid-soluble, can “back-diffuse” from urine to blood.■ The BH+ form, which is charged and not lipid-soluble, cannot back-diffuse.■ At acidic urine pH, the BH+ form predominates, there is less back-diffusion, and there
is increased excretion of the weak base.■ At alkaline urine pH, the B form predominates, there is more back-diffusion, and there
is decreased excretion of the weak base.
IV. NaCl REGULATION
A. Single nephron terminology
■ Tubular fluid (TF) is urine at any point along the nephron.■ Plasma (P) is systemic plasma. It is considered to be constant.
1. TF/Px ratio
■ compares the concentration of a substance in tubular fluid at any point along thenephron with the concentration in plasma.
a. If TF/P = 1.0, then either there has been no reabsorption of the substance or reabsorp-tion of the substance has been exactly proportional to the reabsorption of water.
■ For example, if TF/PNa+ = 1.0, the [Na+] in tubular fluid is identical to the [Na+] inplasma.
■ For any freely filtered substance, TF/P = 1.0 in Bowman’s space (before any reab-sorption or secretion has taken place to modify the tubular fluid).
b. If TF/P < 1.0, then reabsorption of the substance has been greater than the reabsorptionof water and the concentration in tubular fluid is less than that in plasma.
■ For example, if TF/PNa+ = 0.8, then the [Na+] in tubular fluid is 80% of the [Na+] inplasma.
c. If TF/P > 1.0, then either reabsorption of the substance has been less than the reabsorp-tion of water or there has been secretion of the substance.
Chapter 5 Renal and Acid–Base Physiology 155
98761_Ch05_Chapter 05 5/7/10 6:26 PM Page 155

2. TF/Pinulin
■ is used as a marker for water reabsorption along the nephron.■ increases as water is reabsorbed.■ Because inulin is freely filtered, but not reabsorbed or secreted, its concentration in
tubular fluid is determined solely by how much water remains in the tubular fluid.■ The following equation shows how to calculate the fraction of the filtered water that has
been reabsorbed:
■ For example, if 50% of the filtered water has been reabsorbed, the TF/Pinulin = 2.0. Foranother example, if TF/Pinulin = 3.0, then 67% of the filtered water has been reabsorbed(i.e., 1−1/3).
3. [TF/P]x /[TF/P]inulin ratio
■ corrects the TF/Px ratio for water reabsorption. This double ratio gives the fraction of
the filtered load remaining at any point along the nephron.
■ For example, if [TF/P]K+/[TF/P]inulin = 0.3 at the end of the proximal tubule, then 30% ofthe filtered K+ remains in the tubular fluid and 70% has been reabsorbed into the blood.
B. General information about Na+ reabsorption
■ Na+ is freely filtered across the glomerular capillaries; therefore, the [Na+] in the tubularfluid of Bowman’s space equals that in plasma (i.e., TF/PNa+ = 1.0).
■ Na+ is reabsorbed along the entire nephron, and very little is excreted in urine (<1% of thefiltered load).
C. Na+ reabsorption along the nephron (Figure 5-7)
1. Proximal tubule
■ reabsorbs two-thirds, or 67%, of the filtered Na+ and H2O, more than any other part of thenephron.
■ is the site of glomerulotubular balance.
Fraction of filteredH OreabsorbedTF P
i2 1
1= −⎡⎣ ⎤⎦ nnulin
156 Board Review Series: Physiology
Collectingduct
Distalconvolutedtubule
Proximalconvolutedtubule
Thickascendinglimb
Thinascendinglimb
Thindescendinglimb
Excretion < 1%
3%
5%67%
25%
FIGURE 5-7 Na+ handling along the nephron.Arrows indicate reabsorption of Na+. Numbersindicate the percentage of the filtered load ofNa+ that is reabsorbed or excreted.
98761_Ch05_Chapter 05 5/7/10 6:26 PM Page 156

■ The process is isosmotic. The reabsorption of Na+ and H2O in the proximal tubule isexactly proportional. Therefore, both TF/PNa+ and TF/Posm = 1.0.
a. Early proximal tubule—special features (Figure 5-8)
■ reabsorbs Na+ and H2O with HCO3−, glucose, amino acids, phosphate, and lactate.
■ Na+ is reabsorbed by cotransport with glucose, amino acids, phosphate, and lactate.These cotransport processes account for the reabsorption of all of the filtered glu-cose and amino acids.
■ Na+ is also reabsorbed by countertransport via Na+–H+ exchange, which is linkeddirectly to the reabsorption of filtered HCO3
−.■ Carbonic anhydrase inhibitors (e.g., acetazolamide) are diuretics that act in the early
proximal tubule by inhibiting the reabsorption of filtered HCO3−.
b. Late proximal tubule—special features
■ Filtered glucose, amino acids, and HCO3− have already been completely removed
from the tubular fluid by reabsorption in the early proximal tubule.■ In the late proximal tubule, Na+ is reabsorbed with Cl–.
c. Glomerulotubular balance in the proximal tubule
■ maintains constant fractional reabsorption (two-thirds, or 67%) of the filtered Na+ andH2O.
(1) For example, if GFR spontaneously increases, the filtered load of Na+ also increases.Without a change in reabsorption, this increase in GFR would lead to increasedNa+ excretion. However, glomerulotubular balance functions such that Na+ reab-sorption also will increase, ensuring that a constant fraction is reabsorbed.
(2) The mechanism of glomerulotubular balance is based on Starling forces in theperitubular capillaries, which alter the reabsorption of Na+ and H2O in the proxi-mal tubule (Figure 5-9).
■ The route of isosmotic fluid reabsorption is from the lumen, to the proximaltubule cell, to the lateral intercellular space, and then to the peritubular capillary blood.
■ Starling forces in the peritubular capillary blood govern how much of this isosmoticfluid will be reabsorbed.
■ Fluid reabsorption is increased by increases in πc of the peritubular capillaryblood and decreased by decreases in πc.
■ Increases in GFR and filtration fraction cause the protein concentration and πcof peritubular capillary blood to increase. This increase, in turn, produces anincrease in fluid reabsorption. Thus, there is matching of filtration and reab-sorption, or glomerulotubular balance.
Chapter 5 Renal and Acid–Base Physiology 157
Cell of the early proximal tubuleLumenPeritubular
capillary blood
Na+
Na+
H+
Glucose, amino acid,phosphate, lactate Na+
K+
FIGURE 5-8 Mechanisms of Na+ reabsorp-tion in the cells of the early proximal tubule.
98761_Ch05_Chapter 05 5/7/10 6:26 PM Page 157

d. Effects of ECF volume on proximal tubular reabsorption(1) ECF volume contraction increases reabsorption. Volume contraction increases
peritubular capillary protein concentration and πc, and decreases peritubularcapillary Pc. Together, these changes in Starling forces in peritubular capillaryblood cause an increase in proximal tubular reabsorption.
(2) ECF volume expansion decreases reabsorption. Volume expansion decreases per-itubular capillary protein concentration and πc, and increases Pc. Together, thesechanges in Starling forces in peritubular capillary blood cause a decrease in prox-imal tubular reabsorption.
2. Thick ascending limb of the loop of Henle (Figure 5-10)
■ reabsorbs 25% of the filtered Na+.
■ contains a Na+–K+–2Cl– cotransporter in the luminal membrane.■ is the site of action of the loop diuretics (furosemide, ethacrynic acid, bumetanide),
which inhibit the Na+−K+−2Cl− cotransporter.■ is impermeable to water. Thus, NaCl is reabsorbed without water. As a result, tubular fluid
[Na+] and tubular fluid osmolarity decrease to less than their concentrations in plasma(i.e., TF/PNa+ and TF/Posm < 1.0). This segment, therefore, is called the diluting segment.
■ has a lumen-positive potential difference. Although the Na+−K+−2Cl− cotransporterappears to be electroneutral, some K+ diffuses back into the lumen, making the lumenelectrically positive.
3. Distal tubule and collecting duct
■ together reabsorb 8% of the filtered Na+.
a. Early distal tubule—special features
■ reabsorbs NaCl by a Na+-Cl- cotransporter.
■ is the site of action of thiazide diuretics.
158 Board Review Series: Physiology
Cell of the thick ascending limbLumenPeritubular
capillary blood
Na+
K+Cl–
K+
2Cl–FurosemideNa+
K+
FIGURE 5-10 Mechanism of ion transport in the thick ascending limb of the loop of Henle.
Cells of theproximal tubule
Peritubularcapillary bloodLumen
πc
Pc
FIGURE 5-9 Mechanism of isosmotic reabsorption in theproximal tubule. The dashed arrow shows the pathway.Increases in πc and decreases in Pc cause increasedrates of isosmotic reabsorption.
98761_Ch05_Chapter 05 5/7/10 6:26 PM Page 158

■ is impermeable to water, as is the thick ascending limb. Thus, reabsorption of NaCloccurs without water, which further dilutes the tubular fluid.
■ is called the cortical diluting segment.
b. Late distal tubule and collecting duct—special features
■ have two cell types.
(1) Principal cells
■ reabsorb Na+ and H2O.
■ secrete K+.
■ Aldosterone increases Na+ reabsorption and increases K+ secretion. Like othersteroid hormones, the action of aldosterone takes several hours to developbecause new protein synthesis of Na+ channels (ENaC) is required. About 2% ofoverall Na+ reabsorption is affected by aldosterone.
■ Antidiuretic hormone (ADH) increases H2O permeability by directing the insertion ofH2O channels in the luminal membrane. In the absence of ADH, the principalcells are virtually impermeable to water.
■ K+-sparing diuretics (spironolactone, triamterene, amiloride) decrease K+ secretion.
(2) α-Intercalated cells
■ secrete H+ by an H+-adenosine triphosphatase (ATPase), which is stimulated byaldosterone.
■ reabsorb K+ by an H+,K+-ATPase.
V. K+ REGULATION
A. Shifts of K+ between the ICF and ECF (Figure 5-11 and Table 5-4)
■ Most of the body’s K+ is located in the ICF.■ A shift of K+ out of cells causes hyperkalemia.
■ A shift of K+ into cells causes hypokalemia.
B. Renal regulation of K+ balance (Figure 5-12)
■ K+ is filtered, reabsorbed, and secreted by the nephron.■ K+ balance is achieved when urinary excretion of K+ exactly equals intake of K+ in the diet.
■ K+ excretion can vary widely from 1% to 110% of the filtered load, depending ondietary K+ intake, aldosterone levels, and acid–base status.
1. Glomerular capillaries
■ Filtration occurs freely across the glomerular capillaries. Therefore, TF/PK+ inBowman’s space is 1.0.
2. Proximal tubule
■ reabsorbs 67% of the filtered K+ along with Na+ and H2O.
Chapter 5 Renal and Acid–Base Physiology 159
H+ K+
ICF ECF
K+ shift out
Hyperosmolarity
Exercise
Cell lysis
K+ shift inInsulinβ-agonists
FIGURE 5-11 Internal K+ balance. ECF = extracellular fluid; ICF = intracellular fluid.
98761_Ch05_Chapter 05 5/7/10 6:26 PM Page 159

3. Thick ascending limb of the loop of Henle
■ reabsorbs 20% of the filtered K+.■ Reabsorption involves the Na+–K+–2Cl– cotransporter in the luminal membrane of cells
in the thick ascending limb (see Figure 5-10).
4. Distal tubule and collecting duct
■ either reabsorb or secrete K+, depending on dietary K+ intake.
a. Reabsorption of K+
■ involves an H+,K+-ATPase in the luminal membrane of the α-intercalated cells.■ occurs only on a low-K+ diet (K+ depletion). Under these conditions, K+ excretion
can be as low as 1% of the filtered load because the kidney conserves as much K+ aspossible.
160 Board Review Series: Physiology
20%
Low-K+
diet only
Excretion 1%–110%
Variable
Dietary K+
AldosteroneAcid–baseFlow rate
67%
FIGURE 5-12 K+ handling along the nephron.Arrows indicate reabsorption or secretionof K+. Numbers indicate the percentage ofthe filtered load of K+ that is reabsorbed,secreted, or excreted.
5-4t a b l e
Causes of Shift of K+ out of Causes of Shift of K+ into Cells ã Hyperkalemia Cells ã Hypokalemia
Insulin deficiency Insulin
β-Adrenergic antagonists β-Adrenergic agonists
Acidosis (exchange of extracellular Alkalosis (exchange of intracellular H+
H+ for intracellular K+) for extracellular K+)
Hyperosmolarity (H2O flows out of Hyposmolarity (H2O flows into the cell; K+
the cell; K+ diffuses out with H2O) diffuses in with H2O)
Inhibitors of Na+–K+ pump (e.g., digitalis) [when pump is blocked, K+ is not taken up into cells]
Exercise
Cell lysis
ECF = extracellular fluid; ICF = intracellular fluid.
Shifts of K+ between ECF and ICF
98761_Ch05_Chapter 05 5/7/10 6:26 PM Page 160

b. Secretion of K+
■ occurs in the principal cells.
■ is variable and accounts for the wide range of urinary K+ excretion.■ depends on factors such as dietary K+, aldosterone levels, acid–base status, and
urine flow rate.
(1) Mechanism of distal K+ secretion (Figure 5-13)(a) At the basolateral membrane, K+ is actively transported into the cell by the
Na+−K+ pump. As in all cells, this mechanism maintains a high intracellular K+
concentration.(b) At the luminal membrane, K+ is passively secreted into the lumen through K+
channels. The magnitude of this passive secretion is determined by the chemi-cal and electrical driving forces on K+ across the luminal membrane.
■ Maneuvers that increase the intracellular K+ concentration or decrease theluminal K+ concentration will increase K+ secretion by increasing the driv-ing force.
■ Maneuvers that decrease the intracellular K+ concentration will decreaseK+ secretion by decreasing the driving force.
(2) Factors that change distal K+ secretion (see Figure 5-13 and Table 5-5)
■ Distal K+ secretion by the principal cells is increased when the electrochemicaldriving force for K+ across the luminal membrane is increased. Secretion isdecreased when the electrochemical driving force is decreased.
(a) Dietary K+
■ A diet high in K+ increases K+ secretion, and a diet low in K+ decreasesK+ secretion.
■ On a high-K+ diet, intracellular K+ increases so that the driving force forK+ secretion also increases.
Chapter 5 Renal and Acid–Base Physiology 161
Principal cell of distal tubule
(Dietary K+) (Acid–base)
(Aldosterone)
Lumen Blood
Na+
(Flow rate) K+
Na+
K+
H+
K+
K+
FIGURE 5-13 Mechanism of K+ secretion in the principal cell of the distal tubule.
5-5t a b l e
Causes of Increased Distal K+ Causes of Decreased Distal K+
Secretion Secretion
High-K+ diet Low-K+ diet
Hyperaldosteronism Hypoaldosteronism
Alkalosis Acidosis
Thiazide diuretics K+-sparing diuretics
Loop diuretics
Luminal anions
Changes in Distal K+ Secretion
98761_Ch05_Chapter 05 5/7/10 6:26 PM Page 161

■ On a low-K+ diet, intracellular K+ decreases so that the driving force forK+ secretion decreases. Also, the α-intercalated cells are stimulated to reab-sorb K+ by the H+,K+-ATPase.
(b) Aldosterone
■ increases K+ secretion.
■ The mechanism involves increased Na+ entry into the cells across the lumi-nal membrane and increased pumping of Na+ out of the cells by the Na+−K+
pump. Stimulation of the Na+–K+ pump simultaneously increases K+ uptakeinto the principal cells, increasing the intracellular K+ concentration andthe driving force for K+ secretion. Aldosterone also increases the number ofluminal membrane K+ channels.
■ Hyperaldosteronism increases K+ secretion and causes hypokalemia.
■ Hypoaldosteronism decreases K+ secretion and causes hyperkalemia.
(c) Acid–base
■ Effectively, H+ and K+ exchange for each other across the basolateral cellmembrane.
■ Acidosis decreases K+ secretion. The blood contains excess H+; therefore, H+
enters the cell across the basolateral membrane and K+ leaves the cell. As aresult, the intracellular K+ concentration and the driving force for K+ secre-tion decrease.
■ Alkalosis increases K+ secretion. The blood contains too little H+; therefore,H+ leaves the cell across the basolateral membrane and K+ enters the cell.As a result, the intracellular K+ concentration and the driving force for K+
secretion increase.
(d) Thiazide and loop diuretics
■ increase K+ secretion.
■ Diuretics that increase flow rate through the distal tubule (e.g., thiazide
diuretics, loop diuretics) cause dilution of the luminal K+ concentration,increasing the driving force for K+ secretion. Also, as a result of increasedK+ secretion, these diuretics cause hypokalemia.
(e) K+-sparing diuretics
■ decrease K+ secretion. If used alone, they cause hyperkalemia.
■ Spironolactone is an antagonist of aldosterone; triamterene and amilorideact directly on the principal cells.
■ The most important use of the K+-sparing diuretics is in combination withthiazide or loop diuretics to offset (reduce) urinary K+ losses.
(f) Luminal anions
■ Excess anions (e.g., HCO3–) in the lumen cause an increase in K+ secretion
by increasing the negativity of the lumen, which favors K+ secretion.
VI. RENAL REGULATION OF UREA, PHOSPHATE,CALCIUM, AND MAGNESIUM
A. Urea
■ Fifty percent of the filtered urea is reabsorbed passively in the proximal tubule.■ The distal tubule, cortical collecting ducts, and outer medullary collecting ducts are
impermeable to urea; thus, no urea is reabsorbed by these segments.■ ADH increases the urea permeability of the inner medullary collecting ducts. Urea reabsorp-
tion from inner medullary collecting ducts contributes to urea recycling in the inner medul-
la and to the development of the corticopapillary osmotic gradient.
162 Board Review Series: Physiology
98761_Ch05_Chapter 05 5/7/10 6:26 PM Page 162

■ Urea excretion varies with urine flow rate. At high levels of water reabsorption (low urine flow rate),there is greater urea reabsorption and decreased urea excretion. At low levels of water reab -sorption (high urine flow rate), there is less urea reabsorption and increased urea excretion.
B. Phosphate
■ Eighty-five percent of the filtered phosphate is reabsorbed in the proximal tubule by Na+–phosphate cotransport. Because distal segments of the nephron do not reabsorb phosphate, 15% of the filtered load is excreted in urine.
■ Parathyroid hormone (PTH) inhibits phosphate reabsorption in the proximal tubule by activatingadenylate cyclase, generating cyclic AMP (cAMP), and inhibiting Na+–phosphate cotrans-port. Therefore, PTH causes phosphaturia and increased urinary cAMP.
■ Phosphate is a urinary buffer for H+; excretion of H2PO4– is called titratable acid.
C. Calcium (Ca2+)
■ Sixty percent of the plasma Ca2+ is filtered across the glomerular capillaries.■ Together, the proximal tubule and thick ascending limb reabsorb more than 90% of the filtered
Ca2+ by passive processes that are coupled to Na+ reabsorption.■ Loop diuretics (e.g., furosemide) cause increased urinary Ca2+ excretion. Because Ca2+ reab-
sorption is linked to Na+ reabsorption in the loop of Henle, inhibiting Na+ reabsorptionwith a loop diuretic also inhibits Ca2+ reabsorption. If volume is replaced, loop diureticscan be used in the treatment of hypercalcemia.
■ Together, the distal tubule and collecting duct reabsorb 8% of the filtered Ca2+ by an activeprocess.
1. PTH increases Ca2+ reabsorption by activating adenylate cyclase in the distal tubule.2. Thiazide diuretics increase Ca2+ reabsorption in the distal tubule and therefore decrease Ca2+
excretion. For this reason, thiazides are used in the treatment of idiopathic hypercalciuria.
D. Magnesium (Mg2+)
■ is reabsorbed in the proximal tubule, thick ascending limb of the loop of Henle, and distaltubule.
■ In the thick ascending limb, Mg2+ and Ca2+ compete for reabsorption; therefore, hypercal-cemia causes an increase in Mg2+ excretion (by inhibiting Mg2+ reabsorption). Likewise,hypermagnesemia causes an increase in Ca2+ excretion (by inhibiting Ca2+ reabsorption).
VII. CONCENTRATION AND DILUTION OF URINE
A. Regulation of plasma osmolarity
■ is accomplished by varying the amount of water excreted relative to the amount of soluteexcreted (i.e., by varying urine osmolarity).
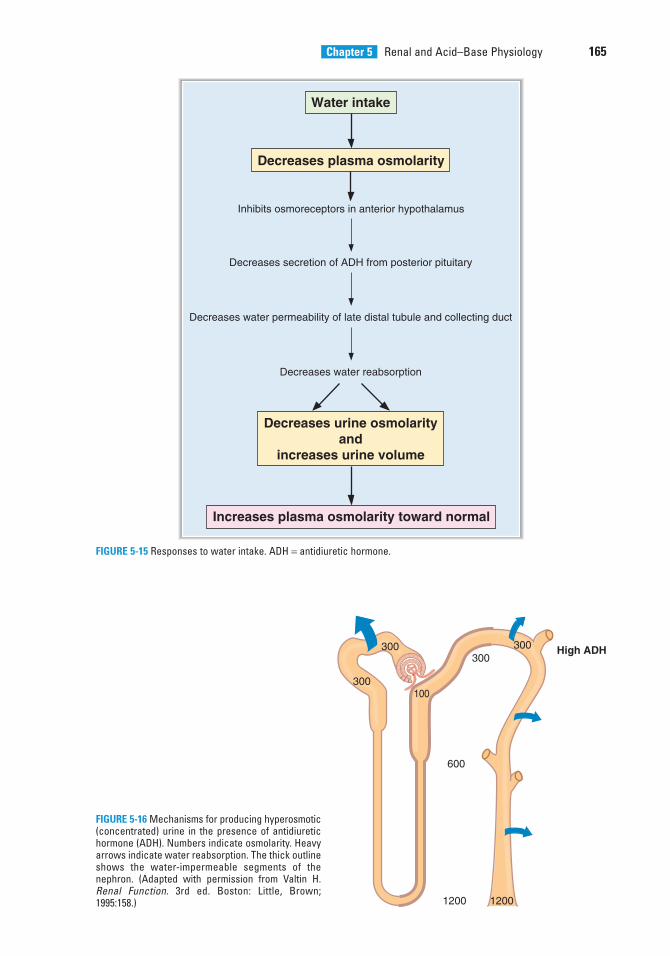
1. Response to water deprivation (Figure 5-14)2. Response to water intake (Figure 5-15)
B. Production of concentrated urine (Figure 5-16)
■ is also called hyperosmotic urine, in which urine osmolarity > blood osmolarity.■ is produced when circulating ADH levels are high (e.g., water deprivation, hemorrhage,
SIADH).
1. Corticopapillary osmotic gradient—high ADH
■ is the gradient of osmolarity from the cortex (300 mOsm/L) to the papilla (1200 mOsm/L),and is composed primarily of NaCl and urea.
■ is established by countercurrent multiplication and urea recycling.■ is maintained by countercurrent exchange in the vasa recta.
Chapter 5 Renal and Acid–Base Physiology 163
98761_Ch05_Chapter 05 5/7/10 6:26 PM Page 163

a. Countercurrent multiplication in the loop of Henle
■ depends on NaCl reabsorption in the thick ascending limb and countercurrent flow in thedescending and ascending limbs of the loop of Henle.
■ is augmented by ADH, which stimulates NaCl reabsorption in the thick ascendinglimb. Therefore, the presence of ADH increases the size of the corticopapillaryosmotic gradient.
b. Urea recycling from the inner medullary collecting ducts into the medullary interstitialfluid also is augmented by ADH.
c. Vasa recta are the capillaries that supply the loop of Henle. They maintain the cortico-papillary gradient by serving as osmotic exchangers. Vasa recta blood equilibratesosmotically with the interstitial fluid of the medulla and papilla.
2. Proximal tubule—high ADH
■ The osmolarity of the glomerular filtrate is identical to that of plasma (300 mOsm/L).■ Two-thirds of the filtered H2O is reabsorbed isosmotically (with Na+, Cl–, HCO3
–, glu-cose, amino acids, and so forth) in the proximal tubule.
■ TF/Posm = 1.0 throughout the proximal tubule because H2O is reabsorbed isosmoticallywith solute.
3. Thick ascending limb of the loop of Henle—high ADH
■ is called the diluting segment.
■ reabsorbs NaCl by the Na+–K+–2Cl– cotransporter.
164 Board Review Series: Physiology
Water deprivation
Increases plasma osmolarity
Stimulates osmoreceptors in anterior hypothalamus
Increases secretion of ADH from posterior pituitary
Decreases plasma osmolarity toward normal
Increases water permeability of late distal tubule and collecting duct
Increases water reabsorption
Increases urine osmolarityand
decreases urine volume
FIGURE 5-14 Responses to water deprivation. ADH = antidiuretic hormone.
98761_Ch05_Chapter 05 5/7/10 6:26 PM Page 164
Chapter 5 Renal and Acid–Base Physiology 165
Water intake
Decreases plasma osmolarity
Inhibits osmoreceptors in anterior hypothalamus
Decreases secretion of ADH from posterior pituitary
Increases plasma osmolarity toward normal
Decreases water permeability of late distal tubule and collecting duct
Decreases water reabsorption
Decreases urine osmolarityand
increases urine volume
FIGURE 5-15 Responses to water intake. ADH = antidiuretic hormone.
300
300100
300300
600
1200
High ADH
1200
FIGURE 5-16 Mechanisms for producing hyperosmotic(concentrated) urine in the presence of antidiuretichormone (ADH). Numbers indicate osmolarity. Heavyarrows indicate water reabsorption. The thick outlineshows the water-impermeable segments of thenephron. (Adapted with permission from Valtin H.Renal Function. 3rd ed. Boston: Little, Brown;1995:158.)
98761_Ch05_Chapter 05 5/7/10 6:26 PM Page 165

■ is impermeable to H2O. Therefore, H2O is not reabsorbed with NaCl, and the tubular fluidbecomes dilute.
■ The fluid that leaves the thick ascending limb has an osmolarity of 100 mOsm/L andTF/Posm < 1.0 as a result of the dilution process.
4. Early distal tubule—high ADH
■ is called the cortical diluting segment.
■ Like the thick ascending limb, the early distal tubule reabsorbs NaCl but is impermeable
to water. Consequently, tubular fluid is further diluted.
5. Late distal tubule—high ADH
■ ADH increases the H2O permeability of the principal cells of the late distal tubule.■ H2O is reabsorbed from the tubule until the osmolarity of distal tubular fluid equals
that of the surrounding interstitial fluid in the renal cortex (300 mOsm/L).■ TF/Posm = 1.0 at the end of the distal tubule because osmotic equilibration occurs in the
presence of ADH.
6. Collecting ducts—high ADH
■ As in the late distal tubule, ADH increases the H2O permeability of the principal cells of thecollecting ducts.
■ As tubular fluid flows through the collecting ducts, it passes through the corticopapil-lary gradient (regions of increasingly higher osmolarity), which was previously estab-lished by countercurrent multiplication and urea recycling.
■ H2O is reabsorbed from the collecting ducts until the osmolarity of tubular fluidequals that of the surrounding interstitial fluid.
■ The osmolarity of the final urine equals that at the bend of the loop of Henle(1200 mOsm/L).
■ TF/Posm > 1.0 because osmotic equilibration occurs with the corticopapillary gradient inthe presence of ADH.
C. Production of dilute urine (Figure 5-17)
■ is called hyposmotic urine, in which urine osmolarity < blood osmolarity.■ is produced when circulating levels of ADH are low (e.g., water intake, central diabetes
insipidus) or when ADH is ineffective (nephrogenic diabetes insipidus).
166 Board Review Series: Physiology
300
300120
300100
450
600
No ADH
50
FIGURE 5-17 Mechanisms for producing hyposmotic(dilute) urine in the absence of antidiuretic hormone(ADH). Numbers indicate osmolarity. Heavy arrow indi-cates water reabsorption. The thick outline shows thewater-impermeable segments of the nephron. (Adaptedwith permission from Valtin H. Renal Function. 3rd ed.Boston: Little, Brown; 1995:159.)
98761_Ch05_Chapter 05 5/7/10 6:26 PM Page 166

1. Corticopapillary osmotic gradient—no ADH
■ is smaller than in the presence of ADH because ADH stimulates both countercurrentmultiplication and urea recycling.
2. Proximal tubule—no ADH
■ As in the presence of ADH, two-thirds of the filtered water is reabsorbed isosmotically.
■ TF/Posm = 1.0 throughout the proximal tubule.
3. Thick ascending limb of the loop of Henle—no ADH
■ As in the presence of ADH, NaCl is reabsorbed without water, and the tubular fluidbecomes dilute (although not quite as dilute as in the presence of ADH).
■ TF/Posm < 1.0.
4. Early distal tubule—no ADH
■ As in the presence of ADH, NaCl is reabsorbed without H2O and the tubular fluid isfurther diluted.
■ TF/Posm < 1.0.
5. Late distal tubule and collecting ducts—no ADH
■ In the absence of ADH, the cells of the late distal tubule and collecting ducts are imper-
meable to H2O.
■ Thus, even though the tubular fluid flows through the corticopapillary osmotic gradi-ent, osmotic equilibration does not occur.
■ The osmolarity of the final urine will be dilute with an osmolarity as low as 50 mOsm/L.■ TF/Posm < 1.0.
D. Free-water clearance (CH2O)
■ is used to estimate the ability to concentrate or dilute the urine.
■ Free water, or solute-free water, is produced in the diluting segments of the kidney (i.e.,thick ascending limb and early distal tubule), where NaCl is reabsorbed and free water isleft behind in the tubular fluid.
■ In the absence of ADH, this solute-free water is excreted and CH2O is positive.
■ In the presence of ADH, this solute-free water is not excreted, but is reabsorbed by the latedistal tubule and collecting ducts, and CH2O is negative.
1. Calculation of CH2O
where:CH2O = free-water clearance (mL/min)
V = urine flow rate (mL/min)Cosm = osmolar clearance (Uosm V/Posm) [mL/min]
■ Example: If the urine flow rate is 10 mL/min, urine osmolarity is 100 mOsm/L, andplasma osmolarity is 300 mOsm/L, what is the free-water clearance?
C V C
mLmOsm L mL
mOsm
H O osm2
10100 10
300
= −
= − ×min
minLL
mL mLmL
= −= +
10 3 336 7
min . min. min
C V CH O osm2� �
Chapter 5 Renal and Acid–Base Physiology 167
98761_Ch05_Chapter 05 5/7/10 6:26 PM Page 167
2. Urine that is isosmotic to plasma (isosthenuric)
■ CH2O is zero.
■ is produced during treatment with a loop diuretic, which inhibits NaCl reabsorption inthe thick ascending limb, inhibiting both dilution in the thick ascending limb and pro-duction of the corticopapillary osmotic gradient. Therefore, the urine cannot be dilut-ed during high water intake (because a diluting segment is inhibited) or concentratedduring water deprivation (because the corticopapillary gradient has been abolished).
3. Urine that is hyposmotic to plasma (low ADH)
■ CH2O is positive.
■ is produced with high water intake (in which ADH release from the posterior pituitaryis suppressed), central diabetes insipidus (in which pituitary ADH is insufficient), ornephrogenic diabetes insipidus (in which the collecting ducts are unresponsive to ADH).
4. Urine that is hyperosmotic to plasma (high ADH)
■ CH2O is negative.
■ is produced in water deprivation (ADH release from the pituitary is stimulated) or SIADH.
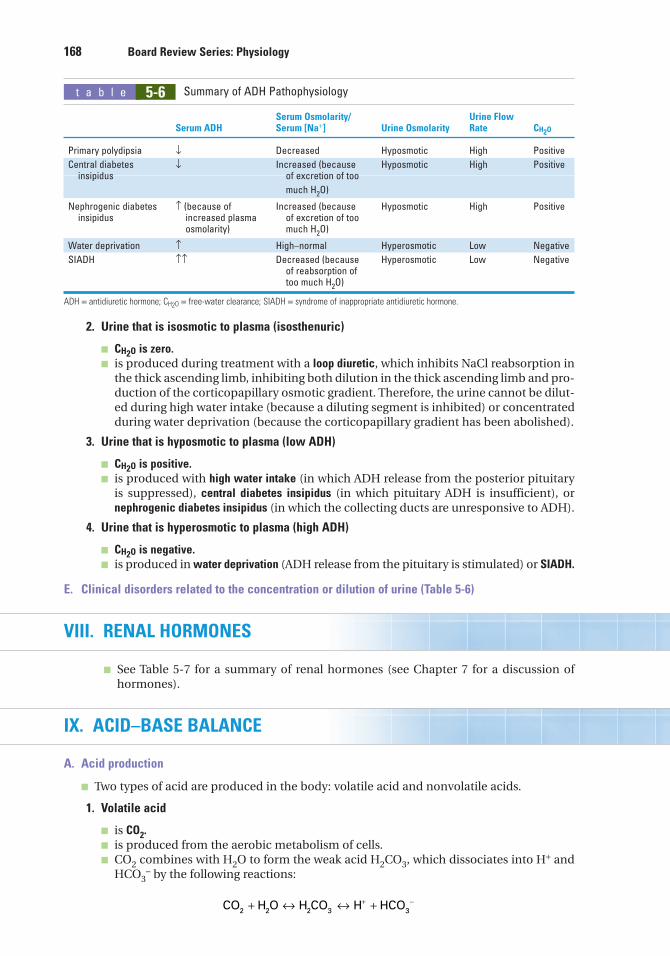
E. Clinical disorders related to the concentration or dilution of urine (Table 5-6)
VIII. RENAL HORMONES
■ See Table 5-7 for a summary of renal hormones (see Chapter 7 for a discussion of hormones).
IX. ACID–BASE BALANCE
A. Acid production
■ Two types of acid are produced in the body: volatile acid and nonvolatile acids.
1. Volatile acid
■ is CO2.
■ is produced from the aerobic metabolism of cells.■ CO2 combines with H2O to form the weak acid H2CO3, which dissociates into H+ and
HCO3– by the following reactions:
CO H O H CO H HCO2 2 2 3 3+ ↔ ↔ ++ −
168 Board Review Series: Physiology
5-6t a b l e
Serum Osmolarity/ Urine Flow Serum ADH Serum [Na+] Urine Osmolarity Rate CH2O
Primary polydipsia ↓ Decreased Hyposmotic High Positive
Central diabetes ↓ Increased (because Hyposmotic High Positiveinsipidus of excretion of too
much H2O)
Nephrogenic diabetes ↑ (because of Increased (because Hyposmotic High Positiveinsipidus increased plasma of excretion of too
osmolarity) much H2O)
Water deprivation ↑ High–normal Hyperosmotic Low Negative
SIADH ↑↑ Decreased (because Hyperosmotic Low Negativeof reabsorption of too much H2O)
ADH = antidiuretic hormone; CH2O = free-water clearance; SIADH = syndrome of inappropriate antidiuretic hormone.
Summary of ADH Pathophysiology
98761_Ch05_Chapter 05 5/7/10 6:26 PM Page 168

■ Carbonic anhydrase, which is present in most cells, catalyzes the reversible reactionbetween CO2 and H2O.
2. Nonvolatile acids
■ are also called fixed acids.
■ include sulfuric acid (a product of protein catabolism) and phosphoric acid (a productof phospholipid catabolism).
■ are normally produced at a rate of 40–60 mmoles/day.
■ Other fixed acids that may be overproduced in disease or may be ingested includeketoacids, lactic acid, and salicylic acid.
B. Buffers
■ prevent a change in pH when H+ ions are added to or removed from a solution.■ are most effective within 1.0 pH unit of the pK of the buffer (i.e., in the linear portion of the
titration curve).
1. Extracellular buffersa. The major extracellular buffer is HCO3
-, which is produced from CO2 and H2O.
■ The pK of the CO2/HCO3− buffer pair is 6.1.
b. Phosphate is a minor extracellular buffer.
■ The pK of the H2PO4−/HPO4
−2 buffer pair is 6.8.
■ Phosphate is most important as a urinary buffer; excretion of H+ as H2PO4− is called
titratable acid.
Chapter 5 Renal and Acid–Base Physiology 169
5-7t a b l e
Stimulus for Mechanism Actions on Hormone Secretion Time Course of Action Kidneys
PTH ↓ plasma [Ca2+] Fast Basolateral ↓ phosphate reabsorptionreceptor (proximal tubule)
Adenylate cyclase ↑ Ca2+ reabsorptioncAMP → urine (distal tubule)
Stimulates 1α-hydroxylase(proximal tubule)
ADH ↑ plasma osmolarity Fast Basolateral V2 ↑ H2O permeability ↓ blood volume receptor (late distal tubule and
Adenylate cyclase collecting duct cAMP principal cells)(Note: V1 receptors areon blood vessels; mechanism is Ca2+−IP3)
Aldosterone ↓ blood volume Slow New protein ↑ Na+ reabsorption (via renin– synthesis (ENaC, distal tubuleangiotensin II) principal cells)
↑ plasma [K+] ↑ K+ secretion (distaltubule principal cells)
↑ H+ secretion (distaltubule α-intercalatedcells)
ANP ↑ atrial pressure Fast Guanylate cyclase ↑ GFRcGMP ↓ Na+ reabsorption
Angiotensin II ↓ blood volume Fast ↑ Na+−H+ exchange and (via renin) HCO3
− reabsorption(proximal tubule)
ADH = antidiuretic hormone; ANP = atrial natriuretic peptide; cAMP = cyclic adenosine monophosphate; cGMP = cyclic guanosine monophosphate;GFR = glomerular filtration rate; PTH = parathyroid hormone; EnaC = epithelial Na+ channel.
Summary of Hormones That Act on the Kidney
98761_Ch05_Chapter 05 5/7/10 6:26 PM Page 169

2. Intracellular buffersa. Organic phosphates [e.g., AMP, ADP, ATP, 2,3-diphosphoglycerate (DPG)]b. Proteins
■ Imidazole and α-amino groups on proteins have pKs that are within the physiologicpH range.
■ Hemoglobin is a major intracellular buffer.■ In the physiologic pH range, deoxyhemoglobin is a better buffer than oxyhemoglobin.
3. Using the Henderson–Hasselbalch equation to calculate pH
where:pH = –log10 [H+] (pH units)pK = –log10 equilibrium constant (pH units)
[A–] = base form of buffer (mM)[HA] = acid form of buffer (mM)
■ A−, the base form of the buffer, is the H+ acceptor.■ HA, the acid form of the buffer, is the H+ donor.■ When the concentrations of A– and HA are equal, the pH of the solution equals the pK of
the buffer, as calculated by the Henderson–Hasselbalch equation.■ Example: The pK of the H2PO4
−/HPO4−2 buffer pair is 6.8. What are the relative concen-
trations of H2PO4− and HPO4
−2 in a urine sample that has a pH of 4.8?
For this buffer pair, HPO4−2 is A− and H2PO4
− is HA. Thus, the Henderson–Hasselbalchequation can be used to calculate that the concentration of H2PO4
− is 100 times that ofHPO4
−2 in a urine sample of pH 4.8.
4. Titration curves (Figure 5-18)
■ describe how the pH of a buffered solution changes as H+ ions are added to it orremoved from it.
■ As H+ ions are added to the solution, the HA form is produced; as H+ ions are removed,the A− form is produced.
■ A buffer is most effective in the linear portion of the titration curve, where the addition orremoval of H+ causes little change in pH.
■ According to the Henderson–Hasselbalch equation, when the pH of the solution equals
the pK, the concentrations of HA and A– are equal.
C. Renal acid–base
1. Reabsorption of filtered HCO3– (Figure 5-19)
■ occurs primarily in the proximal tubule.
pH pKHPO
H PO
HPO
H PO
= +
= +
−
−
−
log
. . log
42
2 4
42
2 4
4 8 6 8 −−
−
−
−
−
= −
=
log .
.
HPO
H PO
HPO
H PO
H PO
42
2 4
42
2 4
2
2 0
0 01
44
42
100−
− =HPO
pH pKAHA
� ��
log[ ][ ]
170 Board Review Series: Physiology
98761_Ch05_Chapter 05 5/7/10 6:26 PM Page 170

a. Key features of reabsorption of filtered HCO3–
(1) H+ and HCO3− are produced in the proximal tubule cells from CO2 and H2O. CO2
and H2O combine to form H2CO3, catalyzed by intracellular carbonic anhydrase;H2CO3 dissociates into H+ and HCO3
–. H+ is secreted into the lumen via the Na+-H+ exchange mechanism in the luminal membrane. The HCO3
– is reabsorbed.(2) In the lumen, the secreted H+ combines with filtered HCO3
– to form H2CO3,which dissociates into CO2 and H2O, catalyzed by brush border carbonic anhy-drase. CO2 and H2O diffuse into the cell to start the cycle again.
(3) The process results in net reabsorption of filtered HCO3–. However, it does not result
in net secretion of H+.b. Regulation of reabsorption of filtered HCO3
–
(1) Filtered load
■ Increases in the filtered load of HCO3– result in increased rates of HCO3
– reab-sorption. However, if the plasma HCO3
– concentration becomes very high (e.g.,metabolic alkalosis), the filtered load will exceed the reabsorptive capacity, andHCO3
– will be excreted in the urine.
(2) PCO2
■ Increases in PCO2 result in increased rates of HCO3– reabsorption because the
supply of intracellular H+ for secretion is increased. This mechanism is thebasis for the renal compensation for respiratory acidosis.
■ Decreases in PCO2 result in decreased rates of HCO3– reabsorption because the
supply of intracellular H+ for secretion is decreased. This mechanism is thebasis for the renal compensation for respiratory alkalosis.
Chapter 5 Renal and Acid–Base Physiology 171
Lumen Blood
Na+
H+HCO3– + H+ H+ + HCO3
–
CO2 + H2OCO2
+ H2O
H2CO3
CA
H2CO3
CA
Na+
K+
Filtered HCO3–
is reabsorbed
(filtered)
Cell
FIGURE 5-19 Mechanism for reabsorption of filtered HCO3– in the proximal tubule. CA = carbonic anhydrase.
H+ a
dded
H+ rem
oved
pH43
HA
pK
A–
5 6 7 8 9 10FIGURE 5-18 Titration curve for a weak acid(HA) and its conjugate base (A−).
98761_Ch05_Chapter 05 5/7/10 6:26 PM Page 171

(3) ECF volume
■ ECF volume expansion results in decreased HCO3− reabsorption.
■ ECF volume contraction results in increased HCO3− reabsorption (contraction
alkalosis).
(4) Angiotensin II
■ stimulates Na+–H+ exchange and thus increases HCO3− reabsorption, con-
tributing to the contraction alkalosis that occurs secondary to ECF volumecontraction.
2. Excretion of fixed H+
■ Fixed H+ produced from the catabolism of protein and phospholipid is excreted bytwo mechanisms, titratable acid and NH4
+.a. Excretion of H+ as titratable acid (H2PO4
–) [Figure 5-20]
■ The amount of H+ excreted as titratable acid depends on the amount of urinary buffer
present (usually HPO4−2) and the pK of the buffer.
(1) H+ and HCO3– are produced in the cell from CO2 and H2O. The H+ is secreted into
the lumen by an H+-ATPase, and the HCO3– is reabsorbed into the blood (“new”
HCO3–). In the urine, the secreted H+ combines with filtered HPO4
–2 to form H2PO4–,
which is excreted as titratable acid. The H+-ATPase is increased by aldosterone.
(2) This process results in net secretion of H+ and net reabsorption of newly synthesized
HCO3–.
(3) As a result of H+ secretion, the pH of urine becomes progressively lower. The min-
imum urinary pH is 4.4.
(4) The amount of H+ excreted as titratable acid is determined by the amount of urinary
buffer and the pK of the buffer.
b. Excretion of H+ as NH4+ (Figure 5-21)
■ The amount of H+ excreted as NH4+ depends on both the amount of NH3 synthesized
by renal cells and the urine pH.
(1) NH3 is produced in renal cells from glutamine. It diffuses down its concentrationgradient from the cells into the lumen.
(2) H+ and HCO3– are produced in the cells from CO2 and H2O. The H+ is secreted into
the lumen via an H+-ATPase and combines with NH3 to form NH4+, which is excret-
ed (diffusion trapping). The HCO3− is reabsorbed into the blood (“new” HCO3
−).(3) The lower the pH of the tubular fluid, the greater the excretion of H+ as NH4
+; atlow urine pH, there is more NH4
+ relative to NH3 in the urine, thus increasing thegradient for NH3 diffusion.
(4) In acidosis, an adaptive increase in NH3 synthesis occurs and aids in the excretion ofexcess H+.
172 Board Review Series: Physiology
Intercalated cellLumen Blood
HPO4–2 + H+ H+ + HCO3
–
CO2 + H2O
H2CO3
CA
(filtered)
Na+
K+
“New” HCO3–
is reabsorbed
Titratable acidis excreted
H2PO4–
FIGURE 5-20 Mechanism for excretion of H+ as titratable acid. CA = carbonic anhydrase.
98761_Ch05_Chapter 05 5/7/10 6:26 PM Page 172

(5) Hyperkalemia inhibits NH3 synthesis, which produces a decrease in H+ excretion asNH+
4 [type 4 renal tubular acidosis (RTA)]. Conversely, hypokalemia stimulates NH3synthesis, which produces an increase in H+ excretion.
D. Acid–base disorders (Tables 5-8 and 5-9 and Figure 5-22)
■ The expected compensatory responses to simple acid–base disorders can be calculated asshown in Table 5-10. If the actual response equals the calculated (predicted) response,then one acid–base disorder is present. If the actual response differs from the calculatedresponse, then more than one acid–base disorder is present.
1. Metabolic acidosisa. Overproduction or ingestion of fixed acid or loss of base produces an increase in arterial
[H+] (acidemia).
b. HCO3− is used to buffer the extra fixed acid. As a result, the arterial [HCO3
–] decreases.
This decrease is the primary disturbance.c. Acidemia causes hyperventilation (Kussmaul breathing), which is the respiratory compensa-
tion for metabolic acidosis.d. Correction of metabolic acidosis consists of increased excretion of the excess fixed H+
as titratable acid and NH4+, and increased reabsorption of “new” HCO3
−, which replen-ishes the HCO3
− used in buffering the added fixed H+.
■ In chronic metabolic acidosis, an adaptive increase in NH3 synthesis aids in the excre-tion of excess H+.
e. Serum anion gap = [Na+]–([Cl−] + [HCO3−]) (Figure 5-23)
■ The serum anion gap represents unmeasured anions in serum. These unmeasuredanions include phosphate, citrate, sulfate, and protein.
■ The normal value of the serum anion gap is 12 mEq/L (range, 8–16 mEq/L)
Chapter 5 Renal and Acid–Base Physiology 173
Blood
Na+
K+
“New” HCO3–
is reabsorbed
Lumen
H+
NH3
NH4+
excreted
+ NH3
Glutamine
H+ + HCO3–
CO2 + H2O
H2CO3
CA
Cell
FIGURE 5-21 Mechanism for excretion of H+ as NH4+. CA = carbonic anhydrase.
5-8t a b l e
Respiratory Renal Disorder CO2
+ H2O ↔ H+ + HCO3- Compensation Compensation
Metabolic acidosis ↓ (respiratory ↑ å Hyperventilationcompensation)
Metabolic alkalosis ↑ (respiratory ↓ ä Hypoventilationcompensation)
Respiratory acidosis ä ↑ ↑ None ↑ H+ excretion↑ HCO3
− reabsorption
Respiratory alkalosis å ↓ ↓ None ↓ H+ excretion↓ HCO3
− reabsorption
Heavy arrows indicate primary disturbance.
Summary of Acid–Base Disorders
98761_Ch05_Chapter 05 5/7/10 6:26 PM Page 173

■ In metabolic acidosis, the serum [HCO3−] decreases as it is depleted in buffering
fixed acid. For electroneutrality, the concentration of another anion must increaseto replace HCO3
−. That anion can be Cl– or it can be an unmeasured anion.(1) The serum anion gap is increased if the concentration of an unmeasured anion
(e.g., phosphate, lactate, β-hydroxybutyrate, and formate) is increased to replaceHCO3
−.(2) The serum anion gap is normal if the concentration of Cl– is increased to replace
HCO3− (hyperchloremic metabolic acidosis).
2. Metabolic alkalosisa. Loss of fixed H+ or gain of base produces a decrease in arterial [H+] (alkalemia).b. As a result, arterial [HCO3
−] increases. This increase is the primary disturbance.
■ For example, in vomiting, H+ is lost from the stomach, HCO3− remains behind in the
blood, and the [HCO3−] increases.
174 Board Review Series: Physiology
5-9t a b l e Causes of Acid–Base Disorders
Example Comments
Metabolic acidosis Ketoacidosis Accumulation of β-OH-butyric acid and acetoacetic acid
↑ anion gapLactic acidosis Accumulation of lactic acid during hypoxia
↑ anion gapChronic renal failure Failure to excrete H+ as titratable acid and NH4
+
↑ anion gapSalicylate intoxication Also causes respiratory alkalosis
↑ anion gapMethanol/formaldehyde Produces formic acid
intoxication ↑ anion gapEthylene glycol intoxication Produces glycolic and oxalic acids
↑ anion gapDiarrhea GI loss of HCO3
−
Normal anion gapType 2 RTA Renal loss of HCO3
−
Normal anion gapType 1 RTA Failure to excrete titratable acid and
NH4+; failure to acidify urine
Normal anion gapType 4 RTA Hypoaldosteronism; failure to excrete NH4
+
Hyperkalemia caused by lack of aldosterone inhibits NH3 synthesis
Normal anion gap
Metabolic alkalosis Vomiting Loss of gastric H+; leaves HCO3− behind in blood
Worsened by volume contractionHypokalemiaMay have ↑ anion gap because of production of
ketoacids (starvation)Hyperaldosteronism Increased H+ secretion by distal tubule;
increased new HCO3− reabsorption
Loop or thiazide diuretics Volume contraction alkalosis
Respiratory acidosis Opiates; sedatives; anesthetics Inhibition of medullary respiratory centerGuillain–Barré syndrome; polio; Weakening of respiratory muscles
ALS; multiple sclerosis ↓ CO2 exchange in lungsAirway obstructionAdult respiratory distress
syndrome; COPD
Respiratory alkalosis Pneumonia; pulmonary embolus Hypoxemia causes ↑ ventilation rateHigh altitude Hypoxemia causes ↑ ventilation ratePsychogenic Direct stimulation of medullarySalicylate intoxication respiratory center; also causes
metabolic acidosis
ALS = amyotrophic lateral sclerosis; COPD = chronic obstructive pulmonary disease; GI = gastrointestinal; RTA = renal tubular acidosis.
98761_Ch05_Chapter 05 5/7/10 6:26 PM Page 174

Chapter 5 Renal and Acid–Base Physiology 175
0
[HCO3 ] (mEq/L)–
PC
O2
(mm
Hg)
20
40
60
80
100
120 24 36 48 60
FIGURE 5-22 Acid–base map with values for simple acid–base disorders superimposed. The relationships are shownbetween arterial PCO2, [HCO3
–], and pH. The ellipse in the center shows the normal range of values. Shaded areas showthe range of values associated with simple acid–base disorders. Two shaded areas are shown for each respiratory dis-order: one for the acute phase and one for the chronic phase. (Adapted with permission from Cohen JJ, Kassirer JP.Acid/Base. Boston: Little, Brown; 1982.)
c. Alkalemia causes hypoventilation, which is the respiratory compensation for metabolicalkalosis.
d. Correction of metabolic alkalosis consists of increased excretion of HCO3− because the
filtered load of HCO3− exceeds the ability of the renal tubule to reabsorb it.
■ If metabolic alkalosis is accompanied by ECF volume contraction (e.g., vomiting), thereabsorption of HCO3
− increases (secondary to ECF volume contraction and acti-vation of the renin–angiotensin II–aldosterone system), worsening the metabolicalkalosis (i.e., contraction alkalosis).
3. Respiratory acidosis
■ is caused by a decrease in respiratory rate and retention of CO2.
a. Increased arterial PCO2, which is the primary disturbance, causes an increase in [H+] and
[HCO3–] by mass action.
b. There is no respiratory compensation for respiratory acidosis.
98761_Ch05_Chapter 05 5/7/10 6:26 PM Page 175

c. Renal compensation consists of increased excretion of H+ as titratable acid and NH4+,
and increased reabsorption of “new” HCO3–. This process is aided by the increased
PCO2, which supplies more H+ to the renal cells for secretion. The resulting increase inserum [HCO3
–] helps to normalize the pH.
■ In acute respiratory acidosis, renal compensation has not yet occurred.■ In chronic respiratory acidosis, renal compensation (increased HCO3
– reabsorption) hasoccurred. Thus, arterial pH is increased toward normal (i.e., a compensation).
4. Respiratory alkalosis
■ is caused by an increase in respiratory rate and loss of CO2.
a. Decreased arterial PCO2, which is the primary disturbance, causes a decrease in [H+] and
[HCO3–] by mass action.
b. There is no respiratory compensation for respiratory alkalosis.c. Renal compensation consists of decreased excretion of H+ as titratable acid and NH4
+,and decreased reabsorption of “new” HCO3
–. This process is aided by the decreased
176 Board Review Series: Physiology
5-10t a b l e
Predicted CompensatoryAcid–Base Disturbance Primary Disturbance Compensation Response
Metabolic acidosis ↓ [HCO3−] ↓ PCO2 1 mEq/L decrease in HCO3
− →1.3 mm Hg decrease in PCO2
Metabolic alkalosis ↑ [HCO3−] ↑ PCO2 1 mEq/L increase in HCO3
− →0.7 mm Hg increase in PCO2
Respiratory acidosisAcute ↑ PCO2 ↑ [HCO3
−] 1 mm Hg increase in PCO2 →0.1 mEq/L increase in HCO3
−
Chronic ↑ PCO2 ↑ [HCO3−] 1 mm Hg increase in PCO2 →
0.4 mEq/L increase in HCO3−
Respiratory alkalosis
Acute ↓ PCO2 ↓ [HCO3−] 1 mm Hg decrease in PCO2 →
0.2 mEq/L decrease in HCO3−
Chronic ↓ PCO2 ↓ [HCO3−] 1 mm Hg decrease in PCO2 →
0.4 mEq/L decrease in HCO3−
Calculating Compensatory Responses to Simple
Acid–Base Disorders
FIGURE 5-23 Serum anion gap.
–
Unmeasured anions = protein, phosphate,citrate, sulfate
Cations Anions
Na+
Cl–
HCO3
Anion gap
98761_Ch05_Chapter 05 5/7/10 6:26 PM Page 176

PCO2, which causes a deficit of H+ in the renal cells for secretion. The resulting decreasein serum [HCO3
–] helps to normalize the pH.
■ In acute respiratory alkalosis, renal compensation has not yet occurred.■ In chronic respiratory alkalosis, renal compensation (decreased HCO3
– reabsorption)has occurred. Thus, arterial pH is decreased toward normal (i.e., a compensation).
d. Symptoms of hypocalcemia (e.g., tingling, numbness, muscle spasms) may occurbecause H+ and Ca2+ compete for binding sites on plasma proteins. Decreased [H+]causes increased protein binding of Ca2+ and decreased free ionized Ca2+.
X. DIURETICS (TABLE 5-11)
XI. INTEGRATIVE EXAMPLES
A. Hypoaldosteronism
1. Case study
■ A woman has a history of weakness, weight loss, orthostatic hypotension, increasedpulse rate, and increased skin pigmentation. She has decreased serum [Na+],decreased serum osmolarity, increased serum [K+], and arterial blood gases consistentwith metabolic acidosis.
2. Explanation of hypoaldosteronisma. The lack of aldosterone has three direct effects on the kidney: decreased Na+ reabsorp-
tion, decreased K+ secretion, and decreased H+ secretion. As a result, there is ECF
Chapter 5 Renal and Acid–Base Physiology 177
5-11t a b l e
Class of Diuretic Site of Action Mechanism Major Effects
Carbonic anhydrase Proximal tubule Inhibition of carbonic ↑ HCO3– excretion
inhibitors (acetazolamide) anhydrase
Loop diuretics (furosemide, Thick ascending limb Inhibition of Na+–K+ ↑ NaCl excretionethacrynic acid, bumetanide) of the loop of Henle –2Cl– cotransport ↑ K+ excretion (↑ distal
tubule flow rate)↑ Ca2+ excretion (treat
hypercalcemia)↓ ability to concentrate urine
(↓ corticopapillary gradient)↓ ability to dilute urine
(inhibition of dilutingsegment)
Thiazide diuretics (chlorothiazide, Early distal tubule Inhibition of Na+–Cl– ↑ NaCl excretionhydrochlorothiazide) (cortical diluting cotransport ↑ K+ excr etion (↑ distal
segment) tubule flow rate)↓ Ca2+ excretion (treatment of
idiopathic hypercalciuria)↓ ability to dilute urine
(inhibition of cortical diluting segment)
No effect on ability to concentrate urine
K+-sparing diuretics Late distal tubule Inhibition of Na+ ↑ Na+ excretion (small effect)(spironolactone, triamterene, and collecting duct reabsorption ↓ K+ excretion (used inamiloride) Inhibition of K+ combination with loop or
secretion thiazide diuretics)Inhibition of H+ secretion ↓ H+ excretion
Effects of Diuretics on the Nephron
98761_Ch05_Chapter 05 5/7/10 6:26 PM Page 177

volume contraction (caused by decreased Na+ reabsorption), hyperkalemia (caused bydecreased K+ secretion), and metabolic acidosis (caused by decreased H+ secretion).
b. The ECF volume contraction is responsible for this woman’s orthostatic hypotension.The decreased arterial pressure produces an increased pulse rate via the baroreceptormechanism.
c. ECF volume contraction also stimulates ADH secretion from the posterior pituitary viavolume receptors. ADH causes increased water reabsorption from the collecting ducts,which results in decreased serum [Na+] (hyponatremia) and decreased serum osmolar-ity. Thus, ADH released by a volume mechanism is “inappropriate” for the serumosmolarity in this case.
d. Hyperpigmentation is caused by adrenal insufficiency. Decreased levels of cortisol pro-duce increased secretion of adrenocorticotropic hormone (ACTH) by negative feedback.ACTH has pigmenting effects similar to those of melanocyte-stimulating hormone.
B. Vomiting
1. Case study■ A man is admitted to the hospital for evaluation of severe epigastric pain. He has had
persistent nausea and vomiting for 4 days. Upper gastrointestinal (GI) endoscopyshows a pyloric ulcer with partial gastric outlet obstruction. He has orthostatichypotension, decreased serum [K+], decreased serum [Cl–], arterial blood gases con-sistent with metabolic alkalosis, and decreased ventilation rate.
2. Responses to vomiting (Figure 5-24)a. Loss of H+ from the stomach by vomiting causes increased blood [HCO3
−] and meta-bolic alkalosis. Because Cl– is lost from the stomach along with H+, hypochloremia andECF volume contraction occur.
b. The decreased ventilation rate is the respiratory compensation for metabolic alkalosis.c. ECF volume contraction is associated with decreased blood volume and decreased
renal perfusion pressure. As a result, renin secretion is increased, production ofangiotensin II is increased, and secretion of aldosterone is increased. Thus, the ECF vol-ume contraction worsens the metabolic alkalosis because angiotensin II increasesHCO3
– reabsorption in the proximal tubule (contraction alkalosis).d. The increased levels of aldosterone (secondary to ECF volume contraction) cause
increased distal K+ secretion and hypokalemia. Increased aldosterone also causesincreased distal H+ secretion, further worsening the metabolic alkalosis.
e. Treatment consists of NaCl infusion to correct ECF volume contraction (which is main-taining the metabolic alkalosis and causing hypokalemia) and administration of K+ toreplace K+ lost in the urine.
C. Diarrhea
1. Case study■ A man returns from a trip abroad with “traveler’s diarrhea.” He has weakness, weight
loss, orthostatic hypotension, increased pulse rate, increased breathing rate, pale skin,a serum [Na+] of 132 mEq/L, a serum [Cl–] of 111 mEq/L, and a serum [K+] of2.3 mEq/L. His arterial blood gases are: pH, 7.25; PCO2, 24 mm Hg; HCO3
–, 10.2 mEq/L.2. Explanation of responses to diarrhea
a. Loss of HCO3– from the GI tract causes a decrease in the blood [HCO3
−] and, accord-ing to the Henderson–Hasselbalch equation, a decrease in blood pH. Thus, this manhas metabolic acidosis.
b. To maintain electroneutrality, the HCO3– lost from the body is replaced by Cl−, a meas-
ured anion; thus, there is a normal anion gap. The serum anion gap = [Na+] – ([Cl−] +[HCO3
–]) = 132 – (111 + 10.2) = 10.8 mEq/L.c. The increased breathing rate (hyperventilation) is the respiratory compensation for meta-
bolic acidosis.
178 Board Review Series: Physiology
98761_Ch05_Chapter 05 5/7/10 6:27 PM Page 178

d. As a result of his diarrhea, this man has ECF volume contraction, which leads to decreas-es in blood volume and arterial pressure. The decrease in arterial pressure activates thebaroreceptor reflex, resulting in increased sympathetic outflow to the heart and bloodvessels. The increased pulse rate is a consequence of increased sympathetic activity inthe sinoatrial (SA) node, and the pale skin is the result of cutaneous vasoconstriction.
e. ECF volume contraction also activates the renin–angiotensin–aldosterone system.Increased levels of aldosterone lead to increased distal K+ secretion and hypokalemia.Loss of K+ in diarrhea fluid also contributes to hypokalemia.
f. Treatment consists of replacing all fluid and electrolytes lost in diarrhea fluid and urine,including Na+, HCO3
−, and K+.
Chapter 5 Renal and Acid–Base Physiology 179
–
Na+–H+ exchange
K+ secretionH+ secretionHCO3 reabsorption
Metabolicalkalosis
(generation)
Metabolicalkalosis
(maintenance)Hypokalemia
Vomiting
ECF volume contraction
Renal perfusion pressure
Angiotensin II Aldosterone
Loss of gastric HCl
Loss of fixed H+
FIGURE 5-24 Metabolic alkalosis caused by vomiting. ECF = extracellular fluid.
98761_Ch05_Chapter 05 5/7/10 6:27 PM Page 179