5 postprint version
TRANSCRIPT

1/49
This is a postprint version of the published journal article, available at: 1
https://doi.org/10.1016/j.istruc.2020.01.026 2
3
This work is licensed under a Creative Commons Attribution-NonCommercial-4
NoDerivatives 4.0 International License. 5
The influence of structural design methods on the embodied 6
greenhouse gas emissions of structural systems for tall 7
buildings 8
James Helal a,1, André Stephana and Robert H. Crawforda 9
10
aFaculty of Architecture, Building and Planning, The University of Melbourne, Victoria 3010, Australia 11
12
1Corresponding Author: James Helal 13
Tel: +61383441547 14
ORCID : 0000-0002-8211-1454 15
e-mail: [email protected]
Abstract 17
The construction of tall buildings generates a high spatial and temporal concentration of greenhouse 18
gas (GHG) emissions. Research has shown that as building height increases, more resources per floor 19
area are required to withstand the increasing effects of wind and earthquake loads. This has major 20
implications for the environmental performance of tall buildings since the embodied GHG emissions 21
(EGHGE) of structural systems tends to represent the greatest portion of the life cycle GHG emissions 22
of tall buildings. 23
In mitigating the effects of climate change, life cycle assessment (LCA) has been proposed as an early 24
stage design tool to facilitate the choice of structural systems and materials for tall buildings. Existing 25
studies that use LCA to compare alternative structural systems and materials use incomplete and 26
inconsistent structural design methods related to imposed loads, façade loads and lateral loads, both 27
Postpr
int V
ersion

2/49
static and dynamic in nature. The aim of this paper is to evaluate the influence of these different 28
structural design methods on the choice of structural systems for tall buildings to minimise their EGHGE. 29
The influence of structural design methods on the EGHGE of structural systems for tall buildings are 30
evaluated using a total of 80 structural systems, parametrically designed and analysed using finite 31
element modelling. A hybrid life cycle inventory analysis method is used to quantify the EGHGE of the 32
designed structural systems. 33
The paper demonstrates that varying structural design methods can significantly influence the values 34
of EGHGE of structural systems for tall buildings by up to 22%. The findings of this study confirm the 35
need for clarity, consistency, transparency and comprehensiveness in structural design methods when 36
conducting comparative LCA studies of structural systems for tall buildings. 37
38
Keywords: Embodied greenhouse gas emissions; Structural design; Premium for height; Structural 39
systems; Tall buildings. 40
1 Introduction 41
In its recent landmark special report titled ‘Global Warming of 1.5°C’, the Intergovernmental Panel on 42
Climate Change (IPCC) [1] declared that drastic changes are required by governments, industries and 43
societies to limit global warming to 1.5°C above pre-industrial levels. To meet this target, global 44
anthropogenic greenhouse gas (GHG) emissions, the most significant driver of climate change, must 45
be reduced by at least 49% of 2017 levels by 2030 [1]. Rapid and far-reaching transitions in the building 46
construction industry, which is responsible for 39% of global anthropogenic GHG emissions [2], are 47
required to mitigate the effects of climate change. 48
Resources, such as energy, water and waste, flow throughout the life cycle of buildings and can be 49
categorised into embodied flows and operational flows. Embodied flows are related to the construction 50
of buildings and the production of building materials across their supply chains [3]. Operational flows 51
are related to the operation of buildings which include heating, cooling, ventilation, domestic hot water, 52
lighting, appliances and cooking [3]. Regulations and current attempts to improve the environmental 53
performance of buildings have principally focused on operational energy. However, studies have 54
revealed that the growing significance of embodied environmental flows in buildings is often 55
Postpr
int V
ersion

3/49
underestimated [4]. Moreover, improvements in the operational efficiency of buildings is often achieved 56
using assemblies of high embodied energy (EE) such as thermal insulation and advanced façade 57
systems. Therefore, as the operational energy efficiency of buildings improves and their operational 58
GHG emissions decreases, embodied GHG emissions (EGHGE) will progressively form a higher 59
proportion of the life cycle environmental flows of buildings [5, 6]. In fact, the World Green Building 60
Council [2], in its recently published report titled ‘Bringing Embodied Carbon Upfront’, estimates that 61
EGHGE will be responsible for half of the entire GHG footprint of new construction between now and 62
2050, threatening to consume a large part of our remaining budget for GHG emissions . 63
The increasing rate of urbanisation has seen an accelerated trend in the construction of tall buildings in 64
the aim of increasing population density near employment opportunities. From 2000 to 2018, the total 65
number of buildings taller than 200 m increased by 460%, from 263 to 1,478 [7], globally. The number 66
of tall buildings is expected to continue to grow as a solution to the challenges of urbanisation and as a 67
means of establishing more compact cities that are attributed with less car dependency, better public 68
transport services and better health outcomes [8, 9]. 69
The construction of tall buildings generates a high spatial and temporal concentration of GHG 70
emissions, a phenomenon described by Säynäjoki et al. [5] as a ‘carbon spike.’ These ‘carbon spikes’ 71
are further exacerbated in the case of tall buildings that can have up to 60% more EE per gross floor 72
area (GFA) than low rise buildings [10]. This increase in resource use with increasing building height is 73
defined by Khan [11] as the premium-for-height and is mainly due to the cumulative effect of wind and 74
earthquake loads on the structural systems of tall buildings. This has major implications for the 75
environmental performance of tall buildings since the EGHGE of structural systems represents the 76
greatest portion of the life cycle GHG emissions of tall buildings [12]. 77
In practice, the structural design of tall buildings begins with selecting preliminary member sizes and 78
proceeds by iteration to meet strength, stability and serviceability design requirements until an 79
acceptable design solution is reached. However, this iterative approach does not guarantee that the 80
final design uses the least amount of structural materials and yields the least amount of EGHGE. To 81
overcome this shortcoming, several studies have used a comparative life cycle assessment (LCA) 82
approach to examine equivalent structural systems for tall buildings [12-16]. Their results demonstrate 83
the importance of the choice of structural system in the reduction of embodied environmental flows. 84
However, these studies systematically neglect influential building parameters, use inconsistent and 85
Postpr
int V
ersion

4/49
incomplete structural design and analysis methods, and/or adopt a process-based life cycle inventory 86
analysis method that has been shown to suffer from systemic incompleteness [17-20]. Consequently, 87
the approaches adopted by these studies do not yield reliable findings that can help accurately guide 88
the structural design of tall buildings to minimise embodied environmental flows. 89
In meeting the challenges of climate change, there is a need to develop structural design frameworks 90
for tall buildings that consider EGHGE upfront. In line with the ‘Reduce’ and ‘Optimise’ principles set 91
out by the World Green Building Council [2], these frameworks ought to apply design approaches that 92
minimise the quantity of construction materials required and their associated EGHGE. In order to 93
facilitate the future development of such integrated design frameworks, the focus of this paper is to 94
understand the influence of structural design methods on the EGHGE of structural systems for tall 95
buildings. 96
1.1 Aim and scope 97
The aim of this study is to demonstrate the influence of imposed loads, façade loads and lateral loads 98
on the embodied greenhouse gas emissions (EGHGE) of structural systems for tall buildings. 99
Due to the relative complexity and cost of life cycle assessment (LCA) studies, simplified LCA 100
methodologies are often used to assess the environmental flows of tall buildings. The most common 101
and widespread simplification in the LCA of tall buildings is to evaluate GHG emissions as the sole 102
output. Such an approach is referred to as a life cycle GHG emissions assessment (LCGHGEA). By 103
adopting the approach of LCGHGEA, this paper circumvents the relative complexity of a comprehensive 104
LCA while still being sufficiently accurate to aid decision making in buildings across all life cycle stages, 105
both in terms of resource use and environmental effects [21-23]. This conclusion stems from the well-106
established relationship between GHG emissions and climate change [24]. 107
Structural systems are designed to perform their intended function throughout their design working life, 108
with minimum maintenance and no structural repair being necessary [25]. Consequently, the recurring 109
environmental flows of structural systems are considered to be negligible. Additionally, the 110
environmental flows involved in the end-of-life stage of buildings are not considered due to them 111
typically representing less than 1% of their total energy requirement [26] and due to the large 112
uncertainties regarding the demolition and deconstruction processes decades into the future. As such, 113
this paper focuses on the initial embodied GHG emissions of structural systems as it has been shown 114
Postpr
int V
ersion

5/49
that they represent the greatest portion of the life cycle GHG emissions of tall buildings [12], even when 115
underestimated due to the use of uncomprehensive life cycle inventory (LCI) analysis methods. 116
According to European standard EN 15978:2011, the life cycle of a building, as seen in Figure 1, is 117
divided into four stages: product stage (A1-A3), construction stage (A4-A5), use stage (B1-B7) and 118
end-of-life stage (C1-C4) [27]. The scope of this paper, as illustrated and summarised in Figure 1, 119
encompasses the EGHGE of structural system for tall buildings in the product stage (A1-A3) and the 120
construction stage (A4-A5) as influenced by imposed loads, façade loads and lateral loads. 121
Postpr
int V
ersion

6/49
122
Figure 1 - Scope of the work according to EN 15978:2011 123
124
Postpr
int V
ersion

7/49
1.2 Notions and definitions 125
Among multiple possible definitions, this study adopts the definition for tall buildings proposed by 126
Stafford Smith and Coull [28] coupled with a minimum height criterion. As such, this work defines a tall 127
building as a building with a height of at least 35 m and a structural design which is significantly 128
influenced, because of its height, by lateral forces due to wind or earthquake actions. 129
A structural system is an arrangement of structural elements (e.g. columns, beams, walls and slabs) 130
capable of resisting loads. Tall buildings are generally composed of three structural sub-systems: a 131
lateral load resisting system, which predominantly resists wind and earthquake loads, a vertical load 132
resisting system, which predominantly resists gravity loads, and a foundation system, which transfers 133
all of the loads to the ground [29]. Due to the high influence of lateral loads on the structural design of 134
tall buildings, this paper classifies structural systems of tall buildings based on their lateral load-resisting 135
systems. 136
1.3 Structure 137
This paper is structured in 6 Sections. Section 2 describes the inconsistencies in structural design 138
methods between existing comparative LCA studies of structural systems for tall buildings. Section 3 139
describes the method used to demonstrate the influence of structural design methods on the EGHGE 140
of tall buildings. A sensitivity analysis is also conducted and presented in Section 3 to better understand 141
the applicability of the results to taller buildings. Section 4 presents the results of the environmental 142
assessment of each structural system, designed using different structural design and analysis methods. 143
Section 5 discusses the findings before concluding in Section 6. Appendices are included for 144
supplementary information. 145
2 Inconsistencies in structural design methods between existing comparative life 146
cycle assessment studies of structural systems for tall buildings 147
A total of five comparative life cycle assessment (LCA) studies of structural systems for tall buildings 148
have been identified in the existing literature. The case study tall buildings range in height from 15 to 149
120 storeys and are designed to be built in South Korea, Italy or China. The identified studies assess a 150
range of structural systems for tall buildings including rigid frame, braced frame, shear wall, outrigger 151
Postpr
int V
ersion

8/49
and belt, and diagrid. The identified studies also consider reinforced concrete, steel and composite as 152
alternative structural materials. This section presents a detailed review of these studies. 153
Cho et al. [13] conducted a comparative LCA to examine three alternative structural systems made of 154
steel for the design of a 35-storey tall building in Seoul, South Korea. The structural systems (i.e. braced 155
frame and outrigger and belt) were compared according to their life cycle carbon GHG emissions 156
(LCGHGE). All other building parameters (i.e. number of storeys, inter-storey height, structural 157
materials, etc.) were kept constant and thus their effects on the LCGHGE of structural systems 158
remained unexplored. To ensure a sound comparison, the structural systems were deemed to be 159
equivalent via a lateral deflection limit, equal to 1/400th of the building height, against a static wind load. 160
Earthquake loads, which govern the design of some tall buildings in seismically active areas, were not 161
considered in this study. The structural analysis conducted by Cho et al. [13] used finite element 162
modelling while considering an imposed load of 200 kg/m2 (1.96 kPa), which is typical for the design of 163
residential structures. No reduction of imposed loads was established to reflect the low probability of 164
simultaneously subjecting all imposed loads to the entire floor area of a tall building. Additionally, no 165
consideration was given to super-imposed permanent loads that represent the weight of non-structural 166
components such as façades and partitions, which have been shown to significantly affect the dynamic 167
behaviour of tall buildings [30]. The LCGHGE were quantified by Cho et al. [13] using a process-based 168
life cycle inventory (LCI) analysis approach, which has been shown to underestimate embodied 169
environmental flows by a factor of up to four compared to hybrid LCI approaches [17]. The type of 170
bracing in braced frames was shown to be significant for the LCGHGE of structural systems with the 171
Chevron-braced system achieving 5.28% less LCGHGE per gross floor area (GFA) than the X-braced 172
system. The study also found that the use of a braced frame structural system can result in 173
approximately 16% less LCGHGE compared to the outrigger and belt structural system for a 35-storey 174
steel tall building. 175
Foraboschi et al. [14] assessed the embodied energy (EE) of structural systems for tall buildings for 176
heights of 20, 30, 40, 50, 60 and 70 stories and composed of a reinforced concrete (RC) shear wall and 177
either an RC rigid frame or a steel rigid frame. Six different floor types were also considered including 178
a steel-corrugated concrete slab, traditional RC slab and four types of RC slabs with different lightweight 179
products. Other building parameters, which have a significant effect on the structural performance of 180
tall buildings, were kept constant and thus their effects were overlooked. The structural analysis 181
Postpr
int V
ersion

9/49
conducted by Foraboschi et al. [14] accounted for a super-imposed permanent load of 2.5 kN/m2, a 182
façade load of 4 kN/m (applied along the perimeter beams) and a live load of 3 kN/m2. Similar to the 183
study by Cho et al. [13], no imposed load reduction factor was applied as is consistently stipulated by 184
structural design codes. Highlighting the inconsistencies in structural analyses between studies of this 185
nature, the vertical loads considered by Foraboschi et al. [14] were up to 3 times higher than the vertical 186
loads considered by Cho et al. [13]. Wind loads were analysed by Foraboschi et al. [14] according to 187
the Eurocode 1 structural design code using the wind values and coefficients applicable to Genoa, Italy. 188
Foraboschi et al. [14] justified their neglect of earthquake loads by stating that the dynamic behaviour 189
of tall buildings is often governed by their first mode of vibration, which was claimed to not be 190
significantly influenced by earthquake loads. However, this argument might not hold in seismically active 191
regions, as shown by Mendis et al. [31]. To ensure structural equivalency among the considered 192
structural systems, Foraboschi et al. [14] adopted two structural performance criteria: (1) a lateral drift 193
limit for the entire building equal to 1/400th of building height and (2) a vertical displacement limit for 194
horizontal structural elements (i.e beams and slabs) equal to 1/400th of the element span. Despite its 195
systemic incompleteness, a process-based LCI approach was adopted using data from the Inventory 196
of Carbon and Energy (ICE) database to assess the EE of the structural systems. The use of ICE data 197
is problematic due to its averaging of coefficients, regardless of differences in system boundaries, 198
temporal and geographic relevance and LCI techniques, without providing any information on the 199
assumptions used to compile the coefficients [32]. Additionally, despite its major overestimation of 200
material quantities, a static treatment of wind loading was applied. The study concluded that RC rigid 201
frames can result in up to 44% less EE per gross floor area (GFA) than that of steel frames for certain 202
tall building heights. The study also showed that the floor type is the most critical component for tall 203
building structures regarding their EE and that the EE premium-for-height, as defined by the increase 204
in EE/GFA with increasing building height, was not substantial. However, the actual significance of floor 205
types might be substantially lower, and the EE premium-for-height substantially higher, had more 206
realistic and less conservative vertical loads been considered. Interestingly, the study also found that 207
lightweight floor systems possessed more EE/GFA than traditional floor systems and lead to a higher 208
EE for the entire structural system [14]. 209
Zhao and Haojia [12] compared three types of structural systems for a 69-storey building in Changchun, 210
China according to their LCGHGE. The considered structural systems were: (1) an RC shear wall and 211
Postpr
int V
ersion

10/49
frame system, (2) an RC shear wall (core) and frame with a steel outrigger and belt on the 44 th floor 212
and (3) an RC shear wall (core) and frame with two steel outriggers and belts on the 44th and 57th floor. 213
By also using a process-based LCI method with ICE data, Zhao and Haojia [12] found that the 214
EGHGE/GFA of the RC shear wall and frame structural system was 44.9% less than that of the single 215
outrigger and belt structural system and 41.9% less than that of the double outrigger and belt structural 216
system. The study failed to consider important building parameters (e.g. building height, height/width 217
ratio, etc.) and failed to disclose how equivalency was ensured among the considered structural 218
systems. The study also lacked transparency in its structural analysis by not disclosing what structural 219
loads and magnitudes were considered. Thus, these findings by Zhao and Haojia [12] can be deemed 220
questionable and unverifiable due to the lack of transparency in structural analysis and modelling 221
approaches. 222
Moussavi Nadoushani and Akbarnezhad [15] examined rigid frames and braced frames, made of RC 223
or steel, for buildings of 3, 10 and 15 storeys. The scenarios related to the 10 and 15-storey tall building 224
are most relevant to this work. A process-based LCI approach was used by Moussavi Nadoushani and 225
Akbarnezhad [15] to assess the alternative structural systems and materials according to their 226
EGHGE/GFA using data from ICE. The method and criteria for ensuring structural equivalency among 227
the considered alternative systems was not specified. The structural loads were clearly outlined and 228
include a superimposed permanent load of 370 kg/m2 (3.63 kPa) and an imposed load of 200 kg/m2 229
(1.92 kPa). However, earthquake loads were the only lateral loads that were considered by Moussavi 230
Nadoushani and Akbarnezhad [15], completely neglecting the effects of wind loads. Additionally, this 231
study failed to apply an imposed load reduction factor as required by structural design codes. The 232
combination of overestimating vertical loads and underestimating lateral loads could lead to false 233
conclusions related to the relative importance of vertical and lateral load resisting systems on the 234
embodied environmental flows of tall buildings. The results of the study by Moussavi Nadoushani and 235
Akbarnezhad [15] showed that the 15-storey steel braced frame had the lowest EGHGE/GFA of all the 236
considered structural systems, 22.18% less than that of the RC rigid frame, 13.95% less than that of 237
RC shear wall and 9.50% less than that of the steel rigid frame. 238
A research report by the Council of Tall Buildings and Urban Habitat (CTBUH) titled ‘Life Cycle 239
Assessment of Tall Building Structural Systems’ examined the EE and global warming potential (GWP) 240
of two types of structural systems, namely shear wall (core) and frame system and diagrid system, for 241
Postpr
int V
ersion

11/49
60-storey and 120-storey tall buildings [16]. The EE and GWP of the structural systems were quantified 242
using a process-based life cycle inventory (LCI) analysis approach with data for steel from the EcoInvent 243
and Worldsteel databases and data for concrete from various environmental product declarations 244
(EPDs). In addition to various structural systems and building heights, this report also considered 245
scenarios with various structural materials (i.e. RC, steel and composite) and dimensions of structural 246
elements (wide/shallow beams and narrow/deep beams). Despite neglecting the effects of influential 247
building parameters such as inter-storey height and height-to-width ratio, more building parameters 248
were considered in this study than in any other study of a similar nature. However, this study by 249
Trabucco et al. [16] lacks transparency in structural analysis methods and data by merely stating that 250
the design of the tall buildings was assigned to the participating structural engineering firms. The report 251
found that steel scenarios had better environmental performance as measured by GWP values while 252
RC scenarios had lower EE [16]. The study also found that horizontal structural elements (beams, floor 253
slabs, etc) represent a significant portion of the weight of tall buildings, yet their significance decreases 254
as the height of buildings increases. Transportation of construction material and demolition waste was 255
found to not be a significant factor in the LCA of tall buildings, with values ranging between 1% to 2.5% 256
of total GWP and 0.9% to 3.2% of total EE [16]. 257
In light of above, previous studies commonly consider the lateral loads acting on structural systems, 258
such as wind and earthquakes, to be static in nature which could lead to a significant overestimation of 259
the materials needed to satisfy structural design criteria [25, 31]. Moreover, none of the reviewed studies 260
considered the simultaneous application of both wind and earthquake loads as stipulated by all 261
structural design codes and standards. Incomplete structural analysis affects the validity of their 262
conclusions regarding the environmental performance of structural systems. Additionally, the existing 263
comparative LCA studies on the structural systems for tall buildings lack the required levels of 264
transparency and data accessibility for their results to be comparable and reproducible and their 265
conclusions to be validated. Figure 2.1 summarises the inconsistencies in structural design methods 266
between existing comparative LCA studies of structural systems for tall buildings. 267
Postpr
int V
ersion

12/49
268
269
270
271
272
Figure 2.1 - Inconsistencies in structural design methods between existing comparative life cycle assessment studies of structural systems for tall buildings 273
274
Postpr
int V
ersion

13/49
In summary, existing comparative LCA studies of alternative structural systems for tall buildings use 275
inconsistent and incomplete structural design methods and environmental assessment methods that 276
have been shown to suffer from systemic incompleteness. Consequently, these studies do not yield 277
reliable findings that can help guide architects and engineers in selecting structural systems for tall 278
buildings to minimise their EGHGE. 279
This paper focuses on the influence of structural design methods on the EGHGE of structural systems 280
to help guide future comparative LCA studies on alternative structural systems for tall buildings to 281
reduce their embodied environmental flows. It uses a consistent and comprehensive hybrid LCI 282
approach. 283
3 Method 284
Parametric modelling is adopted to assess the relationship between structural design methods and the 285
required quantities of structural materials for tall buildings. This method of modelling is presented in 286
Section 3.1. Due to the complex process of structural design for tall buildings, which involves equations 287
with millions of unknowns, finite element modelling and analysis is used to ensure that structural 288
systems are structurally adequate and meet the required performance criteria. The method of finite 289
element modelling and analysis is presented in Section 3.2. The material quantities, which are derived 290
and extracted from the finite element models, are then converted to embodied greenhouse gas 291
emissions (EGHGE) using an input-output-based hybrid life cycle inventory method, as presented in 292
Section 3.3. Finally, the method for sensitivity analysis is presented in Section 4.4 to assess the 293
applicability of the results to taller buildings. Figure 3.1 summarises the overall research method and 294
strategy. 295
Postpr
int V
ersion

14/49
296
Figure 3.1 - Overall research method and strategy 297
298
3.1 Parametric modelling 299
To understand the influence of structural design methods on the embodied GHG emissions (EGHGE) 300
of tall buildings, 80 finite element models were constructed using different structural design methods 301
related to imposed loads, façade loads and lateral loads. The relevant Australian standards for structural 302
design are adopted by this paper to ensure that all the constructed finite element models meet the 303
Postpr
int V
ersion

15/49
required structural performance criteria. Reference is regularly made to other design standards to 304
highlight the potential replicability of this study to other regions. 305
To isolate the influence of structural design methods, material properties and geometric properties 306
related to floor plan shape and width, column span and inter-storey heights are kept constant. As seen 307
in Table 3.1, these building parameters and their values were selected based on best and common 308
practices in the design and construction of tall buildings. 309
Table 3.1 - Building properties and values used in all constructed finite element models 310
Building property Values Justification of values
Structural material Reinforced concrete
(32 MPa)
Reinforced concrete remains to be the most commonly used structural material for tall
buildings [33].
Floor plan shape Square A 30 m to 40 m square floor plan represents the most commonly used floor plan shape and
dimensions for tall buildings [25]. Width 36 m
Column Span 7.2 m
Column spans for tall buildings are often dictated by the required column layout of the
parking levels. A typical span of 7.2 m allows 3 cars to be parked within a span [34].
Inter-storey height 3.5 m This value represents a typical inter-storey
height for tall buildings [35].
Six finite element models with heights of 5, 10, 15, 20, 25 and 30 storeys were constructed to establish 311
the base case models to which the rest of the finite element models are compared. The 5-storey 312
buildings are included in this study to determine if the influence of structural methods on the EGHGE of 313
structural systems differs between low-rise buildings and tall buildings. Figure 3.2 presents the floor 314
plan drawing of the base case models. Figure 3.3 presents schematic 3-dimensional drawings of the 5, 315
10 and 15-storey base case models. 316
317
Postpr
int V
ersion

16/49
318
Figure 3.2 - Floor plan drawing of the base case finite element models (FEMs) 319
320
321
Figure 3.3 - Schematic 3-dimensional drawings of the 5, 10 and 15-storey base case models 322
No laterals loads were included in the design of the base case models. An imposed load of 2 kPa was 323
uniformly distributed across their floor slabs to account for loads that result from the intended use of the 324
structure. This is in line with the design requirements for residential structures as prescribed by 325
Australian standard AS1170.1:2002 Structural design actions: Part 1: Permanent, imposed and other 326
actions. Similar requirements are prescribed by the European structural design standard Eurocode 1 327
(1.5 - 2 kPa) and the American structural design standard ACSE 7-02 (1.92 kPa) for residential 328
structures. 329
Postpr
int V
ersion

17/49
A façade load of 3.5 kN/m was imposed on the perimeter beams in the design of the base case models. 330
This load represents the self-weight of the façade, which corresponds to a mass of approximately 357 331
kg/m. As prescribed by Australian standards AS1170:2002, a 1 kPa super-imposed permanent load 332
was considered as a uniformly distributed load across the floor slabs to represent the weight of non-333
structural components such as partitions. Table 3.2 summarises the structural loads imposed on the 334
base case models. 335
Table 3.2 - Structural loads considered in the design of the base case models 336
Considered loads Values
Permanent loads Based on building
geometry and material densities
Imposed loads 2 kPa
Super-imposed loads 1 kPa
Façade loads 3.5 kN/m
Changes in structural methods were made in constructing the other 74 finite element models. A 337
reinforced concrete shear wall was added to the models that consider lateral loads in order to increase 338
their lateral stiffness against wind and/or earthquake loads. A shear wall structural system was chosen 339
since it is the most commonly used lateral load resisting system for buildings of that height [29]. Shear 340
walls have been shown to have substantial in-plane stiffness and strength which make them act as 341
highly efficient braces for tall buildings [36]. Structural equivalency across the finite element modes is 342
established by constraining lateral displacements to acceptable serviceability levels in response to wind 343
and earthquake loads. Acceptable lateral displacements are adopted to limit damage to non-structural 344
components, such as façade, partitions and interior finishes. A commonly used lateral displacement 345
limit equal to 1/400th of the building height is adopted. These models were also designed by varying 346
imposed loads, imposed load reduction factors and façade loads to assess their influence on the 347
EGHGE of structural systems. Appendix A includes a list of these models, along with the adopted 348
structural design methods. 349
The following section introduces the adopted finite element modelling method for the structural design 350
and analysis of tall buildings. 351
Postpr
int V
ersion

18/49
3.2 Finite element modelling and analysis of structural systems 352
The finite element method is a type of numerical method for approximating the solution of complicated 353
problems of engineering and mathematical physics. It involves subdividing complex systems into their 354
individual components or ‘elements,’ whose behaviour is well understood, and reconstructing the 355
original systems using these elements to study their overall behaviour [37]. This method of discretisation 356
involves an approximation, which approaches the true solution of a continuous problem as the number 357
of elements increases. 358
The finite element method emerged during the 1940s with the publication of seminal works by 359
Hrennikoff [38], McHenry [39] and Newmark [40] who showed how approximations of 2-dimensional 360
elastic continuum problems can be obtained by using an arrangement of line (1-dimensional) elements. 361
Since then, the finite element method has expanded to many fields and is commonly used to analyse 362
both structural problems (stress analysis, buckling, vibration analysis, etc.) and non-structural problems 363
(heat transfer, fluid flows, distribution of electric or magnetic potential, etc.). When used for structural 364
engineering purposes, the finite element method is a powerful method for computing the displacements 365
of a structure under loading. Since the 1960s, with the advent of digital computers and their rapid rise 366
in processing power, extensive advances have been made in the application of the finite element 367
method to solve complicated engineering problems, particularly in the structural design of tall buildings. 368
The commercial software ETABS [41] is used by this study for the finite element modelling and analysis 369
of tall buildings. ETABS is widely regarded as one of the most reliable and powerful structural analysis 370
and design software for multi-storey buildings. The software provides both static and dynamic analyses 371
for a wide range of loads. It has been used for the design and analysis of some of the most complex 372
and iconic tall buildings in the world, including Burj Khalifa, which is the tallest building in the world as 373
of 2019 [42, 43]. Sections 3.2.1 to 3.2.3 discuss the methods of modelling materials, sections and lateral 374
loads, respectively. 375
3.2.1 Modelling material properties 376
Reinforced concrete is a composite material that exhibits nonlinear behaviour due to the complex 377
interaction between its steel and concrete components [44]. Modelling this material nonlinearity is a 378
challenge in the structural modelling of tall buildings and is typically simplified using a modified linear-379
elastic analysis approach [45]. The approach involves reducing the stiffness of individual structural 380
Postpr
int V
ersion

19/49
members to account for material nonlinearity and the resulting effect of cracking in reinforced concrete 381
structures. None of the studies reviewed in Section 2 mentioned any consideration taken for modelling 382
the phenomenon of cracking in reinforced concrete. This may lead to a significant underestimation of 383
material quantities, which might influence the selection of alternative structural systems and materials 384
based on their EGHGE. 385
Structural design codes typically recommend the use of one stiffness modifier per structural element 386
type [46]. However, some structural elements may have varying stiffnesses based on the magnitude of 387
loading and their location within a structural system. Despite this simplification, single stiffness modifiers 388
per structural element type tend to capture the central tendency of effective stiffness values across a 389
tall building [46]. The Australian standard for concrete structures AS3600:2009 omits the stipulation of 390
structural modelling and analysis methods that account for material nonlinearity and cracking of 391
reinforced concrete. As such, this study adopts the stiffnesses modification factors recommended by 392
the European standard Eurocode 8 (EN1998-3) [47], which states that a 50% reduction in the elastic 393
flexural and shear stiffness properties must be applied to reinforced concrete structural element. These 394
modification factors are adopted in all the constructed finite element models to accurately model the 395
behaviour of reinforced concrete and avoid underestimating the EGHGE of structural systems. 396
3.2.2 Modelling section properties 397
When creating finite element models composed of reinforced concrete frame objects (i.e. columns and 398
beams), initial preliminary member sizes for analysis are not necessary. Instead, an ‘auto-select’ section 399
property, which is a list of section sizes rather than a single section size, was applied to the frame 400
objects. Upon assigning the auto-select function to the frame objects, ETABS optimises and selects the 401
most economical, adequate section from the auto-select list. Columns of a square cross-sectional area, 402
from 25 cm to 90 cm in width, were added to the column auto-select list using increments of 2.5 cm. 403
Similarly, square beams from 25 cm to 45 cm in width were added to the beam ‘auto-select’ list using 404
increments of 2.5 cm. This optimisation process ensures that the reinforced concrete structural systems 405
can be compared according to their lowest possible EGHGE. Naturally, in the design and construction 406
of tall buildings, other factors are considered when selecting section sizes, often to reduce complexity 407
and improve constructability. However, this study favoured optimisation to assess the maximum 408
Postpr
int V
ersion

20/49
potential savings in EGHGE when assessing alternative structural systems. This is further discussed in 409
Section 5.3. 410
Floor slabs were modelled as rigid diaphragms and thus assumed to translate in plan and rotate about 411
a vertical axis as a rigid body. This modelling techniques assumes that there are no in-plane 412
deformations in the floor slab. The method of modelling floors slabs as rigid floor diaphragms for tall 413
buildings has been used extensively in practice to lend computational efficiency to the complex solution 414
process [42]. 415
3.2.3 Modelling lateral loads 416
This section introduces the methods of modelling lateral loads. Sections 3.2.3.1 discusses the method 417
of modelling wind loads and Section 3.2.3.2 discusses two different methods of modelling earthquake 418
loads. 419
3.2.3.1 Modelling wind loads 420
Complex, large, and aerodynamically sensitive structures frequently require wind tunnel testing or more 421
sophisticated dynamic analysis, such as computational fluid dynamics, to ensure occupant comfort 422
during windstorms. However, buildings less than or equal to 200 m in height are typically designed 423
using a quasi-static approach whereby a dynamic coefficient is used to increase the equivalent static 424
wind load to an acceptable level [48, 49]. Since the tallest modelled building in this study is 105 m in 425
height, this study adopts a quasi-static approach as stipulated by the Australian standard AS 426
1170.2:2011 Structural Design Actions - Part 2 - Wind Actions [49]. 427
The Australian standard AS 1170.2:2011 recommends modifying wind velocity measurements to 428
account for variables such as direction, season, orography, height, roughness and turbulence using 429
recommended empirical formulas based on stochastic modelling. Twelve wind coefficients are required 430
and used as input to generate wind loads according to AS/NZS 1170.2:2002. These wind coefficients 431
are listed in Table 3.3. These factors, which are similar across all design standards, globally, have the 432
potential to affect the required material quantities and their associated EGHGE. None of the reviewed 433
studies in Section 2 specify what values were used for these modification variables. This lack of 434
transparency, in both methods and data, prohibits the comparability of structural systems for tall 435
buildings based on EGHGE. 436
Postpr
int V
ersion

21/49
Table 3.3 - Wind coefficients to generate wind loads according to AS/NZA 1170.2:2002 437
Wind Load Inputs Values Justification of values
Regional wind speed (VR) 46 m/s Described in AS/NZS 1170.2:2011 Section 3.2
Wind direction multiplier (Md) 1 Described in AS/NZS 1170.2:2011 Section 3.3
Terrain category (Mz,cat) 4 Described in AS/NZS 1170.2:2011 Section 4.2
Shielding multiplier (Ms) 1 Described in AS/NZS 1170.2:2011 Section 4.3
Topographic multiplier (Mt) 1 Described in AS/NZS 1170.2:2011 Section 4.4
Windward coefficient (Cpw) 0.8 Described in AS/NZS 1170.2:2011 Section 5.2
Leeward coefficient (Cpl) 0.5 Described in AS/NZS 1170.2:2011 Section 5.2
Area reduction factor (Ka) 1 Described in AS/NZS 1170.2:2011 Section 5.4.2
Combination factor (Kc) 1 Described in AS/NZS 1170.2:2011 Section 5.4.3
Local pressure factor (Kl) 1 Described in AS/NZS 1170.2:2011 Section 5.4.4
Porous cladding factor (Kp) 1 Described in AS/NZS 1170.2:2011 Section 5.4.5
Dynamic response factor (Cdyn) * Described in AS/NZS 1170.2:2011 Section 6.1
*: For structures with a first mode fundamental frequency greater than 1 Hz, Cdyn =1.0. For structures 438
with a first mode fundamental frequencies between 0.2 Hz and 1 Hz, Cdyn was computed in accordance 439
with AS/NZS 1170.2:2002 Section 6.1. None of the modelled buildings had a first mode fundamental 440
frequency less than 0.2 Hz. 441
Appendix B illustrates the process of calculating static wind loads as prescribed by the Australian 442
standard AS1170.2:2011. 443
3.2.3.2 Modelling earthquake loads 444
The general purpose of designing structures for earthquake resistance is to ensure that in the event of 445
earthquakes, human lives are protected, damage is limited and structures remain operational [50, 51]. 446
Fulfilling these purposes might be incomplete and measured in probabilistic terms due to the random 447
and severe nature of earthquakes. In order to assess the influence of different structural design methods 448
related to earthquake loads on the EGHGE of structural systems, the following two methods of seismic 449
analysis are adopted for different finite element models (see Table 3.1): Equivalent Lateral Force 450
Method, which is a static linear analysis method, and Response Spectrum Analysis, which is a dynamic 451
linear analysis method. The main purpose of adopting the two different methods is to assess the 452
influence of static versus dynamic modelling of earthquake loads on the EGHGE of structural systems 453
for tall buildings. 454
The Equivalent Static Force Method reduces the dynamic nature of earthquakes to an equivalent static 455
load [52]. Structural design codes that propose using this method set limitations of its use related to the 456
Postpr
int V
ersion

22/49
location, height, geometric regularity and material regularity of a structure [47, 51, 53]. Appendix C 457
illustrates the equivalent static analysis procedure as presented in the Australian standard 458
AS1170.4:2007 Structural Design Actions - Part 4 - Earthquake Actions 459
For the finite element models that were designed using the Equivalent Static Force Method (see 460
Appendix A), a variety of factors were considered related to the building importance level, dynamic 461
building properties, site conditions and the building weight and height distribution in line with Australian 462
standard AS 1170.4:2007 Structural Design Actions - Part 4 - Earthquake Actions. The values of these 463
factors alter the influence of earthquake loads, which affect material intensities and associated EGHGE. 464
None of the reviewed studies in Section 2 contain this level of transparency, which is necessary for the 465
comparability of structural systems across existing life cycle assessment (LCA) studies. The adopted 466
values for the factors used to calculate the equivalent static earthquake loads are listed in Table 3.4. 467
Table 3.4 - Earthquake coefficients to generate earthquake loads according to AS1170.4:2007 468
Earthquake Load Inputs Values Justification of values
Site subsoil class D Described in AS/NZS 1170.4:2007 Section 4.2.
Probability factor (kp) 1.1 Described in AS/NZS 1170.4:2007 Section 3.1.
Hazard factor (Z) 0.08 Described in AS/NZS 1170.4:2007 Section 3.2.
Performance factor (Sp) 0.77 Described in AS/NZS 1170.4:2007 Section 6.5.
Ductility factor (u) 2 Described in AS/NZS 1170.4:2007 Section 6.5.
469
To assess the influence of static versus dynamic earthquake modelling and analysis, the Response-470
Spectrum Analysis was used to calculate and assign dynamic earthquake loads to other finite element 471
models (see Appendix A). This is a linear-dynamic statistical analysis method that measures the 472
contribution from each natural movement patter to indicate the likely maximum seismic response of an 473
essentially elastic structure [52]. These movement patterns, termed ‘mode shapes’ or ‘natural modes 474
of vibrations’, represent natural properties of a structure in free vibration that depend only on its mass 475
and stiffness. While the mass of a building is distributed throughout the building, it can be idealised as 476
concentrated at floor levels and supported by a massless frame [54]. This assumption is generally 477
appropriate for tall buildings because most of the building mass is concentrated at the floor levels. The 478
Response-Spectrum Analysis method is illustrated in Appendix D. 479
Postpr
int V
ersion

23/49
The modal dynamic analysis method has the advantage of being able to model the effects of the higher 480
modes of vibrations more explicitly and accurately than the Equivalent Static Analysis procedure. This 481
accuracy in structural modelling and analysis has the potential of decreasing the resulting EGHGE of 482
tall buildings. 483
3.2.4 Modelling simultaneous application of loads 484
All tall buildings will experience most, if not all, of the loads described in Sections 3.1 to 3.2.3. The 485
challenge of structural design is to determine the governing combination of loads and design a tall 486
building accordingly. To ensure safety and consistency, structural design standards recommend load 487
combinations that reflect probable and conservative loading conditions. The load combinations that are 488
adopted by this paper for the structural design of tall buildings, are listed in Section 4 of Australian 489
standard AS1170.0:2002, and include 1.2×Permanent Load (G) + 1.5×Imposed Load (Q), 1.35×G, 490
1.2×G + 0.4×Q + Wind (W), 1.2×G + 0.4×Q + Earthquake (E) and 16 other load combinations. 491
3.3 Quantifying the embodied greenhouse gas emissions of structural systems 492
This section discusses the selection of the LCA technique adopted by this paper to convert the derived 493
quantities of structural materials to EGHGE. 494
Having modelled, analysed and optimised the structural systems using finite element modelling, 495
structural material quantities can be easily extracted from the models. A streamlined LCA can then be 496
performed to quantify their EGHGE to understand the influence of various structural design methods. 497
The quantification of EGHGE can be undertaken using any of the conventional life cycle inventory (LCI) 498
analysis techniques, which are process analysis, environmentally-extended input-output analysis or 499
hybrid analysis. 500
Process analysis relies on data specific to the considered product or service to calculate its inputs, 501
outputs and resulting environmental effects across its life cycle [55]. The specificity of process-based 502
approaches yields a high level of accuracy but the cost of this specificity is systemic incompleteness 503
due to the difficulty of exhaustively assessing the supply chain of a product [17, 20, 56]. Crawford [17] 504
showed that this truncation error can be up to 87% of the embodied energy (EE) of a building material 505
or product, thus demonstrating that process analysis can greatly underestimate EE in buildings. 506
Postpr
int V
ersion

24/49
By assuming that economic flows provide a fair indication of physical flows, input-output tables, which 507
provide valuable information about the structure and interdependencies of economies, can be used to 508
perform an environmentally-extended input-output analysis (EEIOA). This can be done by integrating 509
environmental data of the correct format, such as gigajoules of energy or tonnes of carbon dioxide 510
emissions, with macroeconomic consumption activity data [56, 57]. This procedure facilitates the 511
calculation of upstream and indirect environmental effects, which are not exhaustively captured by the 512
process-based LCI approach. Input-output data is typically aggregated at the industry and product 513
group level. For example, the input-output tables of the Australian National Accounts of 2015-2016 514
show that $20.4b AUD of the Residential Building Construction product group was produced by the 515
Construction Services industry while $10.3b AUD of the product group was produced by the Non-516
Residential Building Construction industry and so on, resulting in a total of $87.5 AUD of this product 517
being produced by all industries [58]. Such aggregation in the assessment of a product system like 518
residential buildings leads to a loss of useful specificity, such as the distinction between low-rise and 519
high-rise residential buildings, making it difficult to assess specific products and services taking place 520
within the same sector [20, 59]. 521
To address the limitations inherent in both process and input-output based approaches, various hybrid 522
LCI analyses techniques have been proposed to combine process and input-output data. The four main 523
hybrid LCI approaches that have been identified in the literature are Tiered, Matrix Augmentation, 524
Integrated and Path Exchange (PXC). These approaches are detailed in the study by Crawford et al. 525
[19]. Only the PXC method is discussed below, as it is the method selected for this work. 526
Of all the developed hybrid analysis techniques, the PXC method, first developed by Treloar [60] and 527
later formalised by Lenzen and Crawford [59], remains to be the most efficient LCI method, globally, 528
while maintaining comprehensive coverage of the system. The PXC method, also known as an input-529
output-based hybrid method, involves the mathematical disaggregation of an input-output table to 530
enable the identification and modification of mutually exclusive pathways [59]. Each pathway represents 531
a series of nodes that corresponds to a chain of transactions leading up to a sector. The input-output 532
pathways that are equivalent to the known process are replaced with specific process-based data. 533
Doing so allows this method to maintain system boundary completeness while increasing specificity. 534
Due to its comprehensiveness and relevance to Australian construction material, this paper uses the 535
Environmental Performance in Construction (EPiC) database of embodied environmental flow 536
Postpr
int V
ersion

25/49
coefficients compiled by Crawford et al. [61] using the PXC method for hybridisation and detailed in 537
Stephan et al. [32]. The embodied environmental GHG emissions of structural systems in tall buildings 538
are calculated using the following equation: 539
𝐸𝐺𝐻𝐺𝐸𝑆𝑆 = ∑ (𝑄𝑚,𝑆𝑆 + 𝐸𝐺𝐻𝐺𝐸𝐶𝑚)
𝑀
𝑚=1
(Eq. 3.1)
Where EGHGESS = embodied greenhouse gas emissions of structural system SS per net floor area in 540
kgCO2-e/m2; Qm,SS = quantity of material m per Net Floor Area (NFA) in structural system SS (e.g. steel 541
in kg/m2); and EGHGECm = embodied GHG emissions coefficient of material m (e.g. 2.90 kgCO2-e/kg 542
for hot-rolled steel and 0.17 kgCO2-e/kg for 32 MPa concrete). 543
Equation 3.1 yields the initial EGHGE per Net Floor Area (NFA) of structural systems. As previously 544
discussed, the recurring EGHGE of structural systems are considered to be negligible because 545
structural systems are designed to perform their intended function throughout their design working life 546
with minimum maintenance and no structural repair being necessary [25]. Additionally, this study 547
favoured the use of NFA, which is the area of functional spaces, over Gross Floor Area (GFA) due to 548
the eminent loss of functional space when shear walls are added to the structural systems of tall 549
buildings (e.g. 5% loss of functional space). 550
3.4 Sensitivity analysis 551
To assess the applicability of the results to buildings taller than 30 storeys, 2 finite element models are 552
constructed for a 50-storey tall building. More specifically, since imposed loads and façade loads 553
increase linearly with building height, whereas lateral loads increase exponentially, the 2 finite element 554
models are only used to assess the applicability of the results pertaining to lateral loads. As such, one 555
finite element model is designed with no consideration to lateral loads and the other is designed with 556
consideration to the simultaneous application of both static wind loads and dynamic earthquake loads. 557
The embodied GHG emissions (EGHGE) per Net Floor Area (NFA) of the models are compared to the 558
trends identifies in the results. 559
4 Results 560
This section presents the results of the study. The material quantities of all 80 finite element models 561
were extracted, converted to embodied GHG emissions (EGHGE) and normalised per net floor area 562
Postpr
int V
ersion

26/49
(NFA) to enable better comparisons. The influence of imposed loads, façade loads and lateral loads on 563
the EGHGE of structural systems are presented in Sections 4.1, 4.2 and 4.3, respectively. In these 564
sections, the influence of the loads on the EGHGE/NFA of the structural systems is first presented. 565
Subsequently, the influence of the loads on EGHGE/NFA is quantified per load functional unit (i.e. per 566
1 kPa for imposed loads, per 1 kN/m for façade loads and per 10 MNm of overturning moment for lateral 567
loads). A regression analysis is also conducted in these sections to develop regression lines that 568
examine and predict the relationship between structural loads and the EGHGE/NFA of structural 569
system. Finally, the results of the sensitivity analysis are presented in Section 4.4. 570
4.1 The influence of imposed loads on the embodied greenhouse gas emissions of 571
structural systems 572
As mentioned in Section 3.1, a 2 kPa imposed load was applied to the 6 base case models ranging in 573
height from 5 to 30 storeys. This typically represents the design requirements, pertaining to imposed 574
loads, for designing residential structures [62]. To assess the influence of imposed loads on the EGHGE 575
of structural systems, the imposed loads were increased to 3 kPa and 4 kPa, which typically correspond 576
to the design requirements of office buildings and retail buildings, respectively [62]. The resulting 577
EGHGE/NFA values are plotted against the number of storeys and presented in Figure 4.1. 578
579 Figure 4.1 - Influence of imposed loads on the embodied greenhouse gas emissions per net floor area 580
(EGHGE/NFA) of structural systems. Note: vertical axis starts at 150 kgCO2-e/m2. 581
Figure 4.1 shows that an increase of 1 kPa in imposed loads resulted in an increase of between 3% 582
and 5% in the EGHGE/NFA of structural systems. The results also indicate that when lateral loads are 583
150
160
170
180
190
200
210
220
5 10 15 20 25 30
EGH
GE/
NFA
(kg
CO
2-e/
m2 )
Number of storeys
4 kPa Imposed Load
3 kPa Imposed Load
2 kPa Imposed Load
Postpr
int V
ersion

27/49
not considered in the design of tall buildings, the EGHGE/NFA of structural systems increase linearly 584
with increasing building height (approximately 10% in EGHGE/NFA per 10-storey increase in building 585
height). 586
To better assess the influence of imposed loads on the EGHGE of structural systems, Figure 4.2 587
demonstrates the increase in EGHGE/NFA for a 1 kPa increase in imposed loads plotted against 588
building height. The resulting trendline, which was constructed using a linear regression analysis, is 589
displayed as a dotted line on Figure 4.2. The data points associated with the 5-storey models are 590
excluded from the regression analysis to better describe the influence of imposed loads on the EGHGE 591
of tall buildings. 592
593 Figure 4.2 – Influence of 1 kPa increase in imposed loads on embodied greenhouse gas emissions 594
per net floor area (EGHGE/NFA) of structural systems 595
As seen in Figure 4.2, there is a linear growth in EGHGE/NFA per 1 kPa increase in imposed loads with 596
increasing height of tall buildings. The coefficient of determination (R2) for the sample of derived values 597
is significantly high and approximately equal to 0.99. This value represents the proportion of variance 598
in the EGHGE/NFA values that is predictable from the increase in imposed loads. The equation for the 599
linear regression line is expressed below: 600
∆𝐸𝐺𝐻𝐺𝐸𝑆𝑆/∆𝐼𝐿 = 0.18𝑁𝑆 + 2.07 (Eq. 4.1)
Where ΔEGHGESS/ΔIL = change in embodied greenhouse gas emissions of structural system SS per 601
net floor area for 1 kPa increase in imposed loads in kgCO2-e/m2/kPa; and NS = number of storeys. 602
Equation 4.1 can be used to predict the increase in EGHGE/NFA by adopting a higher rating of imposed 603
loads. More broadly, Equation 4.1 can be used to quantify the added EGHGE of structural systems for 604
R² = 0.9922
0
1
2
3
4
5
6
7
8
10 15 20 25 30
Incr
ease
in E
GH
GE/
NFA
per
1 k
Pa
incr
ease
in
imp
ose
d lo
ads
(kgC
O2-
e/m
2 /kP
a)
Number of storeys
Postpr
int V
ersion

28/49
tall buildings when considering more conservative imposed loads. For example, by interpolation, 605
Equation 4.1 predicts that a 27-storey reinforced concrete building would exhibit an increase of 6.93 606
kgCO2-e/m2 in EGHGE/NFA for an additional 1 kPa increase in imposed loads. With a 36 m by 36 m 607
floor plan, this translates to a predicted increase of more than 240,000 kgCO2-e. This is equivalent to 608
the annual GHG emissions of more than 14 Australian citizens on average [63]. This is also equivalent 609
to the GHG emissions produced by a fleet of 750 cars driving from Melbourne to Sydney and back, 610
considering that the average GHG per kilometre of a new light vehicle sold in Australia is 0.182 kgCO2-611
e/km [64]. 612
Applying imposed load reduction factors, used to reflect the low probability of simultaneously subjecting 613
all imposed loads to the entire floor area of a tall building, as required by Australian standard 614
AS1170.1:2002, had no significant impact on the EGHGE/NFA of structural system. Upon application 615
of the imposed load reduction factors, other load combinations, which exclude imposed loads, governed 616
the design and produced similar results. 617
4.2 The influence of façade loads on the embodied greenhouse gas emissions of 618
structural systems 619
In designing the base case models, a façade load of 3.5 kN/m was imposed on the perimeter beams of 620
the structural systems. To assess the influence of façade loads on the EGHGE of structural systems, 621
the façade load was changed to 4.5 kN/m and 5.5 kN/m in constructing 12 other models ranging in 622
height from 5 to 30 storeys. The resulting EGHGE/NFA values are plotted against the number of storeys 623
in Figure 4.3. 624
Postpr
int V
ersion

29/49
625 Figure 4.3 - Influence of façade loads on embodied greenhouse gas emissions per net floor area 626
(EGHGE/NFA) of structural systems. Note: vertical axis starts at 150 kgCO2-e/m2. 627
Figure 4.3 shows that façade loads have a minor influence on the EGHGE/NFA of structural systems 628
for tall buildings. Since façade loads are only applied to the perimeter of buildings, their influence on 629
the required materials and subsequent EGHGE of structural system is limited. 630
To better understand the influence of façade loads on the embodied environmental flows of structural 631
systems, Figure 4.4 demonstrates the increase in EGHGE/NFA for a 1 kN/m increase in façade loads. 632
The resulting linear regression line is displayed on Figure 4.4. The values associated with the 5-storey 633
models were also excluded from the regression analysis to isolate the effect of façade loads on the 634
EGHGE of structural systems in tall buildings. 635
636
150
155
160
165
170
175
180
185
190
195
200
5 10 15 20 25 30
EGH
GE/
NFA
(kg
CO
2-e/
m2 )
Number of storeys
5.5 kN/m Façade Load
4.5 kN/m Façade Load
3.5 kN/m Façade Load
R² = 0.6153
0.00
0.20
0.40
0.60
0.80
1.00
1.20
10 15 20 25 30
Incr
ease
in E
GH
GE/
NFA
per
1 k
N/m
incr
ease
in
faç
ade
load
s (k
gCO
2-e/
m2 /
(kN
/m))
Number of storeys
Postpr
int V
ersion

30/49
Figure 4.4 - Influence of 1 kN/m increase in façade loads on embodied greenhouse gas emissions per 637
net floor area (EGHGE/NFA) of structural systems 638
As seen in Figure 4.2, there is a linear growth in EGHGE/NFA per 1 kN/m increase in façade loads with 639
increasing building height. The coefficient of determination (R2) for the sample of derived values is 640
approximately equal to 0.62. The remaining proportion of variance could partly be attributed to the 641
discrete optimisation process that selects the optimal frame member from a discreet list of structural 642
members. The equation for the derived linear trendline is expressed below: 643
∆𝐸𝐺𝐻𝐺𝐸𝑆𝑆/∆𝐹𝐿 = 0.02𝑁𝑆 + 0.3
(𝑅2 = 0.62)
(Eq. 4.2)
Where ΔEGHGESS/ΔFL = the change in embodied greenhouse gas emissions of structural system SS 644
per net floor area for every 1 kN/m increase in façade loads in kgCO2-e/m2/(kN/m); and NS = number 645
of storeys. 646
With more limited correlation resulting in higher uncertainty compared to imposed loads, Equation 4.2 647
can be used to estimate the change in EGHGE of structural systems for tall buildings when comparing 648
different façade systems of varying weights. As previously discussed, the influence of façade loads on 649
EGHGE/NFA appears to be minor. However, since tall buildings have a substantial amount of NFA, the 650
absolute increase in EGHGE is worth considering. For example, according to Equation 4.2, an increase 651
of 1 kN/m in façade loads on a 29-storey reinforced concrete building would exhibit an increase of 0.88 652
kgCO2-e/m2. Assuming a square floor plan of 36 m by 36 m, this results in an increase of more than 653
33,000 kgCO2-e in EGHGE, which is equivalent to the GHG emissions produced by a standard car 654
circumnavigating Australia 12 times, assuming a single round trip distance of 14,000 km. 655
4.3 The influence of lateral loads on the embodied greenhouse gas emissions of 656
structural systems 657
As discussed in Section 3.1, no laterals loads were considered in the design of the 6 base case models. 658
To assess the influence of lateral loads on the EGHGE of structural systems, 18 finite elements models 659
were constructed, each with either static wind loads, static earthquake loads, or dynamic earthquake 660
loads imposed on their structural systems. The resulting EGHGE/NFA values are plotted in Figure 4.5. 661
662
Postpr
int V
ersion

31/49
663 Figure 4.5 - Influence of lateral loads on embodied greenhouse gas emissions per net floor area 664
(EGHGE/NFA) of structural systems. Note: vertical axis starts at 150 kgCO2-e/m2. 665
Figure 4.5 shows that modelling earthquake loads as static loads consistently results in structural 666
systems with more EGHGE/NFA compared to modelling earthquake loads as dynamic loads. The 667
relative influence of static wind loads, static earthquake loads and dynamic earthquake loads can be 668
better visualised in Figure 4.6, which plots the percent increase in EGHGE/NFA for each lateral load. 669
670 Figure 4.6 - Influence of lateral loads on the increase of embodied greenhouse gas emissions per net 671
floor area (EGHGE / NFA) of structural systems 672
Figure 4.6 clearly indicates that the influence of both static and dynamic earthquake loads decreases 673
with increasing building height whereas the influence of wind loads remains relatively constant at an 674
increase of 6%. The results also indicate that if earthquake loads are modelled as static loads, the 675
structural systems of tall buildings with 22 storeys or more are governed by wind loads, since their effect 676
150
160
170
180
190
200
210
220
5 10 15 20 25 30
EGH
GE/
NFA
(kg
CO
2-e/
m2 )
Number of storeys
Static Wind Load
Static Earthquake Load
Dynamic Earthquake Load
No Lateral Loads
0%
2%
4%
6%
8%
10%
10 15 20 25 30
Per
cen
t in
crea
se in
EG
HG
E/N
FA
Number of storeys
Static Wind Load
Static Earthquake Loads
Dynamic Earthquake Load
Postpr
int V
ersion

32/49
on EGHGE/NFA is greatest. Whereas, if earthquake loads are modelled as dynamic loads, the 677
structural systems of tall buildings with 13 storeys or more are governed by wind loads. 678
As discussed in Section 3.2.3, lateral loads generate an overturning moment that buildings must be 679
designed to resist for strength, serviceability and stability requirements. By calculating the resulting 680
overturning moment of lateral loads, a relationship can be derived between the magnitude of lateral 681
loads and the EGHGE/NFA of structural systems. Figure 4.7 plots the increase in EGHGE/NFA for a 682
10 MNm increase in overturning moment. 683
684 Figure 4.7 - Influence of overturning moment on the increase of embodied greenhouse gas emissions 685
per net floor area (EGHGE / NFA) of structural systems 686
As seen in Figure 4.7, a regression line is constructed for each of the different types of lateral loads. 687
The coefficient of determination (R2) for the derives values for static wind load, static earthquake load 688
and dynamic earthquake load are all close to 1. This demonstrates that the variation in EGHGE/NFA is 689
effectively completely explained by the variation in overturning moment. This is due to the directly 690
proportional relationship between lateral loads and the resulting overturning moment that structural 691
systems experience. A linear regression analysis is conducted to construct the regression line for static 692
earthquake load (Equation 4.3), while a polynomial equation of the 3rd order is used to construct the 693
regression lines for both static wind load (Equation 4.4) and dynamic earthquake load (Equation 4.5). 694
The regression equations are presented below: 695
∆𝐸𝐺𝐻𝐺𝐸𝑆𝑆/∆𝑆𝐸𝐿 = −0.028𝑁𝑆 + 1.17 (Eq. 4.3)
R² = 0.9987
R² = 0.9943
R² = 0.997
0
1
2
3
4
5
10 15 20 25 30
Incr
ease
in E
GH
GE/
NFA
per
10
MN
m in
crea
se in
o
vert
urn
ing
mo
men
t (k
gCO
2-e/
m2 /
(10
MN
m))
Number of storeys
Static Wind Load
Static Earthquake Load
Dynamic Earthquake Load
Postpr
int V
ersion

33/49
Where ΔEGHGESS/ΔSEL = the change in embodied greenhouse gas emissions of structural system 696
SS per net floor area for every 10 MNm increase in overturning moment resulting from static earthquake 697
loads in kgCO2-e/m2/(10 MNm); and NS = number of storeys. 698
∆𝐸𝐺𝐻𝐺𝐸𝑆𝑆/∆𝑆𝑊𝐿 = −0.0011𝑁𝑆3 + 0.0833𝑁𝑆2 − 2.074𝑁𝑆 + 17.82 (Eq. 4.4)
Where ΔEGHGESS/ΔSWL = the change in embodied greenhouse gas emissions of structural system 699
SS per net floor area for every 10 MNm increase in overturning moment resulting from static wind loads 700
in kgCO2-e/m2/(10 MNm); and NS = number of storeys. 701
∆𝐸𝐺𝐻𝐺𝐸𝑆𝑆/∆𝐷𝐸𝐿 = −0.0004𝑁𝑆3 + 0.028𝑁𝑆2 − 0.63𝑁𝑆 + 3.4 (Eq. 4.5)
Where ΔEGHGESS/ΔDEL = the change in embodied greenhouse gas emissions of structural system 702
SS per net floor area for every 10 MNm increase in overturning moment resulting from dynamic 703
earthquake loads in kgCO2-e/m2/(10 MNm); and NS = number of storeys. 704
By knowing the number of storeys of a tall building, a structural engineer or architect can use Equations 705
4.3 to 4.5 to estimate the increase in EGHGE/NFA of structural systems as a result of the influence of 706
lateral loads on tall buildings. This can help guide and justify structural design decisions that may lead 707
to a decrease in overturning moment by quantifying the resulting decrease in EGHGE of structural 708
systems for tall buildings. 709
To assess the inclusion of both wind and earthquake loads in the structural design of tall building, Figure 710
4.8 plots the resulting EGHGE/NFA of their structural systems. The results show that, upon designing 711
structural systems for the simultaneous application both static wind loads and dynamic earthquake 712
loads, the EGHGE/NFA of structural systems increased by approximately 11% for the 5-storey and 10-713
storey building and 6% for the 15, 20, 25 and 30-storey buildings. This significant increase emphasises 714
the need for comparative life cycle assessment (LCA) studies on alternative structural systems of tall 715
buildings to consider lateral loads during structural design. 716 Postpr
int V
ersion

34/49
717 Figure 4.8 - Influence of combined lateral loads on embodied greenhouse gas emissions per net floor 718
area (EGHGE/NFA) of structural systems. Note: vertical axis starts at 150 kgCO2-e/m2. 719
4.4 Sensitivity analysis results 720
As discussed in Section 3.4, 2 additional finite element models were constructed for a 50-storey tall 721
building to assess the influence of lateral loads with increasing building height on the EGHGE of their 722
structural systems. One of these finite element models was constructed without considering the effects 723
of lateral loads and the other was designed to resist the simultaneous application of both static wind 724
and dynamic earthquake loads. Figure 4.9 plots the EGHGE/NFA of the 50-storey buildings along with 725
all the other finite element models that adopt the same structural design methods. 726
727
150
160
170
180
190
200
210
220
5 10 15 20 25 30
EGH
GE/
NFA
(kg
CO
2-e/
m2 )
Number of storeys
Wind and Static EarthquakeLoads
Wind and Dynamic EarthquakeLoads
No Lateral Loads
150
170
190
210
230
250
270
290
5 10 15 20 25 30 35 40 45 50
EGH
GE/
NFA
(kg
CO
2-e/
m2 )
Number of storeys
Wind and Dynamic EarthquakeLoads
No Lateral LoadsPostpr
int V
ersion

35/49
Figure 4.9 – Sensitivity analysis on influence of combined lateral loads with increasing building height 728
on embodied greenhouse gas emissions per net floor area (EGHGE/NFA) of structural systems for 729
tall buildings 730
The results of the sensitivity analysis clearly show the increasing influence of lateral loads on the 731
EGHGE/NFA of structural systems with increasing building height. Designing the 50-storey tall building 732
to resist the effects of wind and earthquake resulted in a 22% increase in EGHGE/NFA (from 227 733
kgCO2-e/m2 to 277 kgCO2-e/m2). Conversely, tall buildings of 15 to 30 storeys in height experienced a 734
more modest increase of 6% in EGHGE/NFA as a result of the effects of wind and earthquake loads. 735
This finding corroborates the premium-for-height framework, which was described by Khan [11] as the 736
increase in resource use with increasing building height due to the cumulative effect of wind and 737
earthquake loads on the structural systems of tall buildings. 738
5 Discussion 739
The discussion is divided into three sections. Section 5.1 presents the contribution of this paper in 740
comparison to previous comparative life cycle assessment (LCA) studies that assess alternative 741
structural systems for tall buildings. Section 5.2 discusses the practical implications of the findings. 742
Section 5.3 presents the limitations of this study and outlines future research directions. 743
5.1 Contribution 744
This study has quantified for the first time the influence of imposed loads, façade loads and lateral loads 745
on the embodied greenhouse gas emissions (EGHGE) of structural systems, across a range of building 746
heights. In comparison, most existing studies conduct a comparative LCA on alternative structural 747
systems of tall buildings while lacking consistency and comprehensive in the adopted structural design 748
methods. By demonstrating the influence of structural design methods on the EGHGE of structural 749
systems, this paper demonstrates the need for clarity and transparency to increase the comparability 750
between different comparative LCA studies. 751
The equations that were developed in this study can help guide researchers, architects and structural 752
engineers to understand the influence of structural loads and methods on the EGHGE of structural 753
systems. The developed intensities of EGHGE per Net Floor Area (NFA) can also help establish 754
benchmarks for the embodied environmental flows of structural systems for tall buildings. 755
Postpr
int V
ersion

36/49
This study also developed and demonstrated the use of unprecedented functional units such as (kgCO2-756
e/m2)/kPa, (kgCO2-e/m2)/(kN/m), (kgCO2-e/m2)/(MNm) to quantify the influence of imposed loads, 757
façade loads and lateral loads on the EGHGE of structural systems. This type of assessment, and the 758
use of these new functional units, can effectively inform future design frameworks that integrated the 759
environment assessment into the structural design of tall buildings to reduce their EGHGE. 760
5.2 Implications on comparative life cycle assessment of alternative structural 761
systems for tall buildings 762
As discussed in Section 1, a comparative LCA approach is increasingly being used to reduce the 763
EGHGE of structural systems for tall buildings [12-16]. However, these studies use inconsistent and 764
incomplete structural design and analysis methods that have been shown to significantly affect the 765
EGHGE of structural systems. 766
As previously seen in Figure 2.1, existing comparative LCA studies on the structural systems of tall 767
buildings have either used an imposed design load of 2 kPa, as is the case in the studies by Cho et al. 768
[13] and Moussavi Nadoushani and Akbarnezhad [15], or 3 kPa in the case of the study by Foraboschi 769
et al. [14]. Having shown that varying imposed loads can significantly influence the EGHGE of structural 770
systems for tall buildings, the comparison between alternative structural systems across these studies 771
ought to include the adjustment of EGHGE values. The findings of this study suggest that the EGHGE 772
per net floor area (NFA) adjustment could be up to 7.5 kgCO2-e/m2 per 1 kPa increase in imposed loads 773
for the structural design of a 30-storey building. This can be very significant for studies like that of Cho 774
et al. [13] that completely neglect super-imposed permanent loads while studies like that of Moussavi 775
Nadoushani and Akbarnezhad [15] consider a super-imposed permanent load of 3.5 kPa. To perform 776
such adjustments, comparative LCA studies of structural systems for tall building ought to be clear and 777
transparent in their adopted structural design methods. 778
Similarly, existing comparative LCA studies have either used façade loads of 4 kN/m, such as the study 779
by Foraboschi et al. [14], or completely neglected the inclusion of façade loads in the structural design 780
of tall buildings, such as the studies by Cho et al. [13] and Moussavi Nadoushani and Akbarnezhad 781
[15]. The findings of this study suggest that a difference of 4 kN/m in façade loads might lead to an 782
increase of up to 3.6 kgCO2-e/m2 of EGHGE/NFA for the structural system of a 30-storey building. This 783
adjustment is also expected to be greater with increasing building heights. 784
Postpr
int V
ersion

37/49
Moreover, as seen in Figure 2.1, none of the existing comparative LCA studies of structural systems for 785
tall buildings indicate that both wind loads and earthquake loads were simultaneously considered during 786
structural design. Cho et al. [13] and Foraboschi et al. [14] only considered wind loads whereas 787
Moussavi Nadoushani and Akbarnezhad [15] only considered earthquake loads. The studies by Zhao 788
and Haojia [12] and Trabucco et al. [16] did not indicate whether lateral loads were considered during 789
structural. The results of this study indicate that wind and earthquake lateral loads can significantly 790
influence the EGHGE of structural systems for tall buildings by up to 22%. Findings also indicate that 791
this influence increases with building height in accordance with the premium-for-height framework. 792
Thus, the influence of lateral loads ought to be taken into considerations when comparing LCA studies 793
of alternative structural systems for tall buildings. 794
Therefore, it is crucial for researchers, architects and structural engineers, who undertake a 795
comparative LCA approach, to understand the influence of structural loads and design methods on the 796
EGHGE of structural systems. It is also useful for the designer to properly interpret and compare the 797
results of existing comparative LCA studies of structural systems to help guide early structural design 798
decisions. 799
5.3 Limitations and future research 800
This study suffers from several limitations. Firstly, this study assessed the influence of structural design 801
method on reinforced concrete buildings with rigid frames and shear wall structural systems. Thus, the 802
findings of the study are restricted to these structural materials and systems. The study also neglected 803
the influence of standardisation in construction, which often dictates the selection of section sizes, in 804
order to assess the maximum potential savings in EGHGE when assessing alternative structural 805
systems. Further research could investigate the influence of structural design methods on tall buildings 806
of different structural materials and systems. 807
Secondly, this study relies on Australian hybrid data for EGHGE, which are specific to the economic 808
situation and energy mix of Australia. Despite the geographic specificity in the adopted material 809
coefficients for EGHGE, the resulting material quantities, which were derived from the constructed finite 810
element models, are still relevant. Given material coefficients for EGHGE that are specific to other 811
regions, future research can convert the existing material quantities to more specific and appropriate 812
values of EGHGE emissions. 813
Postpr
int V
ersion

38/49
Thirdly, this study used the Australian codes and standards of structural design to determine the 814
relevant design loads, which differ in magnitude to the design loads required by other building codes 815
and standards. However, by quantifying the influence of imposed loads, façade loads and lateral loads 816
per load unit on the EGHGE/NFA of structural systems using increments of 1 kPa, 1 kN/m and 10 MNm, 817
respectively, the study widened the applicability of its results. This approach, which normalises the 818
effects of design loads per unit load, yields findings that are related to the first principles of structural 819
design, which are the basis of all structural design codes and practices. 820
Despite these limitations, this study provides an unprecedented insight into the influence of structural 821
design methods on the embodied environmental flows of structural systems for tall buildings. 822
6 Conclusion 823
This study assessed and quantified the influence of imposed loads, façade loads and lateral loads on 824
the embodied greenhouse gas emissions (EGHGE) of structural systems for tall buildings using a total 825
of 80 structural systems parametrically designed and analysed using finite element modelling. The study 826
demonstrates that varying structural design methods and magnitudes of structural loads can 827
significantly influence the EGHGE of structural systems by up to 22%. 828
This study also developed and demonstrated the use of unprecedented functional units such as (kgCO2-829
e/m2)/kPa, (kgCO2-e/m2)/(kN/m), (kgCO2-e/m2)/(kNm) in its integration of environmental assessment 830
and structural design. 831
The findings of this study confirm the need for clarity, consistency, transparency and 832
comprehensiveness in structural design methods when conducting comparative life cycle assessment 833
(LCA) studies of structural systems for tall buildings. This will ultimately contribute to reducing the 834
environmental effects of buildings and create a healthier built environment. 835
Data Availability 836
The data that support the findings of this study are openly available in [repository name e.g “figshare”] 837
at http://doi.org/[doi], reference number [reference number]. The finite element models that were 838
constructed for this study are also openly available in [repository name e.g “figshare”] at 839
http://doi.org/[doi], reference number [reference number]. 840
Postpr
int V
ersion

39/49
Author’s contributions 841
JH, AS and RHC designed the original research idea. JH developed the finite element modelling 842
approach, conducted the analysis and collected the data. JH wrote the paper and designed the figures. 843
AS and RHC reviewed draft manuscripts and provided feedback and guidance. 844
Acknowledgments 845
The authors would like to thank Dr. Alireza Mehdipanah for his expert advice on the finite element 846
modelling of reinforced concrete structures. 847
Postpr
int V
ersion

40/49
Appendix A Constructed finite element models with adopted 848
structural design methods 849
The follow table lists the constructed finite element models that were used for this study, along with 850
their adopted structural design methods and structural load magnitudes. 851
Table A.1 - Constructed finite element models with adopted structural design methods 852
Finite Element Model Name (available on figshare)
Storeys Imposed
Load (kPa)
Imposed Load
Reduction
Façade Load
(kN/m)
Static Wind Load
Static EQ
Load
Dynamic EQ Load
RC_RigidFrame_5Storeys_01 5 2 - 3.5 - - -
RC_RigidFrame_10Storeys_01 10 2 - 3.5 - - -
RC_RigidFrame_15Storeys_01 15 2 - 3.5 - - -
RC_RigidFrame_20Storeys_01 20 2 - 3.5 - - -
RC_RigidFrame_25Storeys_01 25 2 - 3.5 - - -
RC_RigidFrame_30Storeys_01 30 2 - 3.5 - - -
RC_RigidFrame_5Storeys_02 5 2 ✓ 3.5 - - -
RC_RigidFrame_10Storeys_02 10 2 ✓ 3.5 - - -
RC_RigidFrame_15Storeys_02 15 2 ✓ 3.5 - - -
RC_RigidFrame_20Storeys_02 20 2 ✓ 3.5 - - -
RC_RigidFrame_25Storeys_02 25 2 ✓ 3.5 - - -
RC_RigidFrame_30Storeys_02 30 2 ✓ 3.5 - - -
RC_RigidFrame_5Storeys_03 5 3 - 3.5 - - -
RC_RigidFrame_10Storeys_03 10 3 - 3.5 - - -
RC_RigidFrame_15Storeys_03 15 3 - 3.5 - - -
RC_RigidFrame_20Storeys_03 20 3 - 3.5 - - -
RC_RigidFrame_25Storeys_03 25 3 - 3.5 - - -
RC_RigidFrame_30Storeys_03 30 3 - 3.5 - - -
RC_RigidFrame_5Storeys_04 5 3 ✓ 3.5 - - -
RC_RigidFrame_10Storeys_04 10 3 ✓ 3.5 - - -
RC_RigidFrame_15Storeys_04 15 3 ✓ 3.5 - - -
RC_RigidFrame_20Storeys_04 20 3 ✓ 3.5 - - -
RC_RigidFrame_25Storeys_04 25 3 ✓ 3.5 - - -
RC_RigidFrame_30Storeys_04 30 3 ✓ 3.5 - - -
RC_RigidFrame_5Storeys_05 5 4 - 3.5 - - -
RC_RigidFrame_10Storeys_05 10 4 - 3.5 - - -
RC_RigidFrame_15Storeys_05 15 4 - 3.5 - - -
RC_RigidFrame_20Storeys_05 20 4 - 3.5 - - -
RC_RigidFrame_25Storeys_05 25 4 - 3.5 - - -
RC_RigidFrame_30Storeys_05 30 4 - 3.5 - - -
RC_RigidFrame_5Storeys_06 5 4 ✓ 3.5 - - -
Postpr
int V
ersion

41/49
Finite Element Model Name (available on figshare)
Storeys Imposed
Load (kPa)
Imposed Load
Reduction
Façade Load
(kN/m)
Static Wind Load
Static EQ
Load
Dynamic EQ Load
RC_RigidFrame_10Storeys_06 10 4 ✓ 3.5 - - -
RC_RigidFrame_15Storeys_06 15 4 ✓ 3.5 - - -
RC_RigidFrame_20Storeys_06 20 4 ✓ 3.5 - - -
RC_RigidFrame_25Storeys_06 25 4 ✓ 3.5 - - -
RC_RigidFrame_30Storeys_06 30 4 ✓ 3.5 - - -
RC_ShearWall_5Storeys_01 5 2 - 3.5 ✓ - -
RC_ShearWall_10Storeys_01 10 2 - 3.5 ✓ - -
RC_ShearWall_15Storeys_01 15 2 - 3.5 ✓ - -
RC_ShearWall_20Storeys_01 20 2 - 3.5 ✓ - -
RC_ShearWall_25Storeys_01 25 2 - 3.5 ✓ - -
RC_ShearWall_30Storeys_01 30 2 - 3.5 ✓ - -
RC_ShearWall_5Storeys_02 5 2 - 3.5 - ✓ -
RC_ShearWall_10Storeys_02 10 2 - 3.5 - ✓ -
RC_ShearWall_15Storey_02 15 2 - 3.5 - ✓ -
RC_ShearWall_20Storey_02 20 2 - 3.5 - ✓ -
RC_ShearWall_25Storey_02 25 2 - 3.5 - ✓ -
RC_ShearWall_30Storey_02 30 2 - 3.5 - ✓ -
RC_ShearWall_5Storeys_03 5 2 - 3.5 ✓ ✓ -
RC_ShearWall_10Storeys_03 10 2 - 3.5 ✓ ✓ -
RC_ShearWall_15Storeys_03 15 2 - 3.5 ✓ ✓ -
RC_ShearWall_20Storeys_03 20 2 - 3.5 ✓ ✓ -
RC_ShearWall_25Storeys_03 25 2 - 3.5 ✓ ✓ -
RC_ShearWall_30Storeys_03 30 2 - 3.5 ✓ ✓ -
RC_ShearWall_5Storeys_04 5 2 - 3.5 - - ✓
RC_ShearWall_10Storeys_04 10 2 - 3.5 - - ✓
RC_ShearWall_15Storeys_04 15 2 - 3.5 - - ✓
RC_ShearWall_20Storeys_04 20 2 - 3.5 - - ✓
RC_ShearWall_25Storeys_04 25 2 - 3.5 - - ✓
RC_ShearWall_30Storeys_04 30 2 - 3.5 - - ✓
RC_ShearWall_5Storeys_05 5 2 - 3.5 ✓ - ✓
RC_ShearWall_10Storeys_05 10 2 - 3.5 ✓ - ✓
RC_ShearWall_15Storeys_05 15 2 - 3.5 ✓ - ✓
RC_ShearWall_20Storeys_05 20 2 - 3.5 ✓ - ✓
RC_ShearWall_25Storeys_05 25 2 - 3.5 ✓ - ✓
RC_ShearWall_30Storeys_05 30 2 - 3.5 ✓ - ✓
RC_RigidFrame_5Storeys_07 5 2 - 4.5 - - -
RC_RigidFrame_10Storeys_07 10 2 - 4.5 - - -
RC_RigidFrame_15Storeys_07 15 2 - 4.5 - - -
RC_RigidFrame_20Storeys_07 20 2 - 4.5 - - -
RC_RigidFrame_25Storeys_07 25 2 - 4.5 - - -
RC_RigidFrame_30Storeys_07 30 2 - 4.5 - - -
RC_RigidFrame_5Storeys_08 5 2 - 5.5 - - -
RC_RigidFrame_10Storeys_08 10 2 - 5.5 - - -
Postpr
int V
ersion
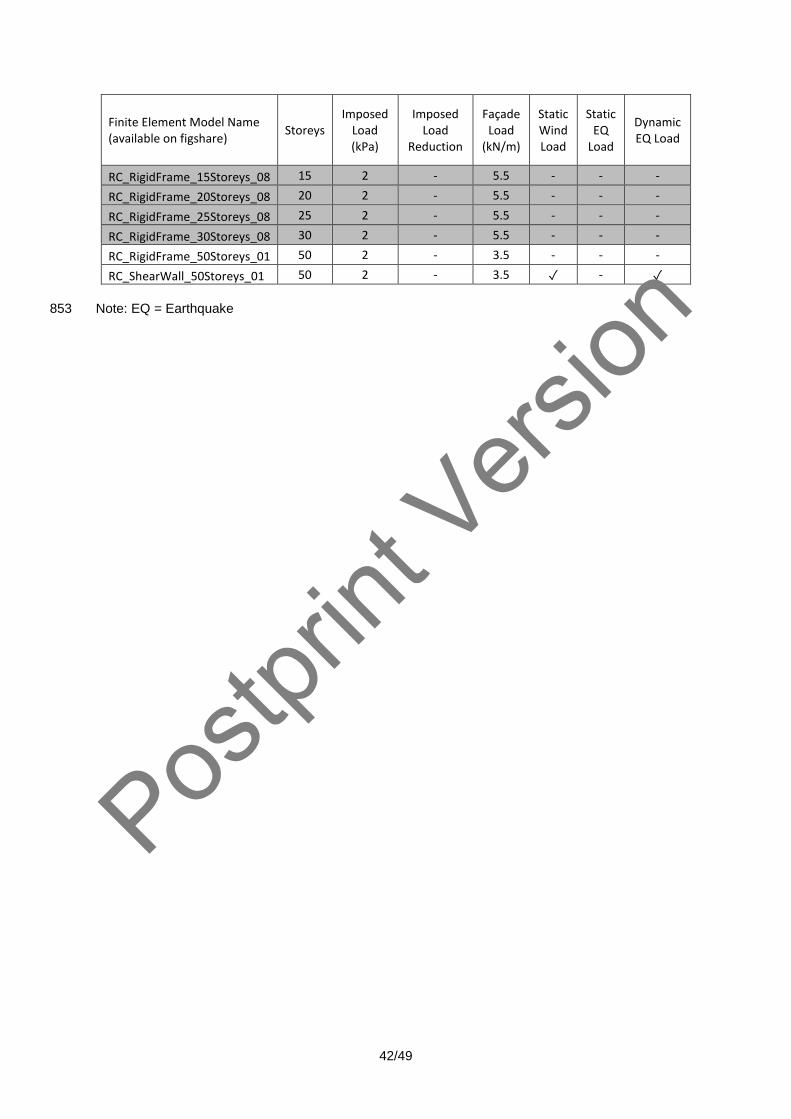
42/49
Finite Element Model Name (available on figshare)
Storeys Imposed
Load (kPa)
Imposed Load
Reduction
Façade Load
(kN/m)
Static Wind Load
Static EQ
Load
Dynamic EQ Load
RC_RigidFrame_15Storeys_08 15 2 - 5.5 - - -
RC_RigidFrame_20Storeys_08 20 2 - 5.5 - - -
RC_RigidFrame_25Storeys_08 25 2 - 5.5 - - -
RC_RigidFrame_30Storeys_08 30 2 - 5.5 - - -
RC_RigidFrame_50Storeys_01 50 2 - 3.5 - - -
RC_ShearWall_50Storeys_01 50 2 - 3.5 ✓ - ✓
Note: EQ = Earthquake 853
Postpr
int V
ersion

43/49
Appendix B Calculating wind loads according to AS1170.2 854
The following figure illustrates the adopted process of calculating quasi-static wind loads as prescribed 855
by the Australian standard AS1170.2:2011. 856
857
Figure B.1 - Process of calculating wind loads as prescribed by Australian standard AS1170.2:2011858
Postpr
int V
ersion

44/49
Appendix C Calculating earthquake loads using Equivalent Static Method according to AS1170.4 859
The following figure illustrates the adopted process of calculating static earthquake loads as prescribed by the Australian standard AS1170.4:2007. 860
861
Figure C.0.1 - Process of calculating equivalent static earthquake loads as prescribed by Australian standard AS1170.4:2007 862 Postpr
int V
ersion

45/49
Appendix D Calculating earthquake loads according to 863
Response Spectrum Analysis method. 864
The following figure illustrates the adopted process of calculating dynamic earthquake loads according 865
to the Response Spectrum Analysis method. 866
867
Figure D.1 - Response-Spectrum Analysis for calculating earthquake loads868
Postpr
int V
ersion

46/49
References 869
870
871
872
873
874
875
876
877
878
[1] IPCC. Global Warming of 1.5°C. Geneva, Switzerland: IPCC; 2018. 879
[2] World Green Building Council. Bringing embodied carbon upfront - Coordinated action for the 880
building and construction sector to tackle embodied carbon. Advancing Net Zero. Longon, UK: World 881
Green Building Council; 2019. p.35. 882
[3] Crawford RH. Life cycle assessment in the built environment. London ; New York: Spon Press; 2011. 883
[4] Dixit MK. Life cycle embodied energy analysis of residential buildings: A review of literature to 884
investigate embodied energy parameters. Renewable and Sustainable Energy Reviews. 2017;79:390-885
413 https://doi.org/10.1016/j.rser.2017.05.051. 886
[5] Säynäjoki A, Heinonen J, Junnila S. A scenario analysis of the life cycle greenhouse gas emissions 887
of a new residential area. Environmental Research Letters. 2012;7:034037 888
[6] Stephan A, Crawford RH, de Myttenaere K. A comprehensive assessment of the life cycle energy 889
demand of passive houses. Applied Energy. 2013;112:23-34 890
http://dx.doi.org/10.1016/j.apenergy.2013.05.076. 891
[7] CTBUH. CTBUH Year in Review: Tall Trends of 2018. Chicago, Illinois: CTBUH; 2018. 892
[8] Roo Gd, Miller D. Compact cities and sustainable urban development : a critical assessment of 893
policies and plans from an international perspective. Burlington, VT2000. 894
[9] Stevenson M, Thompson J, de Sá TH, Ewing R, Mohan D, McClure R, et al. Land use, transport, 895
and population health: estimating the health benefits of compact cities. The Lancet. 2016;388:2925-35 896
[10] Treloar GJ, Fay R, Ilozor B, Love PED. An analysis of the embodied energy of office buildings by 897
height. Facilities. 2001;19:204 https://doi.org/10.1108/02632770110387797. 898
[11] Khan FR. Current trends in concrete high-rise buildings. Symposium on Tall Buildings with 899
Particular Reference to Shear Wall Structures. Southampton, England 1967. p.571-90. 900
Postpr
int V
ersion

47/49
[12] Zhao X, Haojia MA. Structural System Embodied Carbon Analysis for Super Tall Buildings. 901
Procedia Engineering. 2015;118:215-22 https://doi.org/10.1016/j.proeng.2015.08.420. 902
[13] Cho YS, Kim JH, Hong SU, Kim Y. LCA application in the optimum design of high rise steel 903
structures. Renewable and Sustainable Energy Reviews. 2012;16:3146-53 904
https://doi.org/10.1016/j.rser.2012.01.076. 905
[14] Foraboschi P, Mercanzin M, Trabucco D. Sustainable structural design of tall buildings based on 906
embodied energy. Energy and Buildings. 2014;68:254-69 907
https://doi.org/10.1016/j.enbuild.2013.09.003. 908
[15] Moussavi Nadoushani ZS, Akbarnezhad A. Effects of structural system on the life cycle carbon 909
footprint of buildings. Energy and Buildings. 2015;102:337-46 910
https://doi.org/10.1016/j.enbuild.2015.05.044. 911
[16] Trabucco D, Wood A, Vassart O, Popa N, Davies D. Life Cycle Assessment of Tall Building 912
Structural Systems. Chicago, Illinois: CTBUH; 2015. 913
[17] Crawford RH. Validation of a hybrid life-cycle inventory analysis method. Journal of Environmental 914
Management. 2008;88:496-506 https://doi.org/10.1016/j.jenvman.2007.03.024. 915
[18] Pomponi F, Lenzen M. Hybrid life cycle assessment (LCA) will likely yield more accurate results 916
than process-based LCA. Journal of Cleaner Production. 2018;176:210-5 917
https://doi.org/10.1016/j.jclepro.2017.12.119. 918
[19] Crawford RH, Bontinck P-A, Stephan A, Wiedmann T, Yu M. Hybrid life cycle inventory methods – 919
A review. Journal of Cleaner Production. 2018;172:1273-88 920
https://doi.org/10.1016/j.jclepro.2017.10.176. 921
[20] Majeau-Bettez G, Strømman AH, Hertwich EG. Evaluation of Process- and Input–Output-based 922
Life Cycle Inventory Data with Regard to Truncation and Aggregation Issues. Environmental Science & 923
Technology. 2011;45:10170-7 10.1021/es201308x. 924
[21] Allacker K. Sustainable building: the development of an evaluation method. 2010. 925
[22] Chau CK, Leung TM, Ng WY. A review on Life Cycle Assessment, Life Cycle Energy Assessment 926
and Life Cycle Carbon Emissions Assessment on buildings. Applied Energy. 2015;143:395-413 927
https://doi.org/10.1016/j.apenergy.2015.01.023. 928
[23] Oregi X, Hernandez P, Gazulla C, Isasa M. Integrating Simplified and Full Life Cycle Approaches 929
in Decision Making for Building Energy Refurbishment: Benefits and Barriers. Buildings. 2015;5:354-80 930
[24] IEA. World Energy Outlook 2017: OECD Publishing/IEA; 2017. 931
[25] Taranath BS. Tall building design. Boca Raton: CRC Press; 2017. 932
[26] Winistorfer P, Chen Z, Lippke B, Stevens N. Energy consumption and greenhouse gas emissions 933
related to the use, maintenance, and disposal of a residential structure. Wood and Fiber Science. 934
2007;37:128-39 935
[27] European Committee for Standardization. EN 15978:2011 Sustainability of construction works. 936
Assessment of environmental performance of buildings. Calculation method: BSI Standards Limited; 937
2011. 938
[28] Stafford Smith B, Coull A. Tall building structures: analysis and design. 1 ed: Wiley-Interscience; 939
1991. 940
Postpr
int V
ersion

48/49
[29] Ali M, Moon K. Advances in Structural Systems for Tall Buildings: Emerging Developments for 941
Contemporary Urban Giants. Buildings. 2018;8:104 10.3390/buildings8080104. 942
[30] Sofi M, Lumantarna E, Helal J, Letheby M, Rezapour A, Duffield C, et al. The Effects of Building 943
Parameters on Seismic Inter-Storey Drifts of Tall buildings. Australian Earthquake Engineering Society 944
2013 Conference. Hobart, Tasmania 2013. 945
[31] Mendis P, Ngo T, Haritos N, Hira A, Samali B, Cheung J. Wind loading on tall buildings. Electronic 946
Journal of Structural Engineering. 2007;7:41-54 947
[32] Stephan A, Crawford RH, Bontinck P-A. A model for streamlining and automating path exchange 948
hybrid life cycle assessment. The International Journal of Life Cycle Assessment. 2019;24:237-52 949
https://doi-org.ezp.lib.unimelb.edu.au/10.1007/s11367-018-1521-1. 950
[33] CTBUH. CTBUH Year in Review: Tall Trends of 2017. Chicago, Illinois: CTBUH; 2017. 951
[34] Standards Australia. AS/NZS 2890 (Set):2009 - Parking Facilities Set: Sydney : Standards Australia 952
International ; Wellington : Standards New Zealand, 2009.; 2009. 953
[35] CTBUH. CTBUH Height Criteria for Measuring & Defining Tall Buildings. Chicago, USA: Council 954
on Tall Buildings and Urban Habitats; 2017. 955
[36] CTBUH. Structural systems for tall buildings : systems and concepts. New York: McGraw-Hill; 1995. 956
[37] Zienkiewicz OC, Taylor RL, Zhu JZ, Zienkiewicz OC. Finite Element Method : Its Basis and 957
Fundamentals. Oxford, UNITED KINGDOM: Elsevier Science & Technology; 2013. 958
[38] Hrennikoff A. Solution of Problems in Elasticity by the Frame Work Method. Journal of Applied 959
Mechanics. 1941;8: 169–75 960
[39] McHenry D. A lattice analogy for the solution of plane stress problems. Journal of the Institution of 961
Civil Engineers. 1943;21:59–82 962
[40] Newmark NM. Numerical methods of analysis in bars, plates and elastic bodies. In: Grinter LE, 963
editor. Numerical Methods of Analysis in Engineering. New York: Macmillan; 1949. 964
[41] Computers and Structures Inc. ETABS. Computers and Structures Inc.,, Available from 965
https://www.csiamerica.com/products/etabs/releases#17-17.0.0, 2018 (Accessed December 10 2019). 966
[42] Abdelrazaq A. Validating the Structural Behavior and Response of Burj Khalifa. CTBUH Journal. 967
2011 968
[43] CTBUH. The Skyscraper Center USA, Available from https://www.skyscrapercenter.com/, 2019 969
(Accessed 30/03/2019 2019). 970
[44] Taranath BS. Reinforced concrete design of tall buildings. Boca Raton: CRC Press : 971
ICC/International Code Council : CRSI/Concrete Reinforcing Steel Institute; 2010. 972
[45] Penelis G, Penelis G. Concrete Buildings is Seismic Regions. Boca Raton, Florida, United States: 973
CRC Press; 2014. 974
[46] Wong J-M, Sommer A, Briggs K, Ergin C. Effective stiffness for modeling reinforced concrete 975
structures: a literature review. Structure Magazine. Chicago, Illinois: C3 Ink; 2017. p.18-21. 976
[47] European Committee for Standardization. Eurocode 8: Design of structures for earthquake 977
resistance - Part 1 : General rules, seismic actions and rules for buildings Brussels, Belgium: European 978
Committee for Standardization; 2004. 979
Postpr
int V
ersion

49/49
[48] European Committee for Standardization. Eurocode 1: Actions on structures - Part 1-4: General 980
actions - Wind actions. Brussels, Belgium: European Committee for Standardization; 2002. 981
[49] Standards Australia. AS/NZS 1170.2:2002 - Structural design actions : wind actions: Sydney : 982
Standards Australia International ; Wellington : Standards New Zealand, 2002.; 2002. 983
[50] ISO. ISO 2394:2015 - General principles on reliability for structures. Geneva, Switzerland: 984
International Organization for Standardization; 2015. 985
[51] American Society of Civil Engineers. Minimum design loads for buildings and other structures. 986
Reston, Virginia: Published by American Society of Civil Engineers; 2013. 987
[52] Chopra AK. Dynamics of structures : theory and applications to earthquake engineering. 4th ed. 988
Upper Saddle River, N.J.: Prentice Hall; 2012. 989
[53] Australia S. AS/NZS 1170.4:2002: Structural design actions: earthquake actions: Sydney : 990
Standards Australia International ; Wellington : Standards New Zealand, 2002-2011.; 2002. 991
[54] Rao SS. Mechanical vibrations. 4th ed. Upper Saddle River, N.J.: Pearson Prentice Hall; 2004. 992
[55] Finnveden G, Hauschild MZ, Ekvall T, Guinée J, Heijungs R, Hellweg S, et al. Recent developments 993
in Life Cycle Assessment. Journal of Environmental Management. 2009;91:1-21 994
https://doi.org/10.1016/j.jenvman.2009.06.018. 995
[56] Lenzen M. Errors in Conventional and Input-Output—based Life—Cycle Inventories. Journal of 996
Industrial Ecology. 2000;4:127-48 doi:10.1162/10881980052541981. 997
[57] Miller RE, Blair PD. Input-output analysis: foundations and extensions. Cambridge, United 998
Kingdom: Cambridge University Press; 2009. 999
[58] ABS. 5209.0.55.001 - Australian National Accounts: Input-Output Tables, 2014-15. In: ABS, editor. 1000
Canberra, Australia 2018. 1001
[59] Lenzen M, Crawford RH. The Path Exchange Method for Hybrid LCA. Environmental Science & 1002
Technology. 2009;43:8251-6 http://doi.org/10.1021/es902090z. 1003
[60] Treloar GJ. Extracting Embodied Energy Paths from Input–Output Tables: Towards an Input–1004
Output-based Hybrid Energy Analysis Method. Economic Systems Research. 1997;9:375-91 1005
https://doi.org/10.1080/09535319700000032. 1006
[61] Crawford RH, Stephan A, Prideaux F. EPiC Database. Melbourne: Univeristy of Melbourne; 2019. 1007
[62] Standards Australia. AS/NZS 1170.1:2002 - Structural design actions : permanent, imposed and 1008
other actions: Sydney : Standards Australia International ; Wellington : Standards New Zealand, 2002.; 1009
2002. 1010
[63] Crippa M, Oreggioni G, Guizzardi D, Muntean M, Schaaf E, Lo Vullo E, et al. Fossil CO2 and GHG 1011
emissions of all world countries - 2019 Report, EUR 29849 EN. Luxembourg: Publications Office of the 1012
European Union; 2019. 1013
[64] Green Vehicle Guide. Vehicle emissions. Commonwealth of Australia, Available from 1014
https://www.greenvehicleguide.gov.au/pages/Information/VehicleEmissions, 2017 (Accessed 1015
November 25 2019). 1016
1017
Postpr
int V
ersion

Minerva Access is the Institutional Repository of The University of Melbourne
Author/s:
Helal, J; Stephan, A; Crawford, RH
Title:
The influence of structural design methods on the embodied greenhouse gas emissions of
structural systems for tall buildings
Date:
2020-04-01
Citation:
Helal, J., Stephan, A. & Crawford, R. H. (2020). The influence of structural design methods
on the embodied greenhouse gas emissions of structural systems for tall buildings.
STRUCTURES, 24, pp.650-665. https://doi.org/10.1016/j.istruc.2020.01.026.
Persistent Link:
http://hdl.handle.net/11343/241274
File Description:
Accepted version
License:
Unknown