5 september 2003 hong kong baptist university 1998 superannuation fund
Post on 22-Dec-2015
229 views
TRANSCRIPT

5 September 2003
Hong Kong Baptist University1998 Superannuation Fund

Hong Kong Baptist University 2
Contents
• Portfolio Size Summary
• Performance Summary
• Asset Allocation
• Performance Review
• Current Investment Strategy and Market Outlook

Portfolio Size Summary

Hong Kong Baptist University 4
Portfolio Size Summary
MLIIF US Dollar Global Bond Stable Fund
US$ HK$ US$ HK$
31 July 2003 1,122,258.84 8,752,833.37* 909,840.77 7,096,394.07+
* The exchange rate is the deal FX rate, which is 7.7993 HKD/USD as of 31 July 2003.+ The exchange rate is based on the spot rate from Bloomberg, which is 7.7996 HKD/USD as of 31 July 2003.

Performance Summary

Hong Kong Baptist University 6
Performance Summary
MLIIF US Dollar Global Bond Stable Fund
Actual %1 Benchmark %2 Actual %3 Benchmark %4
July 2003 -1.54 -1.82 -1.01 -0.67
2Q 2003 1.61 1.62 5.09 6.12
1 Year (1 August 02 – 31 July 03) 5.08 5.33 5.27 6.86
YTD (1 January 03 – 31 July 03) 0.93 1.01 3.59 4.74
Inception-to-date (26 April 02 – 31 July 03) 6.95 8.31 3.08 4.33
Remarks: 1. Performance figures are net of 1.15% management fee and after 0.75% rebate.2. Citigroup WGBI - 18 US $ Hdgd3. Performance figures are net of 1.15% management fee and after 0.70% rebate.4. 70% Citigroup WGBI - 18 US $ Hdgd and 30% MSCI World (net)
As at 31 July 2003

Hong Kong Baptist University 7
MLIIF US Dollar Global Bond, as at 29 July 2003
0
100
200
300
400
500
600
700
800
900
1000
16.66
16.9317.04
17.16
17.3617.22
17.57
17.76 17.6917.86
17.75
18.19
18.27
16.68
17.37
17.90
15.50
16.00
16.50
17.00
17.50
18.00
18.50
Apr-02 May-02 J un -02 J ul- 02 Aug-02 Sep-02 Oct -02 Nov-02 Dec-02 J an -03 Feb-03 Mar-03 Apr-03 May-03 J un -03 J ul- 03Alloted Shares Unit PriceCumulative Alloted Shares
No
. o
f S
ha
res
Cumulative Real Return*
0
2000
4000
6000
8000
10000
12000
14000
16000
18000
16.66
16.9317.04
17.1617.36
17.2217.37
17.5717.76
17.90
17.6917.86
17.75
16.68
18.19
18.27
15.50
16.00
16.50
17.00
17.50
18.00
18.50
Apr-02 May-02 J un-02 J ul-02 Aug-02 Sep-02 Oct-02 Nov-02 Dec-02 J an-03 Feb-03 Mar-03 Apr-03 May-03 J un-03 J ul-03
Unit PriceCumulative Invested Assets
Cumulative Capital Employed
Source: Internal* Excess returns are calculated net of management fee and before rebate.
Assume USD1,000 contribution on every 29th of the month

Hong Kong Baptist University 8
Assume USD1,000 contribution on every 29th of the month
Stable Fund, as at 29 July 2003
Cumulative Real Return*
No
. o
f S
ha
res
0
200
400
600
800
1000
1200
1400
1600
1800
10.01
9.87
9.62
9.87
9.67
9.779.84
9.87
9.77 9.799.84
9.98
10.2910.35
10.24
10.00
9.40
9.50
9.60
9.70
9.80
9.90
10.00
10.10
10.20
10.30
10.40
Apr-02 May-02 Jun-02 Jul-02 Aug-02 Sep-02 Oct-02 Nov-02 Dec-02 Jan-03 Feb-03 Mar-03 Apr-03 May-03 Jun-03 Jul-03
Alloted Shares Unit PriceCumulative Alloted Shares
0
2000
4000
6000
8000
10000
12000
14000
16000
18000
10.01
9.87
9.62
9.87
9.67
9.77
9.849.87
9.77 9.799.84
9.98
10.2910.35
10.24
10.00
9.40
9.50
9.60
9.70
9.80
9.90
10.00
10.10
10.20
10.30
10.40
Apr-02 May-02 Jun-02 Jul-02 Aug-02 Sep-02 Oct-02 Nov-02 Dec-02 Jan-03 Feb-03 Mar-03 Apr-03 May-03 Jun-03 Jul-03
Unit PriceCumulative Invested Assets
Cumulative Capital Employed
Source: Internal* Excess returns are calculated net of management fee and before rebate.

Hong Kong Baptist University 9
MLIIF US Dollar Global Bond Stable Fund
-1.8%
0.5%
1.7%
-1.1%-2%
-1%
0%
1%
2%
3%
4%
5%
3 months 6 months 1 year SinceInception
1.6%
3.0% 3.2%
-0.5%-1%
0%
1%
2%
3%
4%
5%
3 months 6 months 1 year SinceInception
Source: Internal* Excess returns are calculated net of management fee and before rebate.
As at 29 July 2003
Assume USD1,000 contribution on every 29th of the month
Cumulative Real Return*

Asset Allocation

Hong Kong Baptist University 11
MLIIF US Dollar Global Bond Fund (%)
22.0
51.0
16.0
2.09.0
By Region, as at 31 July 2003
MLIIF US Dollar Global Bond Fund
* Citigroup WGBI - 18 US $ Hdgd Source: Internal; Datastream
The Fund Benchmark*(%) (%)
North America 22.0 23.4
Europe 51.0 47.7
Japan 16.0 28.5
Other 2.0 0.4
Cash 9.0 0.0
Total 100 100
Benchmark* (%)
23.4
47.7
28.5
0.4

Hong Kong Baptist University 12
Stable Fund (%)
34.5
54.3
11.2
By Asset Class, as at 31 July 2003
Stable Fund
The Fund Benchmark* (%) (%)
Equities 34.5 30.0
Bonds 54.3 70.0
Cash 11.2 0.0
Total 100 100
* 70% Citigroup WGBI - 18 US $ Hdgd and 30% MSCI World (net)Source: Internal; Datastream
Benchmark* (%)
30
70

Hong Kong Baptist University 13
By Region, as at 31 July 2003
Stable Fund
* 70% Citigroup WGBI - 18 US $ Hdgd and 30% MSCI World (net)Source: Internal; Datastream
Stable Fund (%)
20.8
11.8
1.7
0.216.8
27.7
8.7
1.111.2
The Fund Benchmark*
(%) (%)
Equities
North America 20.8 17.9
Europe 11.8 8.6
Japan 1.7 2.5
Pacific Basin 0.2 0.9
Total Equities 34.5 30.0
Bonds
North America 16.8 16.4
Europe 27.7 33.4
Japan 8.7 19.9
Other 1.1 0.3
Total Bonds 54.3 70.0
Cash 11.2 0.0
Total Fund 100 100
Benchmark* (%)
17.9
2.5
0.9
16.433.4
19.90.3
8.6

Hong Kong Baptist University 14
By Sector, as at 31 July 2003
Stable Fund
Benchmark+ (%)
23.7
12.4
11.99.3
12.7
7.1
9.6
4.65.1 3.6
* Allocation only includes the equity portion of Stable Fund.+ MSCI World (net)Source: Internal; Datastream
Stable Fund* (%)
26
14
1111
11
7
8
54 2 1 The Fund* Benchmark+
(%) (%)
Financials 26.0 23.7
Healthcare 14.0 12.4
Consumer Dis. 11.0 11.9
Consumer Staples 11.0 9.3
Information Tech. 11.0 12.7
Energy 7.0 7.1
Industrials 8.0 9.6
Materials 5.0 4.6
Telecoms Services 4.0 5.1
Utilities 2.0 3.6
Cash 1.0 0.0
Total 100 100

Performance Review
MLIIF US Dollar Global Bond Fund

Hong Kong Baptist University 16
MLIIF US Dollar Global Bond Fund
Our overweight duration position in euro-zone bonds benefited from an extended rally,
although this was partially offset by market sell-offs in March and June.
We remained underweight duration in US dollar bloc bonds, which detracted as US bond
yields declined beyond expectations.
Being overweight duration in corporate bonds also benefited, these were attractive given
positive issuance and low government bond yields.

Performance Review
Stable Fund

Hong Kong Baptist University 18
Stable Fund
The fund slightly underperformed the benchmark for the quarter. The performance
suffered due to the defensive stance taken. Over the quarter, we significantly
underweighed bonds as we believed the bond valuation is very expensive.
The overall bond investment performance is the same as benchmark.
On equity side, our underweight in information technology detracted, as many of these
shares rallied strongly in the second quarter, as investors sought high earnings leverage
into the anticipated economic recovery.
In consumer discretionary, the media segment was impacted by similar trends. Our
holdings in high quality publishing companies like Reed Elsevier lagged.
Positive contribution came from financials, our holdings in Banca Intessa , BNP Paribas
and US corporate and municipal bond insurer, AMBAC Financial outperformed towards
end June.

Performance Review
Major Markets Summary
Hong Kong Baptist University 20
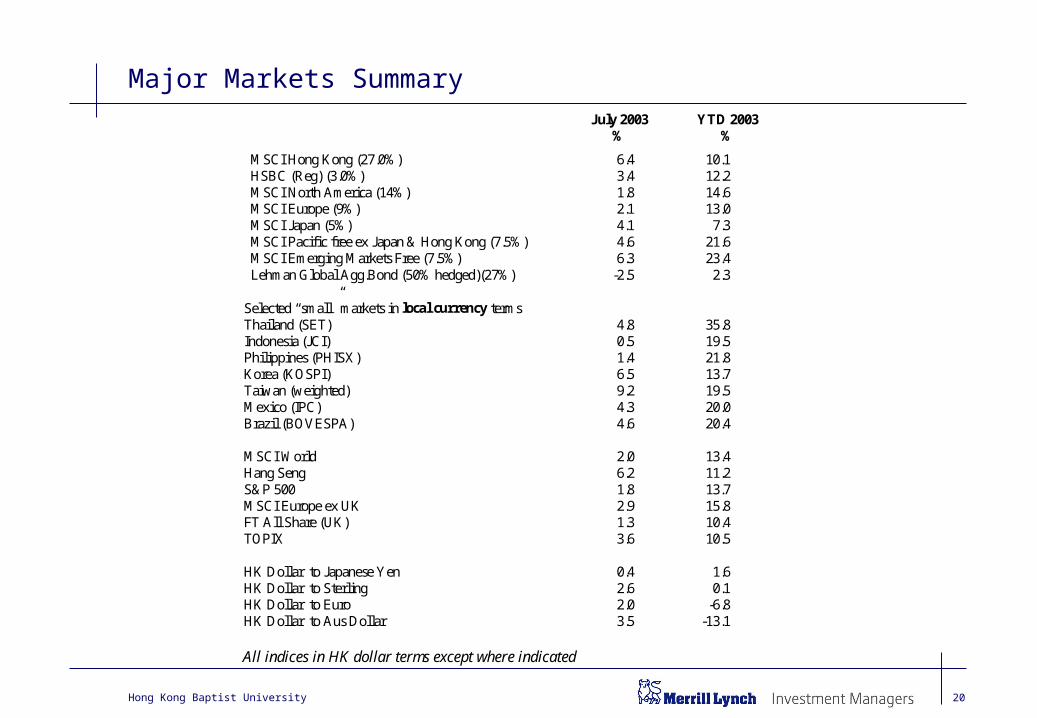
Major Markets SummaryJuly 2003
%YTD 2003
%
MSCI Hong Kong (27.0%) 6.4 10.1 HSBC (Reg) (3.0%) 3.4 12.2 MSCI North America (14%) 1.8 14.6 MSCI Europe (9%) 2.1 13.0 MSCI Japan (5%) 4.1 7.3 MSCI Pacific free ex Japan & Hong Kong (7.5%) 4.6 21.6 MSCI Emerging Markets Free (7.5%) 6.3 23.4 Lehman Global Agg.Bond (50% hedged)(27%) -2.5 2.3
Selected “small” markets in local currency termsThailand (SET) 4.8 35.8Indonesia (JCI) 0.5 19.5Philippines (PHISX) 1.4 21.8Korea (KOSPI) 6.5 13.7Taiwan (weighted) 9.2 19.5Mexico (IPC) 4.3 20.0Brazil (BOVESPA) 4.6 20.4
MSCI World 2.0 13.4Hang Seng 6.2 11.2S&P 500 1.8 13.7MSCI Europe ex UK 2.9 15.8FT All Share (UK) 1.3 10.4TOPIX 3.6 10.5
HK Dollar to Japanese Yen 0.4 1.6HK Dollar to Sterling 2.6 0.1HK Dollar to Euro 2.0 -6.8HK Dollar to Aus Dollar 3.5 -13.1
All indices in HK dollar terms except where indicated

Investment Outlook

Hong Kong Baptist University 22
What We Said And What Happened
We Said What Happened Outlook
Growth Below trend/no double dip As forecast Improving
Deflation Low risk Growing fear Still low =
Bonds Struggle to make positivereturns
+11 (USD) Will struggle to makepositive returns
-
Credit Outperforms governmentdebt
CORRECT More of the same
Interest Rates No rise in 2003 CORRECT View maintained
Equities Range bound but positive CORRECT View maintained
Gold Effective diversifier CORRECT Remains so
Score 51/2 / 7
Source: MLIM

Hong Kong Baptist University 23
Markets Have Come A Long Way
In US dollar terms: % Return 01/04/03 –30/06/03
% Return YTD
DAX 40.3 22.3
DJ EUROSTOXX 27.1 13.1
NASDAQ 21.0 21.5
FTSE ALL SHARE 19.6 9.0
S&P 500 15.4 11.8
NIKKEI 225 12.5 4.6
Source: Bloomberg

Hong Kong Baptist University 24
Global recovery to consolidate
%
Actual Forecast
0
0.5
1
1.5
2
2.5
3
3.5
4
4.5
5
2000 2001 2002 2003 2004
Source: OEF / MLIM
World GDP Growth
World GDP Growth
Hong Kong Baptist University 25
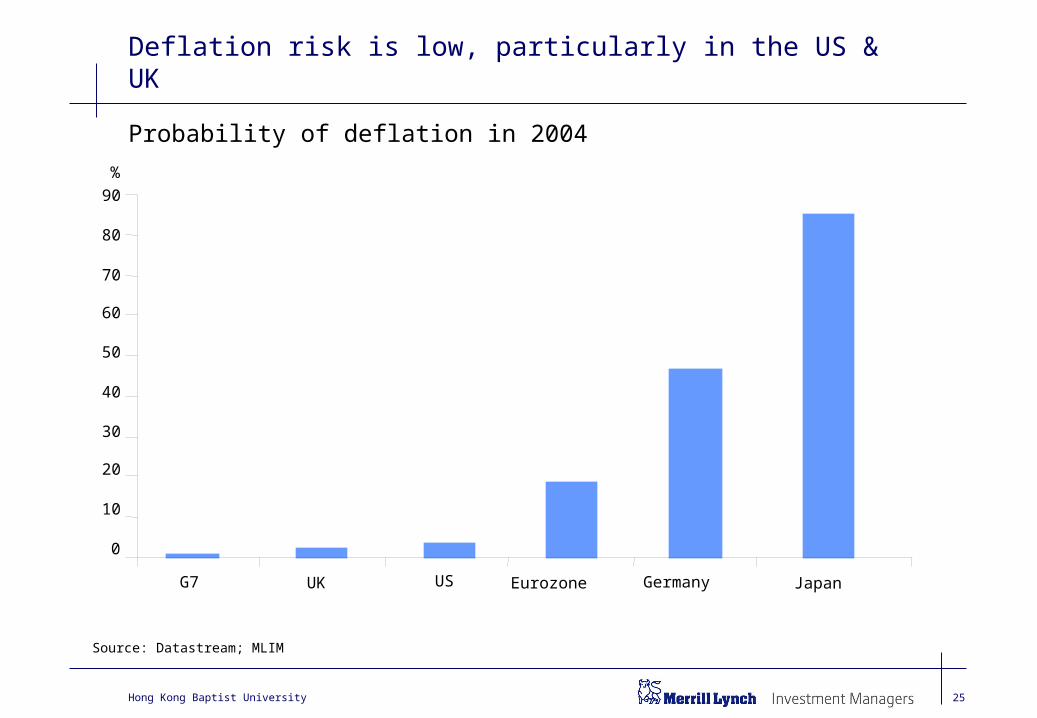
Deflation risk is low, particularly in the US & UK
Source: Datastream; MLIM
0
10
20
30
40
50
60
70
80
90
G7 UK US Eurozone Germany Japan
%
Probability of deflation in 2004

Hong Kong Baptist University 26
High operational leverage is boosting earnings
0.1
0.15
0.2
0.25
0.3
0.35
0.4
0.45
80 82 84 86 88 90 92 94 96 98 00 02
Trend Earnings
Actual EarningsSource: Datastream; MLIM
Real earnings per share, MSCI world

Hong Kong Baptist University 27
Global equities close to fair value in aggregate
Source: MLIM; MSCI
MSCI world, price to normalised earnings
5
10
15
20
25
30
35
40
70 72 74 76 78 80 82 84 86 88 90 92 94 96 98 00 02
Average

Hong Kong Baptist University 28
For the rest of the year...
Topic Forecast Focus
Economic Growth Slow recovery, US led US vs ROW
Equity Returns Modest Gains Growth quantum
Deflation Low risk ex Germany/Japan Growth quantum
Interest Rates No rises until 2004 Growth quantum
Government Bonds Poor returns Policy desire to flatten curve &Growth quantum
Geopolitical Risk Remains high Oil supply threat
Asset Preference Equities Growth quantum
Currencies $ weakens Policy/Growth/Structural
Source: MLIM

Hong Kong Baptist University 29
Conclusions
• Extreme risk aversion has subsided
• Short term market direction now dependent on economic follow through
• Global equity valuations no longer cheap but opportunities exist in UK
• Bonds are still expensive, particularly investment grade

The following notes should be read in conjunction with the attached document: 1. Issued by Merrill Lynch Investment Managers Limited, regulated by The FSA and a subsidiary of Merrill Lynch & Co., Inc. Merrill
Lynch Investment Managers is a trading name of Merrill Lynch Investment Managers Limited. Merrill Lynch & Co., Inc. and its subsidiaries are known as the Merrill Lynch Group.
2. Past performance is not necessarily a guide to future performance. The value of investments and the income from them can fall as well as rise and is not guaranteed. You may not get back the amount originally invested. Changes in the rates of exchange between currencies may cause the value of investments to diminish or increase. Fluctuation may be particularly marked in the case of a higher volatility fund and the value of an investment may fall suddenly and substantially. Levels and basis of taxation may change from time to time.
3. Any research in this document has been procured and may have been acted on by Merrill Lynch Investment Managers for its own purpose. The results of such research are being made available only incidentally. The views expressed do not constitute investment or any other advice and are subject to change. They do not necessarily reflect the views of any company in the Merrill Lynch Group or any part thereof and no assurances are made as to their accuracy.
4. This document is for information purposes only and does not constitute an offer or invitation to anyone to invest in any Merrill Lynch Group funds and has not been prepared in connection with any such offer.
5. This material is for distribution to Intermediate Customers (as defined by The FSA Rules).
Unless otherwise specified, all information contained in this document is current as at February 2003.
