5 steps for building a big data strategy
TRANSCRIPT

WHAT IS BIG DATA?
Big data refers to the ever-growing volume of data, increasing velocity in the generation of that data,
and increased variety of types of data. In 2016, adoption of big data skyrocketed across all sizes of
businesses. And it’s not just IT teams that are looking to take advantage of all of that information.
Business users want access to these data sets as well. There really is no one concrete number that
describes how big data is. The big data environment continues to grow more complex as the volume,
variety and velocity of data increases. New technologies have emerged, improving how data is stored,
managed, and retrieved.
5 STEPS FOR BUILDING A BIG DATA STRATEGY
Understanding of big data, the step is to build out a plan to deal with it. Get started on your big data
strategy with these five easy steps:
1. UNDERSTAND YOUR BUSINESS GOALS
First, identify the business problem or case your organization is looking to address and map it to
the right benchmarks, metrics, and KPIs. For example, is your goal to optimize operational
levels? Increase sales forecast transparency? Or monitor the performance of equipment across
regional locations? Insights into big data can help your business achieve all of these objectives
and much more. Big data also gives IT and the line of business an unprecedented opportunity to
work together to increase productivity, efficiency, and business processes. By increasing
accountability and collaboration across the business – along with clearly outlining requirements
and priorities – you will best position your company to uncover the hidden value in your data.
2. HAVE A CLEAR STRATEGY
It’s important to be strategic in your implementation of big data technology so you can make
the most of your existing IT infrastructure and prevent the new technology from becoming a
siloed part of your organization. For instance, if you decide to move to Hadoop, then you need
to subsequently choose a distribution player so you can deploy it. And, you need to select a big
data analytics platform that can transform the raw data you put into Hadoop into real-time
insights for the organization. Analytics’ end-to-end platform enables you to run analyses across
your company’s data – transactions, customer interactions, and machine data.
3. SELECT THE RIGHT PLATFORM
When selecting a big data analytics platform, ask yourself if it has the following attributes:
• The ability to gain insights from multi-structured data
• Tools that show you all of your data, not just what’s at the top of the iceberg
• Freedom from IT – the ability to ask the questions you want, when you want
• Fast answers, regardless of how much data you have on hand
• Access to big data for everyone – not just users with “scientist” in their title
• Tools built natively so the business can make the most of the data
4. START SMALL AND MEASURE
Once you have the ability to access and analyze information, the temptation to go big and
analyze all the data in sight is hard to resist. Instead, be strategic. Pick one business problem,

perform an audit to understand what data you need, and then measure that particular set of
data for insights. Focus on small wins first, as this will help all employees fully understand the
data in their everyday work. This strategy will also enable you to build the momentum to change
your organization into a data-driven enterprise.
5. BUILD A DATA-DRIVEN CULTURE
When users feel empowered to ask questions of big data, companies can build a data-driven
culture fostered by collaboration and innovation. With self-service analytics…
• Users can examine data from every touch point – from transactions to social posts – and
make informed decisions faster
• The power and flexibility to get answers to questions is much easier, and groups can
easily share that information with others
• Data scientists can make their work more accessible to the organization, which makes
what they do more meaningful to the business
• IT professionals can stop worrying about the volume, variety, and velocity of data;
whether users have access to the data they need; and whether or not that data is secure
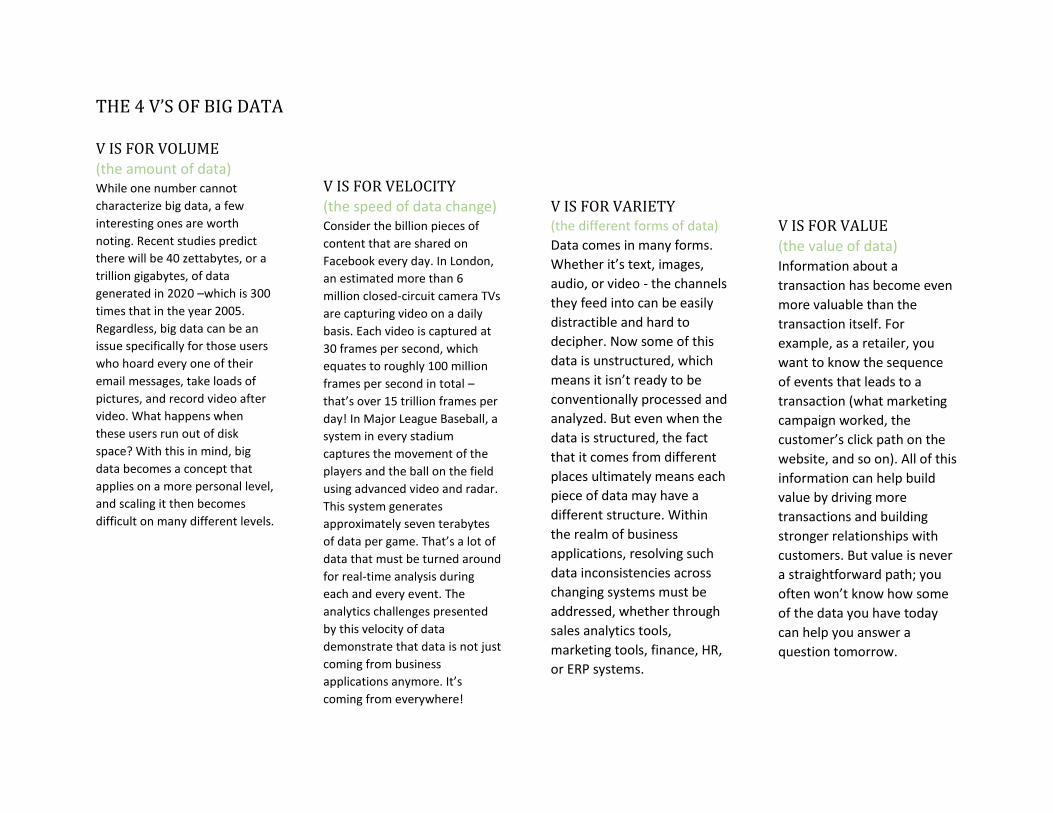
THE 4 V’S OF BIG DATA
V IS FOR VOLUME
(the amount of data) While one number cannot
characterize big data, a few
interesting ones are worth
noting. Recent studies predict
there will be 40 zettabytes, or a
trillion gigabytes, of data
generated in 2020 –which is 300
times that in the year 2005.
Regardless, big data can be an
issue specifically for those users
who hoard every one of their
email messages, take loads of
pictures, and record video after
video. What happens when
these users run out of disk
space? With this in mind, big
data becomes a concept that
applies on a more personal level,
and scaling it then becomes
difficult on many different levels.
V IS FOR VELOCITY (the speed of data change)
Consider the billion pieces of
content that are shared on
Facebook every day. In London,
an estimated more than 6
million closed-circuit camera TVs
are capturing video on a daily
basis. Each video is captured at
30 frames per second, which
equates to roughly 100 million
frames per second in total –
that’s over 15 trillion frames per
day! In Major League Baseball, a
system in every stadium
captures the movement of the
players and the ball on the field
using advanced video and radar.
This system generates
approximately seven terabytes
of data per game. That’s a lot of
data that must be turned around
for real-time analysis during
each and every event. The
analytics challenges presented
by this velocity of data
demonstrate that data is not just
coming from business
applications anymore. It’s
coming from everywhere!
V IS FOR VARIETY
(the different forms of data)
Data comes in many forms.
Whether it’s text, images,
audio, or video - the channels
they feed into can be easily
distractible and hard to
decipher. Now some of this
data is unstructured, which
means it isn’t ready to be
conventionally processed and
analyzed. But even when the
data is structured, the fact
that it comes from different
places ultimately means each
piece of data may have a
different structure. Within
the realm of business
applications, resolving such
data inconsistencies across
changing systems must be
addressed, whether through
sales analytics tools,
marketing tools, finance, HR,
or ERP systems.
V IS FOR VALUE
(the value of data) Information about a
transaction has become even
more valuable than the
transaction itself. For
example, as a retailer, you
want to know the sequence
of events that leads to a
transaction (what marketing
campaign worked, the
customer’s click path on the
website, and so on). All of this
information can help build
value by driving more
transactions and building
stronger relationships with
customers. But value is never
a straightforward path; you
often won’t know how some
of the data you have today
can help you answer a
question tomorrow.
