5 th bi-annual border to border conference performance measures at commercial ports of entry juan...
TRANSCRIPT
5th Bi-Annual Border to Border Conference
Performance Measures at Commercial Ports of Entry
Juan Carlos Villa
Agenda
• Land border crossing operations
• Land border performance measures
• Challenges/Opportunities
• Next Steps
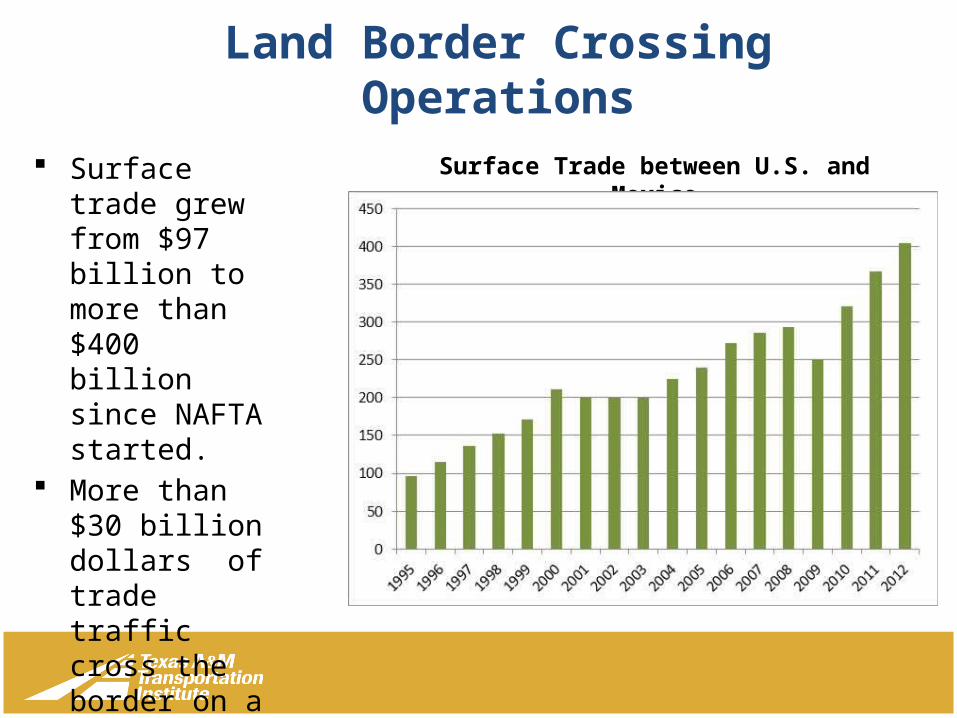
Land Border Crossing Operations Surface trade
grew from $97 billion to more than $400 billion since NAFTA started.
More than $30 billion dollars of trade traffic cross the border on a monthly basis
Surface Trade between U.S. and Mexico

Land Border Crossing Operations
Crossings grew from 3 to more than 3.5 million between 2000 and 2013.
Average annual growth higher than GDP growth
Land Border Crossing Operations
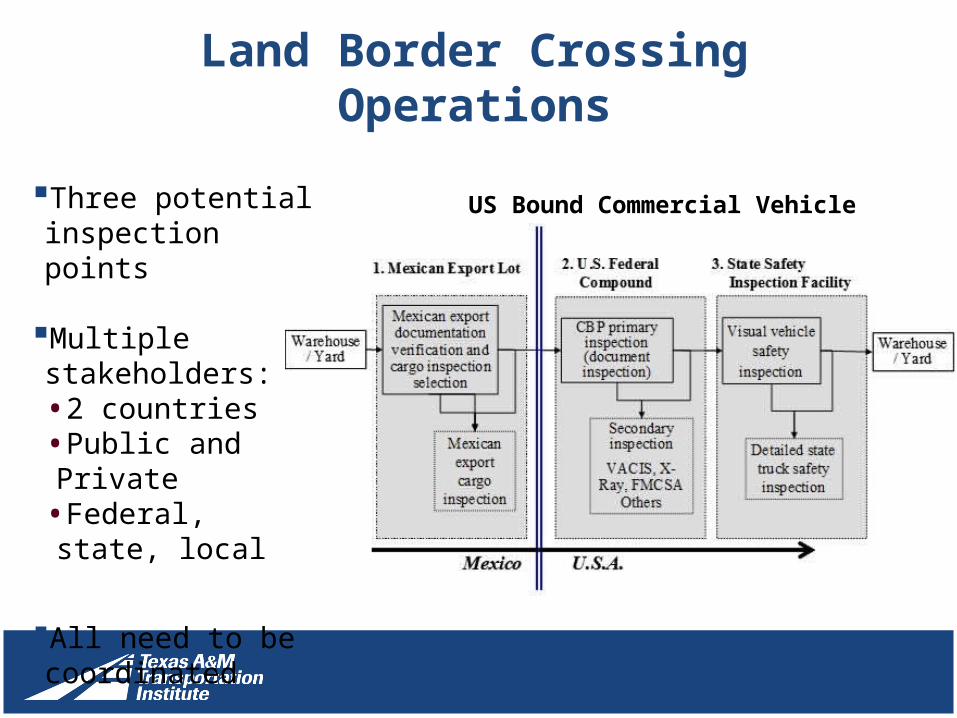
Three potential inspection points
Multiple stakeholders:•2 countries•Public and Private•Federal, state, local
All need to be coordinated
US Bound Commercial Vehicle Crossing
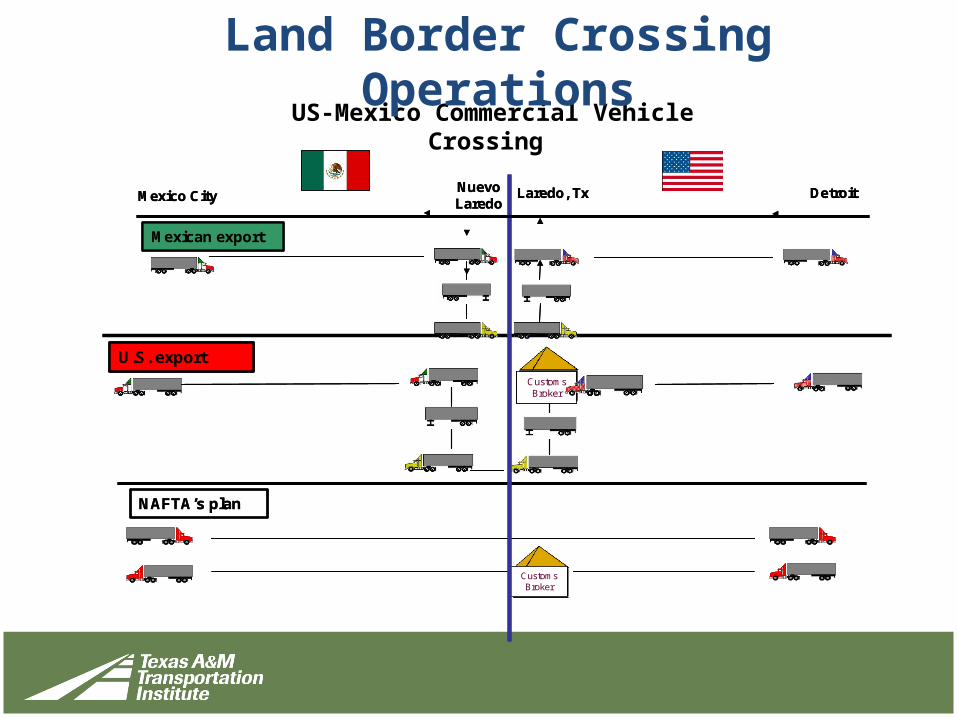
US-Mexico Commercial Vehicle Crossing
U.S. exportCustoms Broker
U.S. exportCustoms Broker
Customs Broker
NAFTA’s plan
Customs Broker
NAFTA’s plan
Mexico CityNuevo Laredo
Laredo, Tx Detroit
Mexican export
Mexico CityNuevo Laredo
Laredo, Tx Detroit
Mexican export
Land Border Crossing Operations

Poor travel time reliability at land border crossings
Negative Impacts
• Supply chain performance• Inventory costs• Vehicle Emissions• Regional economic impacts
Land Border Crossing Operations
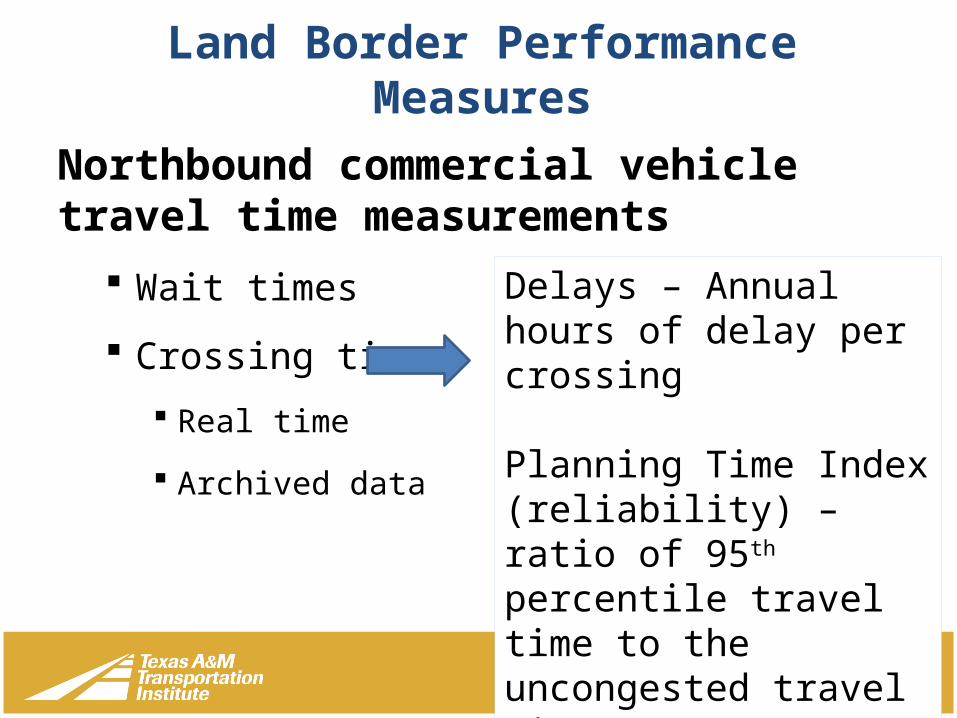
Land Border Performance Measures
Northbound commercial vehicle travel time measurements
Wait times
Crossing times
Real time
Archived data
Delays – Annual hours of delay per crossing
Planning Time Index (reliability) – ratio of 95th percentile travel time to the uncongested travel time
Texas A&M Transportation Institute
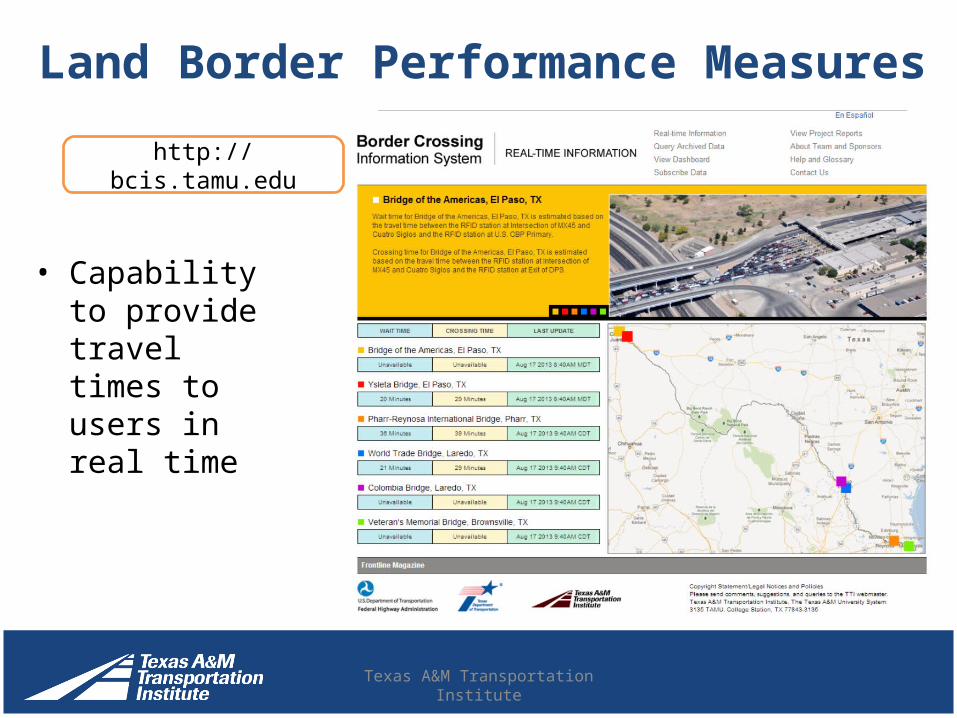
Land Border Performance Measures
• Capability to provide travel times to users in real time
http://bcis.tamu.edu

Texas A&M Transportation Institute
US Bound Truck Wait Time Trends01
-201
2
02-2
012
03-2
012
04-2
012
05-2
012
06-2
012
07-2
012
08-2
012
09-2
012
10-2
012
11-2
012
12-2
012
01-2
013
02-2
013
03-2
013
04-2
013
05-2
013
06-2
013
07-2
013
0
10
20
30
40
50
60
70
80
Bridge of the Americas Colombia International BridgeWorld Trade Bridge Pharr-Reynosa International BridgeZaragoza-Ysleta International Bridge
Month-Year
Mon
thly
Ave
rage
Wai
t Ti
me
(in M
inut
es)
Land Border Performance Measures
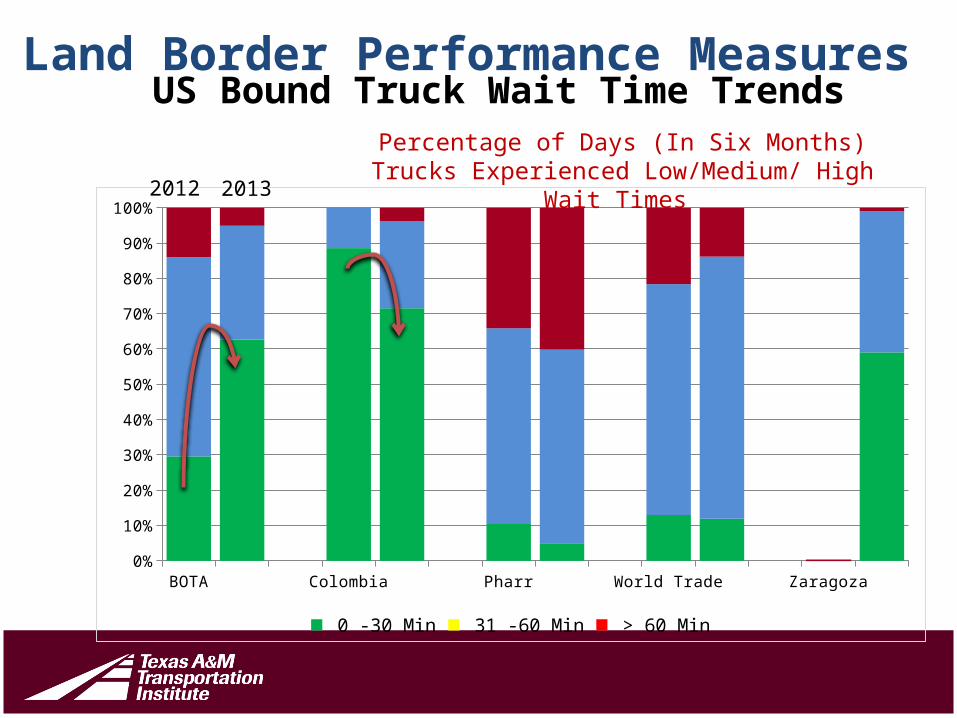
US Bound Truck Wait Time Trends
BOTA Colombia Pharr World Trade Zaragoza0%
10%
20%
30%
40%
50%
60%
70%
80%
90%
100%
0 -30 Min 31 -60 Min > 60 Min
2012 2013Percentage of Days (In Six Months) Trucks
Experienced Low/Medium/ High Wait Times
Land Border Performance Measures
Freight Fluidity
• Transport Canada’s “fluidity indicator”
• Evaluate the performance of trade corridors and multi-modal supply chains.
• Measures total transit time and travel time
reliability of goods along defined supply chains.
Land Border Performance Measures
Border Freight Fluidity
How “fluid” the supply chains at international border crossings are operating in terms of
mobility and reliability.
Land Border Performance Measures
Two performance components: 1. Mobility and reliability measures:
o Delayo Extent/duration/intensity of congestiono Cost of wasted fuelo Cost of timeo Economic impacts
Border Freight Fluidity
2. How much freight is moved?o Truck volumes by time of day
Empty Loaded FAST Non-FAST
o Weighto Value (by commodity type)
Land Border Performance Measures
Challenges Capture additional information to supplement
current measures:• Volumes by empty, loaded, FAST, Non-FAST• Commodity (inside the box)• Annual Congestion Cost – value of truck
operating costs plus wasted fuel
Complement measures to include the whole supply chain

Opportunities Take advantage of emerging technologies
• GPS, Bluetooth, Wifi Develop additional applications with input
from private and public sector stakeholders• Annual Congestion Cost – value of truck
operating costs plus wasted fuel• Emissions
Provide information for border crossing operations to carriers, shippers, federal and state agencies
Thanks, Gracias
Juan Carlos VillaTexas A&M Transportation Institute
Mexico City [email protected]
979-862-3382+52-55-5254-1382