5 year strategic plan - sugar land, tx
TRANSCRIPT

5 Year Strategic Plan 1 PY 2009-PY 2013
5 Year Strategic Plan City of Sugar Land, Texas
This document includes Narrative Responses to specific questions
that grantees of the Community Development Block Grant, HOME Investment
Partnership, Housing Opportunities for People with AIDS and Emergency Shelter
Grants Programs must respond to in order to be compliant with the Consolidated
Planning Regulations.
GENERAL
Executive Summary
The Executive Summary is required. Include the objectives and outcomes
identified in the plan and an evaluation of past performance.
The geographic area covered by this Consolidated Plan is the City of Sugar Land,
Texas, located in Fort Bend County to the southwest of the City of Houston. With a
2000 population of 63,328 and a 2008 population of 91,805, Sugar Land is a fast-
growing suburban community that operates as a self-contained economic center and
is an integral part of the Houston Metropolitan area. While the Texas State Data
Center shows a 2008 population for Sugar Land of 91,805, the Census Bureau’s
2005-2007 American Community Survey’s 3-Year Estimates gives a 2007 population
of 71,367. The City of Sugar Land’s official current population estimate is 79,573.
The Community Development Block Grant (CDBG) program is aimed at serving low-
to moderate-income residents – those with incomes of 80 percent or less of the
area’s median household income. The latest complete Census of Population and
Housing by the U.S. Census Bureau indicated that there were 10,410 low-moderate
income residents in Sugar Land. In addition to serving low-moderate income
individuals throughout the City, the U.S. Department of Housing and Urban
Development places a priority on serving neighborhoods with a predominance of low-
moderate income residents. According to the 2000 Census, 12,589 people or 19.9
percent of the population resided in current CDBG-designated neighborhoods, or
Target Areas. Of these, 3,647 individuals were low-moderate income. An additional
6,763 people throughout the remainder of the City were low-moderate income in
2000. Extrapolating from the Texas State Data Center’s 2008 total population
estimate, there is an estimated 18,269 people currently in Sugar Land who are low-
moderate income. Since the target areas represent older neighborhoods, the total
population in them has not increased significantly, though the percent low-moderate
income has increased since 2000.
The Community Development Block Group program has a priority of inclusion in the
planning and implementation process. Therefore, the City of Sugar Land and its
CDBG consultants consult regularly with residents, agencies that are CDBG
subrecipients, other local service and housing providers, neighboring CDBG
Entitlement Jurisdictions, and county, regional and state agencies. The Community
& Environmental Services Department works directly with the Homeowner’s
Associations (HOAs) in Sugar Land, and with the CDBG program now under this

City of Sugar Land, Texas
5 Year Strategic Plan 2 PY 2009-PY2013
department, more involvement from the HOAs and their residents is anticipated.
Additionally, during quarterly monitoring of public service and housing rehabilitation
providers, the City’s consultants ask for input into the planning process and solicit
names and contact information for residents who may have complaints or
information that has been unvoiced.
The City of Sugar Land will continue to encourage citizen participation, with
particular emphasis on participation by persons of very-low, low, and moderate
income who are eligible for CDBG-funded services and residents of CDBG Target
Areas in which funds can be expended. All CDBG-related documents, including the
Consolidated Plan, Annual Action Plans, the Analyses of Impediment and Fair
Housing Plan, the annual CAPERs (Consolidated Annual Performance and Evaluation
Report), information gathered from public meetings/hearings, measurable
achievements and subrecipient monitoring results are available to the public for
review at any time. This availability is announced at all public meetings and
hearings.
The priority given to each category for the next five years is listed in the needs table
below and is based on several factors:
Level of available CDBG funding against program cost
Location of need for area-based projects (within CDBG Target Area)
Level of physical need described in City Comprehensive Plan and/or
Parks Master Plan for public facilities and infrastructure
Number of households or people in need based on Census, State and
local data from a variety of sources
Level of need described in applications for subrecipient funding and
numbers served by subrecipients in the past
Availability and capacity of agencies to address the need if funded
Results of an on-line survey of needs
Table 1 – Community Development Needs and Priorities
Matrix Code Activity Presumed Need (estimates)
Priority (H, M, L)
Target Area-Based Activities (Low-Mod Income Area)
03 Public Facilities (General) adequate M
03D Youth Centers 1 needed M
03F Parks, Recreational Facilities
150 acres of mini- and neighborhd parks
H ~9,500 linear feet of trails
1 recreation center
Improvements to 6 parks in target areas
03I Flood Drainage ~2,500 feet in target areas H
03J Water/Sewer Improvements
~500 feet in target areas
M
2 lift stations in target areas or serving target areas
03K
Street Improvements (including street lighting)
~89,400 square feet in target areas H
8,500 new & retrofit street lights for energy efficiency
03L Sidewalks ~1,615 linear feet in target areas (replacement) H
~9,500 linear feet in target areas (new)

City of Sugar Land, Texas
5 Year Strategic Plan 3 PY 2009-PY2013
03O Fire Stations/ Equipment Adequate M
03P Health Facilities Adequate L
03R Asbestos Removal privately managed L
04 Clearance/Demolition 30+ sites M
04A Cleanup Contaminated Sites 30 sites M
05I Crime Awareness adequate L
14E Commercial/Industrial Rehabilitation 10+ sites L
15 Code Enforcement 250+ lots M
16B Non-residential Historic Preservation 10+ sites M
18A
Economic Development Direct Assistance to For-Profits 4B Corporation to handle L
18B
Economic Development Technical Assistance 4B Corporation to handle L
18C Micro-Enterprise Assistance 4B Corporation to handle L
Low-Mod Income Clients or Households (any area)
03A Senior Centers improvements/expansion/1 more needed H
03B Handicapped Centers 2 needed M
03C Homeless Facilities adequate L
03M Child Care Centers adequate L
03Q Abused/Neglected Children Facilities adequate L
05 General Public Services 1,500+ low-mod income M
05A Senior Services 2,250+ seniors H
05B Handicapped Services 3,802 adults M
05C Legal Services 250+ low-mod income M
05D Youth Services 2,500+ youth H
05E Transportation Services 764 individuals H
05F Substance Abuse Services 1,900 individuals M
05G Domestic Violence Services 110 families per year H
05H Employment Training 2,300 adults M
05J Fair Housing Activities adequate L
05K Tenant/Landlord Counseling adequate L
05L Child Care Services 1,000+ children M
05M Health Services 15,840 adults + 5,684 children M
05N Abused/Neglected Children Services 120 children M

City of Sugar Land, Texas
5 Year Strategic Plan 4 PY 2009-PY2013
05O Mental Health Services 750 individuals M
05P
Lead Based Paint/Lead Hazard Screening 2,679 units M
05R/13
Homeownership Assistance
3,351 w/ cost burden M
4,890 need homebuyer assistance
05S Rental Housing Subsidies 1,018 w/ cost burden M
05T Security Deposits 750 households L
06 Interim Assistance 2,030 households M
12 Construction of Housing 434 owner occupied; 367 renter occupied L
14A
Single Family Housing Rehabilitation 4,299 units H
14B Multi-family Housing Rehabilitation 584 units M
14F Energy Efficiency Improvements 10,000+ units H
14G Acquisition for Rehabilitation < 100 units L
14I Lead Based Paint Abatement 2,679 units M
16A Residential Historic Preservation < 100 units M
19C Non-profit Capacity Building 10+ agencies M
19D
Assistance to Institutes of Higher Learning
1 community college L
1 upper division university.
19E
Operation and Repair of Foreclosed Properties 25 properties L
The Consolidated Plan outlines the level of need, the obstacles to meeting the needs
and the strategies for addressing the greatest number of needs in the City of Sugar
Land.
Strategic Plan
Due every three, four, or five years (length of period is at the grantee’s
discretion) no less than 45 days prior to the start of the grantee’s program
year start date. HUD does not accept plans between August 15 and
November 15.
Mission: The primary objective of the City of Sugar Land’s CDBG program is the
development of a viable urban community through the establishment of decent
housing, a suitable living environment, and economic opportunities primarily for low
and moderate income persons. These objectives are achieved through a

City of Sugar Land, Texas
5 Year Strategic Plan 5 PY 2009-PY2013
comprehensive approach to program implementation focused on infrastructure,
public services, and housing rehabilitation projects throughout the community. The
City of Sugar Land’s mission is to ensure that all areas of the City have comparable
city services and infrastructure and that all residents have equal access to programs.
The City of Sugar Land aims to be a place where residents of all income levels and
situations can enjoy all stages of their lives. The City will continue to use 4B
Economic Development and CDBG funds to enhance economic opportunities and
assist non-profit organizations, including housing rehabilitation providers, in meeting
the needs of their clients. In addition the City will continue to provide enhancements
to City infrastructure and facilities for use by residents of Sugar Land.

City of Sugar Land, Texas
5 Year Strategic Plan 6 PY 2009-PY2013
General Questions
1. Describe the geographic areas of the jurisdiction (including areas of low
income families and/or racial/minority concentration) in which
assistance will be directed.
The geographic area covered by this Consolidated Plan is the City of Sugar Land,
Texas, located in Fort Bend County to the southwest of the City of Houston. With a
2000 population of 63,328 and a 2008 population of 91,805, Sugar Land is a fast-
growing suburban community that operates as a self-contained economic center and
is an integral part of the Houston Metropolitan area. While the Texas State Data
Center shows a 2008 population for Sugar Land of 91,805, the Census Bureau’s
2005-2007 American Community Survey’s 3-Year Estimates gives a 2007 population
of 71,367. The City of Sugar Land’s official current population estimate is 79,573.
In 2007, the U.S. Department of Housing and Urban Development (HUD), with
information from the Bureau of the Census, updated the City’s level of low-moderate
income to qualify an area as a target area, as well as the list of census block groups
eligible as CDBG target areas. The City of Sugar Land has an exception to the 51-
percent rule for low-moderate income, and HUD has established qualifying areas as
those with 22.4 percent or greater low-moderate income. Two block groups that
were eligible based on 2007 estimates are, in fact, high-income newly developed
areas. In 2000, there were only one or two households located in these block groups
and those were rural low-moderate income households. Since 2000, the two areas
have developed into upper-middle and upper-income residential and mixed-use
areas, though the Census Bureau/HUD estimates do not reflect this new
development. Therefore, these two areas have not been included as part of the
City’s CDBG Target Areas. The map below shows the areas of the City which qualify
under HUD’s estimates and through the City’s demographic analysis. The
accompanying table is from HUD’s 2007 Low-Mod Income Block Group data, though
the population counts are from Census 2000.
The City of Sugar Land is the Lead Agency for the CDBG program and operates
under the Council-Manager form of government. Under this system, the City Council
appoints the City Manager, who acts as the chief executive officer of the
government. The City Manager carries out policy and administers city programs. All
department heads -- including the City Attorney, Police Chief and Fire Chief, are
ultimately responsible to the City Manager. The Community & Environmental
Services Department manages the CDBG program and oversees the development of
the Consolidated and Annual Action Plans, subrecipient agencies responsible for
carrying out the program and the reporting of results through IDIS and the CAPER.

City of Sugar Land, Texas
5 Year Strategic Plan 7 PY 2009-PY2013
Figure 1 – City of Sugar Land and CDBG Target Areas
Table 2 – Target Area Population and Percent Low-Mod Income
Tract-BG Area Name # Low-Mod Total Pop % Low-Mod
672200-2 Mayfield Park/The Hill 582 930 62.6
671600-1 Englewood Place 521 1,546 33.7
672800-1 Prison Staff Housing 74 238 31.1
674000-2 Grants Lake Apartments 617 2,236 27.6
671600-5 The Highlands 513 1,872 27.4
671600-4 The Highlands/Edgewater 550 2,452 22.4
673900-2 Barrington Place/Ashford
Lakes/Oak Hollow 34 125 27.2
674100-3 Chimneystone 492 2,013 24.4
672300-2 Covington Woods/Imperial Est. 264 1,177 22.4
Total 3,647 12,589 29.0
Barrington Plc/Ashford Lks/Oak HolllowCovington Woods/Imperial Est
Prison Staff Housing
Mayfield Park/The Hill
The Highlands
Englewood Place
Grants Lake Multi-FamilyChimneystone
The Highlands/Edgewater
Aus tin
Hig hway 6
Set tl e
rs W
ay
Gree n Fie lds
Se
ttlers W
ay
Curent Target Areas
City Limits
Streets

City of Sugar Land, Texas
5 Year Strategic Plan 8 PY 2009-PY2013
As can be seen from the table above, 12,589 people or 19.9 percent of the 2000
population resided in current CDBG Target Areas. Of these, 3,647 individuals were
low-moderate income. An additional 6,763 people throughout the remainder of the
City were low-moderate income in 2000. Extrapolating from the Texas State Data
Center’s 2008 total population estimate, there is an estimated 18,269 people
currently in Sugar Land who are low-moderate income. Since the target areas
represent older neighborhoods, the total population in them has not increased
significantly, though the percent low-moderate income has increased since 2000.
The City of Sugar Land does not target particular areas based on ethnic
concentrations. From the map below, it can be seen that only Mayfield Park/The Hill
has a majority minority population – 27.5% African American and 35% Hispanic. It
is also the area with the highest rate of low-moderate income – 62.6% - and has the
oldest housing stock. During the first eight years of the CDBG program, all of the
capital improvement funds from CDBG were expended in Mayfield Park to purchase
the neighborhood park and upgrade the streets, drainage and sidewalks. Now that
the improvements are complete, the City will focus on other target areas, each year
or multiple years expending the majority of the capital funds in a single
neighborhood until it is brought up to City standards. By concentrating on a single
area at a time, a bigger impact can be made by the City and recognized by
residents.
Figure 2 – Minority Population Concentrations
>= 25% African American
>= 25% Hispanic
>= 25% Asian

City of Sugar Land, Texas
5 Year Strategic Plan 9 PY 2009-PY2013
2. Describe the basis for allocating investments geographically within the
jurisdiction (or within the EMSA for HOPWA) (91.215(a)(1)) and the
basis for assigning the priority (including the relative priority, where
required) given to each category of priority needs (91.215(a)(2)).
Where appropriate, the jurisdiction should estimate the percentage of
funds the jurisdiction plans to dedicate to target areas.
The City of Sugar Land has developed a two-pronged approach to allocating
investments geographically: (1) respond to critical issues as they arise and (2)
concentrate the bulk of the public facilities and infrastructure projects in a specific
neighborhood over time until all priorities have been met. During the first eight
years of CDBG in Sugar Land, the City focused on the neighborhood in greatest
need, Mayfield Park. During that time, the park near the center of the neighborhood
was purchased from Imperial Sugar Company, and all of the streets in the
neighborhood were reconstructed with storm sewers and sidewalks added. The City
began in PY 2008 to work in the Chimneystone area providing extensive
improvements to Settlers Way Park in Chimneystone. Once the Park and other
physical needs are addressed in Chimneystone, the City will concentrate on a third
Target Area.
Though the focus is on one neighborhood at a time, the program is flexible enough
to allocate or reallocate funds to address more urgent needs as they arise.
Due to the age of housing and the average income of households in the Target
Areas, most housing rehabilitation does take place in the various CDBG Target Areas,
though it is not required. The housing rehabilitation program is based on household
income, not area eligibility. The vast majority of those households qualifying for
assistance have been located in Mayfield Park.
3. Identify any obstacles to meeting underserved needs (91.215(a)(3)).
The most obvious and pressing obstacle to meeting underserved needs is money.
With the City of Sugar Land receiving a little over $300,000 each year, the need far
outweighs the capacity. As a result, capital projects, such as street and park
improvements, public facility construction or improvements and infrastructure
programs require a multi-year tiered process.
The second major obstacle is the 15% cap on public services. The City of Sugar
Land is a relatively young community with capital improvement needs being
significantly fewer than in older central cities. However, the social service needs of
the residents are greater than are found in large cities. Due to the suburban nature
of Sugar Land, the number of accessible agencies, the capacity of existing provider
agencies, and the access to private dollars are much more limited than would be
found in Houston or other large cities. Therefore, those agencies that are providing
services to the residents have a greater per capita need with fewer collaborative
partners and fewer available private resources.
Lack of clean real estate titles also creates a major obstacle to meeting the housing
rehabilitation needs of the underserved. The Fort Bend CORPS, a non-profit
providing rehabilitation to owner occupied homes with CDBG and other funds, finds
that a significant proportion of applicants for housing rehabilitation do not have a
clean title to their homes. Most of these applicants are the children or grandchildren
of the original owners, and when the owners died, wills were not probated, titles
City of Sugar Land, Texas
5 Year Strategic Plan 10 PY 2009-PY2013
were not transferred and the heirs are living in the homes without proof of
ownership.
In summary, the City of Sugar Land strives to blend a focused approach to capital
needs with a comprehensive, broad-based approach to the housing and social service
needs of residents. Therefore, the City has developed a strategy to concentrate its
capital investments annually within the same target area until the overall needs are
adequately addressed. The City matches CDBG funds at least 1:1 for these capital
improvements. When an urgent need arises in a target area not highlighted at that
time, the City does allocate or reallocate CDBG and general fund dollars to address
the need.
Conversely, the City strives to ensure that all eligible residents throughout the City
Limits have equal access to the public services funded through CDBG or the City’s
general funds. The same philosophy is true for housing rehabilitation as the
contracting agency markets the program throughout all areas of Sugar Land to
ensure that all low-mod income homeowners have equal access to the rehabilitation
program.

City of Sugar Land, Texas
5 Year Strategic Plan 11 PY 2009-PY2013
Managing the Process (91.200 (b))
1. Lead Agency. Identify the lead agency or entity for overseeing the
development of the plan and the major public and private agencies
responsible for administering programs covered by the consolidated
plan.
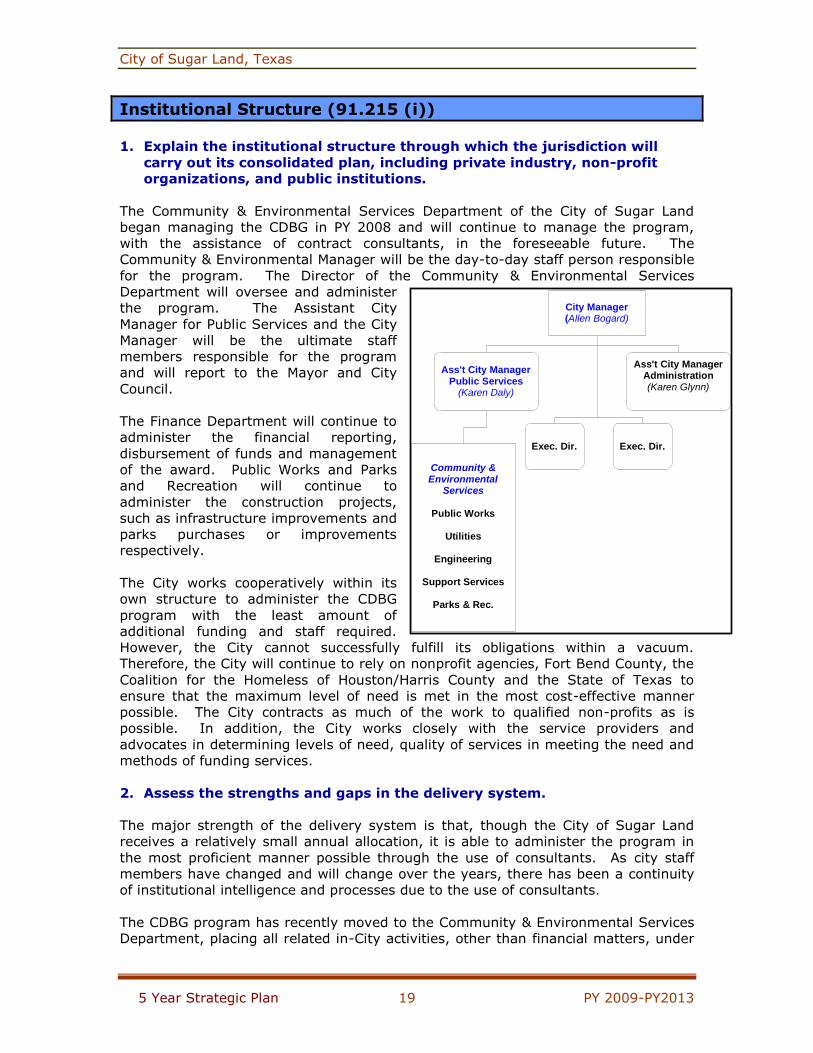
The City of Sugar Land is the Lead Agency for the CDBG Program and operates under
the Council-Manager form of government. Under this system, the City Council
appoints the City Manager, who acts as the chief executive officer of the
government. The City Manager carries out policy and administers city programs. All
department heads -- including the City
Attorney, Police Chief and Fire Chief,
are ultimately responsible to the City
Manager. The Community &
Environmental Services Department
manages the CDBG program and
oversees the development of the
Consolidated and Annual Action Plans,
the subrecipient agencies responsible
for carrying out the program and the
reporting of results through IDIS and
the CAPER. The current abbreviated
Organizational Chart for the City of
Sugar Land is provided, with the
Community & Environmental Services
Department (blue) reporting directly
to the Assistant City Manager over
Public Services (blue), who then
reports to the City Manager (blue).
2. Identify the significant aspects of the process by which the plan was
developed, and the agencies, groups, organizations, and others who
participated in the process.
In PY 2008, the City of Sugar Land is obligated to develop a 5-Year Consolidated Plan
using 2000 Census data, updated 2005-2007 average American Community Survey
data from the Census Bureau and other pertinent primary and secondary data. This
third Consolidated Plan covers PY 2009-PY 2013. The process of developing the
Consolidated Plan involved:
using as much reliable data as was available as well as the City’s 2004
Consolidated Plan and subsequent Annual Action Plans as benchmarks;
updating the demographic data with information provided through a number
of data providers, including HUD, the Census Bureau, the Texas State Data
Center, the State of Texas, and the U.S. Departments of Labor, Education,
and Health; and
obtaining maximum input into the process and the resulting information from
residents, city departments, the Fort Bend County Community Development
City Manager(Allen Bogard)
Ass't City ManagerAdministration(Karen Glynn)
Exec. Dir.Exec. Dir.
Community &Environmental
Services
Public Works
Utilities
Engineering
Support Services
Parks & Rec.
Ass't City ManagerPublic Services
(Karen Daly)
City of Sugar Land, Texas
5 Year Strategic Plan 12 PY 2009-PY2013
Department, developers, surrounding jurisdictions, nonprofit agencies, and
regional agencies including the Houston-Galveston Area Council (the regional
COG) and the Coalition for the Homeless of Houston/Harris County.
The City of Sugar Land uses consultants to assist in the management of the CDBG
program. These consultants work regularly with public agencies under whose
umbrella the City falls, such as the State and Council of Governments. Through
consultations with these agencies, the consultants ensure that the data and the plans
of each agency are considered in the City’s Consolidated Planning Process. In
addition, the plans of other city departments, including the Capital Improvement
Program (CIP) and the current Comprehensive Plan, form a foundation for the
Consolidated Plan. Surrounding CDBG Entitlement Jurisdictions have also been
consulted to better ensure a more cohesive county-wide provision of services.
3. Describe the jurisdiction's consultations with housing, social service
agencies, and other entities, including those focusing on services to
children, elderly persons, persons with disabilities, persons with
HIV/AIDS and their families, and homeless persons.
*Note: HOPWA grantees must consult broadly to develop a
metropolitan-wide strategy and other jurisdictions must assist in the
preparation of the HOPWA submission.
The City staff and CDBG consultants consult on a regular basis with those housing
and social services agencies that are subrecipients to CDBG. These agencies include:
Fort Bend CORPS that provides housing rehabilitation, energy efficiency
improvements, property clean-ups and other housing-related services through
CDBG, foundation and private funding, as well as volunteer labor. The
agency is the best provider of current housing condition and housing need
data for the City.
Fort Bend County Senior Citizens that provides services and advocacy for the
elderly of Fort Bend County, including Sugar Land and provides the City with
information regarding the needs of seniors in the community.
The Fort Bend Family YMCA provides services for the youth and elderly of Fort
Bend County, including Sugar Land and provides the City with information
regarding the recreational, safety and educational needs of youth and elderly
in the community.
The City of Sugar Land’s Senior Citizens Program in the Parks Department
provides a number of services to ambulatory elderly within the City.
Child Advocates of Fort Bend, along with the area’s Child Protective Services
office, that provide information regarding abused, neglected and endangered
children.
Fort Bend Literacy that provides information about the needs of immigrant
populations in Sugar Land – primarily Hispanic, Vietnamese, Chinese and
Cambodian – as well as the literacy needs of the entire community – English
as a Second Language and Adult Reading needs.
Fort Bend County Women’s Center that provides emergency shelter and a
cadre of other services to women and families who are homeless and/or are
victims of domestic violence or sexual assault. The agency provides current
information about the magnitude of need for shelter, transitional housing and
permanent housing for the homeless, as well as crisis intervention for those
at risk.

City of Sugar Land, Texas
5 Year Strategic Plan 13 PY 2009-PY2013
In addition to those agencies funded by Sugar Land’s CDBG program, the staff and
consultants also consult with other agencies to acquire the most current information
possible. The contract consultants are active participants and consultants with the
Texas Homeless Network and Coalition for the Homeless of Houston/Harris County
and are able to provide the most current information regarding the needs of the
homeless in Sugar Land. Fort Bend County, including Sugar Land, is a part of the
Coalition for the Homeless of Houston/Harris County and the most current
Continuum of Care application and homeless enumeration are used to determine the
level of need area-wide and an extrapolation for Sugar Land.
The Houston-Galveston Area Council (HGAC), the region’s COG, was consulted for
the plan and provided input into the issues that the organization sees within the
region, specifically Fort Bend County and Sugar Land. According to HGAC staff, one
of the major concerns facing Sugar Land and other suburban cities is the retention of
housing values and housing marketability for those more modest in-city houses built
before 2000. For those working in Houston but opting to reside in suburban areas
such as Sugar Land, proximity to local amenities is not as critical, leading the
Houston employment base to purchase new homes further from the suburban city’s
core. These new homes are priced comparable with older homes within Sugar Land
and provide more state of the art features in new subdivisions with more amenities.
As a result, it is important for the City to continue the housing rehabilitation program
and neighborhood improvements to help maintain property values and marketability
in the older neighborhoods. As more employment opportunities develop within
Sugar Land, distance to employment becomes a more important factor and older
homes near the employment centers, where commute time is less than 15 minutes,
will become more attractive than those in the extra-territorial jurisdiction (ETJ),
where commute time can be up to 45 minutes to an hour. Additionally, as the
population ages and as University of Houston-Sugar Land grows, a comprehensive
mix of housing for all life cycles and incomes becomes crucial.
Another issue mentioned by the HGAC staff is that of transportation and public
transit. There is a substantial need for bikeways to specific destinations rather than
for recreation, as well as public transit throughout Sugar Land and from Sugar Land
to other employment centers in Houston. However, there is not the critical mass to
support such efforts. Until the population in and around Sugar Land reach a level
that can support such major investments, it is not feasible. More marketing and
support is needed for the existing Fort Bend Transit which provides limited demand-
response transportation for the elderly and disabled, as well as limited transit from
Sugar Land to Galleria and Greenway Plaza. Currently, there is no route from Sugar
Land to downtown Houston and the anticipated route to the Texas Medical Center
has not begun at this time.

City of Sugar Land, Texas
5 Year Strategic Plan 14 PY 2009-PY2013
Citizen Participation (91.200 (b))
1. Provide a summary of the citizen participation process.
The City of Sugar Land is committed to involving all residents in its programs. The
City hosts numerous public hearings and public meetings to involve all interested
residents. The Community & Environmental Services Department works directly with
the Homeowner’s Associations (HOAs) in Sugar Land, and with the CDBG program
now under this department, more involvement from the HOAs and their residents is
anticipated. Additionally, during quarterly monitoring of public service and housing
rehabilitation providers, the City’s consultants ask for input into the planning process
and solicit names and contact information for residents who may have complaints or
information that has been unvoiced.
For this Consolidated Plan, the City of Sugar Land hosted two public meetings and
two public hearings. The public meetings were informal round-tables to solicit
concerns, issues and information from residents, business leaders and service
providers. The first public hearing was to garner information from attendees and
provide a pre-application workshop for prospective applicant agencies for funding.
The second public hearing was tied to the 30-day public comment period and gave
residents and interested parties an opportunity to publicly voice their opinions of the
plans or to have questions regarding the CDBG program and the proposed plans
answered. Both the public meetings and public hearings were advertised in the
general-circulation newspaper, as well as at City Hall and on the City website.
Copies of the advertisements have been included as attachments.
The Community Development public meetings and hearings discussed the CDBG
program, the Consolidated Planning process, Fair Housing rights and issues, eligible
activities and then opened the floor to comments, concerns, the ranking of issues
and recommendations. An on-line survey was posted on the City’s website and
paper copies were available at the public meetings and first public hearing for non-
electronic responses. These surveys asked individuals to prioritize issues within the
community and asked agencies to explain their services and detail barriers clients
face in securing decent, safe and fair housing. Copies of the presentations and the
survey have been included as attachments. The table below details the average
score for each item in the public survey:

City of Sugar Land, Texas
5 Year Strategic Plan 15 PY 2009-PY2013
Table 3 – Average Score from On-Line Survey
Issues
Average
Score
1= Very Low Need, 2 = Low Need, 3= Moderate Need
4= High Need, 5 = Very High Need
Owner-occupied housing needs in Sugar Land:
Minor Rehabilitation 2.14
Major Rehabilitation 1.69
Demolition/Reconstruction 1.51
Construction of New Affordable Housing 2.24
Energy Efficiency Improvements 3.26
Downpayment Assistance for 1st-time Buyers 2.14
Housing Counseling 2.56
Rental housing needs in Sugar Land:
Minor Rehabilitation 2.47
Moderate or Major Rehabilitation 2.28
Demolition/Reconstruction 1.67
Assisted Facilities for Frail Elderly 3.26
Assisted Facilities for Disabled 3.00
Apartments for Elderly 3.16
Handicapped-Accessible Apartments 2.68
Rental Units for Small Households 2.27
Rental Units for Large Households 1.86
Public facilities needs in Sugar Land:
Multi-service/Recreational Facility 3.08
Public Neighborhood Parks 3.08
Senior Center 3.42
Day Center for Disabled 2.86
Child Care Center 2.39
Improved Flood Control/Drainage 3.14
Improved Water/Sanitary Sewer Lines 3.08
Improved Sidewalks/Street Lighting 3.26
Social service needs in Sugar Land:
Services for abused/neglected children 3.18
Services for victims of domestic violence 3.62
Services and shelter for homeless 2.34
Legal services 2.76
Child care 2.61
Youth services 3.42
Senior services 3.55
Handicapped services 3.19
ESL/Literacy education/Adult education 2.97
Mental health and/or substance abuse services 2.82
Emergency, interim assistance 2.78
Health services 3.16
Transportation services 3.39
City of Sugar Land, Texas
5 Year Strategic Plan 16 PY 2009-PY2013
In addition, during the early stages of plan development, the Community &
Environmental Services Department made presentations at four City Council
workshops, all of which were open to the public. The City and its consultants
continue to meet with a number of non-profit agencies, civic associations and
community groups.
On July 2, 2009 the City of Sugar Land posted the Consolidated Plan for public
comment with notice of the 30-day comment period posted in the general circulation
newspaper and on the City’s website. A summary of the City of Sugar Land’s 2009
Consolidated Plan was advertised, and the entire 2009 Consolidated Plan was
available for review at City Hall.
On August 4, 2009 the Community & Environmental Services Department presented
an Action Item to the City Council for the approval of the Consolidated Plan,
including the PY 2009 Annual Action Plan. No written comments were received on
the Consolidated Plan or Action Plan during the comment period of July 2, 2009
through August 3, 2009.
The City of Sugar Land will continue to encourage citizen participation, with
particular emphasis on participation by persons of very-low, low, and moderate
income who are eligible for CDBG-funded services and residents of CDBG Target
Areas in which funds can be utilized. The CDBG program is now under the
Community & Environmental Services Department which works directly with the
various Homeowner’s Associations (HOAs) in Sugar Land. A concerted effort will be
made to encourage citizen participation through the HOAs.
All CDBG-related documents, including the Consolidated Plan, Annual Action Plans,
the Analyses of Impediment and Fair Housing Plan, the annual CAPER (Consolidated
Annual Performance and Evaluation Report), information gathered from public
meetings/hearings, measurable achievements and subrecipient monitoring results
are available to the public for review at any time. This availability is announced at
all public meetings and hearings.
As part of the Sugar Land Consolidated Plan, the Citizen Participation Plan outlines
the criteria the jurisdiction will use for determining what changes in the planned or
actual activities constitute a substantial amendment to the Consolidated Plan and
Annual Action Plan. These substantial amendments are subject to the Citizen
Participation process. The City of Sugar Land considers a substantial amendment to
the Consolidated Plan to occur when an activity, as outlined in an Annual Action Plan
or Annual Action Plan amendment, for which funding is requested is not part of the
medium or high priorities outlined in the Strategic Plan (Consolidated Plan). Any
activity that was not included in the Consolidated Plan or was given a low priority will
result in a substantial amendment to the Consolidated Plan.
During a program year, any change in fund allocation from the Annual Action Plan
will be considered a substantial amendment to the Annual Action Plan if:
20% or more of the total annual allocation is redirected from one current
year activity to another existing current year activity; or
10% or more of the total annual allocation is redirected from a current
year activity to a new activity that was not part of the Annual Action Plan.

City of Sugar Land, Texas
5 Year Strategic Plan 17 PY 2009-PY2013
The City of Sugar Land provides access to residents and subrecipients for filing
complaints. All public reports – Consolidated Plan, Annual Action Plan, Fair Housing
Plan and Citizen Participation Plan as part of the Consolidated Plan and CAPER – are
available for review and comment at any time. The City staff is available to meet
with any resident or agency representative to discuss concerns and complaints. The
concerns and complaints filed in writing become part of the public record. A formal
response to the concerns or complaints also will be filed in writing and made part of
the public record as well as provided in writing to the complainant. The City of Sugar
Land will provide a written response to all written complaints within 15 days.
Any resident or recipient of services funded by the City of Sugar Land’s CDBG
program may file a complaint against the CDBG-funded service provider. All
complaints will be addressed, and written complaints will receive a written response
within 15 days. The City will notify the agency and will endeavor to provide
mediation between the complainant and the agency. In the case of valid complaints,
the City will work with the agency to rectify the problem. If the agency is unwilling
or unable to correct valid problems, then the City may terminate funding until such
time as the issue is resolved.
The area service providers perform an extremely valuable role in ensuring that all
eligible residents receive needed services and that clients of all CDBG subrecipient
agencies are informed about the CDBG program. In an attempt to assist the service
providers in accessing additional funds and improving/enhancing services and
information flow, the City consultants will continue to work one-on-one with
providers. The consultants are available for telephone or on-site consultation
regarding fundraising, program development, program evaluation, marketing, multi-
agency collaboration and performance reporting. During the monitoring sessions,
the consultants allow for time to discuss issues and concerns that the subrecipient
has and to provide technical assistance in addressing the concerns. The consultants
and the City staff have made themselves available to meet with consumers of the
various public service programs, particularly in a group setting at the site of the
service provider. These meetings are for the purpose of addressing consumer
concerns, assisting agencies and consumers in identifying and accessing ancillary
services, and alerting the City to needs in the community. The City staff and
consultants follow-up with the agency by providing technical assistance for program
enhancement, issue resolution and/or program development.
2. Provide a summary of citizen comments or views on the plan.
No written comments were received on the Consolidated Plan during the comment
period of July 2, 2009 through August 3, 2009.
3. Provide a summary of efforts made to broaden public participation in the
development of the consolidated plan, including outreach to minorities
and non-English speaking persons, as well as persons with disabilities.
The City of Sugar Land continues to attempt to broaden public participation in the
development of the Consolidated Plan and Annual Action Plans. Outreach during the
development process included notifying the HOAs of the planning process and
opening the HOA meetings for discussion when the Community & Environmental
Services Department was present. The City also requested that each service agency

City of Sugar Land, Texas
5 Year Strategic Plan 18 PY 2009-PY2013
attending the pre-application workshop encourage and assist their clients to
complete the on-line survey and/or contact the City with comments. The City works
with the Literacy Council of Fort Bend County to notify and solicit input from
residents with limited English proficiency. Agencies serving the disabled are also
encouraged to make clients aware of the CDBG program and plans and to assist
clients in accessing, understanding and commenting on the Consolidated Plan during
the 30-day comment period.
4. Provide a written explanation of comments not accepted and the reasons
why these comments were not accepted.
The City of Sugar Land accepts all comments regardless of their nature and
relevance to the CDBG program. Those comments that are directly relevant to the
CDBG program are considered in developing the plans and funding the activities. If
a comment can not be implemented due to funding constraints or HUD eligibility, the
City makes every attempt to explain the reasons behind non-inclusion to the
resident. Those comments that are not relevant to CDBG are also addressed with
the Community & Environmental Services Department or consultants assisting the
resident in directing the comment or question to the proper agency or city
department.
*Please note that Citizen Comments and Responses may be included as
additional files within the CPMP Tool.
City of Sugar Land, Texas
5 Year Strategic Plan 19 PY 2009-PY2013
Institutional Structure (91.215 (i))
1. Explain the institutional structure through which the jurisdiction will
carry out its consolidated plan, including private industry, non-profit
organizations, and public institutions.
The Community & Environmental Services Department of the City of Sugar Land
began managing the CDBG in PY 2008 and will continue to manage the program,
with the assistance of contract consultants, in the foreseeable future. The
Community & Environmental Manager will be the day-to-day staff person responsible
for the program. The Director of the Community & Environmental Services
Department will oversee and administer
the program. The Assistant City
Manager for Public Services and the City
Manager will be the ultimate staff
members responsible for the program
and will report to the Mayor and City
Council.
The Finance Department will continue to
administer the financial reporting,
disbursement of funds and management
of the award. Public Works and Parks
and Recreation will continue to
administer the construction projects,
such as infrastructure improvements and
parks purchases or improvements
respectively.
The City works cooperatively within its
own structure to administer the CDBG
program with the least amount of
additional funding and staff required.
However, the City cannot successfully fulfill its obligations within a vacuum.
Therefore, the City will continue to rely on nonprofit agencies, Fort Bend County, the
Coalition for the Homeless of Houston/Harris County and the State of Texas to
ensure that the maximum level of need is met in the most cost-effective manner
possible. The City contracts as much of the work to qualified non-profits as is
possible. In addition, the City works closely with the service providers and
advocates in determining levels of need, quality of services in meeting the need and
methods of funding services.
2. Assess the strengths and gaps in the delivery system.
The major strength of the delivery system is that, though the City of Sugar Land
receives a relatively small annual allocation, it is able to administer the program in
the most proficient manner possible through the use of consultants. As city staff
members have changed and will change over the years, there has been a continuity
of institutional intelligence and processes due to the use of consultants.
The CDBG program has recently moved to the Community & Environmental Services
Department, placing all related in-City activities, other than financial matters, under
City Manager(Allen Bogard)
Ass't City ManagerAdministration(Karen Glynn)
Exec. Dir.Exec. Dir.
Community &Environmental
Services
Public Works
Utilities
Engineering
Support Services
Parks & Rec.
Ass't City ManagerPublic Services
(Karen Daly)

City of Sugar Land, Texas
5 Year Strategic Plan 20 PY 2009-PY2013
the same Assistant City Manager. The Community & Environmental Services
Director oversees the Support Services Division, under which CDBG falls.
The primary gap in the delivery system at this point is the recent transfer of the
program to a new department and staff person. The individual responsible for the
CDBG program is currently accessing as much training as possible to become
knowledgeable about the program. With contract consultants assisting in the
delivery system functions and the training of the City staff, the gap is not a major
problem.
3. Assess the strengths and gaps in the delivery system for public housing,
including a description of the organizational relationship between the
jurisdiction and the public housing agency, including the appointing
authority for the commissioners or board of housing agency, relationship
regarding hiring, contracting and procurement; provision of services
funded by the jurisdiction; review by the jurisdiction of proposed capital
improvements as well as proposed development, demolition or
disposition of public housing developments.
Neither the City of Sugar Land nor Fort Bend County, in which Sugar Land sits, has a
public housing agency. No public housing is available in the County, and Section 8
Housing Choice Vouchers are only available through the State of Texas. Therefore,
this section is not applicable.

City of Sugar Land, Texas
5 Year Strategic Plan 21 PY 2009-PY2013
Monitoring (91.230)
1. Describe the standards and procedures the jurisdiction will use to
monitor its housing and community development projects and ensure
long-term compliance with program requirements and comprehensive
planning requirements.
The City of Sugar Land’s monitoring strategy is designed to assist staff in fulfilling its
regulatory obligation in monitoring subrecipients, including city departments, as well
as assist subrecipients in best serving their consumers. The primary purpose for this
monitoring strategy is to ensure proper program performance, financial performance
and regulatory compliance in accordance with HUD regulations. The secondary
purpose is to ensure that the funded agencies are providing the best and most cost
effective services possible and that they are positioned to access additional funding
from non-HUD sources. In addition, a tertiary purpose is to ensure that the funded
agencies are provided the best technical assistance possible to enhance their
capacity and service delivery systems.
The Community & Environmental Services Department will continue to be responsible
for ensuring that each subrecipient, including each recipient city department, is
adhering to their approved scope of service, budget and service schedule. Each
subrecipient agency or City department must also abide by the regulatory guidelines
set forth by HUD in providing benefits to low-moderate income persons and/or
eliminating a slum or blighted condition.
The monitoring process is an on-going one of planning, implementation,
communication and follow-up. Under normal circumstances, monitoring is conducted
two to three times per year. However, if the activity or program is considered to
have a high-risk of non-compliance, a more frequent monitoring schedule is
developed based on these factors and the nature of the activity or program being
performed. High risk programs include multiple activities by one agency, programs
undertaken by any one subrecipient or city department for the first time, programs
undertaken by small agencies with limited capacity and programs undertaken by an
agency or department with a history of staff turnovers, reporting problems, or
monitoring issues. Projects with a short time-frame, such as summer programs for
youth, will be monitored once during the year but also may be visited by staff or
consultants at the beginning of the program. One-time special projects, such as the
delivery of school supplies for disadvantaged youth, will be overseen by the
Community & Environmental Services Department staff member or consultant.
Monitoring provides a basis for assessing a program’s operations and identifying
problems. In addition, it allows the City to obtain ongoing data for use in
determining program achievement. Evaluations will summarize monitoring findings
and program goals, and they will measure the progress toward meeting those goals
during the provision of services.
The Community & Environmental Services Department has the responsibility for
overall CDBG performance and Consolidated Plan compliance, including the
performance of its subrecipients. Clear record keeping requirements are essential
for grant accountability. Responsibility for maintaining many of the records is
assigned to the subrecipients and contracted city departments. This responsibility

City of Sugar Land, Texas
5 Year Strategic Plan 22 PY 2009-PY2013
includes documenting activities with special requirements, such as necessary
determinations, income certifications or written agreements with beneficiaries, where
applicable.
The monitors make site visits to the activities or projects of each subrecipient or
contracted city department. The monitoring process consists of the monitors
examining time records, client files, financial records and CDBG-funded equipment or
machinery. The monitors discuss security measures that a subrecipient or city
department has in place to avoid theft of federally-funded purchases, if applicable.
The monitors also examine all CDBG-funded equipment or machinery for the City’s
identification number. This examination is done to ensure that any equipment or
machinery purchased with CDBG funds is being used to meet a national objective
and to ensure that any equipment purchased with CDBG funds through a
subrecipient will be used to meet said objective.
At the beginning of each Program Year, the Community & Environmental Services
Department and consultants meet with each subrecipient to provide reporting forms,
discuss expectations and enter into a 12-month contract for services. Before the
Community & Environmental Services Department and/or consultants conduct the
actual monitoring visit, a pre-monitoring contact is made with the designated
person(s) at the subrecipient agency or city department to discuss the overall
expectations, information to be viewed and site visits. This initial contact allows staff
and consultants to discuss solutions to possible problems that may have occurred
from past experiences with a particular subrecipient or city department.
The procedure for conducting the monitoring consists of the following:
1. Prior to the actual award contracts, the Community & Environmental Services
Department and consultants hold a meeting at City Hall with each
subrecipient. At that time, the monitoring procedures, reporting procedures
and expectations are discussed, and reporting forms are provided in hard-
copy and electronic formats.
2. If necessary, an additional one-on-one interview at the subrecipient’s office is
performed to further explain expectations.
3. At least twice during the year, each subrecipient is notified of an on-site
monitoring and given the date, time, place and information to be
viewed/discussed.
4. A conference is held with a Board Member, Executive Director, Department
Head and staff persons working with or salaried through the program or
activity being funded.
5. The actual monitoring visit is conducted by viewing documentation such as
random client files, and if applicable, viewing rehabilitated sites, structures
and the like. The monitor then completes the monitoring interview form that
is maintained in the subrecipient’s file at the City.
6. Monitoring visits conclude with the Community & Environmental Services
Department or consultants advising the subrecipient of any deficiencies.
7. When/if deficiencies or findings occur, a monitoring letter is transmitted to
the subrecipient advising of the deficiencies, findings (which are violations of
laws or regulations which can result in the deobligation of funds) or concerns
(which could result in a finding if not properly corrected).
8. The Community & Environmental Services Department and consultants then
work with the subrecipient to assist in rectifying the deficiencies, concerns or
findings.

City of Sugar Land, Texas
5 Year Strategic Plan 23 PY 2009-PY2013
During a monitoring visit, the monitors have the right to view any and all files that
are related to a particular program or activity that is being funded with CDBG funds.
Monthly Beneficiary and Progress Reports for city departments are due on or
before the 10th of each month. Continual delays may affect future allocations.
Monthly Beneficiary, Progress and Expenditure Reports for subrecipients are
due on or before the 15th of each month. Continual delays in the submissions
of these reports will affect this grant allocation and future allocations.
Copies of invoices, canceled checks, etc. are requested as documentation
along with the Monthly Beneficiary, Progress and Expenditure Reports.
Any subrecipient that receives $300,000 or more in federal funds in one (1)
year must have an independent audit performed which complies with the OMB
Circular A-133 Single Audit Act.
In addition to the on-site monitoring, each subrecipient is required to submit
monthly, bi-monthly or quarterly reports that include reimbursement requests with
all back-up documentation and a cost control summary report, client lists, client
summary reports and Board of Directors meeting minutes. For the first submission
of the program year and any subsequent submissions when there have been staff
changes, the subrecipient must submit an employee data report detailing the age,
gender and race/ethnicity of staff members by job title. The Community &
Environmental Services Department and/or consultants review each packet of
information for completeness and accuracy, and no reimbursements are made until
the packet of information meets city standards.
The Public Works Department is responsible for monitoring all CDBG-funded
infrastructure construction and rehabilitation activities. All such activities are
monitored for Davis-Bacon Wage Rate compliance. Activities that provide any type
of housing assistance are monitored for compliance with Fair Housing and Equal
Opportunity (FHEO) laws. City staff also reviews projects for compliance with the
Lead-Based Paint Ordinance, housing quality standards, city building codes and other
rules, as appropriate. For infrastructure and other projects that fall under the
regulations of the Davis-Bacon Act, the responsible city department works with the
Community & Environmental Services Department and consultants to ensure that all
applicable EEO and Davis-Bacon posters are posted at the job site and employee
interviews are conducted. Bid packets, contracts, certified payrolls and other
documents pertaining to the project may be maintained in the offices of the
responsible department subject to review by the Community & Environmental
Services Department and/or consultants. If the responsible department houses the
construction documentation, it will provide the Community & Environmental Services
Department with a list of all documents by folder or binder and the list will be
maintained in the CDBG files.
The City of Sugar Land’s CDBG program must meet all requirements set forth by the
U.S. Department of Housing and Urban Development and the Office of Management
and Budget. The City conducts an independent audit annually to ensure that CDBG
funds are used in accordance with program requirements.
The monitoring strategy is designed to be an effective, productive and collaborative
effort between the City’s Community & Environmental Services Department, its
consulting team and subrecipients or contractors of the CDBG program to assist
them in efficiently providing the best services to low-moderate income residents of
Sugar Land.
City of Sugar Land, Texas
5 Year Strategic Plan 24 PY 2009-PY2013
Priority Needs Analysis and Strategies (91.215 (a))
1. Describe the basis for assigning the priority given to each category of
priority needs.
The process and basis for assigning the priority given to each category of need was
based on input from a variety of sources:
Objective quantitative information from:
Census Bureau – 2000 Census (disability, language, education, housing age,
persons per room, housing conditions, housing costs as percent of income,
household structure, PUMS cross-tabulation data), American Community
Survey (population, disability, unemployment, income, race/ethnicity,
language, age, housing age, housing conditions, housing value, housing costs
as percent of income, household structure)
HUD (housing needs from HUD’s Comprehensive Housing Affordability
Strategy – CHAS – and Affordability Mismatch tables, Property Owners and
Managers Survey from HUDUSER)
State of Texas (health insurance, medical professionals, substance abuse,
mental illness, disabilities, Low Income Housing Tax Credit properties,
environmental issues, lead poisoning information and Texas State Data
Center’s population forecasts)
City of Sugar Land (infrastructure, parks, code enforcement, non-residential
structures, vacancies, delinquent taxes, CIP plans, Comprehensive Plan, Parks
Master Plan, ordinances)
Real Estate files (available owner and renter-occupied housing by value or
rent and foreclosures)
Federal Finance Institution (Housing Mortgage Disclosure Act data)
Coalition for the Homeless of Houston/Harris County
Subrecipient client data
Qualitative information from:
Subrecipients and other non-profit service providers
Houston-Galveston Area Council
Coalition for the Homeless of Houston/Harris County
Subjective information from:
Subrecipients and other non-profit service providers
Residents and other responders to survey
City staff
City Council
Consultants
Estimates of quantifiable need for each HUD Matrix Code were developed. From
these needs and the feedback from the subrecipients, area agencies, residents, city
staff, City Council and consultants, the priorities were set. Priorities were based on
the level of need, need as a percent of total population, criticalness of need
(hazardous to life, hazardous to health/well-being, detrimental to quality of life,
detrimental to vibrancy and viability of City), as well as existing providers to meet
the need and the likelihood of the need to be addressed during the next five years.

City of Sugar Land, Texas
5 Year Strategic Plan 25 PY 2009-PY2013
2. Identify any obstacles to meeting underserved needs.
The main obstacle to meeting underserved needs is money. This situation is
especially true with the recession the country is facing at this time. Not only are
needs increasing dramatically due to the stresses of economic recession, but
available funds from foundations and private donations are down considerably. Even
in the best of economic times, the CDBG allocation plus the funds available from
other Federal grants, foundations and private donations cannot begin to address all
of the needs of Sugar Land residents.
A second obstacle to meeting underserved needs also is related to money, in regards
to the 15 percent cap for public services placed by legislation on HUD’s CDBG
program. The City of Sugar Land sees a great need for and benefit from allocating a
larger percentage of the CDBG allocation to public service projects that can reach the
needs of more low-moderate income residents throughout the City.
A third obstacle is the shortage of viable entities to provide some of the needed
services. There are small non-profits with little or no capacity to address some of
the most critical needs, such as those with mental illness, mental disabilities,
physical disabilities or HIV/AIDS.
A previous obstacle, transportation, has begun to be alleviated. Within the past
three years, Fort Bend Transit has begun providing services to Sugar Land. They
have a commuter program from the University of Houston-Sugar Land and First
Colony Mall in Sugar Land to Houston’s Galleria and Greenway Plaza office
complexes. They will soon add a route to the Texas Medical Center in Houston. In
addition, they have a demand response for the elderly and/or disabled of any income
throughout Fort Bend County, including Sugar Land, and by 2010, they will have a
“New Freedom” demand response for low-moderate income disabled. The obstacle
now is a lack of sufficient marketing to let the service agencies and residents know of
the service and how to access it.
Lead-based Paint (91.215 (g))
1. Estimate the number of housing units that contain lead-based paint
hazards, as defined in section 1004 of the Residential Lead-Based Paint
Hazard Reduction Act of 1992, and are occupied by extremely
low-income, low-income, and moderate-income families.
One of the issues with older housing stock is the problem of lead poisoning,
particularly in children under the age of 6 years, due to the ingestion and/or inhaling
of lead-based paint chips and dust. Lead-paint dust seeps into the walls, floors and
the soil and is breathed into the lungs. Until 1978, when lead-based paint was
outlawed, most homes used this paint for the exterior siding and the interior
framework. Elevated blood lead levels can be very dangerous to children, resulting in
reduced intelligence, behavioral problems, learning disabilities, and permanent brain
damage.
HUD has derived a formula for estimating the number of housing units with lead-
based paint: 90 percent of housing built before 1940 is likely to have lead-based

City of Sugar Land, Texas
5 Year Strategic Plan 26 PY 2009-PY2013
paint and a poisoning danger; 80 percent of those homes built between 1940 and
1959 pose a danger; and 62 percent of those homes built between 1960 and 1979
pose a danger. Using these estimated rates from HUD, it can be assumed that 2,679
units in Sugar Land have lead-based paint that can pose a hazard. These units
represent 12.7 percent of all housing in Sugar Land. Figure 3 illustrates the location
of housing by the average year built. While there are no definitive data on the
number of homes with lead-based paint in relation to the income of the residents, it
can be estimated that approximately 11.6 percent of all housing, or 91.3 percent of
the housing with possible lead-based paint hazards, is occupied by low-moderate
income residents. This calculation translates to 2,454 housing units occupied by low-
moderate income households.
Figure 3 – Block Groups by Average Year Housing Built
City Limits
Built before 19601960-19691970-1979After Lead-paint outlawedNo pre-2000 housing
Block Groups by Average year housing built

City of Sugar Land, Texas
5 Year Strategic Plan 27 PY 2009-PY2013
It cannot be assumed that every case of elevated blood lead levels (BLLs) is due to
exposure to lead-based paint, particularly lead-based paint in a child’s home.
However, lead poisoning cases can assist in measuring the magnitude of the
problem. According to the Centers for Disease Control and Prevention, there is not a
lower threshold for some adverse effects of lead in children and even blood lead
levels as low as 10 micrograms/deciliter (ug/dL) have harmful effects. Children with
venous blood lead levels of 20 ug/dL or above or with BLLs in the range of 15-19
ug/dL over a period of 3 months need a doctor’s care. The Texas Department of
Health’s Environmental Epidemiology and Toxicology Division/Texas Child Lead
Registry monitors lead poisoning cases. The agency’s most recent annual report
indicates that 2,200 children out of 37,032 under six years of age living in Fort Bend
County were reported tested for blood lead and 18 showed elevated blood lead levels
(EBLs). If the 2,200 is a representative sample of the County, then it can be
assumed that approximately 305 children in Fort Bend County have EBL levels. This
would translate into approximately 30 within Sugar Land that could potentially have
EBL levels.
2. Outline actions proposed or being taken to evaluate and reduce lead-
based paint hazards and describe how lead based paint hazards will be
integrated into housing policies and programs, and how the plan for the
reduction of lead-based hazards is related to the extent of lead poisoning
and hazards.
The City requires that its housing rehabilitation subrecipient, the Fort Bend CORPS,
evaluate every house to be rehabilitated for lead-based paint hazards. If the
rehabilitation will disturb any exteriors or interiors that have paint, a lead-based
paint test is performed. The housing rehabilitation subrecipient contracts to certified
lead testers for all lead-based paint tests and contracts to certified contractors for all
ameliorations required when lead-based paint is found in homes where the repairs or
rehabilitation will disturb the paint. In addition, the Fort Bend CORPS alerts
residents of older housing of the lead-paint and other lead poisoning hazards and
provides information regarding testing and amelioration.
The City, through its contract with Fort Bend CORPS as a housing rehabilitation
subrecipient, will continue to provide information to neighborhood organizations,
applicants for rehabilitation work and interested residents regarding lead poisoning
and hazards and how to identify problems, receive blood tests and access treatment.

City of Sugar Land, Texas
5 Year Strategic Plan 28 PY 2009-PY2013
HOUSING
Housing Needs (91.205)
*Please also refer to the Housing Needs Table in the Needs.xls workbook
1. Describe the estimated housing needs projected for the next five year
period for the following categories of persons: extremely low-income,
low-income, moderate-income, and middle-income families, renters and
owners, elderly persons, persons with disabilities, including persons with
HIV/AIDS and their families, single persons, large families, public
housing residents, victims of domestic violence, families on the public
housing and section 8 tenant-based waiting list, and discuss specific
housing problems, including: cost-burden, severe cost- burden,
substandard housing, and overcrowding (especially large families).
The latest available data for defining housing needs are from the 2000 Census as
tabulated by HUD. The Comprehensive Housing Affordability Strategy (CHAS)
provides Census 2000 data on the number of households by income, housing
problems and cost burdens for a variety of demographics and situations. Six tables
are provided in this Consolidated Plan to detail the information for total households,
households by race/ethnicity and households with a disabled householder. The map
directly below shows the low-moderate income owner-occupied and renter-occupied
units that had a 30 percent or greater cost burden in 2000. The following map
shows the cost burden by tenure (renter or owner occupied) for various income
categories.

City of Sugar Land, Texas
5 Year Strategic Plan 29 PY 2009-PY2013
Figure 4 -- 2000 Low-Mod Income Units with Cost Burden of >=30%
Low-Mod Income Owner UnitsLess than 5% w/ Cost Burden
5-9.9%
10-20.8%
Low-Mod Income Rental Units
Less than 5% w/ Cost Burdent5-9.9%
10-19.9%
20-36.7%

City of Sugar Land, Texas
5 Year Strategic Plan 30 PY 2009-PY2013
Figure 5 – 2000 Housing Cost Burden by Tenure and Income
The table below takes the 2000 CHAS and extrapolates it to 2007 using the 2005-
2007 American Community Survey 3-Year Estimates.
Low-mod Income
Income 80-95% of Median
Income > 95% of Median
Share of Total Renters with
Cost Burden of => 30%
Share of Total Owners with
Cost Burden of => 30%
Low-mod income
Income 80-95% of Median
Income > 95% of Median

City of Sugar Land, Texas
5 Year Strategic Plan 31 PY 2009-PY2013
Table 4 – Change in Cost Burdened Households 2000 to 2007
2000 CHAS 2005-2007 Estimate
Total Households 20,513 21,593
Owner-Occupied 16,592 17,925
Owners Paying 30%+ for
Housing
With Mortgage
3,074 (22.14%)
With No Mortgage
305 (11.25%)
All Owner-Occupied
3,379 (20.36%)
With Mortgage
4,111 (30.35%)
With No Mortgage
200 (4.57%)
All Owner-Occupied
4,311 (24.05%)
Renter Occupied 3,151 3,668
Renters Paying 30%+ for
Housing
1,018
(32.31%)
1,513
(41.25%)
As can be seen, the percent of renters who now have a housing cost burden has
increased by nearly nine points since 2000. The percent of owners with a cost
burden has increased just over three percentage points, with the decrease in the
percent of cost-burdened owners with no mortgage greatly offsetting the more than
eight percentage point increase in those with a mortgage. Nearly one-third of all
homeowners with a mortgage are paying more than 30 percent of their income for
housing. According to the 2005-2007 American Community Survey 3-Year
Estimates, the median monthly housing costs for homeowners is $1,694, while for
renters, it is $1,179. These housing costs include mortgage, insurance, taxes and
utilities for owners and rent and utilities for renters. While homeownership is often
more costly than renting, 24.4 percent of the owners have no mortgage according to
the 2005-2007 American Community Survey 3-Year Estimates. These owners have a
median monthly expense of $803, while the 75.6 percent with a mortgage have a
median cost of $1,983.
The next six pages provide the 2000 Comprehensive Housing Affordability Strategy
data for total households and then for Anglo, African American, Hispanic and Asian
race/ethnicities. Data for other races were suppressed due to the small number of
households within Sugar Land. The CHAS tables detail cost burden and housing
problems for the total households, but only housing problems by race/ethnicity and
for the disabled. However, cost burden is embedded in the “housing problems”
category. For the CHAS tables, “housing problems” are defined as those houses
meeting one or more of the following conditions: (1) a cost burden of 30 percent or
greater; (2) overcrowding (more than 1 person per room); (3) lacking some kitchen
facilities and/or (4) lacking some plumbing facilities. If any of these four conditions
are met, then the house is defined by the CHAS as having a housing problem. The
Census Bureau no longer asks questions regarding the structural soundness of the
dwelling; therefore, overcrowding and lacking some kitchen facilities or plumbing are
the closest proxies for unsound housing, especially when coupled with a cost burden.
Overcrowding puts additional wear and tear on a house, and a cost burden most
often results in deferred maintenance.

City of Sugar Land, Texas
5 Year Strategic Plan 32 PY 2009-PY2013
Table 5a --Households by Income, Cost Burden and Housing Problems
Name of Jurisdiction: Source of Data: Data Current as of:
Sugar Land(CDBG), Texas CHAS Data Book 2000
Renters Owners
Household by Type, Income, & Housing Problem
Elderly Small
Related Large
Related All Total Elderly Small
Related Large
Related All Total Total
1 & 2 (2 to 4) (5 or more) Other Renters 1 & 2 (2 to 4)
(5 or more) Other Owners Households
member Households member Households
households households
(A) (B) (C) (D) (E) (F) (G) (H) (I) (J) (L)
1. Household Income <=50% MFI 152 279 56 255 742 321 495 50 111 977 1,719
2. Household Income <=30% MFI 100 150 32 132 414 161 203 14 56 434 848
3. % with any housing problems 60 81.3 100 52.3 68.4 82 96.1 100 75 88.2 78.5
4. % Cost Burden >30% 60 78.7 100 52.3 67.4 82 96.1 100 75 88.2 78.1
5. % Cost Burden >50% 50 78.7 100 52.3 65 64.6 96.1 100 75 81.8 73.6
6. Household Income >30% to <=50% MFI 52 129 24 123 328 160 292 36 55 543 871
7. % with any housing problems 34.6 81.4 100 96.7 81.1 66.9 87 72.2 92.7 80.7 80.8
8. % Cost Burden >30% 34.6 81.4 100 96.7 81.1 66.9 83.6 72.2 92.7 78.8 79.7
9. % Cost Burden >50% 26.9 44.2 16.7 72.4 50 33.8 73.3 44.4 85.5 61 56.8
10. Household Income >50 to <=80% MFI 44 181 36 148 409 225 559 196 38 1,018 1,427
11. % with any housing problems 100 64.1 88.9 93.2 80.7 36.4 86.6 59.7 78.9 70 73.1
12.% Cost Burden >30% 100 53 77.8 93.2 74.8 36.4 86.6 59.7 78.9 70 71.4
13. % Cost Burden >50% 22.7 13.3 11.1 19.6 16.4 12.9 44.2 15.3 57.9 32.2 27.7
14. Household Income >80% MFI 66 1,185 206 543 2,000 1,458 10,434 2,315 1,160 15,367 17,367
15. % with any housing problems 21.2 14.5 25.2 9.8 14.5 9.3 13.4 18.6 19.1 14.2 14.3
16.% Cost Burden >30% 21.2 7.3 6.8 9.8 8.4 9.3 11.4 12.4 19.1 11.9 11.5
17. % Cost Burden >50% 0 1.7 4.9 0 1.5 2.1 3.1 3.2 4.7 3.2 3
18. Total Households 262 1,645 298 946 3,151 2,004 11,488 2,561 1,309 17,362 20,513
19. % with any housing problems 51.9 31.3 47 40.1 37.1 22.8 20.3 23 26.4 21.4 23.8
20. % Cost Burden >30 51.9 24.7 32.9 40.1 32.3 22.8 18.4 17.3 26.4 19.3 21.3
21. % Cost Burden >50 28.2 13.3 16.8 19.8 16.8 10.8 8.6 5.2 12.6 8.6 9.9

City of Sugar Land, Texas
5 Year Strategic Plan 33 PY 2009-PY2013
Table 5b -- SOCDS CHAS Data: Housing Problems Output for White Non-Hispanic Households
Name of Jurisdiction: Source of Data: Data Current as of:
Sugar Land(CDBG), Texas CHAS Data Book 2000
Renters Owners
Household by Type, Income, & Housing Problem
Elderly Family All Total Elderly Family All Total Total
1 & 2 Households Other Renters 1 & 2 Households Other Owners Households
Member Households Member Households
Households Households
(A) (B) (C) (D) (E) (F) (G) (H) (I)
1. Household Income <=50% MFI 68 94 137 299 170 225 63 458 757
2. Household Income <=30% MFI 30 52 58 140 74 64 28 166 306
% with any housing problems 100 73.1 41.4 65.7 94.6 100 50 89.2 78.4
3. Household Income >30 to <=50% MFI 38 42 79 159 96 161 35 292 451
% with any housing problems 36.8 76.2 94.9 76.1 66.7 95 88.6 84.9 81.8
4. Household Income >50 to <=80% MFI 44 109 95 248 203 316 30 549 797
% with any housing problems 100 68.8 89.5 82.3 38.9 89.9 73.3 70.1 73.9
5. Household Income >80% MFI 58 913 442 1,413 1,383 8,195 928 10,506 11,919
% with any housing problems 24.1 11.3 10.9 11.7 8.2 9.8 17 10.2 10.4
6. Total Households 170 1,116 674 1,960 1,756 8,736 1,021 11,513 13,473
% with any housing problems 60 22.2 34.4 29.7 18.6 14.9 22 16.1 18.1

City of Sugar Land, Texas
5 Year Strategic Plan 34 PY 2009-PY2013
Table 5c -- SOCDS CHAS Data: Housing Problems Output for Black Non-Hispanic Households
Name of Jurisdiction: Source of Data: Data Current as of:
Sugar Land(CDBG), Texas CHAS Data Book 2000
Renters Owners
Household by Type, Income, & Housing Problem
Elderly Family All Total Elderly Family All Total Total
1 & 2 Households Other Renters 1 & 2 Households Other Owners Households
Member Households Member Households
Households Households
(A) (B) (C) (D) (E) (F) (G) (H) (I)
1. Household Income <=50% MFI 0 29 30 59 34 26 0 60 119
2. Household Income <=30% MFI 0 15 20 35 14 8 0 22 57
% with any housing problems N/A 100 100 100 71.4 50 N/A 63.6 86
3. Household Income >30 to <=50% MFI 0 14 10 24 20 18 0 38 62
% with any housing problems N/A 71.4 100 83.3 50 77.8 N/A 63.2 71
4. Household Income >50 to <=80% MFI 0 32 10 42 0 29 0 29 71
% with any housing problems N/A 25 100 42.9 N/A 100 N/A 100 66.2
5. Household Income >80% MFI 10 112 20 142 8 554 50 612 754
% with any housing problems 0 17.9 0 14.1 50 19.7 8 19.1 18.2
6. Total Households 10 173 60 243 42 609 50 701 944
% with any housing problems 0 30.6 66.7 38.3 57.1 25.6 8 26.2 29.3

City of Sugar Land, Texas
5 Year Strategic Plan 35 PY 2009-PY2013
Table 5d -- SOCDS CHAS Data: Housing Problems Output for Asian Non-Hispanic Households
Name of Jurisdiction: Source of Data: Data Current as of:
Sugar Land(CDBG), Texas CHAS Data Book 2000
Renters Owners
Household by Type, Income, & Housing Problem
Elderly Family All Total Elderly Family All Total Total
1 & 2 Households Other Renters 1 & 2 Households Other Owners Households
Member Households Member Households
Households Households
(A) (B) (C) (D) (E) (F) (G) (H) (I)
1. Household Income <=50% MFI N/A N/A N/A 229 N/A N/A N/A 306 535
2. Household Income <=30% MFI N/A N/A N/A 129 N/A N/A N/A 183 312
% with any housing problems N/A N/A N/A 65.9 N/A N/A N/A 94.5 82.7
3. Household Income >30 to <=50% MFI N/A N/A N/A 100 N/A N/A N/A 123 223
% with any housing problems N/A N/A N/A 90 N/A N/A N/A 79.7 84.3
4. Household Income >50 to <=80% MFI N/A N/A N/A 73 N/A N/A N/A 285 358
% with any housing problems N/A N/A N/A 94.5 N/A N/A N/A 73.7 77.9
5. Household Income >80% MFI N/A N/A N/A 234 N/A N/A N/A 2,940 3,174
% with any housing problems N/A N/A N/A 27.4 N/A N/A N/A 26.2 26.3
6. Total Households N/A N/A N/A 536 N/A N/A N/A 3,531 4,067
% with any housing problems N/A N/A N/A 57.5 N/A N/A N/A 35.4 38.3

City of Sugar Land, Texas
5 Year Strategic Plan 36 PY 2009-PY2013
Table 5e -- SOCDS CHAS Data: Housing Problems Output for Hispanic Households
Name of Jurisdiction: Source of Data: Data Current as of:
Sugar Land(CDBG), Texas CHAS Data Book 2000
Renters Owners
Household by Type, Income, & Housing Problem
Elderly Family All Total Elderly Family All Total Total
1 & 2 Households Other Renters 1 & 2 Households Other Owners Households
Member Households Member Households
Households Households
(A) (B) (C) (D) (E) (F) (G) (H) (I)
1. Household Income <=50% MFI 24 52 14 90 55 37 15 107 197
2. Household Income <=30% MFI 20 28 4 52 30 4 0 34 86
% with any housing problems 0 100 0 53.8 66.7 100 N/A 70.6 60.5
3. Household Income >30 to <=50% MFI 4 24 10 38 25 33 15 73 111
% with any housing problems 100 100 100 100 100 75.8 100 89 92.8
4. Household Income >50 to <=80% MFI 0 24 10 34 10 47 10 67 101
% with any housing problems N/A 83.3 100 88.2 0 61.7 100 58.2 68.3
5. Household Income >80% MFI 0 121 44 165 0 845 72 917 1,082
% with any housing problems N/A 32.2 0 23.6 N/A 15.4 11.1 15 16.4
6. Total Households 24 197 68 289 65 929 97 1,091 1,380
% with any housing problems 16.7 56.3 29.4 46.7 69.2 20.2 34 24.4 29.1

City of Sugar Land, Texas
5 Year Strategic Plan 37 PY 2009-PY2013
Table 5f -- SOCDS CHAS Data: Housing Problems Output for Mobility & Self Care Limitation
Name of Jurisdiction: Source of Data: Data Current as of:
Sugar Land(CDBG), Texas CHAS Data Book 2000
Renters Owners
Household by Type, Income, & Housing Problem
Elderly Family All Total Elderly Family All Total Total
1 & 2 Households Other Renters 1 & 2 Households Other Owners Households
Member Households Member Households
Households Households
(A) (B) (C) (D) (E) (F) (G) (H) (I)
1. Household Income <=50% MFI 20 10 100 130 32 49 61 142 272
2. Household Income <=30% MFI 20 10 50 80 8 4 14 26 106
% with any housing problems 50 100 100 87.5 50 100 100 84.6 86.8
3. Household Income >30 to <=50% MFI 0 0 50 50 24 45 47 116 166
% with any housing problems N/A N/A 80 80 58.3 77.8 61.7 67.2 71.1
4. Household Income >50 to <=80% MFI 0 0 18 18 14 24 52 90 108
% with any housing problems N/A N/A 22.2 22.2 100 41.7 92.3 80 70.4
5. Household Income >80% MFI 0 20 78 98 168 118 865 1,151 1,249
% with any housing problems N/A 0 35.9 28.6 0 24.6 19.9 17.5 18.3
6. Total Households 20 30 196 246 214 191 978 1,383 1,629
% with any housing problems 50 33.3 62.2 57.7 15 40.8 26.9 27 31.6
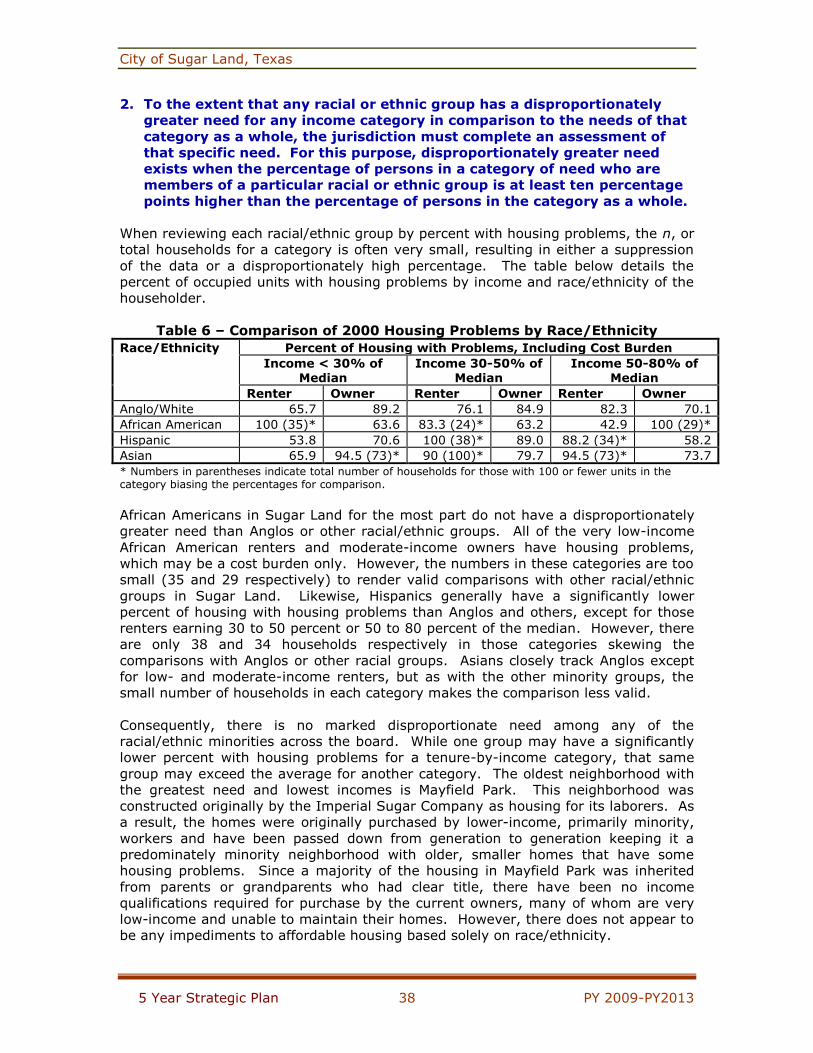
City of Sugar Land, Texas
5 Year Strategic Plan 38 PY 2009-PY2013
2. To the extent that any racial or ethnic group has a disproportionately
greater need for any income category in comparison to the needs of that
category as a whole, the jurisdiction must complete an assessment of
that specific need. For this purpose, disproportionately greater need
exists when the percentage of persons in a category of need who are
members of a particular racial or ethnic group is at least ten percentage
points higher than the percentage of persons in the category as a whole.
When reviewing each racial/ethnic group by percent with housing problems, the n, or
total households for a category is often very small, resulting in either a suppression
of the data or a disproportionately high percentage. The table below details the
percent of occupied units with housing problems by income and race/ethnicity of the
householder.
Table 6 – Comparison of 2000 Housing Problems by Race/Ethnicity
Race/Ethnicity Percent of Housing with Problems, Including Cost Burden
Income < 30% of Median
Income 30-50% of Median
Income 50-80% of Median
Renter Owner Renter Owner Renter Owner
Anglo/White 65.7 89.2 76.1 84.9 82.3 70.1
African American 100 (35)* 63.6 83.3 (24)* 63.2 42.9 100 (29)*
Hispanic 53.8 70.6 100 (38)* 89.0 88.2 (34)* 58.2
Asian 65.9 94.5 (73)* 90 (100)* 79.7 94.5 (73)* 73.7
* Numbers in parentheses indicate total number of households for those with 100 or fewer units in the category biasing the percentages for comparison.
African Americans in Sugar Land for the most part do not have a disproportionately
greater need than Anglos or other racial/ethnic groups. All of the very low-income
African American renters and moderate-income owners have housing problems,
which may be a cost burden only. However, the numbers in these categories are too
small (35 and 29 respectively) to render valid comparisons with other racial/ethnic
groups in Sugar Land. Likewise, Hispanics generally have a significantly lower
percent of housing with housing problems than Anglos and others, except for those
renters earning 30 to 50 percent or 50 to 80 percent of the median. However, there
are only 38 and 34 households respectively in those categories skewing the
comparisons with Anglos or other racial groups. Asians closely track Anglos except
for low- and moderate-income renters, but as with the other minority groups, the
small number of households in each category makes the comparison less valid.
Consequently, there is no marked disproportionate need among any of the
racial/ethnic minorities across the board. While one group may have a significantly
lower percent with housing problems for a tenure-by-income category, that same
group may exceed the average for another category. The oldest neighborhood with
the greatest need and lowest incomes is Mayfield Park. This neighborhood was
constructed originally by the Imperial Sugar Company as housing for its laborers. As
a result, the homes were originally purchased by lower-income, primarily minority,
workers and have been passed down from generation to generation keeping it a
predominately minority neighborhood with older, smaller homes that have some
housing problems. Since a majority of the housing in Mayfield Park was inherited
from parents or grandparents who had clear title, there have been no income
qualifications required for purchase by the current owners, many of whom are very
low-income and unable to maintain their homes. However, there does not appear to
be any impediments to affordable housing based solely on race/ethnicity.
City of Sugar Land, Texas
5 Year Strategic Plan 39 PY 2009-PY2013
Priority Housing Needs (91.215 (b))
1. Identify the priority housing needs and activities in accordance with the
categories specified in the Housing Needs Table (formerly Table 2A).
These categories correspond with special tabulations of U.S. census data
provided by HUD for the preparation of the Consolidated Plan.
The table below is extracted from the Housing Needs Table to show the priorities for
each of the special tabulation categories. As can be seen, the City of Sugar Land
does not plan to provide housing rehabilitation or other housing assistance to rental
units. The City will continue to provide minor and moderate rehabilitation to owner
occupied units with a high priority on the elderly and a medium priority on other
households.

City of Sugar Land, Texas
5 Year Strategic Plan 40 PY 2009-PY2013
Table 7—Priority Housing Needs by Category
Special Tabulation Category Priority
Plan to Fund
Funding Source
Ho
use
ho
ld I
nco
me <
=3
0%
MF
I
Rente
r
Eld
erly
NUMBER OF HOUSEHOLDS
Any housing problems L N N/A
Cost Burden > 30% L N N/A
Cost Burden >50% L N N/A
Sm
all R
ela
ted NUMBER OF HOUSEHOLDS
With Any Housing Problems L N N/A
Cost Burden > 30% L N N/A
Cost Burden >50% L N N/A
Larg
e R
ela
ted NUMBER OF HOUSEHOLDS
With Any Housing Problems L N N/A
Cost Burden > 30% L N N/A
Cost Burden >50% L N N/A
All o
ther
hshold
s
NUMBER OF HOUSEHOLDS
With Any Housing Problems L N N/A
Cost Burden > 30% L N N/A
Cost Burden >50% L N N/A
Ow
ner
Eld
erly
NUMBER OF HOUSEHOLDS
With Any Housing Problems H Y C
Cost Burden > 30% H Y C
Cost Burden >50% H Y C
Sm
all R
ela
ted NUMBER OF HOUSEHOLDS
With Any Housing Problems M Y C
Cost Burden > 30% M Y C
Cost Burden >50% M Y C
Larg
e R
ela
ted NUMBER OF HOUSEHOLDS
With Any Housing Problems M Y C
Cost Burden > 30% M Y C
Cost Burden >50% M Y C
All o
ther
hshold
s
NUMBER OF HOUSEHOLDS
With Any Housing Problems M Y C
Cost Burden > 30% M Y C
Cost Burden >50% M Y C

City of Sugar Land, Texas
5 Year Strategic Plan 41 PY 2009-PY2013
2. Provide an analysis of how the characteristics of the housing market and
the severity of housing problems and needs of each category of residents
provided the basis for determining the relative priority of each priority
housing need category. Note: Family and income types may be grouped in the case of closely related categories of residents where the analysis would apply to more than one family or income type.
Due to the relatively small CDBG grant award, the City of Sugar Land has
determined that it will give a high priority to owner-occupied housing in need of
repair but will give low priorities to repairs/rehabilitation of renter-occupied housing
and homebuyer assistance. The table below summarizes the CHAS table for owner
occupied housing in Sugar Land.
Table 8 – CHAS Data for Owner Occupied Units Only
Name of Jurisdiction: Data Current as of:
Sugar Land(CDBG), Texas 2000
Owners
Household by Type, Income, & Housing Problem
Elderly Small
Related Large
Related All Total
1 & 2 (2 to 4) (5 or more) Other Owners
member Households
households
(F) (G) (H) (I) (J)
2. Household Income <=30% MFI 161 203 14 56 434
3. % with any housing problems 82 96.1 100 75 88.2
4. % Cost Burden >30% 82 96.1 100 75 88.2
5. % Cost Burden >50% 64.6 96.1 100 75 81.8
6. Household Income >30% to <=50% MFI 160 292 36 55 543
7. % with any housing problems 66.9 87 72.2 92.7 80.7
8. % Cost Burden >30% 66.9 83.6 72.2 92.7 78.8
9. % Cost Burden >50% 33.8 73.3 44.4 85.5 61
10. Household Income >50 to <=80% MFI 225 559 196 38 1,018
11. % with any housing problems 36.4 86.6 59.7 78.9 70
12.% Cost Burden >30% 36.4 86.6 59.7 78.9 70
13. % Cost Burden >50% 12.9 44.2 15.3 57.9 32.2
The primary basis for determining relative priority is a function of not being a HOME
Participating Jurisdiction and having a relatively small allocation available for housing
programs rather than a function of numbers in need for each category of residents.
While all low-moderate income homeowners are eligible for minor housing
rehabilitation, it has been determined that the elderly and the disabled are the least
able to conduct general maintenance and repairs on their homes themselves and
need to contract the work to professionals. Therefore, though the percent of elderly-
owned homes with housing problems is lower than for other owner-occupied low-
moderate income houses, higher priority is given to elderly and disabled home
owners with a medium priority for all other low- to moderate-income households in
owner-occupied housing. However, when applicants apply for minor rehabilitation,
there is no distinction between the categories of residents as long as they own the

City of Sugar Land, Texas
5 Year Strategic Plan 42 PY 2009-PY2013
homes they are occupying and are low- to moderate-income. All categories of
residents are treated equally and are placed on the waiting list for rehabilitation
based on the date of application, not on their age or household size.
3. Describe the basis for assigning the priority given to each category of
priority needs.
With the limited amount of CDBG funds awarded to the City of Sugar Land and the
City not being a HOME Participating Jurisdiction, it was determined that CDBG funds
should be used only for owner-occupied rehabilitation. Due to the need in Sugar
Land, as demonstrated by the demographics outlined in the Census data and by the
applications to the Fort Bend CORPS for minor and moderate housing rehabilitation,
the elderly have the greatest need of assistance. Due to their income and age,
maintenance on their homes has been deferred over time and a greater number of
houses occupied by elderly owners have rehabilitation and repair needs. Disabled
home owners also have a high priority for minor housing rehabilitation, though that
is not a category in HUD’s Consolidated Plan Management Process (CPMP) Needs
table. Small, large and other owner-occupied housing have no less of a need on an
individual per-household basis; however there are fewer households applying for
CDBG assistance and a greater ability for the homeowner to make the repairs.
Therefore, a medium priority is assigned to these categories, while the overall
priority for housing rehabilitation has been given a high ranking.
4. Identify any obstacles to meeting underserved needs.
As with most of the underserved needs, the major obstacle is money. Approximately
one-fourth of the City’s CDBG allocation each year is set aside for repairs and
minor/moderate rehabilitation of low-mod income owner-occupied housing. With
these funds, less than 20 homes per year can be assisted.
A second obstacle is the level of need per house. As more and more houses needing
minor repair or rehabilitation are assisted, the remaining units are in greater need of
rehabilitation. With the limited funds and the structure of the CDBG program in
Sugar Land as it is proposed, it is not feasible to embark on major rehabilitation or
demolition/reconstruction. Only one house could receive major rehabilitation per
year, or one house could receive approximately 50 percent of the cost to be
demolished and reconstructed through CDBG funding. Therefore, it is not prudent or
feasible for the City to provide major rehabilitation of demolition/reconstruction of
housing.
A third obstacle is the number of houses that would be otherwise eligible for
rehabilitation but don’t have a clear title. A very large percentage of the low-
moderate income owner-occupied houses in Mayfield Park and a small percentage in
the rest of the City are occupied by heirs who never probated the wills or where
there were no wills drawn up by the deceased. Fort Bend CORPS, with the
assistance of Fort Bend Lawyers CARE, is attempting to assist the applicants for
rehabilitation that fall into this category. Once titles can be cleared and the
ownership confirmed, then the rehabilitation assistance can be provided. However, it
slows the rehabilitation process considerably, and some titles cannot be cleared with
the level of pro bono legal assistance that Fort Bend Lawyers CARE can provide.
A fourth obstacle that has been encountered in Sugar Land involves the complexity
of the guidelines and regulations dealing with code enforcement versus housing

City of Sugar Land, Texas
5 Year Strategic Plan 43 PY 2009-PY2013
rehabilitation. Some eligible houses can be rehabilitated for less than $10,000;
however, the contractors cannot get to the dwelling because of debris in the yard.
The City has in the past funded Fort Bend CORPS to do residential code enforcement
– notification to the City of a problem with the correction of the problem after City
officials serve the owner with a citation. However, while housing rehabilitation is
based on owner’s income, not location, code enforcement is an eligible activity only
in CDBG Target Areas, and most of the homes needing such assistance are outside
the Target Areas. Therefore, the houses in greatest need fall through the cracks as
they are eligible for rehabilitation but not for code enforcement, and without financial
assistance, the owners cannot clear the property for the Fort Bend CORPS to get to
the house to provide the rehabilitation.
Housing Market Analysis (91.210) *Please also refer to the Housing Market Analysis Table in the Needs.xls workbook
1. Based on information available to the jurisdiction, describe the
significant characteristics of the housing market in terms of supply,
demand, condition, and the cost of housing; the housing stock available
to serve persons with disabilities; and to serve persons with HIV/AIDS
and their families. Data on the housing market should include, to the
extent information is available, an estimate of the number of vacant or
abandoned buildings and whether units in these buildings are suitable
for rehabilitation.
Information on the housing market in Sugar Land comes from a number of sources,
including HUD’s Housing Affordability Mismatch from 2000, the U.S. Census Bureau’s
2005-2007 American Community Survey 3-Year Estimates, the Houston Area Board
of Realtors, For Rent.com, Apartment Ratings.com, the Fort Bend Star newspaper,
Texas A&M Real Estate Center, O’Connor and Associates and Realty Trac.com.
According to the 2005-2007 American Community Survey 3-Year Estimates, there
was a 1.1 percent homeowner vacancy rate and a 4.0 percent rental vacancy rate
during 2005-2007. Information is not available for the type of vacancy; however,
looking at the 2000 Census data, 25.6 percent were vacant for rent, 41.5 percent
were vacant for sale, 20.3 percent were vacant for seasonal, recreational or
occasional use and 12.6 percent were sold or rented but not occupied or were vacant
for other reasons. The figure below shows the distribution of owner-occupied and for
sale units, including foreclosures by value/price range, from the 2005-2007 American
Community Survey 3-Year Estimates, the Houston Area Board of Realtors and Realty
Trac.com.

City of Sugar Land, Texas
5 Year Strategic Plan 44 PY 2009-PY2013
Figure 6 – Owner-Occupied and For Sale Housing Values
While 27 percent of the owner-occupied housing in 2005-2007 was valued at less
than $150,000, only 9.6 percent of those non-foreclosed houses were for sale for
less than $150,000 in April 2009. Half of the MLS-listed homes for sale in April 2009
were listed at $300,000 or more. The foreclosures were marketed for a much lower
price, but most will go to auction with the price driven up by bidders. The median
value of owner-occupied homes in Sugar Land was $208,000 during the three years
the Census Bureau averaged the American Community Surveys.
The Texas A&M University’s Real Estate Center tracks housing sales by county. The
figure below shows the median sales price for Fort Bend County houses from 2005
through March 2009.
0.00%
5.00%
10.00%
15.00%
20.00%
25.00%
30.00%
< $50K $50-
99.9K
$100-
149.9K
$150-
199.9K
$200-
299.9K
$300-
499.9K
$500-
999.9K
>=$1
Million
Occupied 2005-2007 For Sale 4/2009 Foreclosures 4/2009

City of Sugar Land, Texas
5 Year Strategic Plan 45 PY 2009-PY2013
Figure 7 – Sales Prices for Fort Bend County Homes
During 2006 through 2008, the City permitted 1,480 new single family homes, no
duplexes, 31 units in three- or four-plexes and 5 units in a single structure. The
average value was $274,000 for the single family homes and $342,000 for the multi-
family units.
The median gross rent from the 2005-2007 American Community Survey 3-Year
Estimates was $1,179 in Sugar Land. In April 2009, rents range from a low of $685
to $1,485 per month for apartments and from $800 to over $5,000 per month for
single-family houses and condominiums. The figure below shows the housing costs
as a percent of income for owners and renters. These data are from the 2005-2007
American Community Survey 3-Year Estimates.
Figure 8 – 2005-2007 Average Housing Costs as Percent of Income
The percent of renters and owners paying more than 30 percent of their income on
housing is discussed in the section above.
$150,000
$155,000
$160,000
$165,000
$170,000
$175,000
$180,000
$185,000
$190,000
$195,000
$200,000
Jun-0
5
Sep-0
5
Dec-0
5
Mar-
06
Jun-0
6
Sep-0
6
Dec-0
6
Mar-
07
Jun-0
7
Sep-0
7
Dec-0
7
Mar-
08
Jun-0
8
Sep-0
8
Dec-0
8
Mar-
09
0.00%
20.00%
40.00%
60.00%
80.00%
100.00%
< 20% 20-24.9% 25-29.9% 30-34.9% =>35%
Own with Mortgage Own without Mortgage Rent

City of Sugar Land, Texas
5 Year Strategic Plan 46 PY 2009-PY2013
There is a disparity among the racial/ethnic groups when it comes to the ability to
purchase a home. The Home Mortgage Disclosure Act data for 2007 details by
Census Tract the number and percent of home mortgages denied by a variety of
characteristics, including race/ethnicity.
Figure 9 – Percent of Mortgage Applications for Home Purchase
Denied by Race/Ethnicity
(each percent is percent of total applications for that race/ethnicity)
Source: HMDA Loan Application Data, 2007
As can be seen, Asians have a lower percentage of loan denials than any other
racial/ethnic group, while African Americans have a disproportionately higher rate of
loan denials in many of the Census Tracts in Sugar Land. The figure below shows
the rates for primary reasons for denial by race/ethnicity.
Percent Loans DeniedAsianAfrican American
HispanicNon-Hispanic White

City of Sugar Land, Texas
5 Year Strategic Plan 47 PY 2009-PY2013
Figure 10 – Reason for Mortgage Denials by Race/Ethnicity
Source: HMDA Loan Application Data, 2007
Discounting incomplete applications, credit history is the most common reason for a
mortgage to be denied, followed by debt-to-income ratio and insufficient collateral.
Prior to 2005 and the surge in sub-prime mortgages, insufficient cash was a major
reason for the denial.
Though there is an adequate number of housing units available in Sugar Land and
despite the fact that 86 percent of those applying for a mortgage are accepted, not
all housing is affordable to all of the population. There is not a local Public Housing
Authority for Sugar Land or Fort Bend County, and there are no HUD-subsidized
properties in Sugar Land.
When reviewing the 2007 HMDA Loan Application Data, it is apparent that the higher
the income, the lower the mortgage-to-income ratio. Additionally, except for the
applicants with the lowest incomes, the higher the income the lower the percent of
applications denied. It can be surmised that a large number of those earning less
than 50 percent of the Metropolitan Statistical Area’s (MSA) median income did not
apply for mortgages unless they had received some form of subsidy and had been
through credit counseling to ensure that all documents were in good order. The
table below shows the number of applications with valid reported incomes, the
percent of those denied and the mortgage-to-income ratio for various key income
ranges.
0.00%
5.00%
10.00%
15.00%
20.00%
25.00%
30.00%
35.00%
Debt-to-
Income Ratio
Employment
History
Credit History Collateral Insuff icient
Cash
Unverif iable
Information
Incomplete
Application
Other
Asian African American Hispanic Non-Hispanic White Total

City of Sugar Land, Texas
5 Year Strategic Plan 48 PY 2009-PY2013
Table 9 – 2007 Mortgage Data by Income Range
< 50% MSA Median (< $30,550)
50-80% MSA Median ($30,550-$48,879)
80-100% MSA Median ($48,880-$61,100)
100% MSA Median - 80% SL Median ($61,100-$75,915)
80-100% SL Median ($75,915-$94,895)
100-150% SL Median ($94,895-$142,342)
> 150% SL Median (>$142,342)
Apps With Valid
Incomes 135 403 629 783 1,289 1,757 2,041
% Denied 13.3 26.6 23.5 23.6 17.5 14.8 16.3
% Loans
< Income 9.6 15.6 19.1 19.7 24.5 31.3 46.8
%Loans 1 - 1.49 Times Income 6.7 5.0 7.8 9.5 15.3 16.6 22.5
% Loans
1.5-1.99 Times Income 3.0 7.6 14.9 19.2 17.5 21.7 17.8
% Loans 2-2.49 Times Income 4.4 13.9 26.2 22.0 15.5 16.2 8.0
% Loans
2.5-2.99 Times Income 6.7 21.8 17.9 12.4 14.9 9.7 2.9
% Loans >= 3
Times Income 69.6 36.1 14.1 17.2 12.3 4.5 2.0
Source: HMDA Loan Data, 2007
In order for the majority of the lower income households to purchase a home, they
are forced to enter into a mortgage that is more than twice their annual income.
Based on average interest rates and property taxes, this loan level will cause a cost
burden for the owner. Not only are there not enough units for sale available for low-
mod income households, but many of the total units – owner and renter occupied –
that are available are occupied by households with higher incomes. The table below
and the Housing Market Analysis table in the “CPMP Needs” Excel file show the
number of housing units affordable for low-mod income along with the number
actually occupied by or available to low-mod income. While there are 9,088 units
available to those earning 80 percent or less of the median household income, more
than three-fourths of the affordable units are occupied by households with incomes
above the low-mod limit, leaving 1,717 to be in housing that are not affordable. Of
those households who are in housing affordable for those making 80 percent of the
median income, only 9 percent of the households earning less than or equal to 30

City of Sugar Land, Texas
5 Year Strategic Plan 49 PY 2009-PY2013
percent median household income (MHI) are in housing that is affordable, while 18.4
percent of those households earning between 30 and 50 percent of MHI are in
affordable housing. There is no public housing or Section 8 Housing Choice Vouchers
in Sugar Land or in the surrounding unincorporated areas of Fort Bend County.
Residents who are eligible for Section 8 must apply to the State of Texas Housing
and Community Affairs Department for the state program.
Table 10 – Housing by Affordability*
Housing Units by Affordability
Rental Owner Total
Units Units Units
1.Units Affordable for <= 30% MHI
Number of units 246 N/A 246
# occupants earning <=30% MHI 78 N/A 78
Total HH earning <= 30% MHI 414 434 848
HH not in affordable housing 336 434 770
2.Units Affordable for >30 to <=50% MHI
Number of units 133 1,444 1,577
# occupants <=50% MHI 65 251 316
Total HH earning <=50% MHI 742 977 1,719
HH <= 50% MHI not in affordable housing 677 726 1,403
3. Units Affordable for >50 to <=80% MHI
Number of units 1,369 5,896 7,265
# occupants <=80% 586 843 1,429
Total HH earning <=80% MHI 1,151 1,995 3,146
HH <= 80% not in affordable housing 565 1,152 1,717
4. Units Affordable for >80% MHI
Number of units 1,544 10,234 11,778 * From Census 2000, Housing Affordability Mismatch Table and CHAS
Using “housing problems” as a determination of “substandard units,” it is estimated
that in 2000 when the CHAS and Housing Affordability Mismatch data were provided,
773 of the affordable units were “substandard,” though most require only minor or
moderate repairs/rehabilitation. Assuming an average cost of $2,500 per unit for
rehabilitation of a 0-1 bedroom, $5,000 per unit for a 2 bedroom and $12,500 per
unit for a unit with 3 or more bedrooms, there is a need of $5,037,500 to repair all
affordable units.
There are no low-income housing tax credit properties in Sugar Land, nor are there
any properties specifically for People Living with HIV/AIDS. According to HUD’s Real
Estate Management Systems (REMS) “Multi-family Housing Inventory of 2007,” there
are two multi-family complexes in Sugar Land that serve the elderly and disabled
specifically. Neither complex has any federal or state assistance. One complex has
76 units and all are accessible to the disabled. The units range from efficiency (0-
bedroom) to 1-bedroom. The other complex has 348 units with 12 accessible to the
disabled and they include 1-, 2- and 3-bedroom units. There are no data regarding
the number of single-family units that are accessible to the disabled.

City of Sugar Land, Texas
5 Year Strategic Plan 50 PY 2009-PY2013
In summary, based on the 2000 Census as reported in the Housing Affordability
Mismatch and CHAS tables provided by HUD, 1,717 of those low-mod income
households were in housing that was not affordable. Based on the April 2009
information about housing for sale – general market and foreclosures – only 195 are
currently available to low-mod income households. Though more definitive data are
not available regarding the number of rental units that are available for low-mod
income, it can be assumed, using vacancy data and average rent that only about 145
are available for rent to low-mod income households. This circumstance leaves a
gap of 1,377 affordable housing units. Within the affordable units, there is an
estimated $5,037,500 needed in repairs or rehabilitation to bring the condition equal
to the remainder of Sugar Land’s housing.
2. Describe the number and targeting (income level and type of household
served) of units currently assisted by local, state, or federally funded
programs, and an assessment of whether any such units are expected to
be lost from the assisted housing inventory for any reason, (i.e.
expiration of Section 8 contracts).
According to the HUD Users report “Picture of Subsidized Households,” there are no
subsidized units in Sugar Land, including public housing, Section 8 Housing Choice
Vouchers, Low Income Housing Tax Credit properties, Section 202 properties for the
elderly or Section 811 properties for the disabled. Neither Sugar Land nor Fort Bend
County is a Public Housing Authority with properties or Section 8 vouchers. Any
eligible household would have to apply to the State of Texas for Section 8 housing
vouchers and then select a unit in Sugar Land that accepts Section 8 vouchers.
3. Indicate how the characteristics of the housing market will influence the
use of funds made available for rental assistance, production of new
units, rehabilitation of old units, or acquisition of existing units. Please
note, the goal of affordable housing is not met by beds in nursing homes.
Due to the limited size of the annual CDBG allocation and the fact that Sugar Land is
not a HOME Participating Jurisdiction, no funds will be available for the production of
new rental or owner units, rehabilitation of rental units or the acquisition of existing
units. It is possible that a non-profit public service agency would secure CDBG funds
for emergency rental assistance, and the City has been seeking such an entity. The
City of Sugar Land has devoted nearly one-fourth of its CDBG funding for the
rehabilitation of units owned and occupied by low-moderate income households.
Assisting existing homeowners in repairing and maintaining their homes is a high
priority for the City of Sugar Land to help ensure that the owners, particularly elderly
and disabled owners, can remain in their homes and that the homes are in standard
to good condition.
Specific Housing Objectives (91.215 (b))
1. Describe the priorities and specific objectives the jurisdiction hopes to
achieve over a specified time period.
During the next five years, the City of Sugar Land anticipates continuing its minor
rehabilitation of owner-occupied homes by allocating between 20 and 30 percent of

City of Sugar Land, Texas
5 Year Strategic Plan 51 PY 2009-PY2013
its annual CDBG award to the project. This will translate into the rehabilitation of
approximately 40 to 120 homes over the next five years.
2. Describe how Federal, State, and local public and private sector
resources that are reasonably expected to be available will be used to
address identified needs for the period covered by the strategic plan.
In addition to the CDBG funds expended on housing rehabilitation, the City of Sugar
Land anticipates that Fort Bend CORPS will continue to receive private funding for
energy efficiency retrofits for low-moderate income homeowners. With these funds
and the volunteer Hearts and Hammers program of Fort Bend CORPS, it is expected
that they will contribute at least three dollars ($3.00) for every CDBG dollar allocated
for housing rehabilitation.
Needs of Public Housing (91.210 (b))
In cooperation with the public housing agency or agencies located within its
boundaries, describe the needs of public housing, including the number of
public housing units in the jurisdiction, the physical condition of such units,
the restoration and revitalization needs of public housing projects within
the jurisdiction, and other factors, including the number of families on
public housing and tenant-based waiting lists and results from the Section
504 needs assessment of public housing projects located within its
boundaries (i.e. assessment of needs of tenants and applicants on waiting
list for accessible units as required by 24 CFR 8.25). The public housing
agency and jurisdiction can use the optional Priority Public Housing Needs
Table (formerly Table 4) of the Consolidated Plan to identify priority public
housing needs to assist in this process.
Not Applicable. There is no Public Housing Authority, public housing or local Section
8 Housing Choice Voucher program in Sugar Land or the areas of Fort Bend County
that include Sugar Land.
Public Housing Strategy (91.210)
1. Describe the public housing agency's strategy to serve the needs of
extremely low-income, low-income, and moderate-income families
residing in the jurisdiction served by the public housing agency
(including families on the public housing and section 8 tenant-based
waiting list), the public housing agency’s strategy for addressing the
revitalization and restoration needs of public housing projects within the
jurisdiction and improving the management and operation of such public
housing, and the public housing agency’s strategy for improving the
living environment of extremely low-income, low-income, and moderate
families residing in public housing.
City of Sugar Land, Texas
5 Year Strategic Plan 52 PY 2009-PY2013
2. Describe the manner in which the plan of the jurisdiction will help
address the needs of public housing and activities it will undertake to
encourage public housing residents to become more involved in
management and participate in homeownership. (NAHA Sec. 105 (b)(11)
and (91.215 (k))
3. If the public housing agency is designated as "troubled" by HUD or
otherwise is performing poorly, the jurisdiction shall describe the
manner in which it will provide financial or other assistance in improving
its operations to remove such designation. (NAHA Sec. 105 (g))
Not Applicable. There is no Public Housing Authority, public housing or local Section
8 Housing Choice Voucher program in Sugar Land or the areas of Fort Bend County
that include Sugar Land. Residents seeking Section 8 Housing Choice Vouchers
must either apply to the State of Texas or relocate to surrounding areas.
Barriers to Affordable Housing (91.210 (e) and 91.215 (f))
1. Explain whether the cost of housing or the incentives to develop,
maintain, or improve affordable housing are affected by public policies,
particularly those of the local jurisdiction. Such policies include tax
policy affecting land and other property, land use controls, zoning
ordinances, building codes, fees and charges, growth limits, and policies
that affect the return on residential investment.
The City of Sugar Land has reviewed its public policies to determine their impact on
affordable housing. The City found that there were no policies that contributed to
the concentration or prohibition of racial/ethnic minorities and no city building codes
or ordinances that would limit the development or improvement of affordable
housing in Sugar Land. The City’s policy is to review any complaints regarding
barriers to affordable or fair housing to determine the cause of the complaint and to
assure that no city policies or procedures are inadvertently causing any fair housing
problems. In addition, the City appointed the Community & Environmental Manager
as the Fair Housing Officer who will be responsible for receiving complaints from the
public and developing appropriate remedies to address unfair housing issues.
Zoning: The City of Sugar Land’s Zoning Regulations and other land use policies do
not appear to be a barrier to affordable housing. Requirements for minimum street
frontage, setbacks, density requirements, or off-site improvements do not impose
impediments to new housing development.
Building Codes: The City of Sugar Land has adopted the 2003 International Codes,
including building, fire, residential, property maintenance, energy, mechanical,
plumbing and fuel cost codes, as well as the 2005 National Electrical Code. These
codes set minimum standards for construction in the City. It is felt that these codes
do not hinder the development of affordable housing but rather enforce acceptable
building standards of affordable housing units. All housing and building codes are
consistent with the Department of Housing and Urban Development Fair Housing
regulations.
City of Sugar Land, Texas
5 Year Strategic Plan 53 PY 2009-PY2013
Tax Issues: At this time, the City does not offer tax incentives to encourage the
development of affordable housing. However, the City’s tax rate is considerably
lower than other municipalities in the Metropolitan Area. Additionally, the City does
provide for elderly and disabled to defer their property taxes until they sell or until
their estate inherits the property.
Code Enforcement: The City recognizes that the enforcement of property codes is
essential to the maintenance of quality housing stock. In response to the identified
rehabilitation needs in the community, the City has dedicated a portion of its CDBG
grant for housing rehabilitation activities to help maintain housing stock that meets
city codes.
City Boards: The City of Sugar Land ranks #1 in growth in the Houston metro area.
In the past decade, the City’s population increased 158 percent from 24,529 in 1990
to 63,328 in 2000 and now has a population of 72,089 according to the Census
Bureau’s American Community Survey. In order to manage a rapidly growing city,
the City of Sugar Land has established a number of boards involved in development
issues:
Building Standards Commission: This quasi-judicial board consists of
seven members and three alternate members who have knowledge of the
property maintenance codes and are qualified by experience and training to
decide matters related to building construction and property maintenance.
Planning and Zoning Commission: Established by City Charter and
approved by City Council on January 17, 1981, the nine-member Commission
makes recommendations to the City Council concerning the use of land and
other planning functions pursuant to State law and to promote orderly
development; to serve as advisory concerning master plans and changes to
the zoning plan; and to protect the general welfare and interest of the people
concerning physical changes in the city and in the extraterritorial jurisdiction.
Zoning Board of Adjustment: The Zoning Board of Adjustment was
established by ordinance and approved by City Council on November 1991.
The purpose of the Board is to hear appeals from administrative decisions;
hear and decide special exceptions and variances; and interpret the intent of
the Zoning Ordinance.
Sugar Land Development Corporation: The Sugar Land Development
Corporation was established as a non-profit corporation and approved by the
City Council in April 1993. The Corporation is managed by a Board of
Directors responsible for reviewing and making recommendations on the
economic development needs of Sugar Land and the guidelines governing
reinvestment zones and tax abatement agreements. The Corporation is also
responsible for developing, preparing and submitting an Economic
Development Plan for approval by the City Council. This Plan includes the
short and long term objectives of the Corporation, guidelines on the use of
tax funds received, and procedures on how the use of funds will be
determined.
Sugar Land 4B Corporation: Established in February 1995, the Sugar Land
4B Corporation is also responsible for preparing and developing an Economic
Development Plan in accordance with policies or directives established by the
City Council. The Plan includes guidelines on the use of sales tax funds
received, which may include municipal facilities, parks, museums, stadiums,
parking facilities and other facilities both private and public.

City of Sugar Land, Texas
5 Year Strategic Plan 54 PY 2009-PY2013
Parks and Recreation Policy Advisory Board: The Parks and Recreation
Policy Advisory Board was established in June 2000 and is charged with
making recommendations on the city’s master park plans and the long term
goals and objectives for parks and recreation activities.
Animal Advisory Board: The Animal Advisory Board makes
recommendations relative to the planning and implementation of procedures,
rules, regulations and/or other legally mandated requirement.
Land and Environmental Issues: The City of Sugar Land is approximately 20
miles southwest of downtown Houston and encompasses approximately 33 square
miles. During the past twenty years, the City has had an aggressive annexation
policy that has contributed to the growth of the population and the increase in
housing development. No land or environmental issues pose impediments to the
development of affordable housing, with the exception of flood plains meandering
throughout the City. Additionally, the City annexes property that has been
developed and has an affordable bonded indebtedness. As a result, there is limited
vacant land for the development of affordable housing within the City Limits. Due to
the nature of Sugar Land – a relatively young “bedroom community” of the City of
Houston – the land values are high compared to unincorporated areas and inner-city
areas of Houston; and the development is relatively new, valuing homes out of the
price range of many.
Ethnicity/Disability Barriers: The City of Sugar Land has no overt barriers to
affordable housing based on ethnicity or disability. The impediments within the
private sector revolve around income more than race, color, religion, national origin,
familial status or disability. A lack of affordable housing for the low-income impedes
low- and moderate-income residents from finding quality housing. Additionally,
there is a perception among the low-income that financial institutions will not
approve their mortgage loans. Therefore, many individuals do not apply for
mortgages. In the past, there was a misconception by lending institutions that there
are higher delinquencies in the loan portfolios of the lower income. Recently, with
the sub-prime mortgages, this misconception has become moot. However, with the
current recession and the new federal regulations, sub-prime mortgages are
disappearing and the preconceptions may be returning to the lending institutions.
Controlling for income, the minority population and the disabled do not have any
greater needs for or barriers to affordable housing than non-disabled Anglos. Rental
prices and the relatively young age of the housing stock pose the biggest barrier to
minorities and disabled renters and owners. The disadvantage that the disabled
have over non-disabled is that the limited stock of housing within a price range
affordable to the low- to moderate-income is older housing that has not been
retrofitted for ADA compliance and accessibility to the physically disabled.
2. Describe the strategy to remove or ameliorate negative effects of public
policies that serve as barriers to affordable housing, except that, if a
State requires a unit of general local government to submit a regulatory
barrier assessment that is substantially equivalent to the information
required under this part, as determined by HUD, the unit of general local
government may submit that assessment to HUD and it shall be
considered to have complied with this requirement.
No negative effects of public policies were determined; however, the City reviews its
policies as part of the Annual Action Planning process to ensure that no new policies

City of Sugar Land, Texas
5 Year Strategic Plan 55 PY 2009-PY2013
have been developed that may have a negative effect on affordable and fair housing.
In addition, with each Consolidated Plan, the City conducts an Analysis of
Impediments to Fair Housing Choice and its complementary Fair Housing Plan. The
Analysis of Impediments and Fair Housing Plan are reviewed annually and updated
between Consolidated Planning years as needed.

City of Sugar Land, Texas
5 Year Strategic Plan 56 PY 2009-PY2013
HOMELESS
Homeless Needs (91.205 (b) and 91.215 (c)) *Please also refer to the Homeless Needs Table in the Needs.xls workbook
Homeless Needs— The jurisdiction must provide a concise summary of the
nature and extent of homelessness in the jurisdiction, (including rural
homelessness and chronic homelessness where applicable), addressing
separately the need for facilities and services for homeless persons and
homeless families with children, both sheltered and unsheltered, and
homeless subpopulations, in accordance with Table 1A. The summary must
include the characteristics and needs of low-income individuals and
children, (especially extremely low-income) who are currently housed but
are at imminent risk of either residing in shelters or becoming unsheltered.
In addition, to the extent information is available, the plan must include a
description of the nature and extent of homelessness by racial and ethnic
group. A quantitative analysis is not required. If a jurisdiction provides
estimates of the at-risk population(s), it should also include a description of
the operational definition of the at-risk group and the methodology used to
generate the estimates.
The City of Sugar Land falls under the umbrella of the Coalition for the Homeless of
Houston/Harris County, including Fort Bend County. Currently, Fort Bend County
Women’s Center and Fort Bend Family Promise are the only agencies serving Sugar
Land’s homeless population. Fort Bend Women’s Center is the only full-service
shelter in Fort Bend County and is the only organization eligible for transitional and
permanent housing through Continuum of Care funding. The Coalition for the
Homeless’ Continuum of Care planning process and the annual homeless
enumeration focus on Harris County and do not delineate information for Sugar Land
or Fort Bend County.
Based on information provided by the Fort Bend County Women’s Center, there are
approximately 110 Sugar Land women each year that require the services of the
Center, including emergency shelter. Fort Bend Family Promise serves 14 people in
three to four families at a time, and they provide shelter for three to six months.
During the five years they have been in operation, they have averaged one or two
families from Sugar Land. According to the Census Bureau’s American Community
Survey Demographic and Housing Estimates: 2005-2007, there are, on average,
271 households in Sugar Land that are over-crowded (more than 1.0 persons per
room) and 139 households living in units lacking complete plumbing or kitchen
facilities. Note that there is likely to be a double counting as many of the
overcrowded units may also be lacking complete facilities. The American Community
Survey indicates that 6.7 percent of the Sugar Land population (4,830 people) are
living below the poverty level. Comparing these statistics with suburban counties
that do enumerate their homeless populations, it can be estimated that at any given
point in time approximately 48 individuals and families from Sugar Land are
homeless and in need of shelter, housing and supportive services. The table below is
the estimate based on the Coalition for the Homeless of Houston/Harris County
(including Fort Bend County). The numbers in the table and in the corresponding
Homeless worksheet in the CPMP “Needs” Excel file are point in time numbers.

City of Sugar Land, Texas
5 Year Strategic Plan 57 PY 2009-PY2013
Over the course of the next five years, the City intends to provide funding for shelter
to at least 50 individual women and 100 families who are victims of domestic
violence. However, the shelter is located outside of the City of Sugar Land;
therefore, the inventory of its beds is not counted in the table below.
Table 11 – Continuum of Care Gaps Analysis (HUD Table 1A)
Estimated Need
Current Inventory*
Net Need/Gap
Relative Priority
Individuals
Beds/Units
Emergency Shelter 50 0 50 Medium
Transitional Housing 10 0 10 Low
Permanent Housing 5 0 5 Low
Total 65 0 65
Estimated Supportive Services Slots
Job Training 14 0 14 Low
Case Management 14 0 14 Low
Substance Abuse Treatment 2 0 2 Low
Mental Health Treatment 2 0 2 Low
Housing Placement 14 0 14 Low
Life Skills Training 14 0 14 Low
Other: Transportation 14 4 10 Low
Estimated Sub-Populations
Chronic Substance Abusers 2 0 2 Low
Seriously Mentally Ill 0 0 0 Low
Dually-Diagnosed 0 0 0 Low
Veterans 3 0 3 Low
Persons With HIV/AIDS 0 0 0 Low
Victims of Domestic Violence 10 0 10 High
Youth 5 0 5 Low
Families with Children
Beds/Units
Emergency Shelter 20 0 20 High
Transitional Housing 6 0 6 Low
Permanent Housing 8 0 8 Low
Total 34 0 34
Estimated Supportive Services Slots
Job Training 24 0 24 Low
Case Management 24 0 24 Low
Child Care 50 15 35 Low
Substance Abuse Treatment 3 0 3 Low
Mental Health Treatment 2 0 2 Low
Housing Placement 24 0 24 Low
Life Skills Training 15 0 15 Low
Estimated Sub-Populations
Chronic Substance Abusers 2 0 2 Low
Seriously Mentally Ill 0 0 0 Low
Dually-Diagnosed 0 0 0 Low
Veterans 2 0 2 Low
Persons With HIV/AIDS 0 0 0 Low
Victims of Domestic Violence 30 0 30 High
*No facilities or services are located in the City of Sugar Land and are not counted as Sugar Land Current Inventory, however the City funds Fort Bend County Women’s Center located outside of Sugar Land but serving the City’s residents

City of Sugar Land, Texas
5 Year Strategic Plan 58 PY 2009-PY2013
Priority Homeless Needs
1. Using the results of the Continuum of Care planning process, identify the
jurisdiction's homeless and homeless prevention priorities specified in
Table 1A, the Homeless and Special Needs Populations Chart. The
description of the jurisdiction's choice of priority needs and allocation
priorities must be based on reliable data meeting HUD standards and
should reflect the required consultation with homeless assistance
providers, homeless persons, and other concerned citizens regarding the
needs of homeless families with children and individuals. The
jurisdiction must provide an analysis of how the needs of each category
of residents provided the basis for determining the relative priority of
each priority homeless need category. A separate brief narrative should
be directed to addressing gaps in services and housing for the sheltered
and unsheltered chronic homeless.
The City of Sugar Land places a high priority on shelter and services to victims of
domestic violence and intends to continue funding programs that address this need.
Currently, approximately 110 individuals from Sugar Land are provided services
and/or shelter through the City’s CDBG funding to the Fort Bend County Women’s
Center.
Unfortunately, no other full-service shelters for the homeless exist in Fort Bend
County to serve Sugar Land residents. Fort Bend Family Promise provides short-
term shelter through churches to homeless families. The format of all Family
Promises nationwide is to shelter families one week at a time in various churches
throughout the area, providing beds, meals and possibly transportation. This
assistance is meant to be a stop-gap measure for those who have lost their homes
and the ability to be self-sufficient for a short period of time. The more intensive
needs such as protective shelter from domestic abusers, health care, mental health
services, substance abuse treatment, child care, remedial education and job training
are not provided through Family Promise agencies.
The City of Sugar Land makes every effort to provide funding to ensure that the
homeless of Sugar Land are adequately served. At this time, the priorities given to
shelter, housing and services for those homeless not victims of domestic violence are
listed as “Low” due to the lack of agencies serving these population categories.
However, if programs become available and the need can be better enumerated, the
City will adjust the priorities by way of an amendment to the Consolidated Plan.
2. A community should give a high priority to chronically homeless persons,
where the jurisdiction identifies sheltered and unsheltered chronic
homeless persons in its Homeless Needs Table - Homeless Populations
and Subpopulations.
At this time, the only quantifiable information regarding homeless subpopulations is
for victims of domestic violence. No programs other than those for victims of
domestic violence and for those with short-term shelter needs serve Fort Bend
County and Sugar Land residents. The Coalition for the Homeless of Houston/Harris
County, which includes Fort Bend County under its umbrella, does not enumerate
separately the homeless outside of Harris County. The only program existing at this

City of Sugar Land, Texas
5 Year Strategic Plan 59 PY 2009-PY2013
time that can provide permanent housing to chronically homeless persons is the
Section 8 Housing Choice Voucher program in Rosenberg, a city of Fort Bend County
approximately twenty miles southwest of Sugar Land. Currently, Rosenberg is the
only jurisdiction in Fort Bend County with a Section 8 housing program. There are
currently 340 vouchers in use through Rosenberg’s Section 8 program with an
average wait for housing of more than two years for those on the waiting list. The
waiting list of 200 was compiled on a lottery system for those who completed the
pre-application process and qualified for Section 8. All recipients of Rosenberg’s
Section 8 program must be residents of Rosenberg.
Homeless Inventory (91.210 (c))
The jurisdiction shall provide a concise summary of the existing facilities
and services (including a brief inventory) that assist homeless persons and
families with children and subpopulations identified in Table 1A. These
include outreach and assessment, emergency shelters and services,
transitional housing, permanent supportive housing, access to permanent
housing, and activities to prevent low-income individuals and families with
children (especially extremely low-income) from becoming homeless. The
jurisdiction can use the optional Continuum of Care Housing Activity Chart
and Service Activity Chart to meet this requirement.
As Table 1A above indicates, there are no shelters, transitional housing, permanent
housing or services for the homeless located in the City of Sugar Land. Fort Bend
County Women’s Center, located outside of the City, does provide services and
shelter to Sugar Land’s victims of domestic violence. Fort Bend Family Promise
provides shelter to three to four families at any given time, limiting the number to a
total of 14 individuals. During its five years of existence, it has only served six Sugar
Land families. No other agencies serve Sugar Land’s homeless in Fort Bend County.
Fort Bend Homeless, Inc. is currently being established to develop a teen shelter
west of Rosenberg in Fairchild, Texas, approximately forty miles from Sugar Land.
The Homeless table within the CPMP “Needs” Excel file does give anticipated slots to
be funded by Sugar Land CDBG in the next five years. These include shelter for 150
victims of domestic violence and their children; however the shelter will be outside
the City Limits serving Sugar Land residents.
Homeless Strategic Plan (91.215 (c))
1. Homelessness— Describe the jurisdiction's strategy for developing a
system to address homelessness and the priority needs of homeless
persons and families (including the subpopulations identified in the
needs section). The jurisdiction's strategy must consider the housing
and supportive services needed in each stage of the process which
includes preventing homelessness, outreach/assessment, emergency
shelters and services, transitional housing, and helping homeless
persons (especially any persons that are chronically homeless) make the
transition to permanent housing and independent living. The jurisdiction
must also describe its strategy for helping extremely low- and low-
income individuals and families who are at imminent risk of becoming
homeless.
City of Sugar Land, Texas
5 Year Strategic Plan 60 PY 2009-PY2013
Currently, the City of Sugar Land falls under the umbrella of the Coalition for the
Homeless of Houston/Harris County, including Fort Bend County. The City receives
no Emergency Shelter Grant funding, has no programs to serve the homeless and
the Fort Bend County Women’s Center is the only Fort Bend agency currently
receiving Continuum of Care funding through the Coalition for the Homeless. At this
time, all homeless residents must be referred to other jurisdictions, primarily the City
of Houston for shelter, housing and services.
The City of Sugar Land has in the past provided technical assistance to agencies in
starting a Fort Bend County homeless coalition and will continue to provide technical
assistance. However, at this time there are no agencies willing to participate in such
an effort. The Fort Bend County Women’s Center is currently receiving Continuum of
Care funds from the Coalition for the Homeless of Houston/Harris County and no
other agencies have the current capacity to apply for federal grants or to assist in
forming a local coalition. The Fort Bend County Women’s Center is the only agency
in Fort Bend County that is currently a member of the existing Harris County
coalition. Discussions with Texas Homeless Network have taken place regarding the
viability of the City and County pulling out of the Coalition for the Homeless of
Houston/Harris County and going with the Balance of State program. However, to
date, only the Homeless Management Information System (HMIS) has been funded
through Balance of State, making it inadvisable for agencies to abandon local
participation.
2. Chronic homelessness—Describe the jurisdiction’s strategy for
eliminating chronic homelessness by 2012. This should include the
strategy for helping homeless persons make the transition to permanent
housing and independent living. This strategy should, to the maximum
extent feasible, be coordinated with the strategy presented Exhibit 1 of
the Continuum of Care (CoC) application and any other strategy or plan
to eliminate chronic homelessness. Also describe, in a narrative,
relationships and efforts to coordinate the Conplan, CoC, and any other
strategy or plan to address chronic homelessness.
Without an area Coalition, without the City receiving Emergency Shelter Grant
funding and without local agencies available to provide services to the chronically
homeless, there can be no acceptable strategy for ending homelessness by 2012.
For Continuum of Care funding, the City is under the umbrella of the Coalition for the
Homeless of Houston/Harris County and the City’s consultants participate in the
Coalition’s activities and the Texas Homeless Network. However, there are no
agencies currently in Sugar Land that serve the chronically homeless. The only Fort
Bend County agency to apply for participation in the Continuum of Care application is
the Fort Bend County Women’s Center which serves victims of domestic violence.
Fort Bend Family Promise is aimed at providing shelter to homeless families who are
able to become self-sufficient within six months.
The City and its consultants have provided technical assistance to the local chapter
of the National Association for the Mentally Ill (NAMI) in an attempt to assist them in
building the capacity to secure funding for tenant-based rental assistance for
mentally ill homeless. The City will continue to work with the agency as requested,
but at this time, they are not located in or serving Sugar Land.

City of Sugar Land, Texas
5 Year Strategic Plan 61 PY 2009-PY2013
3. Homelessness Prevention—Describe the jurisdiction’s strategy to help
prevent homelessness for individuals and families with children who are
at imminent risk of becoming homeless.
The City of Sugar Land places a priority on funding agencies that provide interim
assistance to prevent homelessness. Currently, it is estimated that 2,030
households are in need of interim assistance for rent, mortgage or utility payments.
The City of Sugar Land does provide utility assistance to low-moderate income
residents through the utility fund, not through CDBG funding. No other agency in
Fort Bend County has applied for CDBG funding through the City of Sugar Land. Due
to the limited CDBG funding received by the City, it is not in a position to institute
and staff such a program internally. The City and its consultants are available to
provide technical assistance to agencies interested in providing interim assistance.
Without receiving Emergency Shelter Grant (ESG) funding, the City must use its
Public Service dollars of its CDBG funds for interim assistance. There is a 15 percent
cap placed on public services funding; therefore, the City would only be able to fund
a few households if an agency existed and had the capacity to apply for funds.
Emergency Shelter Grant funds are provided to Fort Bend County, but since the City
of Sugar Land is a CDBG Entitlement Jurisdiction, its residents are not entitled to the
County’s HOME or ESG program. Agencies serving Sugar Land residents are eligible
to apply for State of Texas ESG funds, but other than the Fort Bend County Women’s
Center, there are no local applications to the State.
4. Institutional Structure—Briefly describe the institutional structure,
including private industry, non-profit organizations, and public
institutions, through which the jurisdiction will carry out its
homelessness strategy.
The Fort Bend County Women’s Center is the only agency providing comprehensive
homeless services to Sugar Land. Located outside of Sugar Land, it does receive
Sugar Land CDBG funds to provide crisis intervention and shelter to victims of
domestic violence. The local NAMI chapter has received technical assistance from
the City and its consultants but does not currently have the capacity to provide
services to its members and to mentally ill residents of Sugar Land. The City’s
consultants have contacted the Fort Bend Family Promise and will be providing
additional technical assistance to that agency for capacity building, fund-raising and
potential participation in a homeless coalition, be it the Coalition for the Homeless of
Houston/Harris County or a new Fort Bend County coalition.
While Sugar Land does fall under the umbrella of the Coalition for the Homeless of
Houston/Harris County, the Coalition focuses virtually all of its programming,
technical assistance and enumerations in Harris County.
5. Discharge Coordination Policy—Every jurisdiction receiving McKinney-
Vento Homeless Assistance Act Emergency Shelter Grant (ESG),
Supportive Housing, Shelter Plus Care, or Section 8 SRO Program funds
must develop and implement a Discharge Coordination Policy, to the
maximum extent practicable. Such a policy should include ―policies and
protocols for the discharge of persons from publicly funded institutions
or systems of care (such as health care facilities, foster care or other
youth facilities, or correction programs and institutions) in order to

City of Sugar Land, Texas
5 Year Strategic Plan 62 PY 2009-PY2013
prevent such discharge from immediately resulting in homelessness for
such persons.‖ The jurisdiction should describe its planned activities to
implement a cohesive, community-wide Discharge Coordination Policy,
and how the community will move toward such a policy.
This policy is not applicable to Sugar Land. The City of Sugar Land does not receive
Emergency Shelter Grant funding and does not have a homeless coalition that seeks
Continuum of Care funding. No agency within Sugar Land receives ESG, Supportive
Housing, Shelter Plus Care or Section 8 Mod Rehab/SRO funding.
Emergency Shelter Grants (ESG)
(States only) Describe the process for awarding grants to State recipients,
and a description of how the allocation will be made available to units of
local government.
Not Applicable

City of Sugar Land, Texas
5 Year Strategic Plan 63 PY 2009-PY2013
COMMUNITY DEVELOPMENT
Community Development (91.215 (e)) *Please also refer to the Community Development Table in the Needs.xls workbook
1. Identify the jurisdiction's priority non-housing community development
needs eligible for assistance by CDBG eligibility category specified in the
Community Development Needs Table (formerly Table 2B), i.e., public
facilities, public improvements, public services and economic
development.
The City of Sugar Land has a general priority of ensuring that the infrastructure of
the City is equal in all geographic areas and that all residents have equal access to
services. As a result, the City has developed the following priority table that is also
repeated within the Community Development Needs Table in the CPMP “Needs” Excel
file.
Table 12 – Community Development Needs and Priorities
Matrix Code Activity Presumed Need (estimates)
Priority (H, M, L) 5-Year Goals
Target Area-Based Activities (Low-Mod Income Area)
03 Public Facilities (General) adequate M
03D Youth Centers 1 needed M
03F Parks, Recreational Facilities
150 acres of mini- and neighborhood parks
H 2 improvements ~9,500 linear feet of trails
1 recreation center
Improvements to 6 parks in target areas
03I Flood Drainage ~2,500 feet in target areas H 2 improvements
03J Water/Sewer Improvements
~500 feet in target areas
M
2 lift stations in target areas or serving target areas
03K
Street Improvements (including street lighting)
~89,400 square feet in target areas
H 1 improvement
8,500 new & retrofit street lights for energy efficiency
03L Sidewalks
~1,615 linear feet in target areas (replacement)
H 2 improvements
~9,500 linear feet in target areas (new)
03O Fire Stations/ Equipment Adequate M
03P Health Facilities Adequate L
03R Asbestos Removal privately managed L
04 Clearance/Demolition 30+ sites M
04A Cleanup Contaminated Sites 30 sites M

City of Sugar Land, Texas
5 Year Strategic Plan 64 PY 2009-PY2013
05I Crime Awareness adequate L
14E Commercial/Industrial Rehabilitation 10+ sites L
15 Code Enforcement 250+ lots M
16B Non-residential Historic Preservation 10+ sites M
18A
Economic Development Direct Assistance to For-Profits 4B Corporation to handle L
18B
Economic Development Technical Assistance 4B Corporation to handle L
18C Micro-Enterprise Assistance 4B Corporation to handle L
Low-Mod Income Clients or Households (any area)
03A Senior Centers improvements/expansion/1 more needed H 1 improvement
03B Handicapped Centers 2 needed M
03C Homeless Facilities adequate L
03M Child Care Centers adequate L
03Q Abused/Neglected Children Facilities adequate L
05 General Public Services 1,500+ low-mod income M
610 - 765 residents
05A Senior Services 2,250+ seniors H 20 - 25 seniors
05B Handicapped Services 3,802 adults M 5 - 10 disabled
05C Legal Services 250+ low-mod income M 120 - 152 adults
05D Youth Services 2,500+ youth H 80 - 120 youth
05E Transportation Services 764 individuals H 24 - 30 adults
05F Substance Abuse Services 1,900 individuals M
05G Domestic Violence Services 110 families per year H
245 - 310 women & their children
05H Employment Training 2,300 adults M
05J Fair Housing Activities adequate L
05K Tenant/Landlord Counseling adequate L
05L Child Care Services 1,000+ children M
05M Health Services 15,840 adults + 5,684 children M
05N Abused/Neglected Children Services 120 children M
215 - 270 children
05O Mental Health Services 750 individuals M
05P
Lead Based Paint/Lead Hazard Screening 2,679 units M 4 – 12 homes

City of Sugar Land, Texas
5 Year Strategic Plan 65 PY 2009-PY2013
05R/13
Homeownership Assistance
3,351 w/ cost burden M
4,890 need homebuyer assistance
05S Rental Housing Subsidies 1,018 w/ cost burden M
05T Security Deposits 750 households L
06 Interim Assistance 2,030 households M
12 Construction of Housing
434 owner occupied; 367 renter occupied L
14A
Single Family Housing Rehabilitation 4,299 units H 40 – 120 homes
14B Multi-family Housing Rehabilitation 584 units M
14F Energy Efficiency Improvements 10,000+ units H 10 – 30 homes
14G Acquisition for Rehabilitation < 100 units L
14I Lead Based Paint Abatement 2,679 units M
16A Residential Historic Preservation < 100 units M
19C Non-profit Capacity Building 10+ agencies M 3 - 5 agencies
19D
Assistance to Institutes of Higher Learning
1 community college L
1 upper division university.
19E
Operation and Repair of Foreclosed Properties 25 properties L
2. Describe the basis for assigning the priority given to each category of
priority needs.
The priority given to each category of the needs table is based on several factors:
Level of available CDBG funding against program cost
Location of need for area-based projects (within CDBG Target Area)
Level of physical need described in City Comprehensive Plan and/or
Parks Master Plan for public facilities and infrastructure
Number of households or people in need based on Census, State and
local data from a variety of sources
Level of need described in applications for subrecipient funding and
numbers served by subrecipients in the past
Availability and capacity of agencies to address the need if funded
Results of an on-line survey of needs
The table above details the objective levels of need for each category, while the table
below repeats an earlier table detailing the average scores from the on-line survey
for eligible projects. The table shows that the higher the score, the greater the
perceived need or the higher the priority for addressing a need in the minds of the
respondents. Also, the rows highlighted in blue indicate those facilities or services
given a high priority in the Needs table and in this Consolidated Plan.

City of Sugar Land, Texas
5 Year Strategic Plan 66 PY 2009-PY2013
Table 13 – Average Score from On-Line Survey
Shaded information represents those given a High Priority
Issues
Average
Score
1= Very Low Need, 2 = Low Need, 3= Moderate Need
4= High Need, 5 = Very High Need
Owner-occupied housing needs in Sugar Land:
Minor Rehabilitation 2.14
Major Rehabilitation 1.69
Demolition/Reconstruction 1.51
Construction of New Affordable Housing 2.24
Energy Efficiency Improvements 3.26
Downpayment Assistance for 1st-time Buyers 2.14
Housing Counseling 2.56
Rental housing needs in Sugar Land:
Minor Rehabilitation 2.47
Moderate or Major Rehabilitation 2.28
Demolition/Reconstruction 1.67
Assisted Facilities for Frail Elderly 3.26
Assisted Facilities for Disabled 3.00
Apartments for Elderly 3.16
Handicapped-Accessible Apartments 2.68
Rental Units for Small Households 2.27
Rental Units for Large Households 1.86
Public facilities needs in Sugar Land:
Multi-service/Recreational Facility 3.08
Public Neighborhood Parks 3.08
Senior Center 3.42
Day Center for Disabled 2.86
Child Care Center 2.39
Improved Flood Control/Drainage 3.14
Improved Water/Sanitary Sewer Lines 3.08
Improved Sidewalks/Street Lighting 3.26
Social service needs in Sugar Land:
Services for abused/neglected children 3.18
Services for victims of domestic violence 3.62
Services and shelter for homeless 2.34
Legal services 2.76
Child care 2.61
Youth services 3.42
Senior services 3.55
Handicapped services 3.19
ESL/Literacy education/Adult education 2.97
Mental health and/or substance abuse services 2.82
Emergency, interim assistance 2.78
Health services 3.16
Transportation services 3.39

City of Sugar Land, Texas
5 Year Strategic Plan 67 PY 2009-PY2013
These results of the on-line survey were reviewed primarily in light of available
funding and available agencies to carry out the services, as detailed above. The City
has given a high priority to the programs that those residents responding to the
survey deemed as important.
3. Identify any obstacles to meeting underserved needs.
As with all of the other eligible programs in CDBG, the lack of sufficient funding is the
greatest obstacle to meeting underserved needs. The second major obstacle is the
lack of potential subrecipients to carry out the priority activities. There are few
agencies that serve Sugar Land residents, and many of those agencies do not have
the capacity to manage federal funding or do not serve an adequate Sugar Land
client base to warrant the administrative tasks required with federal funding. Sugar
Land makes a concerted effort (1) to identify eligible projects and agencies to
implement the projects; (2) to invite the identified agencies to apply for funding; (3)
to open the invitation and application process to any agency through advertisements
in the general publication newspaper and through information sent to all known
entities; and (4) to provide technical assistance when requested to all agencies
seeking funding or capacity-building or other program-enhancements.
The lack of adequate public transportation is an obstacle to meeting many of the
needs of the underserved, particularly the public service needs. Fort Bend Transit
provides only limited service throughout the county. There is a demand response
service within the county for the elderly or disabled regardless of income, but no
service for other low- to moderate-income residents and no demand response from
Fort Bend County to services in Harris or Brazoria Counties.
Sugar Land is a relatively young city that is fast-growing in residential, retail and
office land uses. Because most of the City was developed within the past forty years
as unincorporated communities and annexed into the City Limits after development
was complete or near complete, most areas have adequate infrastructure. The older
areas, such as Mayfield Park, have been the focus of CDBG-funded upgrades to the
park system and infrastructure. The City is aggressively addressing the physical
needs of the various CDBG Target Areas in Sugar Land.
Public services directed by private non-profit agencies have not been able to keep
pace with the growing population. Though Sugar Land has a growing underserved
population, the number of individuals in need of public services has not reached the
level of economies of scale or critical mass that can justify the establishment of
major public service programs by non-profit organizations. Most of the programs in
Sugar Land are governmental/quasi-governmental, branches of large non-profit
corporations or grass-roots organizations. The lack of institutional capacity is the
primary obstacle for the grass-roots organizations, while the large and governmental
agencies are structured more to address the needs of an inner-city urban population
while Sugar Land is a suburban area.
4. Identify specific long-term and short-term community development
objectives (including economic development activities that create jobs),
developed in accordance with the statutory goals described in section 24
CFR 91.1 and the primary objective of the CDBG program to provide
decent housing and a suitable living environment and expand economic
opportunities, principally for low- and moderate-income persons.
City of Sugar Land, Texas
5 Year Strategic Plan 68 PY 2009-PY2013
NOTE: Each specific objective developed to address a priority need, must be identified by number and contain proposed accomplishments, the time period (i.e., one, two, three, or more years), and annual program year numeric goals the jurisdiction hopes to achieve in quantitative terms, or in other measurable terms as identified and defined by the jurisdiction.
The City of Sugar Land has used and will continue to use CDBG funds for:
Upgrading infrastructure, public parks and public facilities in older
neighborhoods that qualify as CDBG Target Areas. These upgrades not
only serve the current residents but also help to preserve property values
in the Target Areas.
Rehabilitating homes owned and occupied by low-moderate income
residents throughout Sugar Land. Rehabilitation and repairs to individual
homes not only assists the owners of those homes but helps to preserve
the property values in the entire neighborhood.
Providing ESL and general literacy education to enhance the literacy and,
as a result, the employability of its residents. The City has a large Asian
population as well as a sizable Hispanic population and residents who are
English speaking but functionally illiterate. ESL and general literacy
education serves to provide these residents with the opportunity to apply
for and retain employment at a livable wage.
The City and other taxing jurisdictions in Fort Bend County reduced property tax
rates for the past several years. This benefits homeowners as well as businesses
throughout the City. The tax deferral for the elderly also helps homeowners who are
not able to afford home maintenance and pay taxes. By deferring the taxes until the
property is sold or inherited, the City is giving the elderly the opportunity to remain
in their homes and maintain them on their limited fixed incomes.
Aside from CDBG funding, the City has a vital and vibrant economic development
program. The Sugar Land Economic Development Department is committed to
building business and assisting corporate decision makers by providing information,
data and direction on incentive packages, real estate and city services. Sugar Land’s
corporate and City leaders recognize the importance of a strong, cooperative
partnership and have joined forces to ensure continued economic growth and
development.
Chapter 380 of the Local Government Code provides legislative authority for
municipalities to establish a program for making loans and grants to promote state
and local economic development and to stimulate business and commercial activities
in the City.
In addition to the lowering of tax rates for all properties, the City of Sugar Land and
Fort Bend County provide property tax abatements on the appraised value of real
property improvements and business personal property for new and growing
enterprises. The City provides tax increment financing to finance needed public
improvements within a defined area. The costs of public infrastructure improvements
to a Tax Increment Reinvestment Zone (TIRZ) are repaid by the contribution of
future tax revenues by each taxing entity over the property. Additionally, the Fort
Bend Independent School District and Municipal Utility District 21 offer Freeport tax
exemption to Sugar Land companies’ inventories that are shipped out of state within
175 days of receipt.
The State of Texas offers performance-based incentives in response to opportunities

City of Sugar Land, Texas
5 Year Strategic Plan 69 PY 2009-PY2013
to bring jobs and employers to Texas from out of state. These funds are used
primarily to attract new business or assist with the substantial expansion of existing
business. The program requires participation by local governmental entities, and
Sugar Land is a participant in the program. The State of Texas also utilizes a $100
million fund to develop and diversify the state’s economy by expediting innovation
and commercialization of research, increasing higher education’s applied technology
research capabilities and increasing high-quality jobs. The City of Sugar Land
encourages local companies to take advantage of these state incentives. The State
and local incentives have resulted in an explosive growth in the employment sectors
of Sugar Land.
The City of Sugar Land has one of the largest and most vibrant retail areas in the
region. Currently there is over 6,000,000 square feet of retail space in the City with
more developing. Since 2000, the City has increased its annual sales taxes by more
than 70 percent. These retail establishments are ideal employers for the low-
moderate income workforce. In addition, the corporate growth in Sugar Land
provides opportunities for a higher-end workforce. With a community college and
upper-division/graduate level major university in Sugar Land, the residents have the
opportunity to increase their educational level while working in retail positions and
then move into higher-end corporate environments within the City Limits.
Antipoverty Strategy (91.215 (h))
1. Describe the jurisdiction's goals, programs, and policies for reducing the
number of poverty level families (as defined by the Office of
Management and Budget and revised annually). In consultation with
other appropriate public and private agencies, (i.e. TANF agency) state
how the jurisdiction's goals, programs, and policies for producing and
preserving affordable housing set forth in the housing component of the
consolidated plan will be coordinated with other programs and services
for which the jurisdiction is responsible.
The City of Sugar Land approaches the reduction of poverty in a number of ways.
First, the City uses CDBG dollars to assist public service agencies in providing
services that enhance the employability of its clients. Using CDBG dollars, the City
has funded and plans to continue to fund:
English as a Second Language (ESL) and general literacy education for
those with limited English proficiency or who are functionally illiterate. By
increasing the literacy level of these residents, most of whom are very
low- and low-income, the program is providing the necessary skills for
accessing higher-paying jobs and improving their quality of life. The
Literacy Council of Fort Bend County serves approximately 200 individuals
each year with City of Sugar Land CDBG funding.
The Fort Bend County Women’s Center that provides shelter, education
and job training to victims of domestic abuse. Its residents come to the
shelter with virtually no resources or income and through the supportive
services provided, they are able to secure employment that will allow
them to move into independent living. In addition, Fort Bend County
Women’s Center and Fort Bend Lawyers CARE, also funded by the Sugar

City of Sugar Land, Texas
5 Year Strategic Plan 70 PY 2009-PY2013
Land CDBG program, provide the legal assistance necessary to extricate
the victims from their abusers and from other legal situations that might
hamper their ability to secure employment and safe independent housing.
The second approach to reducing poverty in Sugar Land is to reduce the cost of
housing by providing rehabilitation assistance and reducing property taxes. Housing
rehabilitation activities help ensure that the low-moderate income homeowners,
particularly the elderly and disabled, are able to remain in their homes and preserve
the value of their property. As more and more of the elderly homeowners are opting
for setting up reverse mortgages, preservation of their property values directly
impacts the amount of the lump-sum or monthly payments that they can receive
from this HUD-sponsored program. A stabilization following past reductions in
property tax rates not only helps the homeowner but also assists the commercial
establishments, including apartment complexes, retailers and service providers who
can pass the savings on to the consumers. As the cost of living decreases, the
amount of disposable income increases. In addition, as the cost of doing business
decreases due to a reduction in property taxes, the business owners are better able
to increase the wages of their employees.
The third approach to reducing poverty in Sugar Land is to increase the employment
base by using incentives to attract new retail, office and industrial developments
throughout the City. The section above explains the various incentives available to
new businesses in Sugar Land.
2. Identify the extent to which this strategy will reduce (or assist in
reducing) the number of poverty level families, taking into consideration
factors over which the jurisdiction has control.
The City’s concerted effort to improve employment and educational opportunities has
resulted in a much smaller increase in the percentage of low-moderate income
residents than in the state of Texas as a whole. In 2000, Texas had a low-moderate
income percentage of 37.3, while the 2005-2007 three year average from the U.S.
Census American Community Survey was 41.38 percent, or a 10.94 percent
increase. The City of Sugar Land had a 2000 low-moderate income rate of 37.46
percent, slightly above the state average; however, Sugar Land’s low-moderate
income population comprised 38.47 percent of the total in 2005-2007, an increase of
only 2.7 percent (or 1.01 percentage points) and a level well below the Texas
average. With the continued growth in the employment base, it can be assumed
that the City will continue to outpace the state in the percent of higher-income
residents. The challenge for the City is the increase in the percent of residents
without a high school diploma. In 2000, only 6.6 percent had less than a high school
diploma or equivalency with 9.3 percent in 2005-2007. Much of the increase can be
attributed to the growth in foreign born population from 23.5 percent in 2000 to 30.8
percent in 2005-2007. Additionally, the growth in the retail and entertainment
sectors of the employment base has attracted less educated workers from
surrounding areas.
By continuing its aggressive economic development activities, the City will continue
to provide increased employment opportunities for residents and attract employees
from surrounding areas. Wharton County Junior College and the University of
Houston upper-division/graduate school in Sugar Land will continue to provide
quality education to residents and afford residents the opportunity to receive an
Associate’s, Bachelor’s or Master’s degree within their own community.

City of Sugar Land, Texas
5 Year Strategic Plan 71 PY 2009-PY2013
The literacy education and education/job training provided by current CDBG
subrecipients will continue to prepare the least employable for jobs at a livable wage.
Low Income Housing Tax Credit (LIHTC) Coordination (91.315
(k))
1. (States only) Describe the strategy to coordinate the Low-income
Housing Tax Credit (LIHTC) with the development of housing that is
affordable to low- and moderate-income families.
Not Applicable
City of Sugar Land, Texas
5 Year Strategic Plan 72 PY 2009-PY2013
NON-HOMELESS SPECIAL NEEDS
Specific Special Needs Objectives (91.215)
1. Describe the priorities and specific objectives the jurisdiction hopes to
achieve over a specified time period.
The City of Sugar Land places a high priority on facilities and services for the elderly
and victims of domestic violence. While the City of Sugar Land is concerned about
the welfare and quality of life for the disabled, mentally challenged, mentally ill,
chronic substance abusers and People Living with HIV/AIDS, there is not an agency
with the capacity at this time to provide facilities or services to any of these other
“special needs” populations. The City is committed to providing technical assistance
to agencies or grass-roots organizations in order to increase their capacity and ability
to serve their target populations and to manage federal funding.
The specific objectives that the City of Sugar Land hopes to achieve over the next
five years include:
Provide home-delivered meals to 25 elderly individuals
Provide crisis intervention, shelter and supportive services to 500
victims of domestic violence
Provide counseling and forensic interviewing services to children who
are victims of abuse, neglect or assault
Provide housing rehabilitation to the owner-occupied homes of 25
elderly and 10 disabled residents of Sugar Land
Provide technical assistance to 5 agencies and/or grass roots
organizations to enhance their capacity to serve “special needs”
populations
Collaborate with Fort Bend Transit to improve transportation services
to the “special needs” populations in order to provide access to
facilities and services
2. Describe how Federal, State, and local public and private sector
resources that are reasonably expected to be available will be used to
address identified needs for the period covered by the strategic plan.
The City of Sugar Land plans to continue providing its legal maximum of 15 percent
of CDBG funding to public services. Within this 15 percent – approximately $45,000
- $52,000 depending on the annual allocation – the City anticipates funding the
home-based hot meals for the elderly and frail elderly, crisis intervention, shelter
and supportive services to victims of domestic violence and services to children who
are victims of abuse, neglect or assault. The City encourages other agencies to
apply for funding and has worked with the local chapter of the National Association
for the Mentally Ill (NAMI) as well as various substance abuse service providers to
enhance their capacity and encourage their application for funding to the City and
other public entities and foundations.
The City of Sugar Land plans to continue providing between $50,000 and $100,000
per year for housing rehabilitation, with an anticipated $40,000 to $80,000 per year
for elderly and disabled home owners.

City of Sugar Land, Texas
5 Year Strategic Plan 73 PY 2009-PY2013
Those agencies currently using CDBG funding to serve “special needs” populations in
Sugar Land contribute significant additional resources for providing services to Sugar
Land residents. These resources total approximately $3,950,000 over the five-year
period of this Consolidated Plan:
$2,250,000 in housing rehabilitation
$ 150,000 in child advocacy/counseling services
$ 350,000 in home-delivered meals to elderly and frail elderly
$1,200,000 in shelter, crisis intervention and supportive services to
victims of domestic violence
Non-homeless Special Needs (91.205 (d) and 91.210 (d))
Analysis (including HOPWA) *Please also refer to the Non-homeless Special Needs Table in the Needs.xls workbook.
1. Estimate, to the extent practicable, the number of persons in various
subpopulations that are not homeless but may require housing or
supportive services, including the elderly, frail elderly, persons with
disabilities (mental, physical, developmental, persons with HIV/AIDS
and their families), persons with alcohol or other drug addiction, victims
of domestic violence, and any other categories the jurisdiction may
specify and describe their supportive housing needs. The jurisdiction
can use the Non-Homeless Special Needs Table (formerly Table 1B) of
their Consolidated Plan to help identify these needs. *Note: HOPWA recipients must identify the size and characteristics of the population with HIV/AIDS and their families that will be served in the metropolitan area.
Based on data from a number of state and federal agencies, it can be estimated that
there are 10,979 non-homeless special needs individuals in Sugar Land, not counting
the adults and children who are victims of domestic violence and abuse. Information
from the Fort Bend County Women’s Center and Child Advocates of Fort Bend County
shows that each year there are at least 500 women who are victims of domestic
violence and 100 children who are victims of abuse, neglect or assault. Because
these two populations do not have long-term conditions of “special need,” rather
their conditions are more situational and shorter-term, they are not counted in the
table below. However, they are a critical population to be served in Sugar Land.
Below is a table of the 10,979 Sugar Land residents with special needs.
Table 14 – Summary of Special Needs Populations
Population Estimated
Number
Frail Elderly 1,762
Non-frail elderly 4,492
Non-elderly physically disabled 4,208
Mentally disabled and substance abusers 310
Severely Mentally Ill 62
Dually Diagnosed/Co-occurring disorders 30
HIV+/AIDS 115

City of Sugar Land, Texas
5 Year Strategic Plan 74 PY 2009-PY2013
Sources: 2005-2007 American Community Survey , National Institute of Mental Health, Texas Department of Health and Human Services, Centers for Disease Control
2. Identify the priority housing and supportive service needs of persons
who are not homeless but may or may not require supportive housing,
i.e., elderly, frail elderly, persons with disabilities (mental, physical,
developmental, persons with HIV/AIDS and their families), persons with
alcohol or other drug addiction by using the Non-homeless Special Needs
Table.
The table below delineates the priority given to the various housing and supportive
service needs of “special needs” populations in Sugar Land:
Table 15 – Priority Needs of Special Needs Populations
Population Priority
Elderly High
Frail Elderly High
Disabled Medium
Chronic Substance Abusers Medium
Mentally Ill Medium
HIV/AIDS Low
Victims of Domestic Violence High
Abused, Neglected, Assaulted Children Medium
Within these categories above, transportation and housing rehabilitation receive high
priority with public facilities and non-transportation services receiving the priority
detailed in the table.
3. Describe the basis for assigning the priority given to each category of
priority needs.
The priority given to programs for each “special needs” subpopulations is based on
several factors:
Level of available CDBG funding against program cost
Number of individuals in need based on Census, State and local data
from a variety of sources
Level of need described in applications for subrecipient funding and
numbers served by subrecipients in the past
Availability and capacity of agencies to address the need if funded
Results of an on-line survey of needs
4. Identify any obstacles to meeting underserved needs.
As with all of the categories of funding, money availability is the primary obstacle to
meeting the underserved needs of the various “special needs” populations in Sugar
Land. This obstacle is becoming more critical as the economy has entered a
recession and individuals, businesses and foundations have considerably less
available resources to donate to non-profits. As the available resources shrink
during a recession, the need increases due to an economic-driven increase in
domestic violence, child abuse and neglect, substance abuse and mental illness.

City of Sugar Land, Texas
5 Year Strategic Plan 75 PY 2009-PY2013
A second obstacle to meeting underserved needs also is related to money, in regards
to the 15 percent cap for public services placed by legislation on HUD’s CDBG
program. The City of Sugar Land sees a great need for and benefit from allocating a
larger percentage of the annual CDBG award to public service projects that can reach
the needs of more special needs low-moderate income residents throughout the City.
A third obstacle is the shortage of viable entities to provide some of the needed
services. There are small grass-roots non-profits in Fort Bend County that would like
to serve the “special needs” populations in Sugar Land. However, they have little or
no capacity to address some of the most critical needs or to manage public or
foundation funding. Many do not have non-profit status; therefore, they cannot
receive public or foundation funding.
The lack of adequate public transportation is an obstacle to meeting many of the
needs of the underserved, particularly the public service needs. Fort Bend Transit
provides only limited service throughout the county. There is a demand response
service within the county for the elderly or disabled regardless of income; however,
there is no service for other low- to moderate-income “special needs” residents and
no demand response from Fort Bend County to services in Harris or Brazoria
Counties.
5. To the extent information is available, describe the facilities and services
that assist persons who are not homeless but require supportive
housing, and programs for ensuring that persons returning from mental
and physical health institutions receive appropriate supportive housing.
Currently, there are no residential facilities within the City of Sugar Land serving the
“special needs” populations, with the exception of privately owned and operated
nursing homes, assisted living and group homes for the elderly and physically
disabled. The City of Sugar Land has a Senior Center to provide assistance to the
mobile elderly within the City. Agencies within Fort Bend County provide very limited
transportation for Sugar Land residents to their facilities. The City of Sugar Land has
placed a high priority on assisting the agencies providing home-based meals,
transportation and other services to the elderly, disabled and abused residents of
Sugar Land. The City of Sugar Land has concerns for the “special needs”
populations, but recognizes that the economies of scale do not exist to warrant
special facilities to serve these residents. Therefore, there is a high priority placed
on transportation from Sugar Land to facilities in Fort Bend, Brazoria and Harris
Counties.
The City of Sugar Land has placed a high priority on developing an Accessibility
Program which would provide for the installation of handicapped aides in single
family dwellings. In addition, the City has placed a high priority on housing
rehabilitation for elderly and disabled homeowners.
6. If the jurisdiction plans to use HOME or other tenant based rental
assistance to assist one or more of these subpopulations, it must justify
the need for such assistance in the plan.
The City of Sugar Land is not a HOME Participating Jurisdiction. Given the limited
CDBG funding allocation, the City does not intend to provide other tenant based
rental assistance to one of the “special needs” subpopulations.
City of Sugar Land, Texas
5 Year Strategic Plan 76 PY 2009-PY2013
Housing Opportunities for People with AIDS (HOPWA) *Please also refer to the HOPWA Table in the Needs.xls workbook.
1. The Plan includes a description of the activities to be undertaken with its
HOPWA Program funds to address priority unmet housing needs for the
eligible population. Activities will assist persons who are not homeless
but require supportive housing, such as efforts to prevent low-income
individuals and families from becoming homeless and may address the
housing needs of persons who are homeless in order to help homeless
persons make the transition to permanent housing and independent
living. The plan would identify any obstacles to meeting underserved
needs and summarize the priorities and specific objectives, describing
how funds made available will be used to address identified needs.
2. The Plan must establish annual HOPWA output goals for the planned
number of households to be assisted during the year in: (1) short-term
rent, mortgage and utility payments to avoid homelessness; (2) rental
assistance programs; and (3) in housing facilities, such as community
residences and SRO dwellings, where funds are used to develop and/or
operate these facilities. The plan can also describe the special features
or needs being addressed, such as support for persons who are homeless
or chronically homeless. These outputs are to be used in connection
with an assessment of client outcomes for achieving housing stability,
reduced risks of homelessness and improved access to care.
3. For housing facility projects being developed, a target date for the
completion of each development activity must be included and
information on the continued use of these units for the eligible
population based on their stewardship requirements (e.g. within the ten-
year use periods for projects involving acquisition, new construction or
substantial rehabilitation).
4. The Plan includes an explanation of how the funds will be allocated
including a description of the geographic area in which assistance will be
directed and the rationale for these geographic allocations and priorities.
Include the name of each project sponsor, the zip code for the primary
area(s) of planned activities, amounts committed to that sponsor, and
whether the sponsor is a faith-based and/or grassroots organization.
5. The Plan describes the role of the lead jurisdiction in the eligible
metropolitan statistical area (EMSA), involving (a) consultation to
develop a metropolitan-wide strategy for addressing the needs of
persons with HIV/AIDS and their families living throughout the EMSA
with the other jurisdictions within the EMSA; (b) the standards and
procedures to be used to monitor HOPWA Program activities in order to
ensure compliance by project sponsors of the requirements of the
program.
6. The Plan includes the certifications relevant to the HOPWA Program.
Not Applicable – City of Sugar Land does not receive HOPWA funds

City of Sugar Land, Texas
5 Year Strategic Plan 77 PY 2009-PY2013
Specific HOPWA Objectives
1. Describe how Federal, State, and local public and private sector
resources that are reasonably expected to be available will be used to
address identified needs for the period covered by the strategic plan.
Not Applicable – City of Sugar Land does not receive HOPWA funds
City of Sugar Land, Texas
5 Year Strategic Plan 78 PY 2009-PY2013
OTHER NARRATIVE
Include any Strategic Plan information that was not covered by a narrative
in any other section.

City of Sugar Land, Texas
5 Year Strategic Plan 79 PY 2009-PY2013
ATTACHMENTS
Certifications
Public Notices
PowerPoint Presentations
Online Survey