50 pips a day forex strategy - fxntrading.com books/50 pips a day forex strategy.pdf · fibonacci...
TRANSCRIPT


50 Pips A Day Forex Strategy
How To Build A Solid Trading System
By Laurentiu Damir
Copyright © 2012 by Laurentiu Damir
All rights reserved. No part of this book may bereproduced or transmitted in any form or by anymeans, electronic or mechanical, includingphotocopying, recording, or any information storageand retrieval system, without prior written permissionof the Author. Your support of author’s rights isappreciated.
Books in PDF format
Trade the Price ActionFollow Price Action Trends
Day Trading Forex with Price Patterns

Forex Range Trading with Price ActionTrade the Momentum
Day Trading Forex with S&R ZonesAll in One PDF
Table of Contents
IntroductionComponents Price Trends Support and Resistance Fibonacci Retracements Patterns No technical indicators 200 EMAThe 4 hours and daily trendSolid money management Position sizing Risk-Reward ratio Stop loss placementPatience, no emotions, no outside influenceDon’t do this Price pattern breaks Candlestick confirmation
Fibonacci retracement levels Support and resistance Cutting profits short Letting losses run Revenge trading50 Pips A Day Forex Strategy Components Stop loss management and take profit levels

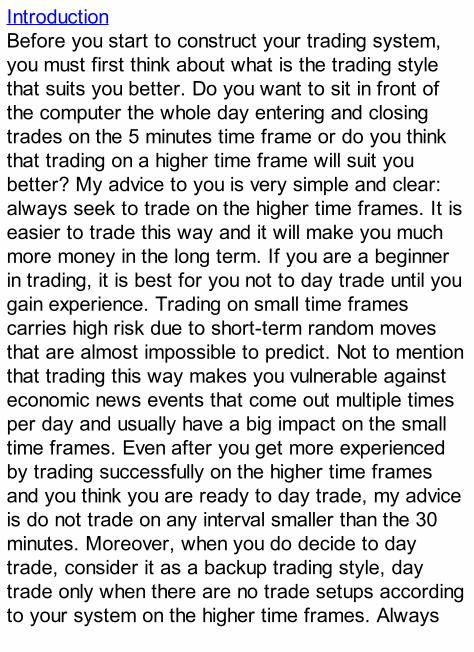
IntroductionBefore you start to construct your trading system,you must first think about what is the trading stylethat suits you better. Do you want to sit in front ofthe computer the whole day entering and closingtrades on the 5 minutes time frame or do you thinkthat trading on a higher time frame will suit youbetter? My advice to you is very simple and clear:always seek to trade on the higher time frames. It iseasier to trade this way and it will make you muchmore money in the long term. If you are a beginnerin trading, it is best for you not to day trade until yougain experience. Trading on small time framescarries high risk due to short-term random movesthat are almost impossible to predict. Not to mentionthat trading this way makes you vulnerable againsteconomic news events that come out multiple timesper day and usually have a big impact on the smalltime frames. Even after you get more experiencedby trading successfully on the higher time framesand you think you are ready to day trade, my adviceis do not trade on any interval smaller than the 30minutes. Moreover, when you do decide to daytrade, consider it as a backup trading style, daytrade only when there are no trade setups accordingto your system on the higher time frames. Always
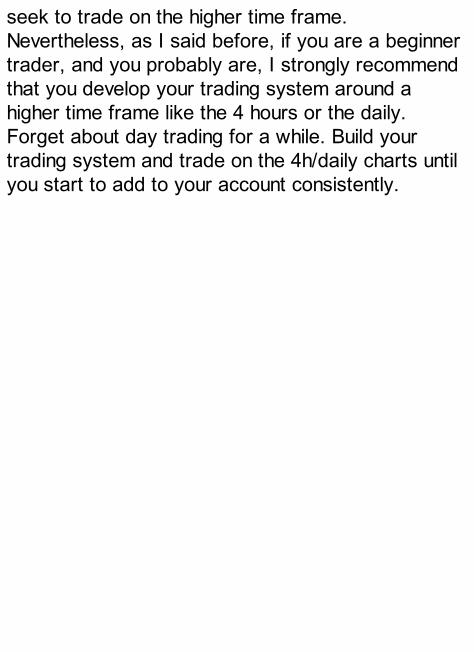
seek to trade on the higher time frame.Nevertheless, as I said before, if you are a beginnertrader, and you probably are, I strongly recommendthat you develop your trading system around ahigher time frame like the 4 hours or the daily.Forget about day trading for a while. Build yourtrading system and trade on the 4h/daily charts untilyou start to add to your account consistently.

ComponentsWith the above in mind, the next thing you shoulddecide is what you will include in your trading systemfrom the technical point of view to help you win asmany trades as possible. Decide what will be thecore technical parts of your trading system. Frommy experience, I can tell you which are the tools thatwork best in forex trading, that have a great rate ofsuccess and they repeat over and over again withexcellent results. These are price trends, supportand resistance levels, Fibonacci ratios, pricepatterns and bar patterns/candlestick patterns.These are the things you should consider including inyour system. They are the most popular things in theforex market thus, they have the highest rate ofsuccess.

Price TrendsYou surely know what a trend is and you know thatyou see them on your charts over and over again.The trend is a core principle of the forex market orany market for that matter and should always betaken into account when constructing your tradingsystem. It is always easier to trade with the trendthan against it. A trend signifies that the majority oftraders decided to push the price in one direction.You must always know what that direction is andtrade in line with it. If you want to know everythingthere is to know about forex trends, how to spotthem by reading the price action, how to recognizewhen the trend is changing without the help of anytechnical indicators, you can check out the bookFollow Price Action Trends that explains this in greatdetail, with many chart illustrations, and puts ittogether into a complete forex price action tradingsystem that can yield thousands of pips by tradingthese changes in trend.

Support and ResistanceSupport and resistance levels are also a keycomponent of the forex market; a large number oftraders out there emphasizes them on their chartsand base their trading decisions on them. Therefore,it is advisable when you decide how to constructyour trading system that you take them into account.
Fibonacci RetracementsFibonacci ratios are another forex tool that worksextremely well in the forex market. Just pull up anychart and draw your Fibonacci levels from the startto the end of any big move in one direction oranother. You will see how many times these levelsact as strong support and resistance zones whereprice bounces back to resume the previous trend.
PatternsPrice patterns and candlestick patterns are also verypopular with the vast majority of traders therefore,they too have a great rate of success. Price patternsare used as signals that price is preparing for amove in a direction and candlestick patterns areused mainly as a confirmation when entering a trade.If you want to learn in great detail about all of theseabove powerful trading tools and master them, youcan take a look at the Trade the Price Action bookthat explains them very well with many chartillustrations and puts them together in the form of anextremely powerful price action trading system. Inconclusion, these are the things that you shouldinclude in your trading system because there are byfar the most successful tools to trade the forexmarket. It is completely up to you to decide if youcombine them all in your system or just use some ofthem. There will be more about these powerful toolsin a later section where you will learn how to avoidmaking trading mistakes when working with them.

No technical indicatorsNow that you have an idea of what would be best toinclude in your trading system you also must knowwhat not to include in it. Do not use any technicalindicators in your trading because they areabsolutely worthless, and they will lose you money inthe long run. You might win a trade today using thembut you will surely lose all that money back and moreby the end of the week. You should consideryourself very lucky if in the course of a month youmanage to break even by trading with indicators. Allindicators are based on past price action, the macd,rsi, or stochastic are not leading indicators. They areonly leading you to losses. Being constructed of pastprice action they are all lagging behind the price. Bydesign they follow the past price action therefore,even if the signals they give would be accurate theyare useless because they come too late for you tocapitalize on them.Always remember one thing: price leads theindicator, not the other way around. Do not be fooledwhen you do a back test on your charts and you seethat using an indicator or a trading system withindicators would have made you thousands of pips.That is just a trick. Real time trading has nothing todo with back testing. When you put that indicator to
work in real time, you will soon see that you arewasting your time and money. Always rememberthat price tells the indicator what to do not viceversa. The ultimate indicator is and always will bethe price action itself. You should focus only onreading and interpreting the price action movementsand not overcomplicate your trading system withuseless indicators.

200 EMAFrom my experience, this moving average is the onlyindicator that is worth incorporating in your tradingsystem. It is the most important moving average ofthem all, all retail and professional traders keep aneye on it therefore price tends to bounce when ittouches it. However, it is best to use it in yourtrading system as guidance, as a confirmation ofwhat price action tells you and not as a tool to basetrading decisions on.For example, if your system is designed for the 4hchart, you will want to read the price action on thatchart to know what the trend is. After you do thatand see that the current trend is up or down, youcan then look at the 200 EMA on the same chart toconfirm and enforce your price action reading. Let ussay the price action trend on that chart is up. If thatspecific forex pair trades above the 200 EMA at thattime on the same chart then you have a confirmationof your price action reading.You can check out the Trade the Momentum book fora complete trading system that uses this movingaverage along with some other powerful concepts oftrading to make 200 pips per week or more.Let us see a chart with this moving average so youcan better understand how price reacts to it.


The 4 hours and daily trendA good trading system is the one that always takesinto account the bigger picture. The bigger picture inforex is represented by the trends on the highertimeframes.These trends control the price movement on thelower timeframes. If you design for yourself asystem that trades on the 4h charts, you mustalways take into account the trend on the daily chart.If you trade on the 1h or 30minutes charts, you mustalways take into account the trend on the 4h chart.For the trend on the daily chart you can use the 200EMA discussed earlier. If the pair is trading abovethe 200EMA on the daily chart, it means that thetrend is up on the daily chart. If the pair tradesbelow the 200EMA on the daily chart, it means thatthe trend is down on the daily chart.Therefore, any trades entered on the 4h chartaccording to your trading system should only beentered in line with the daily trend. This is the way bywhich you can avoid severe losses and achieve long-term success. Let me show you a trade setup on the4h chart generated by my Follow Price Action Trendstrading system:

In the 4h chart above, a trade setup took placeaccording to my trading system at that level wherethe trend changed from downtrend to uptrend on the4h chart. I should have bought this pair at that circlein the chart. Well, you can clearly see that pricewould have gone for a while in my favor only toretrace back down later eating all my gains andhitting my stop loss level. Is the trading system notgood? The trading system is very good because itkeeps me out of losing trades like this one. It always

takes into account the daily trend. And the dailytrend for that pair at that moment was:
Well, the daily trend was clearly down at themoment when I was supposed to enter the buyorder.The price action for that pair at that moment was
way below the 200EMA on the daily. You can seehow price just touched the 200 EMA on the dailychart and bounced back down like crazy to resumethe downtrend. According to my trading system, Iwould have taken this trade only if the pair had beentrading above the 200EMA on the daily chart. Mytrading system kept me out of this losing tradebecause it always looks at the bigger picture, yoursshould do the same. When you get moreexperienced and you want to start trading on a lowertimeframe like the 1-hour or the 30 minutes thebigger picture in this case will always be the 4htrend. However, I do not recommend you to graspthe 4h timeframe trend just by looking at the 200EMA. The moving average works best to find thetrend on the daily chart, for the trend on the 4h chartyou will have to read the price action in order to getthe best result possible out of your trading. Youmust determine the trend on the 4h chart by readingthe price action, the moving average is not thatcorrect on this timeframe and it can lead you tolosses. The smaller the timeframe, the less accuratethe 200 EMA becomes.The Follow Price Action Trends trading systemteaches you with great detail how to spot priceaction trends on the 4h charts. In addition, the Day

Trading Forex with Price Patterns trading system doesa great job teaching how to correctly establish theprice action trend on the 4h charts but with adifferent approach.

Solid money managementThe technical part of your system discussed earlieronly solves half of the problem. The other half andequally important is represented by the moneymanagement component.A very good money management technique givesyou the opportunity to be extremely profitable withyour system even if let us say, out of ten trades, fiveare losers. Of course, if you build your systemrespecting all the rules above and the rules that willfollow you won’t be in this situation, but if for anyreason you should find yourself in it, correct andstrict money management rules will make youprofitable even in situations like this mentioned.
Position sizingThis is the first rule of money management.For your system to be a good one, it must tell youhow much money you are going to lose on a tradebefore you enter the trade in the market. To achievethis you must first have a chat with yourself and thinkabout what percentage of your equity you are willingto risk on a trade. My advice is do not risk more than2-3% per trade.Next, your trading system should give you the exactlevels where you will enter the trade and where youwill place the stop loss level before you enter thetrade. Let us do the following exercise:You have 1000$ in your trading account and youdecided that you will only risk 2% of your money perone trade. This means that for the next trade you willhave to risk losing only 20$.Now, when a trade setup begins to take shape, youdecide where you will enter the trade and where youwill set the stop loss according to your tradingsystem.Let us say that you find out you will have a stop lossof 50 pips for this trade. This means that if the tradegoes wrong and your stop loss is hit you should loseonly 20$. You then divide 20$ / 50 pips to see thevalue in dollars for every pip that you lose. And that
value is 0.4$.This means that for every pip that goes against youtowards your stop loss you should lose only 0.4$.Only after you have this value you determine yourorder size, which is a simple thing to do since nowyou know the pip value. This means you will have totrade with an order size of 0.04 lots (4000$). If youlose the trade: 50 pip stop loss multiplied by 0.4$per pip equals 20$. You have to do this every timewhen preparing to enter a trade, always determineyour order size this way, manage your risk, alwaysput the bad scenario in front no matter howpromising and rewarding the potential trade looks.Don’t you ever think about how much money youcould win on that one trade. This will make youemotional, it will cloud your judgment, and you will betempted to enter with a big order size to win moremoney out of the trade. Instead, always think of howmuch money you could lose and do the mathexplained earlier to determine the size of your order.
Risk-Reward ratio Your system should spot trade setups where thereward is at least 2 times bigger than the risk forevery trade. This means that apart from the entryand stop loss levels, your trading system should tellyou the take profit level also. You should knowbefore entering the trade what is the risk and what isthe reward. If your system gives you trades wherethe reward is not 2 times greater than the risk orworse, the reward is smaller than the risk for everytrade then it is not a good trading system. You willlose your money in the long term. Whenever yoursystem presents you a trade like this, do not take it,no matter how promising it looks. Let us do anotherexercise to see how easy it is to be profitable if youhave a good system with solid money managementrules: you have a system that gives you trades with1:3 risk-reward ratio or more. This means that forevery pip you risk losing, the reward is 3 timesgreater. If you enter a trade with 50 pips stop lossthis means that your profit target is 150 pips.Let us say that on a given month you made 15trades according to your system, each of them witha 50 pips stop loss and 150 pips profit target. But,the market went crazy that month and out of those15 trades only 5 of them were winners. 10 were

losers. Therefore, you have only managed a 33%success rates with your trading system, which isvery low. Here is where money management showsits value.Let us do the math. You lost 10 trades with 50 pipsstop loss on each of them. This means you lost atotal of 500 pips that month. You only won fivetrades. With the profit target being 3 times greaterthan the risk, that is 150 pips won per every trade,this means you have won a total of 750 pips on thatmonth. Therefore, you have lost 10 trades out of 15which is dreadful but you’ve still made a profit of 250pips on that month thanks to money managementrules.
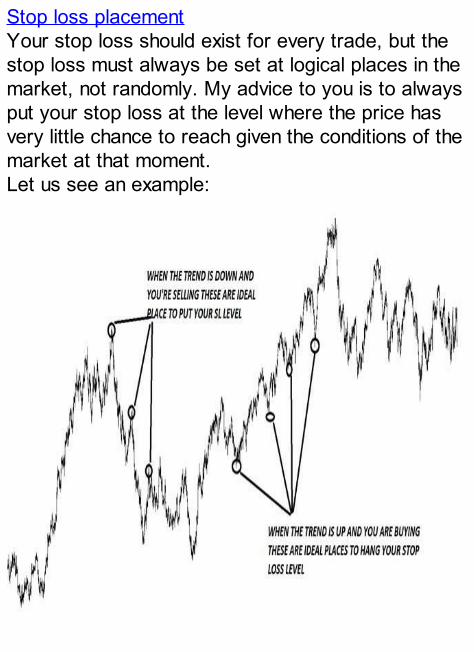
Stop loss placementYour stop loss should exist for every trade, but thestop loss must always be set at logical places in themarket, not randomly. My advice to you is to alwaysput your stop loss at the level where the price hasvery little chance to reach given the conditions of themarket at that moment.Let us see an example:
As you can see, when you sell, you put your stoploss just above the swing highs that price makes.When you buy, you put your stop loss just below theswing lows that price makes on its way up.If at the time your trading system gives you apotential trade you do not see a logical point in themarket like these in the chart above, you do notenter the trade no matter how lucrative it mightappear.

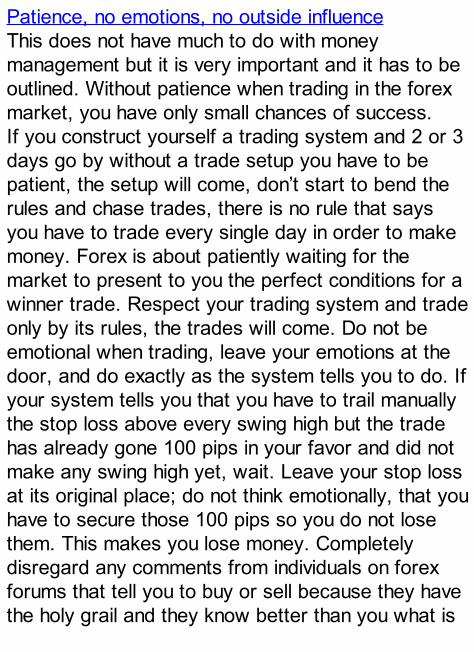
Patience, no emotions, no outside influenceThis does not have much to do with moneymanagement but it is very important and it has to beoutlined. Without patience when trading in the forexmarket, you have only small chances of success.If you construct yourself a trading system and 2 or 3days go by without a trade setup you have to bepatient, the setup will come, don’t start to bend therules and chase trades, there is no rule that saysyou have to trade every single day in order to makemoney. Forex is about patiently waiting for themarket to present to you the perfect conditions for awinner trade. Respect your trading system and tradeonly by its rules, the trades will come. Do not beemotional when trading, leave your emotions at thedoor, and do exactly as the system tells you to do. Ifyour system tells you that you have to trail manuallythe stop loss above every swing high but the tradehas already gone 100 pips in your favor and did notmake any swing high yet, wait. Leave your stop lossat its original place; do not think emotionally, that youhave to secure those 100 pips so you do not losethem. This makes you lose money. Completelydisregard any comments from individuals on forexforums that tell you to buy or sell because they havethe holy grail and they know better than you what is

about to happen.Only trade what your system tells you to trade, donot let yourself be influenced by anyone, no matterhow convincing they sound. If you pay attention tosome fellow that tells you to buy a specific pair youwill lose your clear and unbiased judgment andwithout even knowing you will start to browsethrough the charts looking for trade setups thatsustain that guy’s theory and that have nothing to dowith your trading system. It is your money; wouldn’tyou feel stupid if you would lose them by tradingwhat someone else suggests you to?

Don’t do this Now, after you finally construct your trading systemaccording to all the rules above you must learn howto avoid making mistakes when putting your systemto work.
Price pattern breaksIf your system includes trading price patterns, youmust know that for a pattern to be consideredbroken price must close outside of it. If you have atrading system using price pattern breaks to signalyour entry then you must wait for a candle or bar toclose outside the pattern on the same timeframewhere you spotted the pattern. Do not make themistake to spot a pattern on the 4h chart and thengo the 15 minutes chart and wait for a 15 minutescandle to close outside and call this a break of thepattern. If the pattern resides on the 4h chart, youmust always wait for a 4h candle to close outsidewith momentum, meaning that the candle shouldhave at least half of its body outside the pattern toconsider it a break. Let us see an example:
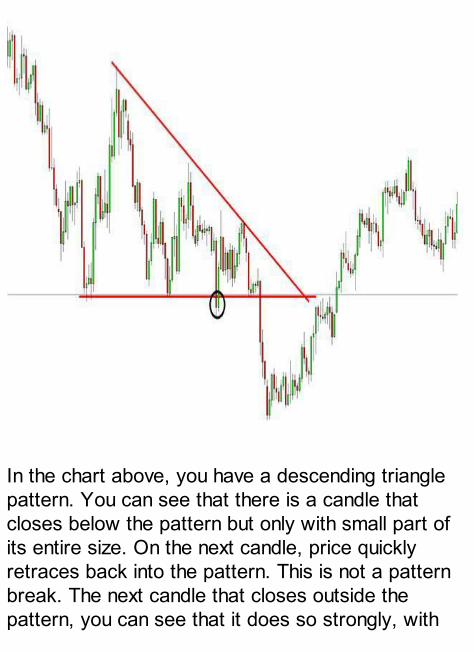
In the chart above, you have a descending trianglepattern. You can see that there is a candle thatcloses below the pattern but only with small part ofits entire size. On the next candle, price quicklyretraces back into the pattern. This is not a patternbreak. The next candle that closes outside thepattern, you can see that it does so strongly, with

momentum; 3 quarters of its length are outside thepattern. This is a price pattern break. If you arelooking for a powerful trading system with pricepatterns and price action trends that can delivermore than 1000 pips per month you can check outmy book Day Trading Forex with Price Patterns

Candlestick confirmationIf your newly developed system uses candlestickpatterns to confirm the trade entry you must alwayswait for that candlestick pattern to complete. Waitfor the last candle of the pattern to close before youenter the trade. If right at the close of the patternthere is some important economic news coming outthey could invalidate your pattern and with it yourentry signal. Remember that candlestick patternswork well because a lot of traders watch them andact on them. If you enter before the patterncompletes and when the last candle finally closesyou see that the pattern is not valid anymore then alot of traders will not trade at that level becausethere is no valid pattern so you will be in the minority.The minority always loses in forex. In addition, youhave to know that candlestick patterns have theirgreatest success rate when found at price extremes.Let me show you what I mean:
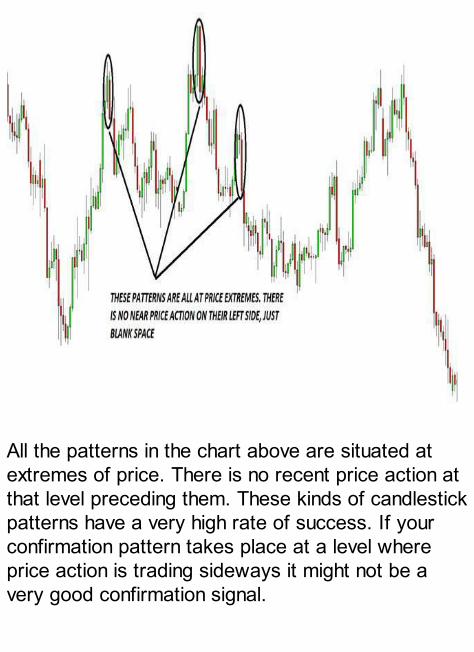
All the patterns in the chart above are situated atextremes of price. There is no recent price action atthat level preceding them. These kinds of candlestickpatterns have a very high rate of success. If yourconfirmation pattern takes place at a level whereprice action is trading sideways it might not be avery good confirmation signal.
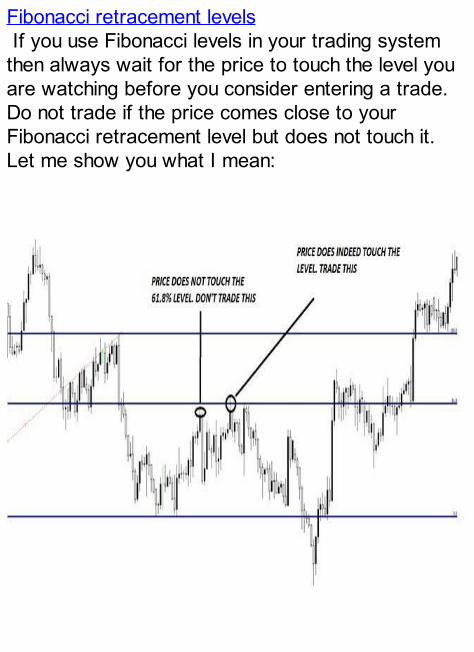
Fibonacci retracement levels If you use Fibonacci levels in your trading systemthen always wait for the price to touch the level youare watching before you consider entering a trade.Do not trade if the price comes close to yourFibonacci retracement level but does not touch it.Let me show you what I mean:

In the first attempt price comes close to theFibonacci level but does not touch it.It even makes a reversal candlestick pattern theresuggesting that price will resume the trend down butsoon after price climbs back to the level this timetouching and piercing it. This is the time to trade.If you had sold on the first attempt, you would havehad your stop loss hit.
Support and resistanceWhen trading with support and resistance levelsmake sure that you draw the most important ones,the pivotal ones where price bounces of them fromeither side. These pivotal support and resistancezones are by far the most important ones theyattract the most attention from the traders out there.Do not beat yourself up with small, meaninglesssupport and resistance zones. They are all over theplace and they will clutter your charts for nothing.Let me show you what a pivotal support orresistance zone looks like:
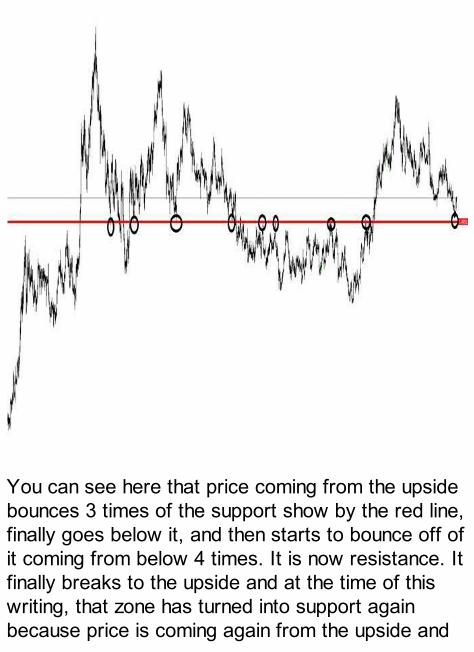
You can see here that price coming from the upsidebounces 3 times of the support show by the red line,finally goes below it, and then starts to bounce off ofit coming from below 4 times. It is now resistance. Itfinally breaks to the upside and at the time of thiswriting, that zone has turned into support againbecause price is coming again from the upside and
bounces off that level.These are very strong support and resistance zonesthat you always have to take into account.
Cutting profits shortThis is a very common mistake made by novicetraders. When a trade goes in your way for 100 pipsdo not close it in fear that price will come back to theentry level and eat all your profits. Respect thetrading system’s rules and let the trade run until ithits your profit target or until it hits you stop losslevel that you manually trailed above or belowswings in the market. You will never make money ifyou keep cutting your profits short because you fearof losing them. How would you feel if after you closethe trade with 100 pips in profit, price goes onfurther and hits your target level at 200 pips inprofit?

Letting losses runThis is also a very common mistake made by novicetraders.When you see that price is going towards your stoploss don’t ever move it further away thinking that it isjust a spike in price and the trade will go your wayeventually. The second you remove that stop lossfrom its initial place decided by the system youconstructed you put yourself under great risk.Accept the small loss and wait patiently for the nexttrade setup. There will be some occasional loses; nosystem is perfect, just because you had a loss doesnot mean that you have to change the systembecause there is something wrong with it. Accept thesmall drawdown and leave the stop loss level in itsplace otherwise, instead of a 20 pips loss, you willquickly find yourself in a position where you have nochoice but to accept a much bigger loss. It does notmatter if you lose one trade, as you have seenearlier, you can be profitable even if you only win33% of your trades with solid management rules.
Revenge tradingIf you lose one trade, keep calm, do not think toyourself that you have to recuperate the loss rightaway. This is the worst thing you could do, to enterthe market randomly and with a bigger order size,not obeying your trading system, thinking that youmust get back the money you lost otherwise youwon’t sleep well through the night. This is calledrevenge trading, and it clouds your judgment so hardthat you could lose all your hard-earned money in asingle day. Close the computer and go about yourbusiness. Tomorrow is another day and you will getthe money back surely if you trade according to yourtrading system.

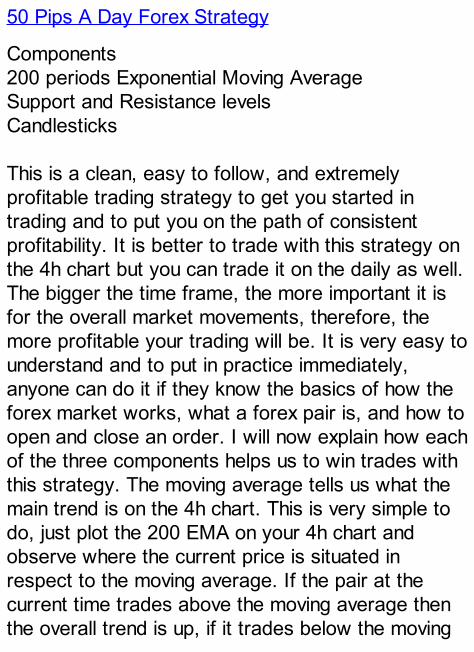
50 Pips A Day Forex Strategy
Components200 periods Exponential Moving AverageSupport and Resistance levelsCandlesticks This is a clean, easy to follow, and extremelyprofitable trading strategy to get you started intrading and to put you on the path of consistentprofitability. It is better to trade with this strategy onthe 4h chart but you can trade it on the daily as well.The bigger the time frame, the more important it isfor the overall market movements, therefore, themore profitable your trading will be. It is very easy tounderstand and to put in practice immediately,anyone can do it if they know the basics of how theforex market works, what a forex pair is, and how toopen and close an order. I will now explain how eachof the three components helps us to win trades withthis strategy. The moving average tells us what themain trend is on the 4h chart. This is very simple todo, just plot the 200 EMA on your 4h chart andobserve where the current price is situated inrespect to the moving average. If the pair at thecurrent time trades above the moving average thenthe overall trend is up, if it trades below the moving
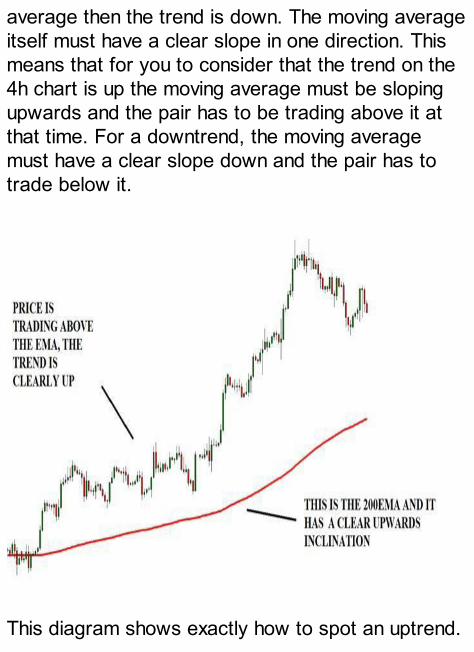
average then the trend is down. The moving averageitself must have a clear slope in one direction. Thismeans that for you to consider that the trend on the4h chart is up the moving average must be slopingupwards and the pair has to be trading above it atthat time. For a downtrend, the moving averagemust have a clear slope down and the pair has totrade below it.
This diagram shows exactly how to spot an uptrend.

After we establish that there is a clear trend we thenmove on to the next level and we will try to find asupport or resistance level. I have told you that themoving average helps us to gauge the trend on apair. If we find a trend, we go on further analyzingthat pair to find a support or a resistance level,where it is most likely that whoever is in charge ofthat pair (the buyers or the sellers), will pick up thepace, and resume the trend. The support/resistancelevel has to be a diagonal one and the trend linedrawn on the chart to construct it has to be slopingagainst the trend. You draw this trend line on yourchart by connecting at least two distinct points in themarket although three points will be better. Here iswhat I mean:
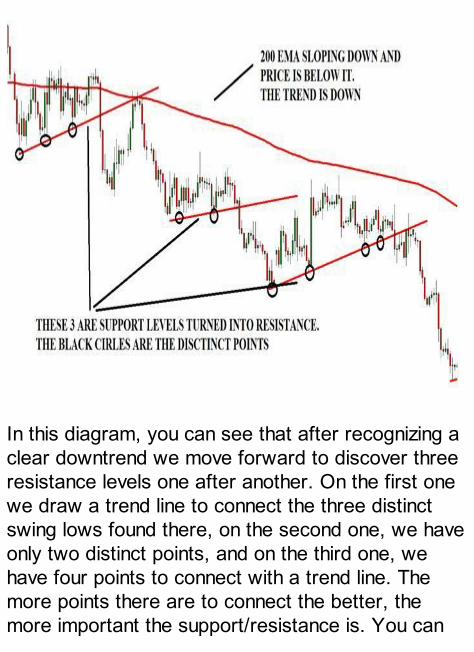
In this diagram, you can see that after recognizing aclear downtrend we move forward to discover threeresistance levels one after another. On the first onewe draw a trend line to connect the three distinctswing lows found there, on the second one, we haveonly two distinct points, and on the third one, wehave four points to connect with a trend line. Themore points there are to connect the better, themore important the support/resistance is. You can

also see that all of these three levels are pointing upagainst the main trend, which is a requirement forthis trading strategy. These three levels at firstserved as support for price action but once theywere broken to the downside, they turned intoresistance levels. Now, about the third component ofthis strategy. This strategy uses candlesticks toenter trades. After finding a clear trend and asupport or resistance zone, you have to wait forprice to go back to that support/resistance level andretest it. This is where the candlesticks come intoplay. Before you enter a trade in the direction of themain trend, there has to be a candlestickconfirmation that the trend is indeed resuming. Youwill be looking for big body candlesticks that close ator near the high or low, which shows that there ismomentum in the market and the dominant side(buyers or sellers) have decided to step in andcontinue the trend. Let me show you the same chartabove again to see what I mean by retest of theresistance level:
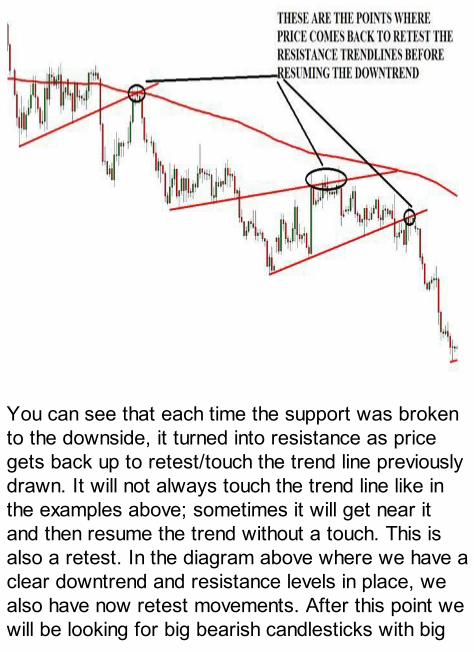
You can see that each time the support was brokento the downside, it turned into resistance as pricegets back up to retest/touch the trend line previouslydrawn. It will not always touch the trend line like inthe examples above; sometimes it will get near itand then resume the trend without a touch. This isalso a retest. In the diagram above where we have aclear downtrend and resistance levels in place, wealso have now retest movements. After this point wewill be looking for big bearish candlesticks with big

bodies and with no or small wick at the close tosignify that the sellers have entered into the marketagain to push the price further down and extend thetrend. Let us look at the same chart again but thistime focusing on what happens after the retest.
This is the first resistance level out of those three.There is a touch of the resistance trend line made bythat big bullish green candle. After this price makesthree very small candles that tell us this level of price
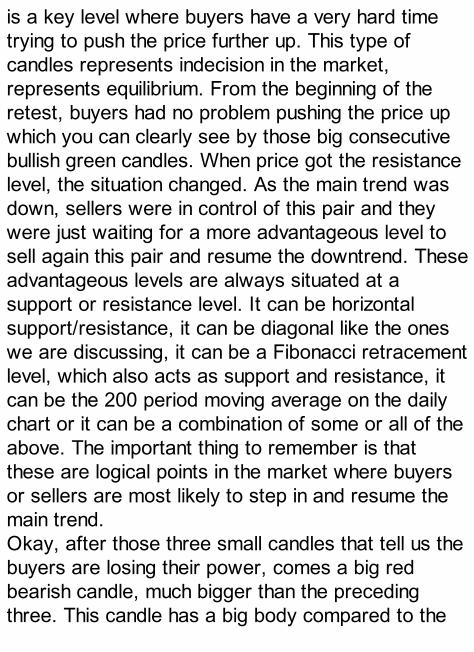
is a key level where buyers have a very hard timetrying to push the price further up. This type ofcandles represents indecision in the market,represents equilibrium. From the beginning of theretest, buyers had no problem pushing the price upwhich you can clearly see by those big consecutivebullish green candles. When price got the resistancelevel, the situation changed. As the main trend wasdown, sellers were in control of this pair and theywere just waiting for a more advantageous level tosell again this pair and resume the downtrend. Theseadvantageous levels are always situated at asupport or resistance level. It can be horizontalsupport/resistance, it can be diagonal like the oneswe are discussing, it can be a Fibonacci retracementlevel, which also acts as support and resistance, itcan be the 200 period moving average on the dailychart or it can be a combination of some or all of theabove. The important thing to remember is thatthese are logical points in the market where buyersor sellers are most likely to step in and resume themain trend.Okay, after those three small candles that tell us thebuyers are losing their power, comes a big redbearish candle, much bigger than the precedingthree. This candle has a big body compared to the
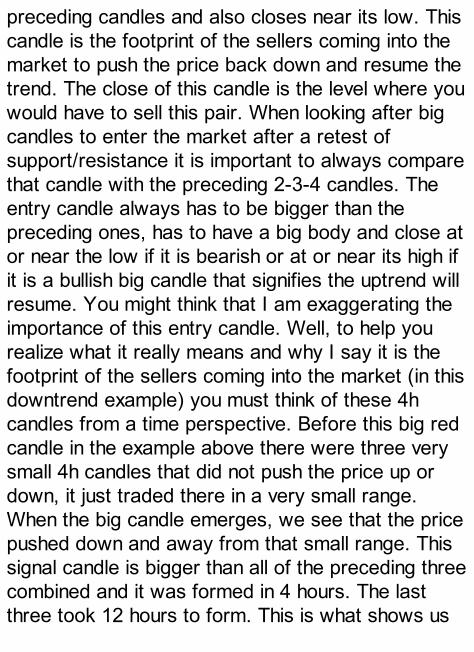
preceding candles and also closes near its low. Thiscandle is the footprint of the sellers coming into themarket to push the price back down and resume thetrend. The close of this candle is the level where youwould have to sell this pair. When looking after bigcandles to enter the market after a retest ofsupport/resistance it is important to always comparethat candle with the preceding 2-3-4 candles. Theentry candle always has to be bigger than thepreceding ones, has to have a big body and close ator near the low if it is bearish or at or near its high ifit is a bullish big candle that signifies the uptrend willresume. You might think that I am exaggerating theimportance of this entry candle. Well, to help yourealize what it really means and why I say it is thefootprint of the sellers coming into the market (in thisdowntrend example) you must think of these 4hcandles from a time perspective. Before this big redcandle in the example above there were three verysmall 4h candles that did not push the price up ordown, it just traded there in a very small range.When the big candle emerges, we see that the pricepushed down and away from that small range. Thissignal candle is bigger than all of the preceding threecombined and it was formed in 4 hours. The lastthree took 12 hours to form. This is what shows us
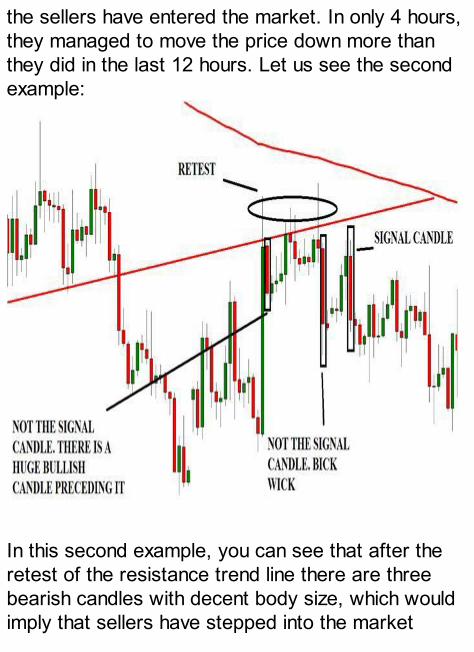
the sellers have entered the market. In only 4 hours,they managed to move the price down more thanthey did in the last 12 hours. Let us see the secondexample:
In this second example, you can see that after theretest of the resistance trend line there are threebearish candles with decent body size, which wouldimply that sellers have stepped into the market

again. However, the first candle of these three ispreceded by a huge bullish green candle. This is notour signal to sell. The second one is bigger than thefirst and also has no big candles preceding it.However, you can see that it does not close at ornear its low, it has a big wick there, price hasretraced from the low of this candle and closedalmost at its middle. This does not give us themomentum we want when entering a trade. Finally,the third candle meets our requirements; therefore,we enter the short trade at the close of this candle.
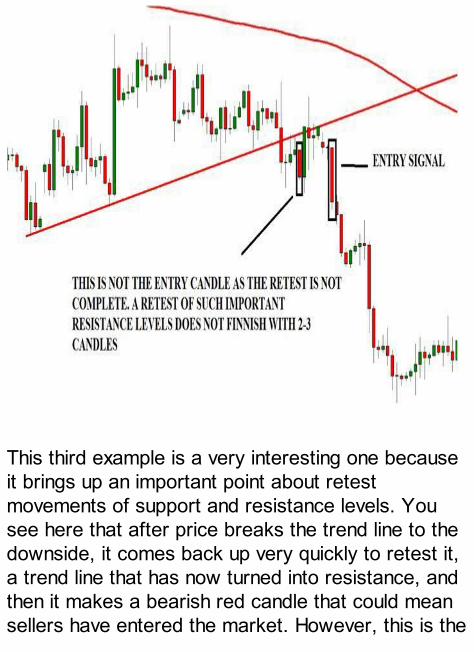
This third example is a very interesting one becauseit brings up an important point about retestmovements of support and resistance levels. Yousee here that after price breaks the trend line to thedownside, it comes back up very quickly to retest it,a trend line that has now turned into resistance, andthen it makes a bearish red candle that could meansellers have entered the market. However, this is the

4h chart, this resistance line holds great significance,it took quite some time to develop, and a lot of 4hcandles, the retest absolutely has to be bigger thantwo 4h candles. This is why you would have todisregard that first red candle as a signal to sellcandle. It comes way too early, the retest has to bebigger two candles. If this would have been the 5minutes or the 15 minutes chart, and the resistancelevel developed in 3 hours or so then yes, the retestcould have been composed of just two candles. Still,this is a very important resistance on the 4h chartthat took days to develop; the retest will more thanlikely be bigger than two candles.After this red candle, we see that there areadditional candles that just stagnate around thatarea completing the retest of the resistance level.Finally, we have a valid signal candle that indeedpushes the price way down.
Stop loss management and take profit levelsNow that you know how and when to enter a tradelet us discuss about where to set your stop losslevels, how to trail them manually, and how todetermine your ideal take profit levels. The initialstop loss level that you set when entering the tradehas to always be set at above or below the levelwhere the retest of the support/resistance ends.After this, when price goes in your favor you trailmanually your stop loss above or below everyswing/turning point/minor support or resistance pricemakes. In addition to this, you will also bedetermining your take profit level before you actuallyenter the trade. This is very important from themoney management perspective because there willbe some rare occasions when after calculating yourtake profit and stop loss level before entering thetrade you will find that the risk you will be taking withthat trade is greater than the potential reward.Otherwise said, you would have to risk losing morepips than you could potentially win with thatparticular trade. The risk-reward ratio in this case isnot a satisfactory one. When you find trades likethis…DO NOT TRADE. Wait for the nextopportunity. Money management makes youprofitable in the long run; always keep this in mind.

Be very disciplined when analyzing charts andentering trades. Always treat trading as a businessand not as a game. Let us see an example of how tomanage the stop loss and take profit levels.
This is that first resistance level we talked about.Before entering the trade at the close of the signalred candle, you predetermine your take profit level inthe following way: join with the trend line two points,
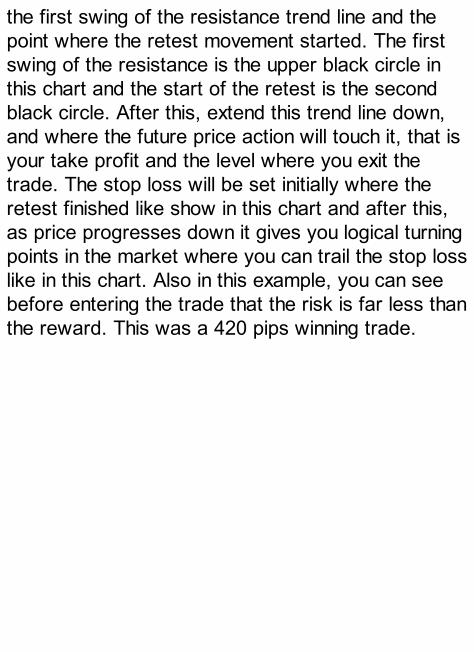
the first swing of the resistance trend line and thepoint where the retest movement started. The firstswing of the resistance is the upper black circle inthis chart and the start of the retest is the secondblack circle. After this, extend this trend line down,and where the future price action will touch it, that isyour take profit and the level where you exit thetrade. The stop loss will be set initially where theretest finished like show in this chart and after this,as price progresses down it gives you logical turningpoints in the market where you can trail the stop losslike in this chart. Also in this example, you can seebefore entering the trade that the risk is far less thanthe reward. This was a 420 pips winning trade.
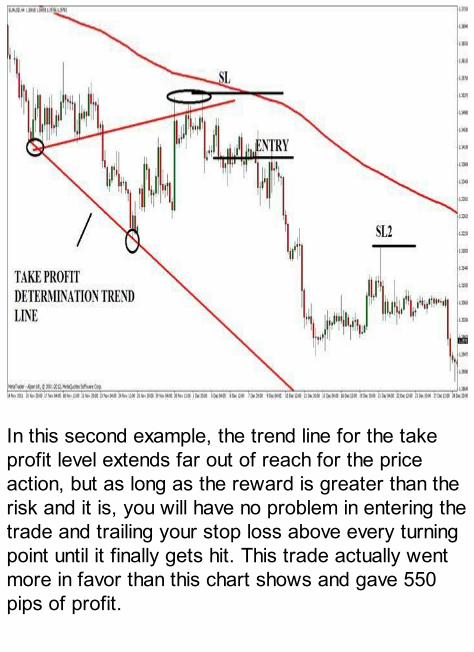
In this second example, the trend line for the takeprofit level extends far out of reach for the priceaction, but as long as the reward is greater than therisk and it is, you will have no problem in entering thetrade and trailing your stop loss above every turningpoint until it finally gets hit. This trade actually wentmore in favor than this chart shows and gave 550pips of profit.

This is the example with that small retest. Beforeentering the trade, you draw the trend line to find outwhere your potential take profit will be and you seethat you would have to exit the trade before youeven enter it which is of course non sense. Inaddition, if that trend line would have been 10 pipslower and you would have the chance to enter thetrade, this was still not a good trade because therisk would have been greater than the 10 pipsreward. Stay out of trades like this one. There will
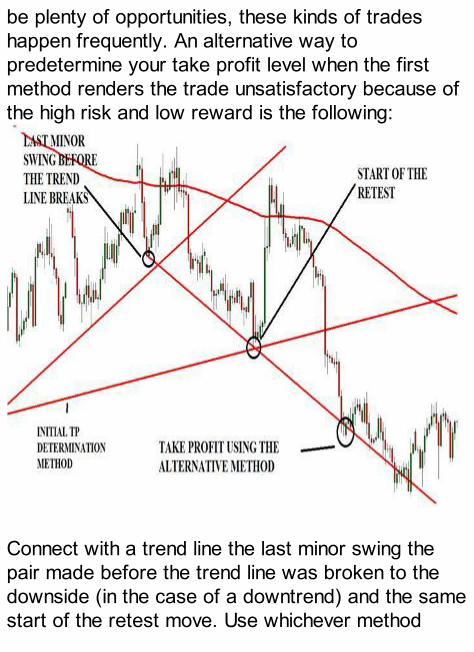
be plenty of opportunities, these kinds of tradeshappen frequently. An alternative way topredetermine your take profit level when the firstmethod renders the trade unsatisfactory because ofthe high risk and low reward is the following:
Connect with a trend line the last minor swing thepair made before the trend line was broken to thedownside (in the case of a downtrend) and the samestart of the retest move. Use whichever method

gives you a better take profit level as long as it is notexaggerated and you think there are extremely lowchances that the market will actually go to that level.If this method also does not help you achieve a goodrisk-reward ratio then ignore the trade completely. A second method that you can use to takeadvantage of the fact that every support becomes aresistance and every resistance becomes a supportlevel after they have been broken it to use the samerules as with the method above, but applying them tohorizontal support and resistance zones this time.However, with the diagonal support and resistancezones you have seen that they are formed byconnecting two or more distinct swings in themarket. With the horizontal levels, often times, youwill not have a second distinct swing that you canuse to draw a horizontal line. Knowing this, you mustleave the candlestick chart and go to the same 4-hours chart, but a bar chart this time, and zoomedout completely. Let me show you an example of this.
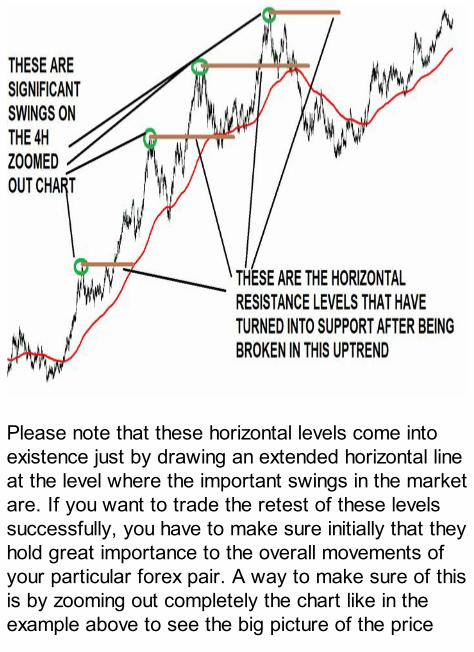
Please note that these horizontal levels come intoexistence just by drawing an extended horizontal lineat the level where the important swings in the marketare. If you want to trade the retest of these levelssuccessfully, you have to make sure initially that theyhold great importance to the overall movements ofyour particular forex pair. A way to make sure of thisis by zooming out completely the chart like in theexample above to see the big picture of the price
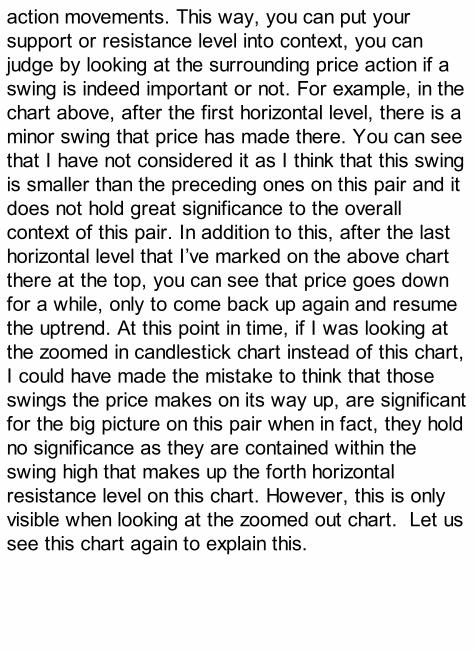
action movements. This way, you can put yoursupport or resistance level into context, you canjudge by looking at the surrounding price action if aswing is indeed important or not. For example, in thechart above, after the first horizontal level, there is aminor swing that price has made there. You can seethat I have not considered it as I think that this swingis smaller than the preceding ones on this pair and itdoes not hold great significance to the overallcontext of this pair. In addition to this, after the lasthorizontal level that I’ve marked on the above chartthere at the top, you can see that price goes downfor a while, only to come back up again and resumethe uptrend. At this point in time, if I was looking atthe zoomed in candlestick chart instead of this chart,I could have made the mistake to think that thoseswings the price makes on its way up, are significantfor the big picture on this pair when in fact, they holdno significance as they are contained within theswing high that makes up the forth horizontalresistance level on this chart. However, this is onlyvisible when looking at the zoomed out chart. Let ussee this chart again to explain this.

After you identify these meaningful horizontal levels,you will have no problem trading a retest of them,exactly like in the method above with the diagonalsupport and resistance areas. Let us see anexample:
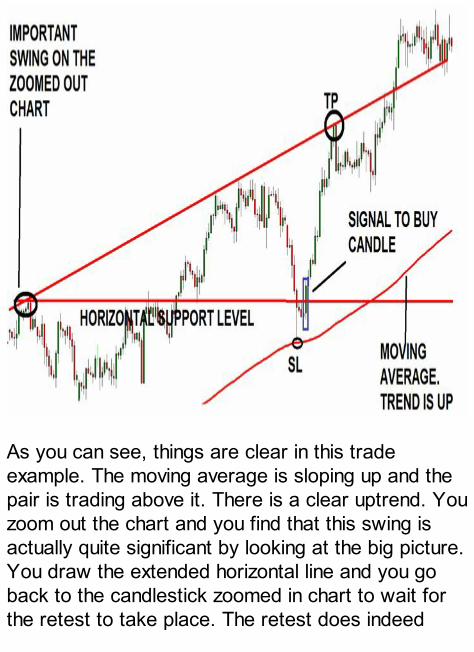
As you can see, things are clear in this tradeexample. The moving average is sloping up and thepair is trading above it. There is a clear uptrend. Youzoom out the chart and you find that this swing isactually quite significant by looking at the big picture.You draw the extended horizontal line and you goback to the candlestick zoomed in chart to wait forthe retest to take place. The retest does indeed

happen right at the horizontal support level and soonenough, you have a confirmation that the buyershave entered into the market again at this level andthey are most likely to push the price upwards andextend the uptrend. The confirmation is representedby that big, green, bullish candle that is also yoursignal candle to enter a buy order. The buy order isopened at the close of the signal candle of course.Trade management (stop loss and take profit) ismade exactly like with the diagonal levels method. This is about it.I hope this helps you in your tradingIn the end I would like to apologize if I sound a littleto rigid in my explanations and if there are anymisspellings. English is not my first language. I amdoing the best I can. If you find that this adds value to your tradingplease consider writing a review of the book onAmazon. It does not have to be long, just a fewwords to state your opinion about the tradingsystem presented in order to help other peoplemake more informed decisions.Please email me afterwards [email protected] and you will receive

the PDF version of this e-book so that you canread it more easily and print the contents onpaper if you want.
50 Pips A Day Forex Strategy
Thank you very much and happy forex trading.
Also, if you are interested in complete forex tradingprice action systems that respect to the letter everysingle piece of information found in this book,therefore making them very solid trading systemsthat have the potential to make thousands of pipsper month, you can have a look at them by followingthe links below:
Trade the Price ActionTrade the Momentum
Follow Price Action TrendsDay Trading Forex with Price Patterns
Day Trading Forex with S&R ZonesForex Range Trading With Price Action
These trading systems are also available in PDFformat if you want to be able to print them and read
them more easily. Here are the links :
Trade the Price ActionTrade the Momentum
Follow Price Action TrendsDay Trading Forex with Price Patterns
Day Trading Forex with S&R ZonesForex Range Trading with Price Action
50 Pips a Day Forex Strategy
In addition, I have combined all of the above tradingsystems into one single PDF book which is available
here :
Forex Trading Systems