,502:315 336,1998july20 1998
TRANSCRIPT

THE ASTROPHYSICAL JOURNAL, 502 :315È336, 1998 July 201998. The American Astronomical Society. All rights reserved. Printed in U.S.A.(
ENVELOPE STRUCTURE ON 700 AU SCALES AND THE MOLECULAR OUTFLOWS OF LOW-MASSYOUNG STELLAR OBJECTS
MICHIEL R. AND EWINE F.HOGERHEIJDE VAN DISHOECK
Sterrewacht Leiden, P.O. Box 9513, 2300 RA, Leiden, The Netherlands
GEOFFREY A. BLAKE
Division of Geological and Planetary Sciences, California Institute of Technology, MS 150È21, Pasadena, CA 91125
AND
HUIB JAN VAN LANGEVELDE
Joint Institute for VLBI in Europe, P.O. Box 2, 7990 AA, Dwingeloo, The NetherlandsReceived 1997 September 11 ; accepted 1998 February 26
ABSTRACTAperture synthesis observations of HCO` J \ 1È0, 13CO 1È0, and C18O 1È0 obtained with the
Owens Valley Millimeter Array are used to probe the small-scale (5A B 700 AU) structure of the molecu-lar envelopes of a well-deÐned sample of nine embedded low-mass young stellar objects in Taurus. Theinterferometer results can be understood in terms of : (1) a core of radius AU surrounding the[1000central star, possibly Ñattened and rotating ; (2) condensations scattered throughout the envelope thatmay be left over from the inhomogeneous structure of the original cloud core or that may have grownduring collapse ; and (3) material within the outÑow or along the walls of the outÑow cavity. Masses ofthe central cores are 0.001È0.1 and agree well with dust continuum measurements. Averaged overM
_,
the central 20A (3000 AU) region, an HCO` abundance of 4] 10~8 is inferred, with a spread of a factorof 3 between the di†erent sources. Reanalysis of previously presented single-dish data yields an HCO`abundance of (5.0^ 1.7)] 10~9, which may indicate an average increase by a factor of a few on thesmaller scales sampled by the interferometer. Part of this apparent abundance variation could beexplained by contributions from extended cloud emission to the single-dish C18O lines, and uncertaintiesin the assumed excitation temperatures and opacities. The properties of the molecular envelopes andoutÑows are further investigated through single-dish observations of 12CO J \ 6È5, 4È3, and 3È2, 13CO6È5 and 3È2, and C18O 3È2 and 2È1, obtained with the James Clerk Maxwell and IRAM 30 m tele-scopes, along with the Caltech Submillimeter Observatory. Ratios of the mid-J CO lines are used toestimate the excitation temperature, with values of 25È80 K derived for the gas near line center. TheoutÑow wings show a similar range, although is enhanced by a factor of 2È3 in at least two sources.TexIn contrast to the well-studied L1551 IRS 5 outÑow, which extends over 10@ (0.4 pc), seven of theremaining eight sources are found to drive 12CO 3È2 outÑows over ¹1@ (0.04 pc) ; only L1527 IRS has awell-developed outÑow of some 3@ (0.12 pc). Estimates are obtained for the outÑow kinetic luminosity,
and the Ñow momentum rate, applying corrections for line opacity and source inclination. TheL kin, FCO,Ñow force correlates with the envelope mass and with the 2.7 mm Ñux of the circumstellar disk.FCOOnly a weak correlation is seen with while none is found with the relative age of the object asL bol,measured by These trends support the hypothesis that outÑows are driven by/ Tmb(HCO` 3È2)dV /L bol.accretion through a disk, with a global mass infall rate determined by the mass and density of theenvelope. The association of compact HCO` emission with the walls of the outÑow cavities indicatesthat outÑows in turn inÑuence the appearance of the envelopes. It is not yet clear, however, whether theyare actively involved in sweeping up envelope material, or merely provide a low-opacity pathway forheating radiation to reach into the envelope.Subject headings : ISM: molecules È radio lines : stars È stars : formation È
stars : low mass, brown dwarfs È stars : preÈmain-sequence
1. INTRODUCTION
In the earliest stages of their formation, low-mass youngstellar objects (YSOs) are embedded in an envelope of gasand dust several thousand AU in radius, and are often sur-rounded by a \100 AU disk (see et al. for anShu 1993overview of star formation). Theoretical models of cloudcore collapse predict a density structure characterized by aradial power law (e.g., Shu, & CassenTerebey, 1984 ; Galli& Shu Fiedler & Mouschovias1993 ; 1992, 1993 ; Boss
The envelopes may show an inwardly increasing1993).degree of Ñattening, as well as rotation or infall. ManyYSOs drive a bipolar outÑow, which may play a pivotal
role in their evolution. OutÑows are thought to be poweredby the interaction of a magnetic Ðeld with a rotating accre-tion disk (see & Ruden andKo� nigl 1993 ; Bachiller 1996),carry away angular momentum that would otherwiseprevent accretion. By sweeping up envelope material, theymay be involved in reversing infall and clearing theenvelope around the YSO & Cabrit & Shu(Raga 1993 ; Li
Bence, & Richer Cabrit & Bertout1996 ; Padman, 1997).& Andre� et al.(1990, 1992), Cabrit (1991), Bontemps (1996),
and et al. have investigated the relationSaraceno (1996)between outÑow kinetic luminosity, bolometric luminosity,and envelope continuum Ñux. They conclude that stronger
315

316 HOGERHEIJDE ET AL. Vol. 502
outÑows are associated with sources that have higher lumi-nosities and more massive envelopes.
Several important questions are raised by these Ðndings.For example, how does the structure of the envelope on1000 AU scales compare to theoretical predictions? Towhat extent do the outÑows impact the structure andappearance of the envelopes? What is the relation betweenthe outÑow and source properties like stellar mass, evolu-tionary state, luminosity, envelope mass, and the presenceof a circumstellar disk? In this paper, the small-scale(5A B 700 AU) structure of the molecular envelopes arounda sample of nine embedded, low-mass YSOs in Taurus
is investigated. These objects are probably in the(Table 1)stage at which the outÑow is terminating infall and clearingaway the envelopes. They were selected on the basis of theirsingle-dish HCO` 3È2 emission from the IRAS Ñux- andcolor-limited sample of YSOs in Taurus-Auriga (d \ 140pc) deÐned by et al. The bolometric lumi-Tamura (1991).nosities of the sources range between 0.66 and 25.5 withL
_,
corresponding upper limits to their stellar mass of 0.15È2.7assuming that all luminosity is stellar and that theM
_,
objects are located on the birth line &(Stahler 1988 ; PallaStahler 1993).
In a previous paper et al. hereafter(Hogerheijde 1997a,these sources were studied through interferometryPaper I)
of the 3.4 and 2.7 mm continuum emission, 1.1 mm single-dish continuum observations from the literature, andHCO` and H13CO`J \ 1È0, 3È2, and 4È3 single-dish lineobservations. We found that at least two-thirds of thesources are surrounded by compact (\3A) disks with 2.7mm Ñuxes of 6È100 mJy and masses of 0.005È0.07 M
_,
assuming optically thin emission. Between 30% and 75% ofthe 1.1 mm single-dish Ñux observed in a 19A beam could beattributed to these disks, the remainder tracing envelopes of0.001È0.26 The HCO` emission was well correlatedM
_.
with the 1.1 mm envelope Ñux, and both could be describedsimultaneously with the simple inside-out collapse model of
or closely related power-law models with slopesShu (1977)between 1 and 3. A beam-averaged abundanceHCO`/H2of (1.2 ^ 0.4)] 10~8 was inferred from optically thinsingle-dish H13CO` 1È0 and C18O 1È0 lines et al.(Mizuno
et al. not including corrections for the1994 ; Hayashi 1994),
beam efficiency of the Nobeyama 45 m telescope. In thepresent paper, we use beam efficiencies of 0.8 at H13CO`1È0 and 0.4 at C18O 1È0 (cf. et al.Kitamura 1990 ; Hayashiet al. resulting in a lower value for the single-dish1994),HCO` abundance of (5.0 ^ 1.7)] 10~9. showedPaper Ithat HCO`, especially in its 3È2 and 4È3 lines, is an excel-lent tracer of the envelopes. This led us to propose the ratio
as an evolutionary tracer for the/ Tmb(HCO` 3È2)dV /L bolembedded phase, as it corresponds to the current ratio ofenvelope mass to stellar mass.
Over the past decade, millimeter interferometry hasdeveloped into a powerful tool for the study of star forma-tion through the increase in the sensitivity and number ofelements of the various arrays, making possible a detailedinvestigation of a reasonably extended sample of YSOs viatheir millimeter line emission. Observations of our objectsat the Owens Valley Millimeter Array have resulted in high-quality HCO` 1È0, 13CO 1È0, and C18O 1È0 data with3AÈ5A resolution, tracing the inner few thousand AU of theprotostellar envelopes. Previous interferometric studiestoward some of the sources have been undertaken in iso-topic lines of CO by et al. Vogel, &Sargent (1988), Terebey,Myers et al. et al.(1989), Terebey (1990), Chandler (1996),
et al. Evans, & WangMomose (1996), Zhou, (1996), Tamuraet al. and Ohashi et al. in HCO` and(1996), (1997a, 1997b) ;H13CO` by Langevelde, van Dis-Rudolph (1992), vanhoeck, & Blake and et al. and in CS by(1994a), Saito (1996) ;
et al. The study presented here is one of theOhashi (1996b).Ðrst combining interferometry data of a well-deÐned sampleof YSOs with 10AÈ30A resolution single-dish observations of12CO 6È5, 4È3, and 3È2, 13CO 6È5 and 3È2, and C18O 3È2and 2È1, thereby covering a large range of physical condi-tions and spatial scales.
The widespread detection of 12CO and 13CO 6È5 towardour sample, which traces gas of D80 K, led et al.Spaans
to propose a model in which scattered ultraviolet(1995)radiation from the star-disk boundary layer is responsiblefor heating the surroundings of the outÑow cavity. 12CO3È2 maps of the outÑows are used here to investigate theirrelationship to the structure seen in the interferometermaps. All our sources are associated with outÑow emission(cf. Loren, & Plambeck & SnellSnell, 1980 ; Edwards 1982 ;
TABLE 1
SOURCE SAMPLE
Visible/ L bol M*a Mdiskb MenvcSource IRAS PSC a (1950.0) d (1950.0) Embedded (L
_) (M
_) (M
_) (M
_)
L1489 IRS . . . . . . . . 04016]2610 04 01 40.5 ]26 10 48 Embedded 3.70 0.4 ¹0.004 0.016È0.025T Tau . . . . . . . . . . . . . 04190]1924 04 19 04.1 ]19 25 06 Visibled 25.50e 2.7e 0.023 0.029Haro 6-10 . . . . . . . . 04263]2426 04 26 21.9 ]24 26 29 Visibled 6.98 0.9 0.010 \0.004L1551 IRS 5 . . . . . . 04287]1801 04 28 40.2 ]18 01 42 Embedded 21.90 2.6 0.073 0.26L1535 IRS . . . . . . . . 04325]2402 04 32 33.4 ]24 02 13 Embedded 0.70 0.15 ¹0.005 \0.010TMR 1 . . . . . . . . . . . . 04361]2547 04 36 09.7 ]25 47 29 Embedded 2.90 0.3 0.009 0.007TMC 1A . . . . . . . . . . 04365]2535 04 36 31.1 ]25 35 54 Embedded 2.20 0.3 0.020 0.018L1527 IRS . . . . . . . . 04368]2557 04 36 49.6 ]25 57 21 Embedded 1.30 0.2 0.017 0.031TMC 1 . . . . . . . . . . . . 04381]2540 04 38 08.4 ]25 40 52 Embedded 0.66 0.15 ¹0.005 0.005È0.016
NOTE.ÈUnits of right ascension are hours, minutes, and seconds, and units of declination are degrees, arcminutes, and arcseconds.a Maximum mass of central object, assuming that all luminosity is stellar and that the object is on the birth line.b Mass of circumstellar disk inferred from 3.4 and 2.7 mm interferometer observations, assuming an average dust temperature of 30
K and optically thin radiation (Paper I).c Envelope mass within a 19A beam, assuming an average dust temperature of 30 K (Paper I).d With embedded companion.e Sum of T Tau N and S.REFERENCES.ÈFor T Tau, Emerson, & Beichman for & Hartmann for positions,L bol , Cohen, 1989 ; L bol, Kenyon 1995 ; M
*, Mdisk ,and Menv, Paper I.

No. 1, 1998 ENVELOPE STRUCTURE AND OUTFLOWS OF LOW-MASS YSOs 317
& Langer et al.Frerking 1982 ; Terebey 1989 ; Moriarty-et al. but only a few had been mappedSchieven 1992),
previously with a resolution of 10AÈ15A, comparable to theinterferometer maps (T Tau by Harris, & RussellSchuster,
L1551 IRS 5 by & Snell1997 ; Moriarty-Schieven 1988 ;TMC 1A and TMC 1 by et al. L1527 IRSChandler 1996 ;by et al.MacLeod 1994).
In this paper, the structure of the molecular envelopes onsmall scales (700 AU) around low-mass YSOs is studiedthrough interferometric observations of HCO`, 13CO, andC18O, combined with high-resolution single-dish data forthese species. In particular, the inÑuence of the bipolaroutÑow on this structure will be investigated. OutÑowproperties will be derived and compared to intrinsic sourcecharacteristics like envelope mass, luminosity, and disk con-tinuum Ñux. The aim of this paper is to arrive at conclusionsabout the envelope structure of our sample of YSOs as awhole, which sometimes requires the use of simplifyingassumptions. The outline of the paper is as follows. In ° 2the details of the observations are presented. The results ofthe millimeter interferometry are discussed in where° 3,estimates are inferred for the mass of the probed materialand the HCO` abundance, and compared to single-dishresults from In the single-dish results are pre-Paper I. ° 4sented. Constraints are derived for the molecular excitation
and the properties of the outÑows In the(° 4.1) (° 4.2). ° 4.3relation between outÑow strength, envelope mass, and diskÑux is examined. The envelope structure of the individualsources is discussed in detail in and the main conclu-° 5,sions are summarized in ° 6.
2. OBSERVATIONS
The sources of our sample are listed in an over-Table 1 ;view of the data presented in this paper is given in Table 2.The following subsections discuss the details of the obser-vations.
2.1. Millimeter Interferometer ObservationsObservations of HCO` 1È0 (89.188523 GHz), 13CO 1È0
(110.201370 GHz), and C18O 1È0 (109.782182 GHz) wereobtained with the Owens Valley Radio Observatory(OVRO) Millimeter between 1992 and 1997, simul-Array1taneously with the 3.4 and 2.7 mm continuum emissionpresented in During the 89 GHz observations, thePaper I.array consisted of Ðve antennas ; the 110 GHz observationswere made with a six element array. Data taken in thelow-resolution and equatorial conÐgurations were com-bined, resulting in a u-v coverage with spacing between 4and 40 kj at 89 GHz and between 4 and 80 kj at 110 GHz.This corresponds to naturally weighted, synthesized beamsof 5A and 3A FWHM, respectively. The observations of TTau were made in Ðve di†erent array conÐgurations, andhave been presented by Langevelde et al. Spec-van (1994a).tral line data were recorded in two 64 channel bands withrespective widths of 2 and 8 MHz, resulting in velocityresolutions of 0.11 and 0.42 km s~1 at 89 GHz, and 0.09 and0.34 km s~1 at 110 GHz. The observations of T Tau in13CO 1È0 were obtained with a lower resolution of 0.68 kms~1. Visibility data were calibrated using the MMApackage, developed speciÐcally for OVRO et al.(Scoville
The quasars PKS 0333]321 and 0528]134 served1993).
1 The Owens Valley Millimeter Array is operated by the CaliforniaInstitute of Technology under funding from the U.S. National ScienceFoundation (AST96-13717).
as phase calibrators (0420[014 for the observations of TTau) ; the amplitudes were calibrated on 3C 454.3 and 3C273, whose Ñuxes at the time were determined from observ-ations of the planets. Calibration of the correlator pass-bands used noise integrations and observations of 3C 454.3and 3C 273. The quasar 0528]134 cannot be used for pass-band calibration of HCO` observations of sources in theTaurus region because of strong Galactic HCO` absorp-tion at km s~1, close to the systemic velocity ofVLSR \]9Taurus et al. & Liszt No(Hogerheijde 1995 ; Lucas 1996).such lines are present toward 3C 273 or 3C 454.3.
The interferometer data were edited in the usual mannerby Ñagging data points with clearly deviating amplitudesand phases. Editing was especially necessary for daytimeobservations at 110 GHz, when the phase stability of theatmosphere can be low. The data were cleaned usingnatural weighting and, for some of the 13CO and C18Odata, a 4A FWHM convolving beam to suppress the noise ;this corresponds to a 50% u-v taper at 45 kj. The resultingbeam sizes are typically D5A ; the rms noise levels are 0.05È0.1 Jy beam~1 per 125 kHz channel. Reduction andanalysis of the visibility data were carried out within theMIRIAD software package.
2.2. Single-Dish ObservationsSingle-dish observations of low- and mid-J lines of 12CO,
13CO, and C18O were obtained between 1994 Decemberand 1997 October with the James Clerk Maxwell Telescope(JCMT), the Caltech Submillimeter Observatory2 (CSO)3and the IRAM 30 m telescope (see The single-dishTable 2).observations were reduced and analyzed with the CLASSsoftware package.
Observations of C18O 2È1 (219.56040 GHz) wereobtained with the JCMT in 1994 December and with theIRAM 30 m telescope in 1995 May, in beams of 23A and 12A,respectively, and with velocity resolutions of 0.21 and 0.13km s~1. The local oscillator of the JCMT 230 GHz receiverhas no phase-lock loop, resulting in a minimum e†ectiveline width of D0.5È1.0 km s~1. The observations weremade using a position switch between 15@ and 30@ in rightascension, ensuring emission-free o†set positions. Pointingaccuracy is estimated to be D5A. Spectra were converted tothe main-beam antenna temperature scale using gmb \ 0.69for the JCMT and for the IRAM 30 m spectra.gmb \ 0.47Typical rms noise levels are 0.1È0.3 K.
Using the JCMT, observations of 13CO (330.58801 GHz)3È2, C18O 3È2 (329.33057 GHz), and 12CO 4È3 (461.04077GHz) were obtained in 1994 December. The FWHM beamsize of the JCMT at these frequencies is 14A (330 GHz) and11A (460 GHz). Data were acquired in a position-switchedmode with a switch of 15@È30@, similar to that for C18O 2È1.Pointing was checked regularly, and the residual positionaluncertainty is less than 5A. The spectra were obtained withthe Digital Autocorrelation Spectrometer (DAS) back end,with a typical resolution of 0.1È0.2 km s~1. As for the 230GHz observations, the absence of a phase-lock loop in the460 GHz receiver results in an e†ective line width of 0.5È1.0
2 The James Clerk Maxwell Telescope is operated by the JointAstronomy Centre, on behalf of the Particle Physics and AstronomyResearch Council of the United Kingdom, the Netherlands Organizationfor ScientiÐc Research, and the National Research Council of Canada.
3 The Caltech Submillimeter Observatory is operated by the CaliforniaInstitute of Technology under funding from the U.S. National ScienceFoundation (AST 93-13929).

318 HOGERHEIJDE ET AL. Vol. 502
TABLE 2
OVERVIEW OF OBSERVATIONS
Date Instrument Molecular Transition Sources
1992 Apr, 1993 Jul . . . . . . . . . . . . OVRO HCO` 1È0 T Taua1993 Oct, 1994 FebÈApr . . . . . . OVRO HCO` 1È0 Full sample, except T Tau1993 Jan, Jun . . . . . . . . . . . . . . . . . . OVRO 13CO/C18O 1È0 T Tau1995 FebÈMay . . . . . . . . . . . . . . . . . OVRO 13CO/C18O 1È0 Full sample, except L1489 IRS, T Tau, TMC 1A1996 Oct, Nov . . . . . . . . . . . . . . . . . OVRO 13CO/C18O 1È0 L1489 IRS, L1551 IRS 5, L1535 IRS, TMC 1A1997 Feb . . . . . . . . . . . . . . . . . . . . . . . OVRO 13CO/C18O 1È0 L1489 IRS, TMC 1A1994 Dec . . . . . . . . . . . . . . . . . . . . . . . CSO 12CO,13CO 6È5 Full sample1994 Dec . . . . . . . . . . . . . . . . . . . . . . . JCMT 12CO 4È3 ; 13CO, C18O 3È2 Full sample1995 May . . . . . . . . . . . . . . . . . . . . . . . IRAM 30 m C18O 2È1 Full sample1995 Aug, Oct . . . . . . . . . . . . . . . . . JCMT 12CO 3È2 Full sample, except T Tau, L1551 IRS 5, L1527 IRS1997 Oct . . . . . . . . . . . . . . . . . . . . . . . . JCMT 13CO 3È2 L1489 IRS, TMR 1, TMC 1A, L1527 IRS
a Previously presented by Langevelde et al.van 1994a.
km s~1 at this frequency. The spectra were converted to themain-beam antenna temperature scale using gmb \ 0.58(330 GHz) and 0.48 (460 GHz), obtained from measure-ments of Jupiter and Mars by the JCMT sta†. Typical rmsnoise levels were 0.1 K at 330 GHz and 0.4 K at 460 GHz.Higher signal-to-noise ratio observations of 13CO 3È2 wereobtained on 1997 October 30 toward four sources, using theJCMT and a similar observational setup.
Maps covering 2@] 2@ in 12CO 3È2 (345.79599 GHz) ofL1489 IRS, Haro 6-10, L1535 IRS, TMR 1, TMC 1A, andTMC 1 were made with the JCMT in the ““ on-the-Ñy ÏÏmapping mode in 1995 August and October. In this mode,the telescope is scanned constantly in one direction, takingshort integrations of typically 5 s every 3A. Only one inte-gration at an o† position (typically 30@ away) is used tocalibrate a complete row. The adopted o† positions werechecked for the presence of emission ; in a few cases emissionappeared to be present, and the maps were corrected with ahigh signal-to-noise ratio spectrum obtained with a largerposition switch. The total map is built up of the requirednumber of rows, separated by half a beam (6A), resulting infully sampled maps. Multiple maps are stacked to arrive atthe Ðnal noise level. Pointing was checked regularly duringthe observations ; the positional accuracy of the maps wasestimated to be better than 5A. The Ðnal data have a typicalmain-beam rms noise level of D0.25 K per point in 1 kms~1 wide channels, using gmb \ 0.58.
It is found (see that the observed outÑows are less° 4)than 1@ in extent. To ensure that no outÑow emission wasmissed by the 2@] 2@ maps, 6@ long strips at the approximateposition angle of the outÑows were observed on-the-Ñy in12CO 3È2. For comparison, a similar strip has beenobserved toward L1527 IRS, for which outÑow emission in12CO 3È2 over 6@ was observed by et al.MacLeod (1994).For completeness, the 12CO 3È2 data presented by theseauthors have been taken from the JCMT data archive andare analyzed here alongside our own data. A 1@] 1@ map ofT Tau in 12CO 3È2, obtained with the CSO in 1989 Decem-ber with a beam efficiency of 0.56 and a beam size of 30A, isalso reproduced here for completeness.
In 1994 December, observations of 12CO (691.471978GHz) and 13CO 6È5 (661.067375 GHz) were obtainedtoward all sources with the CSO under excellent weatherconditions (typical system temperatures of 1500 K at 690GHz). The spectra were obtained with a position switch of10@ and recorded with the facility 50 MHz and 500 MHzbandwidth Acousto-Optical Spectrometers (AOSs). Point-ing was checked regularly, and found to vary by up to
5AÈ10A. An additional source of positional error was thecorrection for the atmospheric di†raction, which is compa-rable to the FWHM beam size at these frequencies (D10A).It is estimated that the pointing is no better than D10A. Thespectra were converted to the main-beam antenna scaleusing obtained from measurements of Mars,gmb \ 0.35,Saturn, and the Moon (J. Keene 1995, privatecommunication). The resulting rms noise level was 0.4 K in0.2 km s~1 wide channels (AOS 50 MHz, binned), after atypical integration time of only 5 minutes. Toward T Tau, acombined setting of 13CO and C18O 6È5 (658.553325 GHz)was also observed. However, technical difficulties preventedmeasurement of the sideband ratio, leaving the calibrationhighly uncertain because of the proximity of a telluric O3Q-branch.
3. INTERFEROMETER OBSERVATIONS : MOLECULAR MASS
AND HCO` ABUNDANCE
Compact emission in HCO`, 13CO, and C18O 1È0 isdetected in the OVRO beam toward all sources, as is shownin the integrated intensity images of The emissionFigure 1.is resolved, with the highest Ñuxes recovered on baselines\10 kj. Image reconstruction in HCO` and 13CO is com-plicated by the missing zero-spacing Ñux, especially towardT Tau and L1551 IRS 5. shows the spectraFigure 2obtained in the D5A FWHM synthesized beams toward thesource positions. For T Tau, the HCO` 3È2 spectrum from
et al. is also presented. The details ofHogerheijde (1997b)the spatial and kinematic structure of the aperture synthesisresults of the individual sources can most easily be appre-ciated in conjunction with the observations of the outÑows,the discussion of which is postponed until Here, we° 5.1.will derive general characteristics of the emission, such asthe molecular mass, the HCO` abundance on the probedscales, and the fraction of recovered Ñux.
The velocity-integrated line Ñuxes are listed in Table 3,averaged over areas of 5A ] 5A and 20A ] 20A, correspond-ing to the synthesized beam and to the typical single-dishbeam of the HCO` observations of and the COPaper Iobservations presented here, respectively. Only pixels with asignal of º3 p are included in the average, and the Ñuxeshave been transformed to brightness temperatures C18OT
b.
emission is undetected at the obtained noise level towardHaro 6-10 and L1527 IRS, and toward TMC 1A over the20A ] 20A area. Over the 5A ] 5A area, HCO` is undetectedtoward Haro 6-10 and toward L1527 IRS, where this regioncoincides with the resolved-out center of the cross-shapedemission seen in (see also Assuming anFigure 1 ° 5.1.8).

No. 1, 1998 ENVELOPE STRUCTURE AND OUTFLOWS OF LOW-MASS YSOs 319
FIG. 1.ÈIntegrated HCO` (top), 13CO (middle), and C18O (bottom) 1È0 emission observed with the OVRO millimeter array. Contours are drawn atintervals of 3 p B 0.06È0.12 Jy beam~1. The naturally weighted, synthesized beams of FWHM D5A are shown in the lower left corner of each panel. TheOVRO primary beam is indicated by the dashed circle.
abundance ratio of 8 for [13CO]:[C18O], the 13CO linesare found to be at most moderately optically thick, withvelocity-averaged opacities of the C18O lines areq6 [ 6 ;always optically thin. Estimates of the opacity of the HCO`lines are taken from the single-dish HCO` and H13CO`1È0 data of and et al. In contrast toPaper I Mizuno (1994).
a beam efficiency of 0.8 is used here for thePaper I,H13CO` Nobeyama data (cf. et al.Kitamura 1990),resulting in opacities increased by a factor of 1.25 comparedto Table 6 of No H13CO` data are available forPaper I.
four sources, and the median value of q\ 15 is used forthese. This opacity correction is only approximate, since thesingle-dish values can di†er signiÐcantly from the opacity ofthe material traced in the interferometer. Aperture-synthesisH13CO` observations are required to place Ðrmer limits onthe opacity.
Molecular masses can be estimated from the opticallythin C18O images, or from the 13CO data, taking intoaccount the allowed range. Assuming an excitation tem-q6perature the average column density is given in cgsTex,

320 HOGERHEIJDE ET AL. Vol. 502
FIG. 2.ÈSpectra of HCO`, 13CO, and C18O 1È0 emission observed with OVRO in a 5A ] 5A region around the continuum position. For T Tau, theHCO` 3È2 spectrum observed by et al. is also shown. The intensity scale has been converted to brightness temperature ; some spectraHogerheijde (1997a)are scaled by the indicated factors for clarity.
units by
N1 \ 105]3k2
4hn3k2l2 expA hlJ
l2kTex
B
]Tex] hl/6k(J
l] 1)
e~hl@kTex
PTb
A q1 [ e~q
BdV (1)
et al. where dV is the integrated bright-(Scoville 1986), / Tbness temperature in K km s~1 of the transition withJ
uÈJ
lfrequency l, and k is the permanent dipole (0.112 D forC18O and 13CO, and 3.91 D for HCO` ; et al.Millar 1991).The single-dish HCO` and H13CO` data of andPaper Ithe C18O data presented here indicate excitation tem-peratures of 20È80 K for HCO` and C18O, as compared toescape probability calculations. A number of observationaluncertainties exist in the derivation of the excitation tem-perature of individual sources, and the material traced inthe OVRO beam may have a di†erent excitation. Adopting
K as a Ðducial average value, reducesTex\ 40 equation (1)to in cm~2 forN1 \ 2.13 ] 1015 / T
b[q/1 [ exp ([q)]dV
13CO and C18O, and to N1 \ 2.59] 1012 / Tb[q/1 [ exp
([q)]dV for HCO`. Using a mean molecular weight ofand the standard abundance ratios of2.4mH,
[12CO]:[13CO]\ 65 :1 (cf. & PenziasLanger 1990),[12CO]:[18CO]\ 500 :1, and [12CO]:[H2]\ 1 :104,the molecular mass is given by M/M
_\ 2.3] 10~3
(5A ] 5A) or/ Tb[q/1[ exp ([q)]dV 3.8] 10~2 / T
b[q/1 [
exp ([q)]dV (20A ] 20A) for C18O. For 13CO, these factorsare divided by the abundance ratio of 8. The derived masses
are listed in with an uncertainty of a factor of D2Table 3,due to the spread in They agree well with other esti-Tex.mates (see below and ° 5).
From the opacity-corrected column densities, the HCO`abundance is inferred and listed in The uncertaintyTable 8.in largely drops out of the abundance, provided thatTexC18O and HCO` have similar excitation temperatures. Anaverage abundance with respect to of 4] 10~8 is foundH2over the 5A ] 5A and 20A ] 20A regions, with a spread of afactor of 3 between the di†erent sources. Compared to the15AÈ19A single-dish value of (5.0 ^ 1.7)] 10~9 from Paper
including the di†erent beam efficiencies used here (seeI, ° 1),this value is larger on average by a factor of 8, and by0.64È46 for individual sources. This may indicate that theHCO` abundance is increased by factors of a few on thesmall scales sampled by the interferometer. Part of thisincrease can be explained by the assumption of equal excita-tion temperatures for C18O and HCO`, as well as by con-tributions from extended C18O emission to the single-dishlines. The interferometer data as well as the H13CO` single-dish data are likely to exclusively trace the YSO envelopes.Because of the approximate nature of the opacity correctionof the HCO` Ñuxes, interferometer observations ofH13CO` are required to Ðrmly constrain the abundance.
Single-dish and interferometer observations can be fullyintegrated by adding zero-spacing Ñuxes to the visibilitydata (see, e.g., & Welch Kuiper, &Wilner 1994 ; Velusamy,Langer Evans, & Wang for recent appli-1995 ; Zhou, 1996cations of this technique to YSO observations). However,

No. 1, 1998 ENVELOPE STRUCTURE AND OUTFLOWS OF LOW-MASS YSOs 321
TABLE 3
OVRO INTEGRATED INTENSITIES, MOLECULAR MASSES, AND HCO` ABUNDANCES
/ TbdV
13CO C18O HCO` MmolbSOURCE (K km s~1) (K km s~1) (K km s~1) q6 (13CO) q6 (HCO`)a (10~3 M_
) X(HCO`)
Average over 5A ] 5A area
L1489 IRS . . . . . . . . 12.9^ 0.8 2.7 ^ 0.5 20.7 ^ 0.7 1.4 ^ 0.8 15 5.8^ 1.1 (2.8^ 0.6)] 10~8T Tau . . . . . . . . . . . . . 11.9^ 0.6 1.4 ^ 0.3 19.0 ^ 0.4 \0.4 15 3.0^ 0.7 (5.0^ 1.2)] 10~8Haro 6-10 . . . . . . . . 2.4 ^ 0.3 \0.8 \1.2 \3.7 15 0.6[ 2.7 . . .L1551 IRS 5 . . . . . . 18.6^ 0.9 9.8 ^ 0.8 8.5 ^ 0.5 6.1 ^ 1.2 15.6 31.0^ 1.7 (3.3^ 0.3)] 10~9L1535 IRS . . . . . . . . 5.9^ 0.6 0.4 ^ 0.1 13.1 ^ 0.7 \0.2 11.2 0.9^ 0.2 (8.9^ 2.3)] 10~8TMR 1 . . . . . . . . . . . . 5.0^ 0.5 0.5 ^ 0.3 3.6 ^ 0.6 \0.9 15.4 1.0^ 0.7 (2.9^ 2.1)] 10~8TMC 1A . . . . . . . . . . 6.2^ 0.8 1.6 ^ 0.7 3.5 ^ 0.4 2.1 ^ 0.2 27.4 1.7^ 0.2 (1.4^ 0.7)] 10~8L1527 IRS . . . . . . . . 4.1^ 0.6 \1.9 \2.0 \6.2 23.4 0.9[ 6.8 . . .TMC 1 . . . . . . . . . . . . 1.6^ 0.2 0.7 ^ 0.2 4.2 ^ 0.2 5.3 ^ 3.0 15 2.2^ 0.5 (2.1^ 0.7)] 10~8
Average over 20A ] 20A area
L1489 IRS . . . . . . . . 3.6^ 0.2 0.34 ^ 0.13 5.5 ^ 0.2 \0.2 15 13.0^ 0.9 (5.9^ 2.3)] 10~8T Tau . . . . . . . . . . . . . 4.1^ 0.1 0.23 ^ 0.08 7.5 ^ 0.1 \0.2 15 8.6^ 3.0 (1.2^ 0.4)] 10~7Haro 6-10 . . . . . . . . 0.2 ^ 0.1 \0.21 0.2^ 0.1 . . . 15 0.5 [ 3.0 (0.9[ 5.3)] 10~8L1551 IRS 5 . . . . . . 4.7^ 0.2 2.22 ^ 0.18 1.8 ^ 0.1 5.2 ^ 0.9 15.6 113.0^ 6.8 (3.0^ 0.3)] 10~9L1535 IRS . . . . . . . . 1.6^ 0.2 0.06 ^ 0.03 6.3 ^ 0.2 \0.2 11.2 2.3^ 1.1 (2.8^ 1.4)] 10~7TMR 1 . . . . . . . . . . . . 2.3^ 0.1 0.24 ^ 0.08 1.5 ^ 0.1 \0.4 15.4 9.0^ 3.0 (2.3^ 0.8)] 10~8TMC 1A . . . . . . . . . . 0.8^ 0.2 \0.56 1.6^ 0.1 (\22) 27.4 3.9^ 0.9 (0.5[ 1.3)] 10~7L1527 IRS . . . . . . . . 1.1^ 0.2 \0.46 2.3^ 0.2 \5.7 23.4 4.6[ 30.2 (1.6[ 9.2)] 10~8TMC 1 . . . . . . . . . . . . 0.4^ 0.1 0.14 ^ 0.06 1.4 ^ 0.1 4.7 ^ 4.1 15 7.2^ 2.3 (3.6^ 1.6)] 10~8
a From but correcting for a beam efficiency of 0.8 for the H13CO` Nobeyama data et al. For L1489 IRS, T Tau,Paper I, (Mizuno 1994).Haro 6-10, and TMC 1, the median value of q\ 15 is assumed.
b Molecular mass derived from C18O or 13CO using with K and correcting for line opacity. Listed uncertainties inequation (1) Tex \ 40the mass only include the observational noise ; the total uncertainty amounts to a factor ofD2 from the range in inferred excitationtemperatures (see Upper limits on C18O result in a range in inferred mass and X(HCO`).° 3).
many important aspects can be obtained by a simple, directcomparison of the data sets. In the HCO` 1È0Figure 3,OVRO images and the HCO` 3È2 map of T Tau from
et al. are superposed on the single-dishHogerheijde (1997b)HCO` 1È0, 3È2, and 4È3 data of The compactPaper I.HCO` 1È0 is seen to trace the peak of single-dish emission,with a size comparable to the 3È2 and 4È3 cores at 14AÈ19Aresolution. This supports the conclusion from thatPaper Ithe latter provide a reliable probe of the inner envelopes.The single-dish HCO` 1È0 emission around L1551 IRS 5lacks strong central concentration, and only a number ofHCO` clumps are recovered in the OVRO beam. TowardHaro 6-10, almost all HCO` is resolved out by the interfer-ometer. In the HCO` line proÐles from the 28AFigure 4,IRAM 30 m beam are compared to the OVRO data, afterconvolving to the same resolution. Toward some sources(L1489 IRS, TMR 1, L1527 IRS, TMC 1) comparable lineproÐles are seen, while toward, e.g., L1551 IRS 5, only red-shifted emission is recovered. A deep absorption dipobserved by OVRO in HCO` 1È0 toward T Tau is Ðlled inby large-scale emission in the IRAM beam Langevelde(vanet al. 1994a).
In the HCO` and C18O Ñuxes integrated overTable 4,28A and 20A regions, respectively, are listed as fractions ofthe Ñux obtained in single-dish beams of similar size(HCO` from C18O from et al.Paper I ; Hayashi 1994,adopting In HCO`, the OVRO beam tracesgmb \ 0.4).25%È50% of the single-dish Ñux, except in Haro 6-10 (3%)and L1551 IRS 5 (11%). Lower fractions of are[20%recovered in C18O. This indicates that HCO` emission ispredominantly associated with compact structure in theenvelopes, possibly because of an increased abundance onthese scales, while the surrounding cloud contributes signiÐ-
cantly to the single-dish C18O Ñux. The cloud core aroundHaro 6-10 appears to lack any central, compact conden-sation, since only marginal emission is detected in theOVRO beam from HCO`, 13CO, or C18O, while the lowHCO` Ñux recovered toward L1551 IRS 5 is likely to bedue to the opacity of the surrounding cloud, because asmuch as 42% of the single-dish Ñux is recovered in theoptically thin C18O line. This fraction is large compared tothe other sources, suggesting that L1551 IRS 5 has a rela-tively massive inner envelope. From H13CO` interferome-ter observations, et al. Ðnd a mass of 0.27Saito (1996) M
_.
In the last column of the derived molecular massesTable 4,are compared to the values obtained from single-dish 1.1
TABLE 4
FLUX AND MASS RATIOS OVRO VERSUS SINGLE-DISH
HCO`a,d C18Ob,d Massc,dSource (%) (%) (%)
L1489 IRS . . . . . . . . 38^ 15 15^ 6 52È81T Tau . . . . . . . . . . . . . 26^ 10 13^ 5 30 ^ 12Haro 6-10 . . . . . . . . 3 ^ 1 \4 [12L1551 IRS 5 . . . . . . 11 ^ 4 42^ 17 43 ^ 17L1535 IRS . . . . . . . . 51^ 20 \21 [64TMR 1 . . . . . . . . . . . . 29^ 12 6^ 3 129 ^ 50TMC 1A . . . . . . . . . . 35^ 14 \22 22^ 9L1527 IRS . . . . . . . . 41^ 16 \14 15È97TMC 1 . . . . . . . . . . . . 37^ 15 3^ 2 45È144
a Ratio of OVRO (28A area) over IRAM 30 m (28A beam;Paper I).
b Ratio of OVRO (20A area) over Nobeyama (16A beam;et al. usingHayashi 1994, gmb \ 0.4).
c Ratio of OVRO (20A area) over mass from j \ 1.1 mmdust continuum (19A beam; Paper I).
d Error based on 20% accuracy in Ñux calibration.

322 HOGERHEIJDE ET AL. Vol. 502
FIG. 3.ÈSingle-dish HCO` 1È0, 3È2, and 4È3 maps from overlaid with the HCO` 1È0 OVRO images. For T Tau, the HCO` 3È2 OVRO imagesPaper I,from et al. are reproduced in the inset. The details of the individual sources are discussed inHogerheijde (1997a) ° 5.1.
mm continuum measurements Toward most(Paper I).sources, the C18O OVRO data and the 1.1 mm continuumÑuxes appear to trace the same material ; only toward T Tauand TMC 1A is the derived mass less than 50% of the dustvalue, suggesting an enhanced dust temperature and, conse-quently, a lower dust mass. The fraction of recoveredHCO` and C18O Ñux toward these sources is comparableto what is found for the other sources, supporting the con-clusion that the dust mass may have been overestimated bya factor of D2 for these two sources.
4. SINGLE-DISH OBSERVATIONS : PROPERTIES OF THE
ENVELOPES AND OUTFLOWS
4.1. L ine ProÐles, Opacities, and Excitation ConditionsEmission in the observed transitions is detected toward
all sources of the sample, with intensities ranging between 1
to a few K for the C18O lines to 20È60 K for the 12CO 4È3and 6È5 lines. Most notable is the detection of 12CO and13CO 6È5 toward all sources, indicating the presence ofappreciable amounts of warm K) gas around(Tkin[ 80embedded low-mass YSOs. Previously, emission in this linefrom YSOs had only been detected toward a small numberof T Tauri stars et al. see also et al.(Schuster 1993 ; Spaans
The 12CO, 13CO, and C18O spectra observed toward1995).the sources are presented in the integrated lineFigure 5 ;intensities are listed in Table 5.
The C18O 2È1 and 3È2 and 13CO 6È5 lines are narrow,and best described by single Gaussians of FWHM 0.75È3.0km s~1. The systemic velocity of the sources can beV0accurately determined from these lines and agree(Table 5),to within 0.5 km s~1 for the di†erent transitions, often towithin the velocity resolution. The 12CO 3È2, 4È3, and 6È5line proÐles are characterized by extended line wings and
TABLE 5
SINGLE-DISH CO INTEGRATED INTENSITIES dV/ TmbV0 C18O 2È1 C18O 3È2 13CO 3È2 12CO 3È2 12CO 4È3 13CO 6È5 12CO 6È5
Source (km s~1) (K km s~1) (K km s~1) (K km s~1) (K km s~1) (K km s~1) (K km s~1) (K km s~1)
L1489 IRS . . . . . . . . 7.1 2.97^ 0.12 3.95 ^ 0.18 14.3 ^ 0.37 25.1^ 1.2 44.7^ 0.40 8.20^ 0.52 37.3^ 0.73T Tau . . . . . . . . . . . . . 8.0 3.63^ 0.22 7.08 ^ 0.28 45.8 ^ 0.47 . . . 279.8 ^ 0.80 53.1^ 0.40 243.8^ 0.73Haro 6-10 . . . . . . . . 7.0 4.25^ 0.18 3.58 ^ 0.19 14.8 ^ 0.26 66.2^ 2.9 97.5^ 0.51 13.4^ 0.46 119.5^ 0.89L1551 IRS 5 . . . . . . 6.7 6.00^ 0.25 9.80 ^ 0.33 19.4 ^ 0.29 . . . 104.7 ^ 0.79 17.4^ 0.54 68.0^ 0.79L1535 IRS . . . . . . . . 5.5 2.80^ 0.14 2.23 ^ 0.16 8.5 ^ 0.22 26.2^ 1.9 15.9^ 0.34 2.3^ 0.46 19.1^ 0.48TMR 1 . . . . . . . . . . . . 6.2 4.10^ 0.18 4.06 ^ 0.16 11.6 ^ 0.23 23.6^ 1.8 40.3^ 0.46 8.6^ 0.61 51.4^ 0.45TMC 1A . . . . . . . . . . 6.6 1.31^ 0.17 2.83 ^ 0.19 6.6 ^ 0.24 25.3^ 1.4 34.6^ 0.60 18.4^ 0.80 28.8^ 0.42L1527 IRS . . . . . . . . 5.9 2.97^ 0.26 2.81 ^ 0.18 10.6 ^ 0.35 24.2^ 0.4a 51.3^ 0.61 4.1^ 0.31 50.9^ 0.75TMC 1 . . . . . . . . . . . . 5.2 2.32^ 0.20 4.41 ^ 0.21 4.07 ^ 0.27 21.3^ 2.5 16.0^ 0.59 7.1^ 0.45 21.3^ 0.43
a JCMT Archive data, previously presented by et al.MacLeod 1994.

No. 1, 1998 ENVELOPE STRUCTURE AND OUTFLOWS OF LOW-MASS YSOs 323
FIG. 3.ÈContinued
narrow absorption features. Since care was taken to obtainemission-free reference positions for the position-switchedobservations, these features are interpreted as self-absorption. Two-thirds of the sources have higher inten-sities on the blue side of the absorption features in 12CO4È3 and 6È5, while no preferentially red or blue asymmetryis seen in 12CO 3È2. The presence of redshifted absorptionis interpreted as evidence for infall (cf. et al.Gregersen 1997 ;
et al. although detailed modeling of theMardones 1997),line proÐles, including contributions from the outÑow, isrequired for any deÐnitive conclusion to be reached.
Estimates of the opacity at line center and averaged(qmax)over the line proÐle are obtained from the 13CO/C18O(q6 )
3È2 and 12CO/13CO 6È5 ratios. The opacity in the outÑow,is obtained from the 12CO/13CO 3È2 ratios averagedqwing,over the line wings. Again, the standard abundances of
[12CO]:[13CO]\ 65 :1 and [13CO]:[C18O]\ 8 :1 areadopted Typical 13CO 3È2 opacities of(Table 6). q6 (13)\0.5È5.6 are found, with the exception of the deeply embed-ded source TMC 1, where even C18O 3È2 is optically thick,with For 12CO 6È5, optical depths ofq6 (18)[ 3. q6 (12)\5È67 are found, indicating optically thin emission in 13CO6È5 toward all sources. The maximum opacities at 3È2 and6È5 are much larger than the line-averaged values, but onlyat the few velocity channels covering the self-absorptionfeatures. Line wing 12CO 3È2 opacities, are gener-qwing(12),

FIG. 4.ÈHCO` 1È0 spectra observed in the 28A IRAM 30 m beam (thin lines), overlaid with the OVRO spectra, after convolution with a 28A beam (heavylines). All spectra are on the same intensity scale.
FIG. 5.ÈSingle-dish 12CO, 13CO, and C18O spectra. The C18O 2È1 spectra have been multiplied by 2 for clarity. The vertical dashed lines indicate thesystemic velocity of the objects.
324

FIG. 5.ÈContinued
325

326 HOGERHEIJDE ET AL. Vol. 502
TABLE 6
SINGLE-DISH CO LINE OPACITIES
13CO/C18O 3È2 12CO/13CO 3È2 12CO/13CO 6È5
SOURCE qmax(13) qmax(12) q6 (13) q6 (12) qwing(12) qmax(12) q6 (12)
L1489 IRS . . . . . . . . 3.5 230 2.3 150 8.3 40 16T Tau . . . . . . . . . . . . . 1.5 100 0.5 33 4.9 30 16Haro 6-10 . . . . . . . . 25.0 1625 1.8 117 4.2 15 8L1551 IRS 5 . . . . . . 18.5 1200 5.6 364 . . . 60 19L1535 IRS . . . . . . . . 2.7 175 1.1 72 \8.4 24 8TMR 1 . . . . . . . . . . . . 7.5 490 3.3 215 8.9 22 12TMC 1A . . . . . . . . . . 6.5 425 4.5 290 \0.5 100 67L1527 IRS . . . . . . . . [24 [1560 2.1 137 18.4 18 5TMC 1 . . . . . . . . . . . . [24 [1560 [24 [1560 \3.3 110 26
ally an order of magnitude lower than the value obtainedover the full line proÐle, with the only exceptions of TMC1A and TMC 1, where the wings are found to be opticallythin.
Constraints on the excitation of the line cores and linewings are obtained from the ratio of the 13CO 3È2 and 6È5transitions, and the 12CO 4È3 and 6È5 lines, respectively.Calculations are made using an escape probability formal-ism under optically thin conditions, with the collision ratesfrom & Launay and et al.Flower (1985) Schinke (1985).Neglecting the moderate optical depths of the 13CO 3È2line cores and of the 12CO 4È3 and 6È5 line wings, theobserved line ratios constrain the excitation, andnH2
Tkin.The observed line ratios are listed in together withTable 7,the inferred kinetic temperatures assuming thermalization,i.e., cm~3. If the actual density is smaller or thenH2
[ 105line opacity cannot be neglected, the inferred kinetic tem-peratures are increased or decreased, respectively. For thematerial at line center, the temperature is constrained to35È55 K for L1489 IRS, Haro 6-10, TMR 1, and TMC 1A.For T Tau, L1551 IRS 5, and TMC 1 the temperature rangemay extend up to 120 K, because of the uncertainty in theline ratio. The extreme line ratios of 3.5È4.5 observedtoward L1535 IRS and L1527 IRS limit the temperature toD25 K. All these temperatures agree within the accuracy tothe dust temperatures inferred by et al.Moriarty-Schieven
The range of temperatures found for the line wings is(1995).25È70 K for most sources, similar to the range of tem-peratures for the cores. Only for L1535 IRS and L1527 IRSare the inferred values of 70 K and 45 K, respectively, forthe wings signiÐcantly larger than those for the core, D25K. In the determination of the outÑow mass below, an exci-
tation temperature of K will be assumed for theTex\ 50line wings, based on the observed ratios.
4.2. OutÑow MapsOutÑow maps in 12CO 3È2 are presented in TheFigure 6.
maps have a resolution of 15A, except for T Tau, which hasbeen mapped with the 21A CSO beam. summarizesTable 8the maximum velocity extent of the red and blue emission,determined from the 12CO 4È3 spectra, which o†er the bestsignal-to-noise ratio on the line wings. The velocities atwhich the emission is blended with the surrounding cloudare determined from the 12CO 3È2 position-velocity dia-grams of and have been excluded from the outÑowFigure 7,emission. For T Tau, no clear position-velocity correlationwas observed, and a range of 6.0È8.0 km s~1 was excluded.The close orientation to the plane of the sky of the L1527IRS outÑow prevents unambiguous separation of outÑowand core emission ; excluding the velocity range of 5.0È7.0km s~1 is found to give the clearest outÑow map.
OutÑow emission is associated with all sources, but aclear bipolar morphology is only seen toward L1489 IRS,TMC 1A, TMC 1, and L1527 IRS, as shown previously forthe latter three sources by et al. andChandler (1996)
et al. Toward TMR 1, the red and blueMacLeod (1994).emission also overlaps, but the overall structure is consis-tent with the previous interferometric results of etTerebeyal. In spite of pronounced line wings, no clear(1990).bipolar structure is seen toward Haro 6-10. Toward L1535IRS, line wings are only prominent in the 12CO 6È5 spectra,and the source is therefore classiÐed as an outÑow source.In 12CO 3È2, the outÑow emission is almost undetected,and its structure is undetermined. The outÑow of T Tau is
TABLE 7
SINGLE-DISH CO LINE EXCITATION
LINE CORE LINE WINGS
Tkin Tkin TdustaSOURCE 13CO(3~2)@(6~5) (K) 12CO(4~3)@(6~5) (K) (K)
L1489 IRS . . . . . . . . 1.0È2.0 38È55 1.0È2.0 35È70 43T Tau . . . . . . . . . . . . . 0.5È1.0 55È120 1.5È3.0 24È45 51Haro 6-10 . . . . . . . . 1.0È2.0 38È55 1.0È2.0 35È70 . . .L1551 IRS 5 . . . . . . 0.5È2.0 38È120 1.5È4.0 25È45 47L1535 IRS . . . . . . . . 3.5È4.5 25 1.0 70 40TMR 1 . . . . . . . . . . . . 1.0È1.8 40È55 1.0È2.0 35È70 53TMC 1A . . . . . . . . . . 1.0È2.0 38È55 1.5È3.5 25È45 44L1527 IRS . . . . . . . . 3.5È4.5 25 1.5 45 31TMC 1 . . . . . . . . . . . . 0.5È2.0 38È120 1.0È2.0 35È70 41
a From et al.Moriarty-Schieven 1995.

No. 1, 1998 ENVELOPE STRUCTURE AND OUTFLOWS OF LOW-MASS YSOs 327
FIG. 6.ÈJCMT 12CO 3È2 outÑow maps. Solid lines show blueshifted emission, dashed lines show redshifted emission. Contours are drawn at the 3 plevel. Note that the map of T Tau is not centered on the position of the source, which is indicated by a star. The map of L1527 IRS has been presentedpreviously by et al.MacLeod (1994).
known to be close to pole-on, resulting in superposed redand blue lobes Koresko, & Leinert(Herbst, 1995 ; vanLangevelde et al. et al.1994b ; Schuster 1997).
Except for Haro 6-10 and L1535 IRS, position angles forthe outÑows can be derived from the maps, and are listed in
For Haro 6-10, a position angle of 65¡ is adoptedTable 8.from the detection of Herbig-Haro objects in that direction
et al. For L1535 IRS, a position angle of 10¡ is(Strom 1986).inferred from a K@ scattered-light image presented by
see Values for T Tau (160¡) andHodapp (1994; Fig. 10).L1551 IRS 5 (45¡) are taken from Langevelde et al.van
and & Snell Because of(1994b) Moriarty-Schieven (1988).its pole-on conÐguration, attributing a position angle to theoutÑow of T Tau is not very meaningful.
The extent of the outÑow emission of L1489 IRS, Haro6-10, L1535 IRS, TMC 1A, and TMC 1 is (Figs. and[1@ 6
in marked contrast to the outÑows of L1527 IRS7, Table 8),(RB 3@) and L1551 IRS 5 (RB 10@). Due to the orientationof T Tau, the projected size of its outÑow (D1@) could bemuch less than its true extent. Although the orientation ofthe position-velocity diagrams of TMR 1 and Haro 6-10deviate from the outÑow directions of by 5¡ and 15¡,Table 8respectively, it seems unlikely that signiÐcant outÑow emis-sion was missed.
The mass contained in the outÑow lobes is listed in Tableusing with main-beam antenna temperature8, equation (1)
instead of brightness temperature which reduces toTmb Tb,
forM/M_
\ 1.46 ] 10~6 / Tmb[qwing/(1 [ e~qwing)]dVK. Only pixels with signal º3 p are included in theTex\ 50
estimates. Values for are taken from Forqwing Table 6.L1551 IRS 5, the mass from & SnellMoriarty-Schieven
is listed, which is already corrected for opacity. The(1988)inferred outÑow masses are typically 0.5%È1.5% of themass of the surrounding cloud, as inferred from the line coreintensity over the full mapped areas of 2@] 2@. Toward theextremely weak outÑow source L1535 IRS, the lobes carryno more than 0.1% of the mass at line center, or 3.5] 10~4
In contrast, the prominent outÑows of L1551 IRS 5M_
.& Snell L1527 IRS, and T Tau(Moriarty-Schieven 1988),
contain as much as D7% of the total mass at line center,with 3.1, 0.18, and 0.033 respectively. These masses areM
_,
not corrected for inclination, which can project a signiÐcantfraction of the outÑowing mass to velocities close to sys-temic (cf. masses listed in Table 8).
Various methods exist to derive Ñow parameters cor-rected for inclination from the measured, projectedmaximum outÑow velocity, spatial extent, and mass. Cabrit& Bertout have derived correction factors for the(1990)

328 HOGERHEIJDE ET AL. Vol. 502
TABLE 8
12CO 3È2 OUTFLOW PARAMETERS
i P.A. Vmaxa Ra Mb,g tda,c M0 a,d FCOe,g L kinf,gSource (deg) (deg) (km s~1) (AU) (M
_) (yr) (M
_yr~1) (M
_km s~1 yr~1) (L
_)
Blue lobe
L1489 IRS . . . . . . . . 60 165 8.1 4.2E3 6.6E[4 2.5E]3 2.9E[7 2.5E[6 2.3E[3T Tau . . . . . . . . . . . . . 15 160 15.6 8.4E3 1.6E[2 2.7E]3 6.4E[6 4.0E[5 4.3E[2Haro 6-10 . . . . . . . . 30 65 12.0 5.6E3 1.0E[3 2.2E]3 4.4E[7 3.2E[6 3.3E[3L1551 IRS 5 . . . . . . 65 45 19.7 1.6E5 1.6E0 3.8E]4 4.8E[5 9.9E[4 2.3E0L1535 IRS . . . . . . . . 60 10 3.0 3.5E3 9.1E[5 5.5E]3 1.9E[8 6.0E[8 2.0E[5TMR 1 . . . . . . . . . . . . 60 170 8.7 7.0E3 8.9E[4 3.8E]3 2.8E[7 2.4E[6 2.5E[3TMC 1A . . . . . . . . . . 55 155 16.6 8.4E3 1.6E[3 2.4E]3 8.0E[7 8.0E[6 1.3E[2L1527 IRS . . . . . . . . 75 90 6.9 2.2E4 7.7E[2 1.5E]4 5.7E[6 4.1E[5 3.3E[2TMC 1 . . . . . . . . . . . . 55 0 10.7 6.3E3 1.3E[4 2.8E]3 5.3E[8 3.4E[7 9.6E[4
Red lobe
L1489 IRS . . . . . . . . 60 165 7.4 2.1E3 1.6E[3 1.3E]3 1.4E[6 1.1E[5 9.1E[3T Tau . . . . . . . . . . . . . 15 160 12.0 7.0E3 1.7E[2 2.8E]3 6.9E[6 3.3E[5 2.9E[2Haro 6-10 . . . . . . . . 30 65 13.0 4.2E3 1.3E[3 1.5E]3 7.9E[7 6.2E[6 6.6E[3L1551 IRS 5 . . . . . . 65 45 15.8 7.6E4 1.5E0 2.3E]4 7.4E[5 1.2E[3 2.3E0L1535 IRS . . . . . . . . 60 10 5.0 2.8E3 6.0E[5 2.7E]3 2.6E[8 1.3E[7 7.7E[5TMR 1 . . . . . . . . . . . . 60 170 4.3 5.6E3 1.5E[3 6.2E]3 2.9E[7 1.3E[6 6.2E[4TMC 1A . . . . . . . . . . 55 155 6.5 2.8E3 3.2E[5 2.0E]3 1.8E[8 7.1E[7 4.6E[5L1527 IRS . . . . . . . . 75 90 9.6 1.8E4 9.9E[2 9.0E]3 1.2E[5 1.2E[4 1.3E[1TMC 1 . . . . . . . . . . . . 55 0 9.3 4.2E3 7.1E[4 2.1E]3 4.0E[7 2.3E[6 2.0E[3
a Not corrected for inclination.b Assuming K and line wings opacities fromTex \ 60 qwing Table 6.c Dynamical time t
d\ R/Vmax.d Mass outÑow rate M0 \M/t
d.
e OutÑow force FCO \ MV max2 /R.f Kinetic luminosity L kin \ 12MV max3 /R.g Corrected for inclination, using average correction factors from & BertoutCabrit 1990.
mass M, the Ñow momentum rate, and theFCO\ MV max2 /R,kinetic luminosity, for three di†erentL kin\ 12MV max3 /R,realistic outÑow models. We have used the average factorfor these three models to correct the values of M, andFCO,
The spread between the di†erent models is included inL kin.the error bars shown in & BertoutFigure 8. Cabrit (1990)do not give correction factors for the dynamic time scale,
or the mass outÑow rate,td\ R/V , M0 \ M/t
d.
The adopted inclinations, deÐned as the angle betweenthe outÑow direction and the line of sight, are based on theoutÑow morphology and near-infrared observations ofscattered light (cf. et al. constrain iFig. 10). Kenyon (1993)to 60¡È90¡ for L1489 IRS and L1535 IRS by modeling thenear-infrared scattered-light images. The scattered-lightimages in K@ also suggest that i B 60¡ is a(Hodapp 1994)good estimate for these sources. Herbst et al. (1986, 1997)Ðnd i \ 13¡È19¡ for T Tau. The lack of a bipolar morphol-ogy and the broad line wings suggests i \ 45¡ for Haro 6-10.For L1551 IRS 5, & Snell quoteMoriarty-Schieven (1988)iB 65¡. For TMR, 1 i B 60¡ is inferred from the OVROHCO` and 13CO data and near-infrared observations by
et al. (see et al. limitTerebey (1990) ° 5.1.6). Chandler (1996)i to 40¡È70¡ for TMC 1A and TMC 1. The partial super-position of red and blue emission of L1527 IRS suggestsi[ 65¡. The inferred inclinations are in good agreementwith the scattered-light modeling results of Whitney,Kenyon, & Go� mez (1997).
The inclination-corrected Ñow parameters are listed inand agree to within a factor of a few with theTable 8,
previous results of & Bertout hereafterCabrit (1992 ; CB92)for L1551 IRS 5 and with those of et al. forChandler (1996)TMC 1A and TMC 1. The inferred outÑow mass, and hencethe Ñow force and kinetic luminosity, for T Tau is lower by
a factor of 20 compared to the value cited by whoCB92,used the results of & Snell which wereEdwards (1982),obtained with a much larger beam size of 1@ and may su†erfrom confusion with ambient cloud emission.
4.3. T he Relation between OutÑow Force andEnvelope Mass
In the outÑow momentum rate, or Ñow force,Figure 8,of the red and blue lobes is plotted against a number ofFCO,
source properties : bolometric luminosity, 1.1 mm contin-uum envelope Ñux, 2.7 mm continuum disk Ñux, and rela-tive age as traced by For/ Tmb(HCO`3È2)dV /L bol.reference, the data points of and their derivedCB92
relationship are also shown. Single-dish 1 mmFCOÈL bolÑuxes of the sources have been taken fromCB92 Terebey,Chandler, & Andre� Ward-Thompson, &(1993), Minchin,White and et al. Our data are in(1995), Saraceno (1996).excellent agreement with the trend observed for comparableYSO samples of versus and of versus 1FCO L bol (CB92), FCOmm continuum Ñux et al. et al.(Saraceno 1996 ; Bontemps
As noted by et al. the correlation1996). Saraceno (1996),between and 1 mm Ñux is better than with TheFCO L bol.slight scatter of the sources toward larger 1 mm ÑuxesCB92can be explained by the fact these contain an unknowncontribution from circumstellar disks, typically 30%È75%in a 19A beam for which our data have been(Paper I),corrected. This illustrates the importance of obtaining spa-tially resolved information on the dust emission of embed-ded sources.
show that the 6 cm radio Ñux, which probablyCB92traces the ionized component of the wind driving the molec-ular outÑow, is well correlated with the outÑow force asinferred from the swept-up CO. This indicates that, at least

No. 1, 1998 ENVELOPE STRUCTURE AND OUTFLOWS OF LOW-MASS YSOs 329
FIG. 7.ÈPosition-velocity diagrams of 12CO 3È2 emission obtained with the JCMT on 6@ long strips along the inferred outÑow directions, as indicated.Contours are drawn at 3 p intervals.
for embedded sources, is a measure of the intrinsicFCOstrength of the outÑow, rather than simply reÑecting theamount of CO available to be swept up. et al.Bontemps
and et al. propose that the relation(1996) Saraceno (1996)between 1 mm Ñux and outÑow strength can be explainedby an increased mass infall rate in more massive envelopes.Our data allow the connection between envelope mass andoutÑow strength to be followed down to the scale of theaccretion disk. In it was found that the 3.4 and 2.7Paper Imm disk Ñux correlates with the envelope mass and that, asa result, disk Ñux is related to This supports the inter-FCO.pretation that more massive and denser envelopes havehigher mass infall rates, possibly through variations in thesound speed (cf. In that case, a higher disk massShu 1977).is expected, as well as an increased accretion rate throughthe disk, resulting in a higher temperature and enhancedÑux. The bolometric luminosity, thought to be dominatedby accretion luminosity for embedded sources, also dependson the stellar mass and the viewing angle (cf. Boden-Yorke,heimer, & Laughlin explaining its less tight relation-1995),ship with FCO.
The relative age of the object does not appear to be agood predictor of outÑow strength. In it was arguedPaper Ithat the ratio is a reliable measure/ Tmb(HCO` 3È2)dV /L bolof relative age and reÑects the current ratio of envelope tostellar mass, with large values for young objects and lowvalues for more evolved ones. No correlation with isFCOfound. Over a larger time span, extending from the class 0 to
the T Tauri stage, age is expected to determine outÑowstrength, but within the embedded phase the envelope massand infall rate are shown to dominate.
5. SMALL-SCALE (700 AU) ENVELOPE STRUCTURE
In this section, the compact structure traced by theHCO`, 13CO, and C18O OVRO observations will be dis-cussed in greater detail. Results on the individual sourcesare discussed in and compared to the 12CO 3È2 out-° 5.1,Ñows in and K@ scattered light from the outÑowFigure 9cavities in (cf. et al. et al.Figure 10 Tamura 1991 ; Whitney
& Roche In a simple picture will be1997 ; Lucas 1997). ° 5.2,constructed to explain the compact emission around theindividual sources, consisting of three components : a coresurrounding the young star, condensations scatteredthroughout the envelope, and material within the outÑowor along its cavity walls.
5.1. Individual Sources
5.1.1. L 1489 IRS
The OVRO HCO`, 13CO, and C18O 1È0 emission tracesa 12A ] 7A core, elongated perpendicular to the outÑow
In addition, 13CO emission is coincident with the(Fig. 9).southern outÑow lobe, and HCO` emission is extendedalong the western edge of the northern outÑow lobe andtraces the site where the outÑow borders on more extendedHCO` emission (cf. This latter feature is mostFig. 3).

330 HOGERHEIJDE ET AL. Vol. 502
FIG. 8.È(a) OutÑow force vs. bolometric luminosity ( Ðlled symbols). The data points of are indicated by open symbols. (b) vs.FCO\MV max2 /R CB92 FCO1.1 mm envelope Ñux, from ( Ðlled symbols). These Ñuxes have been corrected for the contribution of any circumstellar disk, and measure envelopePaper Imass alone. The data points of are again shown by open symbols. Note that their Ñuxes may still contain contributions from circumstellar disks,CB92explaining the scatter toward higher values. (c) vs. 2.7 mm disk Ñux, from (d) vs. relative age, as measured by the ratio of HCO` 3È2 intensityFCO Paper I. FCOover (see Young objects are to the right, older ones to the left of the plot. In all panels, has been corrected for line opacity and sourceL bol Paper I). FCOinclination (see using the correction factors determined by & Bertout The vertical error bars show the spread of these factors forTable 8) Cabrit (1990).di†erent outÑow models.
clearly seen in the zero-moment image of whichFigure 9,better brings out low-level emission. K@ scattered light isassociated with the southern, blueshifted outÑow lobe (Fig.
the extension to the southeast coincides with the lowest10) ;HCO` contour, and is probably part of the cavity wall. Atotal mass of 0.013 is traced by the C18O emission overM
_20A ] 20A, consistent with the dust mass of 0.016È0.025 M_found in and the 0.04 inferred from CS interfer-Paper I M
_ometry by et al.Ohashi (1996b).The HCO`, 13CO, and C18O OVRO spectra have a total
width of 4 km s~1 and the HCO` position-velocity(Fig. 2),diagram obtained along the coreÏs major axis could indicaterotation around a 0.9 object, correcting for an inclina-M
_tion of 60¡ This is larger than the 0.4 inferred(Fig. 11). M_from possibly because the HCO` containsL bol (Table 1),
contributions from the outÑow, increasing the velocitywidth and overestimating the stellar mass. The deep
absorption feature in HCO` at ]7.1 km s~1 correspondsto large-scale, optically thick material.
5.1.2. T T au
In HCO`, 13CO, and C18O 1È0, the emission reveals amarginally resolved core of 0.009 or 30% of the massM
_,
inferred from the dust, a north-south ridge in HCO` and13CO, and HCO` emission associated with the reÑectionnebula NGC 1555 (Figs. and et al.1 10). Momose (1996)interpret this structure seen in a larger 13CO interferometermap as an the expanding shell around the pole-on outÑowcavity. The peak of the central bright core is also picked upin HCO` 3È2 by OVRO et al. repro-(Hogerheijde 1997b ;duced here in and is interpreted as the bright cavityFig. 3c),walls close to the base of the pole-on outÑow.
The spectra seen in the OVRO beam have a FWHM ofD3 km s~1 with a deep absorption feature in(Fig. 2),
No. 1, 1998 ENVELOPE STRUCTURE AND OUTFLOWS OF LOW-MASS YSOs 331
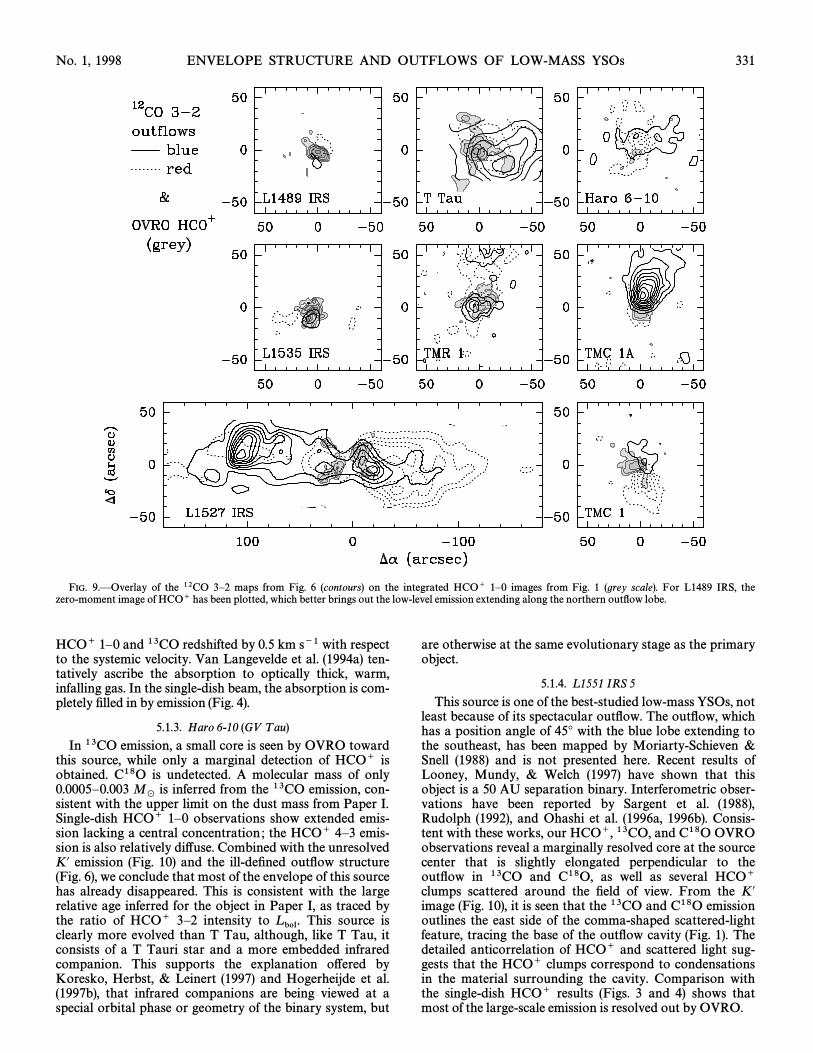
FIG. 9.ÈOverlay of the 12CO 3È2 maps from (contours) on the integrated HCO` 1È0 images from (grey scale). For L1489 IRS, theFig. 6 Fig. 1zero-moment image of HCO` has been plotted, which better brings out the low-level emission extending along the northern outÑow lobe.
HCO` 1È0 and 13CO redshifted by 0.5 km s~1 with respectto the systemic velocity. Langevelde et al. ten-Van (1994a)tatively ascribe the absorption to optically thick, warm,infalling gas. In the single-dish beam, the absorption is com-pletely Ðlled in by emission (Fig. 4).
5.1.3. Haro 6-10 (GV T au)
In 13CO emission, a small core is seen by OVRO towardthis source, while only a marginal detection of HCO` isobtained. C18O is undetected. A molecular mass of only0.0005È0.003 is inferred from the 13CO emission, con-M
_sistent with the upper limit on the dust mass from Paper I.Single-dish HCO` 1È0 observations show extended emis-sion lacking a central concentration ; the HCO` 4È3 emis-sion is also relatively di†use. Combined with the unresolvedK@ emission and the ill-deÐned outÑow structure(Fig. 10)
we conclude that most of the envelope of this source(Fig. 6),has already disappeared. This is consistent with the largerelative age inferred for the object in as traced byPaper I,the ratio of HCO` 3È2 intensity to This source isL bol.clearly more evolved than T Tau, although, like T Tau, itconsists of a T Tauri star and a more embedded infraredcompanion. This supports the explanation o†ered by
Herbst, & Leinert and et al.Koresko, (1997) Hogerheijdethat infrared companions are being viewed at a(1997b),
special orbital phase or geometry of the binary system, but
are otherwise at the same evolutionary stage as the primaryobject.
5.1.4. L 1551 IRS 5
This source is one of the best-studied low-mass YSOs, notleast because of its spectacular outÑow. The outÑow, whichhas a position angle of 45¡ with the blue lobe extending tothe southeast, has been mapped by &Moriarty-SchievenSnell and is not presented here. Recent results of(1988)
Mundy, & Welch have shown that thisLooney, (1997)object is a 50 AU separation binary. Interferometric obser-vations have been reported by et al.Sargent (1988),
and Ohashi et al. Consis-Rudolph (1992), (1996a, 1996b).tent with these works, our HCO`, 13CO, and C18O OVROobservations reveal a marginally resolved core at the sourcecenter that is slightly elongated perpendicular to theoutÑow in 13CO and C18O, as well as several HCO`clumps scattered around the Ðeld of view. From the K@image it is seen that the 13CO and C18O emission(Fig. 10),outlines the east side of the comma-shaped scattered-lightfeature, tracing the base of the outÑow cavity The(Fig. 1).detailed anticorrelation of HCO` and scattered light sug-gests that the HCO` clumps correspond to condensationsin the material surrounding the cavity. Comparison withthe single-dish HCO` results (Figs. and shows that3 4)most of the large-scale emission is resolved out by OVRO.

332 HOGERHEIJDE ET AL. Vol. 502
FIG. 10.ÈK@ scattered-light images from of L1489 IRS, T Tau, Haro 6-10, L1551 IRS 5, and L1535 IRS, with half-power wavelengths ofHodapp (1994)1.94 and 2.29 km, and unpublished Keck telescope data of TMR 1, TMC 1A, L1527 IRS, and TMC 1, over 1.995È2.292 km (grey scale), overlaid with theHCO` images from (contours). The near-infrared and millimeter data have been aligned by eye with the stellar position for T Tau, Haro 6-10, TMC 1A,Fig. 1and TMC 1. The image of L1527 IRS was shifted to the same position as given by et al. while the remaining sources were aligned in such aTamura (1991),way that a clear correspondence was found between features in the K@ and HCO` images.
The central, elongated C18O core contains 0.1 orM_
,40% of the single-dish dust mass. The position-velocitydiagram obtained along the major axis suggests rotationaround a D0.5 object. This is uncomfortably low for aM
_binary system, and much smaller than the 2.6 foundM_from The latter value may be overestimated, if L1551L bol.IRS 5 is undergoing a FU Orionis outburst, as has been
suggested by et al. In addition, the gas mayMundt (1985).not be on Keplerian orbits, as proposed by et al.Saito
and et al. who model velocity struc-(1996) Ohashi (1996a),ture of the H13CO` and 13CO emission with disklike infalltoward a 0.5È1.0 object. The position-velocity diagramM
_shows a tail of redshifted emission associated with theoutÑow. The HCO` and 13CO spectra show deep self-absorption close to due to optically thick, extendedV0material.
The inferred systemic velocity of 6.7 km s~1 di†ers signiÐ-cantly from the value of D6.2 km s~1 found by etSargental. and et al. L1551 IRS 5 is the only(1988) Ohashi (1996a).source for which we Ðnd a di†erence in from publishedV0values. We believe that this di†erence is spurious, althoughcareful examination of the observational settings did notreveal any discrepancies. The exact value of has no inÑu-V0ence on any of our conclusions.
5.1.5. L 1535 IRS
The integrated OVRO images of HCO`, 13CO, andC18O emission from L1535 IRS reveal a core of(Fig. 1)0.002 coincident with the peak of the large-scale emis-M
_,
sion A similar mass of 0.0065 is inferred by(Fig. 3). M_et al. from interferometer CS measurementsOhashi (1996b)
and the 1.1 mm continuum upper limit of 0.01 M_
(Paper I).

No. 1, 1998 ENVELOPE STRUCTURE AND OUTFLOWS OF LOW-MASS YSOs 333
FIG. 11.ÈPosition-velocity diagrams of HCO` and C18O along the major axes of the cores observed toward L1489 IRS, L1551 IRS 5, TMC 1A, andTMC 1. The systemic velocity of the objects is indicated by the vertical line. For comparison, Keplerian rotation is shown for inclination-corrected stellarmasses of 0.9 (L1489 IRS), 0.5 (L1551 IRS 5), 0.2 (TMC 1A), and 0.8 (TMC 1). Additional contributions from the outÑows are likely forM
_M
_M
_M
_L1489 IRS, and for the redshifted tail of C18O toward L1551 IRS 5.
At 4.8 km s~1, the C18O emission is blueshifted by 0.7 kms~1 from the single-dish systemic velocity, possibly tracingvelocity structure, like rotation close to the source.Although no obvious outÑow structure is seen in 12CO 3È2
the K@ observations show a clear bipolar reÑection(Fig. 6),nebulosity, with a position angle of 10¡. A close agreementis found between details in the HCO` and K@ emission, forexample the straight edge on the west side and the exten-sions to the south and along the northern edge. Approx-imately 30A north of the source, a secondary K@ emissionregion is visible, the nature of which is not entirely clear. Onthe single-dish HCO` 1È0 map of its locationFigure 3,coincides with a depression in the HCO` emission. Poss-ibly, the lower column density allows scattered light toescape. Alternatively, the dark lane separating the two K@emission regions could be interpreted as enhanced extinc-tion. A similar feature is seen toward TMR 1 (see nextsection), and et al. show that it cannot beWhitney (1997)due to absorption, since it is bluer than the surroundingemission.
5.1.6. T MR 1
In the OVRO beam a D15A core is seen in HCO` and13CO toward this source, while only weak emission is
observed in C18O. A mass of 0.009 is inferred for theM_core, similar to the dust mass of 0.007 from andM_
Paper Ithe 0.01 inferred by et al. from CSM
_Ohashi (1996b)
interferometry. In K@ et al. bipolar nebu-(Terebey 1990),losity is seen to be coincident with the 12CO 3È2 outÑow
which is intersected by an absorption lane D15A to(Fig. 6),the north of the source. However, et al.Whitney (1997)show that this band is bluer than the surrounding emission,indicating that it cannot be due to enhanced extinction.Instead, it seems likely that the secondary emission featureis caused by scattering o† a condensation in the surround-ing cloud. In HCO`, and less clearly in 13CO, enhancedemission coincides with the north side of the K@ feature,analogous to the association of HCO` with the reÑectionnebula NGC 1555 toward T Tau, supporting this interpre-tation The HCO` and 13CO spectra consist of 2È3(Fig. 10).sharp emission peaks, similar to the structure seen in the13CO single-dish spectrum which is probably(Fig. 5),caused by narrow and deep absorption features separatingthe peaks.
5.1.7. T MC 1A
In spite of the spectacular outÑow driven by this object,the HCO`, 13CO, and C18O emission observed by OVRO
334 HOGERHEIJDE ET AL. Vol. 502
is conÐned to a D20A FWHM core around the sourcecenter. A mass of 0.004 is inferred, or about 20% of theM
_dust mass from Extended K@ emission can be seenPaper I.to outline the base of the blue outÑow lobe The(Fig. 10).velocity width of the HCO` emission is only 1 km s~1,corresponding to the red part of the single-dish spectrum,while the peak of the OVRO HCO` emission is o†set byD3A to the west from the continuum position. When inter-preted as rotation, the HCO` position-velocity diagram of
indicates a stellar mass of 0.2 after correctingFigure 11 M_
,for an inclination of 55¡. This is in good agreement with the0.3 inferred fromM
_L bol (Table 1).
While the HCO` emission occurs close to the systemicvelocity of 6.6 km s~1, the 13CO and C18O emission isblueshifted by 2È3 km s~1, indicating their close associationwith the outÑow. A similar trend is seen in the single-dishspectra of 12CO and HCO`, where the 12CO show promi-nent line wings of 15 km s~1, while the HCO` line extendsover no more than a few km s~1.
5.1.8. L 1527 IRS
In this source, the association of the OVRO HCO` emis-sion with the outÑow is striking. Cross-shaped HCO` emis-sion is seen to outline in detail the 12CO 3È2 outÑow lobes
The center of the X is missing, because optically(Fig. 9).thick foreground emission is resolved out by OVRO. This isÐlled in by H13CO`, which shows a core elongated perpen-dicular to the outÑow direction et al. The(Kitamura 1997).velocity extent of 3 km s~1 is similar to the single-dish linewidth, as is the overall shape of the line proÐle. Due to itslower resolution, the single-dish HCO` 1È0 map obtainedwith the IRAM 30 m shows no trace of the cross seen byOVRO, but only a core elongated in the direction of theoutÑow. In 13CO, a bow-tieÈshaped core is detected, Ðllingin the central region where HCO` emission is opticallythick. No C18O emission is detected at the attained noiselevel. The total mass traced by 13CO is 0.005È0.03 M
_,
depending on the ill-constrained opacity, and consistentwith the 0.03 inferred in from the dust contin-M
_Paper I
uum. et al. detected an elongated core inOhashi (1997a)C18O with higher sensitivity Nobeyama Millimeter Arrayobservations, and inferred a mass of 0.04 Evans,M
_. Zhou,
& Wang Ðnd 0.7 including zero-spacing infor-(1996) M_
,mation, while Ladd, & Hodapp infer 0.20ÈFuller, (1996)0.46 from single-dish observations. The increased massM
_inferred over larger size scales, which are resolved out bythe interferometer, indicates the presence of signiÐcantamounts of material around this deeply embedded source.K@ emission is only detected 20A east of the source, coin-cident with the blue outÑow lobe see also(Fig. 10 ; Tamuraet al. 1991).
5.1.9. T MC 1
The HCO`, 13CO, and C18O emission toward thissource shows a wedge-shaped core o†set to the east of thecontinuum position, with a mass of 0.007, comparable tothe dust mass of 0.005È0.016 from The velocityM
_Paper I.
width of the OVRO and single-dish HCO` are small (D1km s~1), with OVRO recovering D40% of the single-dishHCO` Ñux. Similar, slightly elongated cores perpendicularto the outÑow are seen in the single-dish HCO` 1È0, 3È2,and 4È3 maps These cores are interpreted as part of(Fig. 3).a rotating circumstellar envelope of D2500 AU radius, ofwhich the western, slightly redshifted half is obscured by
optically thick foreground material. All HCO` emission isblueshifted with respect to the systemic velocity of 5.2 kms~1, indicating a central stellar mass of D0.8 whenM
_interpreted as Keplerian rotation and assuming an inclina-tion of 55¡ This is much more than the 0.15(Fig. 11). M
_inferred from which may be underestimated because ofL bol,the deeply embedded nature of TMC 1 (cf. et al.Yorkeas evidenced by the large line opacities.1995),
Additional HCO` emission is seen coincident with thesouthern redshifted outÑow lobe. The emission occurs at a
of 4.9 km s~1, blueshifted by only 0.3 km s~1 from theVLSRsystemic velocity, indicating that it traces material in thecavity wall rather than entrained in the outÑow. Weak K@emission is seen to coincide with the base of the blueoutÑow lobe (Fig. 10).
5.2. General TrendsThe interpretation of the OVRO molecular line data is
complicated by the missing short-spacing Ñuxes, resulting inthe absence of all extended emission, and by the often sig-niÐcant opacity in the HCO` and 13CO lines. However, theobservations can be explained in terms of the followingcomponents : a core of semimajor axis AU around[1000the star, which may be Ñattened or rotating, condensationsscattered throughout the envelope, and material within theoutÑow or along the outÑow cavity walls. Several of thesecomponents are also identiÐed in millimeter line aperturesynthesis observations of other embedded YSOs by, e.g.,
Velusamy, & Xie for B5 IRS 1, et al.Langer, (1996) Guethfor L1157, and et al. for B1.(1997) Hirano (1997)
Cores surrounding the central star are most clearly seenin HCO` around L1489 IRS, and in C18O toward L1551IRS 5. Toward TMC 1 only the western, blueshifted half ofa rotating envelope appears to be present in HCO`. Theother half may be obscured by optically thick foregroundmaterial. TMC 1A only shows the eastern, redshifted half,while for L1527 IRS this component is traced by C18O 1È0in the higher signal-to-noise ratio data of et al.Ohashi
and the H13CO` data of et al. The(1997a) Kitamura (1997).masses of these cores are typically a few times 10~3 butM
_,
as high as 0.1 for L1551 IRS 5, and amount to 20%ÈM_100% of the material sampled by the single-dish 1.1 mm
continuum observations. The velocity gradients perpen-dicular to the outÑow direction to L1489 IRS, L1551 IRS 5,TMC 1A, and TMC 1 are suggestive of rotation, but couldalso contain contributions from infalling or outÑowingmaterial.
Around T Tau, L1551 IRS 5, L1535 IRS, and TMR 1, theinterferometer observations pick up condensations scat-tered throughout the envelopes in HCO` and 13CO. Thesemay be inhomogeneities left over from the original cloudcore, or that have grown during the collapse phase. Often,they correlate with bright or dark patches in the K@ image,depending on their location in front of or behind theoutÑow cavity. For example, the reÑection nebula NGC1555 to the southwest of T Tau coincides with a peak inHCO` ; the HCO` emission regions around L1551 IRS 5seem to correspond to clumps of enhanced extinction,tracing out the comma-shaped K@ emission ; and the patchesof scattered light around TMR 1 all correlate with featuresin HCO` emission.
A number of sources shows emission in the interferome-ter that is associated with, but not necessarily entrained in,the outÑow. This is seen toward L1527 IRS, where the

No. 1, 1998 ENVELOPE STRUCTURE AND OUTFLOWS OF LOW-MASS YSOs 335
HCO` outlines the 12CO 3È2 in detail, but also towardL1551 IRS 5, where the 13CO and C18O emission curvesaround the base of the southwest outÑow, and toward TMC1, where HCO` emission coincides with the southernoutÑow lobe. All this emission is within 1È2 km s~1 of thesystemic velocity, and is probably not entrained within theoutÑow. Instead, it traces material in the walls of theoutÑow cavity that is compressed or heated by the outÑow.The amount of material incorporated in the bright cavitywalls toward L1527 IRS is estimated at no more than a fewpercent of the total envelope mass. Although the HCO`Ñux in the OVRO beam amounts to 30%È50% of the 30Asingle-dish value, the optical depth of 10È30 obscures theinner envelope, which is recovered in H13CO` (Kitamuraet al. and which contains most of the mass. The1997),prominence of the cavity walls in HCO` is probably due toincreased temperature or density, revealing the interactionof the outÑow with the surrounding envelope material.Alternatively, the temperature in these walls may beincreased through ultraviolet photons originating from thestar-disk boundary layer, which scatter from the cavity (cf.
et al. In this case, the role of the outÑow isSpaans 1995).limited to clearing a low-opacity pathway for the heatingphotons.
Toward a few sources, red or blueshifted 13CO and C18Oemission is picked up, associated with material entrained inthe outÑow. The C18O position-velocity diagram of L1551IRS 5 shows a high-velocity tail that may be associated withgas at the base of the outÑow. Similar high-velocity tailsmay be present in the HCO` position-velocity diagram ofL1489 IRS. The 13CO and C18O emission toward TMC 1Ais entirely blueshifted by 2È3 km s~1. Interferometer obser-vations of 12CO lines of a number of YSOs clearly show thepresence of material entrained within the outÑow (e.g., B5IRS 1, Velusamy, & Xie B1, et al.Langer, 1996 ; Hirano1997).
6. SUMMARY
The 700 AU scale structure of the envelopes around asample of nine embedded, low-mass YSOs is investigated bymillimeter aperture synthesis imaging of HCO`, 13CO, andC18O 1È0. These observations are complemented by single-dish observations of 12CO 6È5 and 4È3, 13CO 6È5 and 3È2,and C18O 3È2 and 2È1 to constrain line opacity and excita-tion conditions, and 12CO 3È2 maps with 15A resolution toillustrate the connection between envelopes and outÑows.Our main conclusions can be summarized as follows :
1. Compact emission in HCO`, 13CO, and C18O isclearly detected toward all sources, except for Haro 6È10,which lacks central condensation in its envelope. Molecularmasses of 0.001È0.1 are inferred and are found to beM
_comparable to the masses traced by 1.1 mm single-dishcontinuum measurements. Together with the similarly sizedregions traced in HCO` 1È0 by OVRO, and in HCO` 3È2and 4È3 by the JCMT, this Ðrmly supports the conclusionof that the latter are a reliable probe of the innerPaper Ienvelopes.
2. The OVRO line observations can be understood interms of three components : (1) A core of radius D1000 AU,with masses in good agreement with those inferred from 1mm single-dish dust continuum measurements. This coremay be Ñattened and rotating. (2) Condensations scatteredthroughout the core, possibly left over from the inhomoge-
neous structure of the original cloud, and which may havegrown during collapse. (3) Material within the outÑow oralong the cavity walls. A fourth component, an unresolved(\3A) circumstellar disk, is detected by OVRO measure-ments of the 3.4 and 2.7 mm continuum emission (Paper I).Higher resolution imaging at subarsecond resolution withan array in which the short spacings are recovered is essen-tial to further investigate the physical and chemical struc-ture of these envelopes.
3. On the scales sampled by the OVRO measurements,the HCO` abundance may be increased by a factor of a fewon average compared to the single-dish observations from
Part of this increase can be explained by contami-Paper I.nation arising from extended cloud C18O emission in thesingle-dish beam, and the assumed excitation temperaturesand opacities. Our results indicate that HCO` is muchbetter suited to trace small-scale structure around YSOsthan, e.g., CS (cf. et al. Over an area ofOhashi 1996b).20A ] 20A, an HCO` abundance of 4 ] 10~8 is obtained,with a spread of a factor of 3 between di†erent sources. Atleast part of this spread is likely to be caused by opacitye†ects, which have only been approximately corrected for(see Interferometer observations of H13CO` are° 3).required to obtain more accurate estimates of the abun-dance.
4. All objects are associated with outÑow emission, butthe 12CO 3È2 outÑows of two-thirds of the sample areremarkably small at \1@, as compared to L1551 IRS 5 (10@)and L1527 IRS (3@). The inclination- and opacity-correctedoutÑow momentum rate, and kinetic luminosity,FCO, L kin,are in excellent agreement with previous studies of compa-rable samples of YSOs et al.(CB92, Saraceno 1996 ;
et al. and show a tight correlation withBontemps 1996),envelope mass. This relationship can be followed down tothe scale of the circumstellar disk, supporting the interpre-tation that more massive and denser envelopes have alarger mass infall rate, and hence drive a more powerfuloutÑow. Over the time span extending from deeply embed-ded class 0 sources to revealed T Tauri stars, age is expectedto inÑuence the outÑow. However, within our sample ofembedded objects of similar evolutionary state, the smalldi†erence in relative age is not correlated with outÑowforce.
5. The association of compact HCO` with the outÑowcavity walls toward, e.g., L1527 IRS indicates that the out-Ñows, in turn, are involved in shaping the envelopes. Nomore than a few percent of the total amount of envelopematerial is estimated to be incorporated in these cavitywalls. It is not yet clear how important the outÑows are inactually dispersing the YSO surroundings, or whether theymerely provide a low-opacity pathway for heating radiationto reach into the envelope.
The authors wish to thank the sta†s of the JCMT, CSO,IRAM 30 m, and OVRO telescopes for their assistance.Remo Tilanus and Fred Baas are thanked for carrying outpart of the JCMT observations. Jocelyn Keene kindlyassisted in calibrating the CSO data. Lee Mundy is acknow-ledged for useful discussions. M. R. H. is indebted to theCaltech Divisions of Geological and Planetary Sciences andMathematics, Physics and Astronomy, and the OwensValley Radio Observatory for hospitality, and to theNetherlands Organization for ScientiÐc Research (NWO)and the Leids Kerkhoven-Bosscha Fonds for travel

336 HOGERHEIJDE ET AL.
support. Research in Astrochemistry in Leiden is supportedby NWO/NFRA through grant 781-76-015. G. A. B. grate-fully acknowledges support provided by NASA grantsNAGW-2297 and NAGW-1955. H. J. v. L. acknowledges
support for his research from the European Union undercontract CHGECT920011. The referee is thanked for pro-viding constructive comments that improved the manu-script.
REFERENCESR. 1996, ARA&A, 34,Bachiller, 111S., Andre� , Ph., Terebey, S., & Cabrit, S. 1996, A&A, 311,Bontemps, 858
A. P. 1993, ApJ, 410,Boss, 157S., & Andre� , Ph. 1991, ApJ, 379,Cabrit, L25S., & Bertout, C. 1990, ApJ, 348,Cabrit, 5301992, A&A, 261, 274ÈÈÈ. (CB92)
C. J., Terebey, S., Barsony, M., Moore, T. J. T., & Gautier, T. N.Chandler,1996, ApJ, 471, 308
M., Emerson, J. P., & Beichman, C. A. 1989, ApJ, 339,Cohen, 455S., & Snell, R. L. 1982, ApJ, 261,Edwards, 151
R. A., & Mouschovias, T. C. 1992, ApJ, 391,Fiedler, 1991993, ApJ, 415,ÈÈÈ. 680D. R., & Launay, J. M. 1985, MNRAS, 214,Flower, 271
M. A., & Langer, W. D. 1982, ApJ, 256,Frerking, 523G. A., Ladd, E. F., & Hodapp, K.-W. 1996, ApJ, 463,Fuller, L97
D., & Shu, F. H. 1993, ApJ, 417,Galli, 220E. M., Evans, N. J., II, Zhou, S., & Choi, M. 1997, ApJ, 484,Gregersen, 256
F., Guilloteau, S., Dutrey, A., & Bachiller, R. 1997, A&A, inGueth, pressM., Hasegawa, T., Ohashi, N., & Sunada, K. 1994, ApJ, 426,Hayashi, 234
T. M., Koresko, C. D., & Leinert, Ch. 1995, ApJ, 444,Herbst, L93T. M., Robberto, M., & Beckwith, S. V. W. 1997, AJ, 114,Herbst, 744W., et al. 1986, ApJ, 310,Herbst, L71N., Kameya, O., Mikami, H., Saito, S., Umemoto, T., & Yama-Hirano,
moto, S. 1997, ApJ, 478, 631K.-W. 1994, ApJS, 94,Hodapp, 615
M. R., de Geus, E. J., Spaans, M., van Langevelde, H. J., &Hogerheijde,van Dishoeck, E. F. 1995, ApJ, 441, L93
M. R., van Dishoeck, E. F., Blake, G. A., & van Langevelde,Hogerheijde,H. J. 1997a, ApJ, 489, 293 (Paper I)
M. R., van Langevelde, H. J., Mundy, L. G., Blake, G. A., &Hogerheijde,van Dishoeck, E. F. 1997b, ApJ, 490, L99
S. J., & Hartmann, L. 1995, ApJS, 101,Kenyon, 117S. J., Whitney, B. A., Gomez, M., & Hartmann, L. 1993, ApJ, 414,Kenyon,
773Y., Kawabe, R., Yamashita, T., & Hayashi, M. 1990, ApJ, 363,Kitamura,
180Y., Saito, M., Kawabe, R., & Sunada, K. 1997, in IAU Symp.Kitamura,
182, Herbig-Haro Flows and the Birth of Stars, ed. B. Reipurt &C. Bertout (Dordrecht : Kluwer), 381
A., & Ruden, S. P. 1993, in Protostars and Planets III, ed. E. H.Ko� nigl,Levy & J. I. Lunine (Tucson : Univ. Arizona), 641
C. D., Herbst, T. M., & Leinert, Ch. 1997, ApJ, 480,Koresko, 741W. D., & Penzias, A. A. 1990, ApJ, 357,Langer, 477W. D., Velusamy, T., & Xie, T. 1996, ApJ, 468,Langer, L41
Z.-Y., & Shu, F. H. 1996, ApJ, 472,Li, 211L. W., Mundy, L. G., & Welch, W. J. 1997, ApJ, 484,Looney, L157
P. W., & Roche, P. F. 1997, MNRAS, 286,Lucas, 895R., & Liszt, H. 1996, A&A, 307,Lucas, 237
J., Lorne, A., Harris, A., Tacconi, L., & Schuster, K. 1994,MacLeod,JCMT Newsletter, Sep/Oct, 46
D., Myers, P. C., Tafalla, M., Wilner, D. J., Bachiller, R., &Mardones,Garay, G. 1997, ApJ, 489, 719
T. J., Bennett, A., Rawlings, J. M. C., Brown, P. D., & Charnley,Millar,S. B. 1991, A&AS, 87, 585
N. R., Ward-Thompson, D., & White, G. J. 1995, A&A, 298,Minchin, 894A., Ohishi, T., Hayashi, M., Ohashi, N., Sunada, K., Hasegawa,Mizuno,
T., & Fukui, Y. 1994, Nature, 368, 719M., Ohashi, N., Kawabe, R., Hayashi, M., & Nakano, T. 1996,Momose,
ApJ, 470, 1001
G. H., & Snell, R. L. 1988, ApJ, 332,Moriarty-Schieven, 364G. H., Wannier, P. G., Mangum, J. G., Tamura, M., &Moriarty-Schieven,
Olmsted, V. K. 1995, ApJ, 455, 190G. H., Wannier, P. G., Tamura, M., & Keene, J. 1992,Moriarty-Schieven,
ApJ, 400, 260R., Stocke, J., Strom, S. E., Strom, K. M., & Anderson, E. R. 1985,Mundt,
ApJ, 297, L41N., Hayashi, M., Ho, P. T. P., & Momose, M. 1997a, ApJ, 475,Ohashi, 211N., Hayashi, M., Ho, P. T. P., Momose, M., & Hirano, N. 1996a,Ohashi,
ApJ, 466, 957N., Hayashi, M., Ho, P. T. P., Momose, M., Tamura, M., Hirano,Ohashi,
N., & Sargent, A. I. 1997b, ApJ, 488, 317N., Hayashi, M., Kawabe, R., & Ishiguro, M. 1996b, ApJ, 466,Ohashi, 317R., Bence, S. J., & Richer, J. S. 1997, in IAU Symp. 182, Herbig-Padman,
Haro Flows and the Birth of Low-Mass Stars, ed. B. Reipurth &C. Bertout (Dordrecht : Kluwer), 123
F., & Stahler, S. W. 1993, ApJ, 418,Palla, 414A., & Cabrit, S. 1993, A&A, 278,Raga, 267
A. L. 1992, ApJ, 397,Rudolph, L111M., Kawabe, R., Kitamura, Y., & Sunada, K. 1996, ApJ, 473,Saito, 464
P., Andre� , Ph., Ceccarelli, C., Griffin, M., & Molinari, S. 1996,Saraceno,A&A, 309, 827
A. I., Keene, J., Masson, C., & Beckwith, S. 1988, ApJ, 333,Sargent, 936R., Engel, V., Buck, U., Meyer, H., & Diercksen, G. H. F. 1985,Schinke,
ApJ, 299, 939K.-F., Harris, A. I., Andersen, N., & Russel, A. P. G. 1993, ApJ,Schuster,
412, L67K.-F., Harris, A. I., & Russell, A. P. G. 1997, A&A, 321,Schuster, 568N. Z., Carlstrom, J. E., Chandler, C. J., Phillips, J. A., Scott, S. L.,Scoville,
Tilanus, R. P. J., & Wang, Z. 1993, PASP, 105, 1482N. Z., Sargent, A. I., Sanders, D. B., & Claussen, M. J. 1986, ApJ,Scoville,
303, 416F. H. 1977, ApJ, 214,Shu, 488F. H., Najita, J., Galli, D., Ostriker, E., & Lizano, S. 1993, in Proto-Shu,
stars and Planets III, ed. E. H. Levy & J. I. Lunine (Tucson : Univ.Arizona Press), 3
R. L., Loren, R. B., & Plambeck, R. L. 1980, ApJ, 239,Snell, L17M., Hogerheijde, M. R., Mundy, L. G., & van Dishoeck, E. F.Spaans,
1995, ApJ, 455, L167S. W. 1988, ApJ, 332,Stahler, 804K. M., Strom, S. E., Wenz, M., Wol†, S. C., & Morgan, J. 1986,Strom,
ApJS, 62, 39M., Gatley, I., Waller, W., & Werner, M. W. 1991, ApJ, 374,Tamura, L25M., Ohashi, N., Hirano, N., Itoh, Y., & Moriarty-Schieven, G. H.Tamura,
1996, AJ, 112, 2076S., Beichman, C. A., Gautier, N., & Hester, J. J. 1990, ApJ, 362,Terebey, 63S., Chandler, C. J., & Andre� , Ph. 1993, ApJ, 414,Terebey, 759S., Shu, F. H., & Cassen, P. 1984, ApJ, 286,Terebey, 529S., Vogel, S. N., & Myers, P. C. 1989, ApJ, 340,Terebey, 472
Langevelde, H. J., van Dishoeck, E. F., & Blake, G. A. 1994a, ApJ, 425,vanL45
Langevelde, H. J., van Dishoeck, E. F., van der Werf, P. P., & Blake,vanG. A. 1994b, A&A, 287, L25
T., Kuiper, T. B. H., & Langer, W. D. 1995, ApJ, 451,Velusamy, L75B. A., Kenyon, S. J., & Go� mez, M. 1997, ApJ, 485,Whitney, 703
D. J., & Welch, W. J. 1994, ApJ, 427,Wilner, 898H. W., Bodenheimer, P., & Laughlin, G. 1995, ApJ, 443,Yorke, 199S., Evans, N. J., II, & Wang, Y. 1996, ApJ, 466,Zhou, 296
Note added in proof.ÈAfter this manuscript was accepted, more detailed modeling of the molecular line excitation andradiative transfer was carried out. This shows that the HCO` abundance as derived in may be overestimated by a factor of° 3a few because of the di†erent levels of resolved-out, large-scale emission in C18O and HCO`, respectively. Therefore, ourconclusion that HCO` may be enhanced on small scales needs further analysis. This does not a†ect any of our otherconclusions, or the main bearing of the paper.