50/bulletin_issue_50.pdfredakcija / editorial board . editor-in-chief / glavni i odgovorni urednik...
TRANSCRIPT
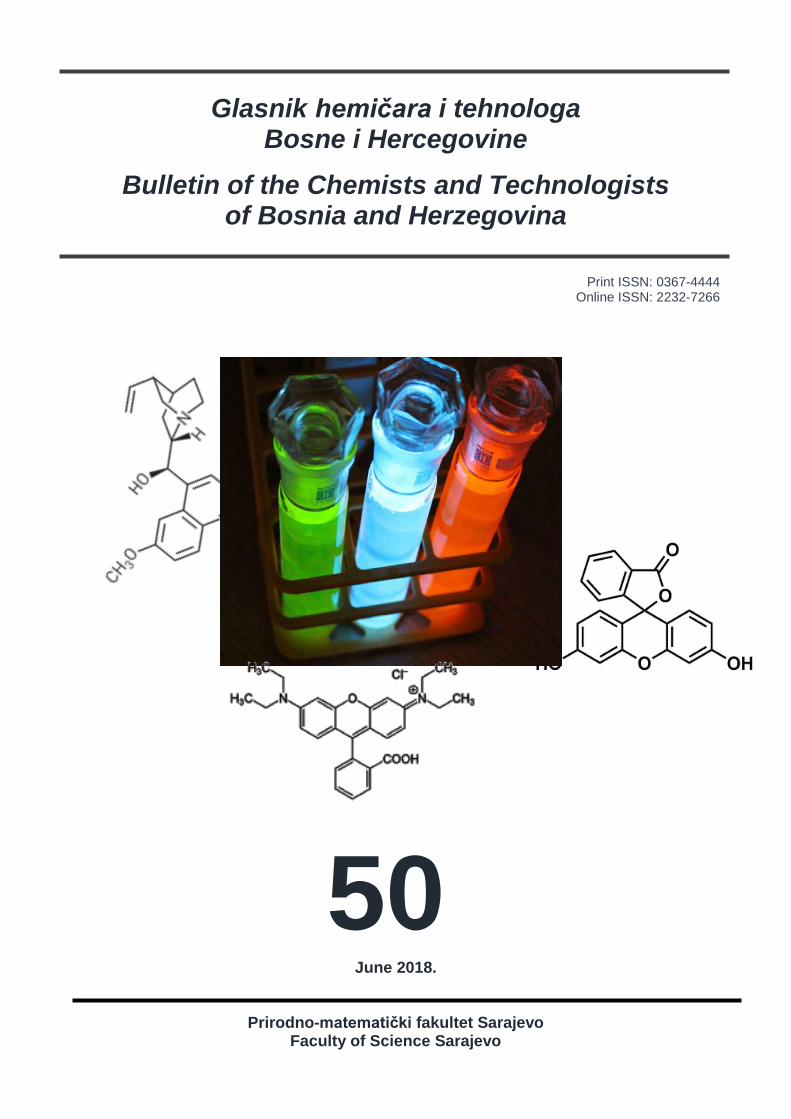
Glasnik hemičara i tehnologa Bosne i Hercegovine
Bulletin of the Chemists and Technologists of Bosnia and Herzegovina
June 2018.
Prirodno-matematički fakultet Sarajevo Faculty of Science Sarajevo
Print ISSN: 0367-4444 Online ISSN: 2232-7266
50


Glasnik hemičara i tehnologa Bosne i Hercegovine
Bulletin of the Chemists and Technologists of Bosnia and Herzegovina
June 2018.
Prirodno-matematički fakultet Sarajevo Faculty of Science Sarajevo
Print ISSN: 0367-4444 Online ISSN: 2232-7266
50

REDAKCIJA / EDITORIAL BOARD Editor-In-Chief / Glavni i odgovorni urednik Fehim Korać
Faculty of Science Sarajevo Zmaja od Bosne 33-35, BA-Sarajevo
Bosnia and Herzegovina
E-mail: [email protected] [email protected]
Phone: +387-33-279-995 (Administration)
+387-33-279-911 (Executive Editors) Fax: +387-33-649-359
Editors / Urednici Milka Maksimović ([email protected]) Emin Sofić ([email protected]) Semira Galijašević ([email protected]) Nurudin Avdić ([email protected]) Editorial Board / Članovi redakcijskog odbora Ivan Gutman (SRB) Dejan Milošević (B&H) Željko Jaćimović (MNE) Ljudmila Benedikt (SLO) Meliha Zejnilagić-Hajrić (B&H) Amira Čopra-Janićijević (B&H) Tidža Muhić-Šarac (B&H) Sabina Gojak-Salimović (B&H) Jasna Huremović (B&H) Emira Kahrović (B&H) Ismet Tahirović (B&H) Danijela Vidic (B&H) Mustafa Memić (B&H) Andrea Gambaro (ITA) Dragana Đorđević (SRB) Aida Šapčanin (B&H) Jože Kotnik (SLO) Lucyna Samek (POL) Angela Maria Stortini (ITA) Ivan Spanik (SLK) Mirjana Vojinović Miloradov (SRB) Heike Bradl (GER) Lea Kukoč (CRO) Sanja Ćavar-Zeljković (CZE)
Bulletin of the Chemists and Technologists of Bosnia and Herzegovina
Print ISSN: 0367-4444
Online ISSN: 2232-7266
Zmaja od Bosne 33-35, BA-Sarajevo Bosnia and Herzegovina
Phone: +387-33-279-918 Fax: +387-33-649-359
E-mail: [email protected] [email protected]

Advisory Editorial Board / Članovi redakcijskog savjeta Margareta Vrtačnik (SLO) Alen Hadžović (CAN) Franci Kovač (SLO) Franc Požgan (SLO) Mladen Miloš (CRO) Mirjana Metikoš (CRO) Lectors / Lektori Semira Galijašević (Eng/B/H/S) Milka Maksimović (Eng/B/H/S) Administrative Assistants / Sekretari redakcije Safija Herenda Alisa Selović Electronic Edition and Executive Editors / Elektronsko izdanje i izvršni redaktori Anela Topčagić Jelena Ostojić Časopis izlazi polugodišnje, a kompletna tekst verzija objavljenih radova je dostupna na http://www.pmf.unsa.ba/hemija/glasnik. The journal is published semiannual, and full text version of the papers published are available free of cost at http://www.pmf.unsa.ba/hemija/glasnik. Citiran u Chemical Abstracts Service. Cited by Chemical Abstracts Service. Citiran u EBSCO Host. Cited by EBSCO Host.
www.cas.org
Ije
CONTENT Editorial I ORIGINAL SCIENTIFIC ARTICLES HPLC method for determination the content of thymol and carvacrol in Thyme tincture
1-6
Dedić Mirza Bečić Ervina Imamović Belma Žiga Nermina Medanhodžić-Vuk Saira Šober Miroslav
The effects of a context-rich approach in teaching thermodynamics
7-12
Mahmutović Sabaheta Mešić Vanes
Hemoglobin HbA1c and glucose blood levels in diabetic patients 13-18 Tahirović Ismet Mahovac Enesa Dizdar Muamer Toromanović Jasmin Mahmutović Omer Lepara Zahid Ajanović Atifa
Bulletin of the Chemists and Technologists of Bosnia and Herzegovina
Print ISSN: 0367-4444
Online ISSN: 2232-7266
2018 Issue 50

Bulletin of the Chemists and Technologists of Bosnia and Herzegovina
Effect of solvents on phenolic compounds extraction and antioxidant activity of Prunus spinosa L. fruits
19-24
Tahirović Azra Bašić Neđad Čopra-Janićijević Amira
DPPH (µmolTE/g)
ABTS (µmolTE/g)
FRAP (µmolTE/g)
F(W) 80.59±0.16 85.95±0.36 107.80±0.38
F(M50) 127.24±0.23 209.54±0.51 227.00±0.53 F(E50) 140.80±0.1 223.98±0.86 249.13±0.71 F(M80) 118.37±0.14 171.68±0.34 193.19±0.21 F(E80) 115.12±0.14 127.60±0.18 190.04±0.53
Gender differences in understanding of thermal expansion 25-30
Vidak Andrej
Influence of the delta ferrite content on the corrosion behavior of austenitic stainless steel Nitronic 60
31-34
Gigović-Gekić Almaida Bikić Farzet Avdušinović Hasan
Bulletin of the Chemists and Technologists of Bosnia and Herzegovina
Correlation between hemoglobin A1c and lipid profile in Bosnian diabetic patients - gender differences
35-42
Mandal Šaćira Čaušević Adlija
Chemical characterization, antimicrobial and antioxidant properties of Mentha spicata L. (Lamiaceae) essential oil 43-48
Nikšić Haris Durić Kemal Omeragić Elma Nikšić Hedija Muratović Samija Bečić Fahir
Source Concentracion (µg/ml)
7,40 14,80 29,60 44,40 IC50
M. spicata
24,27 30,10 42,72 51,55 41,23
Trolox 3,53
Determination of clindamycin hydrochloride content in 1% clindamycin lotion 49-54
Dedić Mirza Bečić Ervina Imamović Belma Žiga Nermina
Review Application of Photochemistry Principles, Models, and Simulations in the Study of Gaseous Components of Space Bodies and Interstellar Matter with Recent Developments
55-60
Krečo Anes Biščević Helena Handžić Azra Gojak-Salimović Sabina

Bulletin of the Chemists and Technologists of Bosnia and Herzegovina
Odluke Društva kemičara i tehnologa Kantona sarajevo 61
Instructions for authors 81
Sponsors 89

Bulletin of the Chemists and Technologists of Bosnia and Herzegovina
Editorial
INTERNATIONAL DAY OF LIGHT
Advances in science in the 21st century represent a continuing challenge for advancement of civilization, improvement in the quality of life but also survival of mankind as a whole. The boundaries between distinct natural sciences in frontier research are becoming more and more blurry as the multidisciplinary approach encompasses the problem from different angles and specifics points while progressing to the same goal, whether it be medicine, industry, space exploration etc. The task of meeting these ever-increasing challenges and adapting to the new situations is left for the new generations of scientists and engineers that are only starting their life-long journey. In the effort to further promote science among youth UN have taken up numerous programs in popularization of STEM (Science, technology, engineering, mathematics). The International Day of Light (IDL) was declared by UNESCO and as of 2018 it is being annually marked on 16th of May in the honor of anniversary of first successful operation of a laser by Theodore H. Maiman in 1960. The IDL is an initiative on a global scale with the aim of raising mankind’s knowledge of light, its properties and application everyday life of each and every one on this planet and through it further promote UNESCO goals of peace and education. Light phenomena are unique in its appeal to youth through spectacular experiments and demonstrations that can be conducted with very simple setups in everyday environments. The IDL was celebrated this year for the first time around the world and has been a great success with hundreds of events being organized throughout the month of May. 1Many high-profile institutions have taken part such as Parliaments of Sweden and Republic of Korea, in Ghana first Museum of Light was inaugurated and Auckland Harbor Bridge in New Zealand was lit in commemoration of the IDL. Institutions in Bosnia and Herzegovina have also taken part in these celebrations and Society of Chemists and Technologists of Canton Sarajevo has had the honor of being a national node for the events in our country.
1 https://www.lightday.org/idl-16-may-celebration
Editors


HPLC method for determination the content of thymol and carvacrol
in Thyme tincture
Dedić, M.a*, Bečić, E.a, Imamović, B.a, Žiga, N.b, Medanhodžić-Vuk, S.c, Šober, M.a
a Faculty of Pharmacy University of Sarajevo, Department for Pharmaceutical Analytics, Zmaja od Bosne 8, 71000
Sarajevo, Bosnia and Herczegovina b Faculty of Pharmacy University of Sarajevo, Department for Clinical Pharmacy, Zmaja od Bosne 8, 71000
Sarajevo,Bosnia and Herczegovina cPharmamed doo Travnik, Dolac na Lašvi bb Travnik, Bosna i Hercegovina
INTRODUCTION Thymol and carvacrol in Thymus vulgaris L. Due to the increasing prevalence of resistance to antibiotics, the resorting to treatment with traditional methods is increasing, such as use of herbal remedies with antibacterial effect (Kon and Rai, 2012; Shabnum and Wagay, 2011). Genus Thymus contains about 300-400 species, many of which are used in folk medicine. The most commonly used Thymus genus is Thymus vulgaris (Hajimehdipoor, Shekarchi, Khanavi, et al., 2010; Zeković, Lepojević, Markov, 2002). Thymus (Thymus vulgaris L., Lamiaceae)
is an aromatic and medicinal plant used in the production of phytopharmaceutical preparations as a preservative and as an aromatic component (Hajimehdipoor, Shekarchi, Khanavi, et al, 2010; Grigore, Paraschiv, Colceru-Mihul et al, 2010). Most commonly they are prepared as water extracts (infusum and decoct), as well as tinctures, which are used in respiratory infections. Water extracts can also be used externally, locally, for the treatment of rheumatic and skin diseases (Fachini-Queiroz, Kummer, Estevao-Silva, et al., 2012; Zeković, 2000; Zeković, Lepojević, Markov, 2002). In official medicine, thyme is used as a general remedy for colds, flu, fever, cough and bronchitis such as:
Bulletin of the Chemists and Technologists of Bosnia and Herzegovina
Print ISSN: 0367-4444
Online ISSN: 2232-7266
2018
50
1-6 UDC: __________________________
Original Scientific Article
Article info Received: 10/04/2018 Accepted: 06/06/2018 Keywords: Thyme Thymol Carvacrol Validation Thyme Tincture
*Corresponding author: E-mail: [email protected] Phone: +38761349288
Abstract: Genus Thymus contains about 300-400 species, many of which are used in
traditional medicine. Thymus vulgaris (thyme) is the most commonly used Thymus. In
official medicine, thyme is used as a general medicine for colds, flu, fever, coughing and
bronchitis, such as: an antiseptic, spasmolytic, antifungicide, antitus, tonic, antihelmintic,
antioxidant agent, antivirantic agent, carminative, sedative, diaforetic, antibacterial and as
refresh remedy. The pharmacological effects of thyme are most closely related to its
polyphenolic components, thymol and carvacrol. The most used chromatographic methods
for determination of active compounds in herbal preparation is high-performance liquid
chromatography. Results obtained by statistical processing are in the reference interval,
which is recommended by the ICH guidelines. By analyzing Thymi tincturae, it was found
that the concentration of thymols was 0.807 mg/g of tincture, while the concentration of
carvacrol was 0.082 mg/g tincture. This analysis is very fast, reliable and economical.
The method does not require a complicated sample preparation and as such can be used in
the regular control of the content of thymol and carvacrol in the finished product and the
semi-product (tincture).
2 Dedić et al.
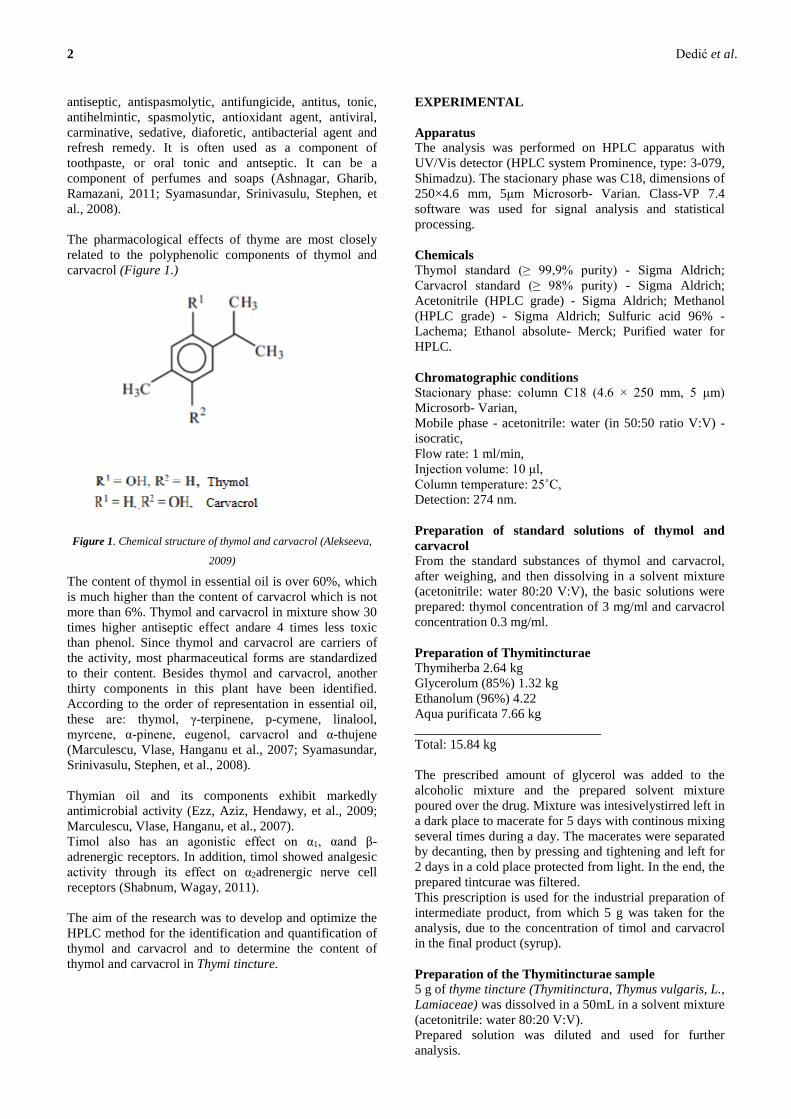
antiseptic, antispasmolytic, antifungicide, antitus, tonic, antihelmintic, spasmolytic, antioxidant agent, antiviral, carminative, sedative, diaforetic, antibacterial agent and refresh remedy. It is often used as a component of toothpaste, or oral tonic and antseptic. It can be a component of perfumes and soaps (Ashnagar, Gharib, Ramazani, 2011; Syamasundar, Srinivasulu, Stephen, et al., 2008). The pharmacological effects of thyme are most closely related to the polyphenolic components of thymol and carvacrol (Figure 1.)
Figure 1. Chemical structure of thymol and carvacrol (Alekseeva,
2009)
The content of thymol in essential oil is over 60%, which is much higher than the content of carvacrol which is not more than 6%. Thymol and carvacrol in mixture show 30 times higher antiseptic effect andare 4 times less toxic than phenol. Since thymol and carvacrol are carriers of the activity, most pharmaceutical forms are standardized to their content. Besides thymol and carvacrol, another thirty components in this plant have been identified. According to the order of representation in essential oil, these are: thymol, γ-terpinene, p-cymene, linalool, myrcene, α-pinene, eugenol, carvacrol and α-thujene (Marculescu, Vlase, Hanganu et al., 2007; Syamasundar, Srinivasulu, Stephen, et al., 2008). Thymian oil and its components exhibit markedly antimicrobial activity (Ezz, Aziz, Hendawy, et al., 2009; Marculescu, Vlase, Hanganu, et al., 2007). Timol also has an agonistic effect on α1, αand β-adrenergic receptors. In addition, timol showed analgesic activity through its effect on α2adrenergic nerve cell receptors (Shabnum, Wagay, 2011). The aim of the research was to develop and optimize the HPLC method for the identification and quantification of thymol and carvacrol and to determine the content of thymol and carvacrol in Thymi tincture.
EXPERIMENTAL Apparatus The analysis was performed on HPLC apparatus with UV/Vis detector (HPLC system Prominence, type: 3-079, Shimadzu). The stacionary phase was C18, dimensions of 250×4.6 mm, 5μm Microsorb- Varian. Class-VP 7.4 software was used for signal analysis and statistical processing. Chemicals Thymol standard (≥ 99,9% purity) - Sigma Aldrich; Carvacrol standard (≥ 98% purity) - Sigma Aldrich; Acetonitrile (HPLC grade) - Sigma Aldrich; Methanol (HPLC grade) - Sigma Aldrich; Sulfuric acid 96% - Lachema; Ethanol absolute- Merck; Purified water for HPLC. Chromatographic conditions Stacionary phase: column C18 (4.6 × 250 mm, 5 μm) Microsorb- Varian, Mobile phase - acetonitrile: water (in 50:50 ratio V:V) - isocratic, Flow rate: 1 ml/min, Injection volume: 10 μl, Column temperature: 25˚C, Detection: 274 nm. Preparation of standard solutions of thymol and carvacrol From the standard substances of thymol and carvacrol, after weighing, and then dissolving in a solvent mixture (acetonitrile: water 80:20 V:V), the basic solutions were prepared: thymol concentration of 3 mg/ml and carvacrol concentration 0.3 mg/ml. Preparation of Thymitincturae Thymiherba 2.64 kg Glycerolum (85%) 1.32 kg Ethanolum (96%) 4.22 Aqua purificata 7.66 kg ____________________________ Total: 15.84 kg The prescribed amount of glycerol was added to the alcoholic mixture and the prepared solvent mixture poured over the drug. Mixture was intesivelystirred left in a dark place to macerate for 5 days with continous mixing several times during a day. The macerates were separated by decanting, then by pressing and tightening and left for 2 days in a cold place protected from light. In the end, the prepared tintcurae was filtered. This prescription is used for the industrial preparation of intermediate product, from which 5 g was taken for the analysis, due to the concentration of timol and carvacrol in the final product (syrup). Preparation of the Thymitincturae sample 5 g of thyme tincture (Thymitinctura, Thymus vulgaris, L., Lamiaceae) was dissolved in a 50mL in a solvent mixture (acetonitrile: water 80:20 V:V). Prepared solution was diluted and used for further analysis.

Bulletin of the Chemists and Technologists of Bosnia and Herzegovina 2018, 50, 1-6 3
RESULTS AND DISCUSSION
HPLC method was devloped and optimized for identification and quantification of thymol and carvacrol in the thyme tincture (Hajimehdipoor, Shekarchi, Khanavi, et a., 2010). Validation of the analytical method was carried out by examining the following validation parameters: specificity, linearity, accuracy, repeatability, detection limit, quantification limit. The linearity of the thymol method in a wide range of concentrations of 15-75 μg/ml and for carvacrol in the concentration range of 1.5-7.5 μg/ml was determined. The calibration curves were constructed, the coefficient of correlation was calculated for the thymol R² = 0.9981, while the equation of direction was y = 909.46x + 117.27 and for carvacrol R² = 0.9981, while the equation of direction was y = 8603.1x + 21.233 (Figure 2. and Figure 3.).
Figure 2. Linearity for thymol
Figure 3. Linearity for Carvacrol
Based on the linearity validation parameter, the values for the detection limits and quantification limit were obtained:
The detection limit for thymol was LD = 0.17 ng/ml, and the quantification limit LQ = 0.567 ng/ml. The detection limit for carvacrol was LD = 0.161 ng/ml, and the quantification limit LQ = 0.535 ng/ml.
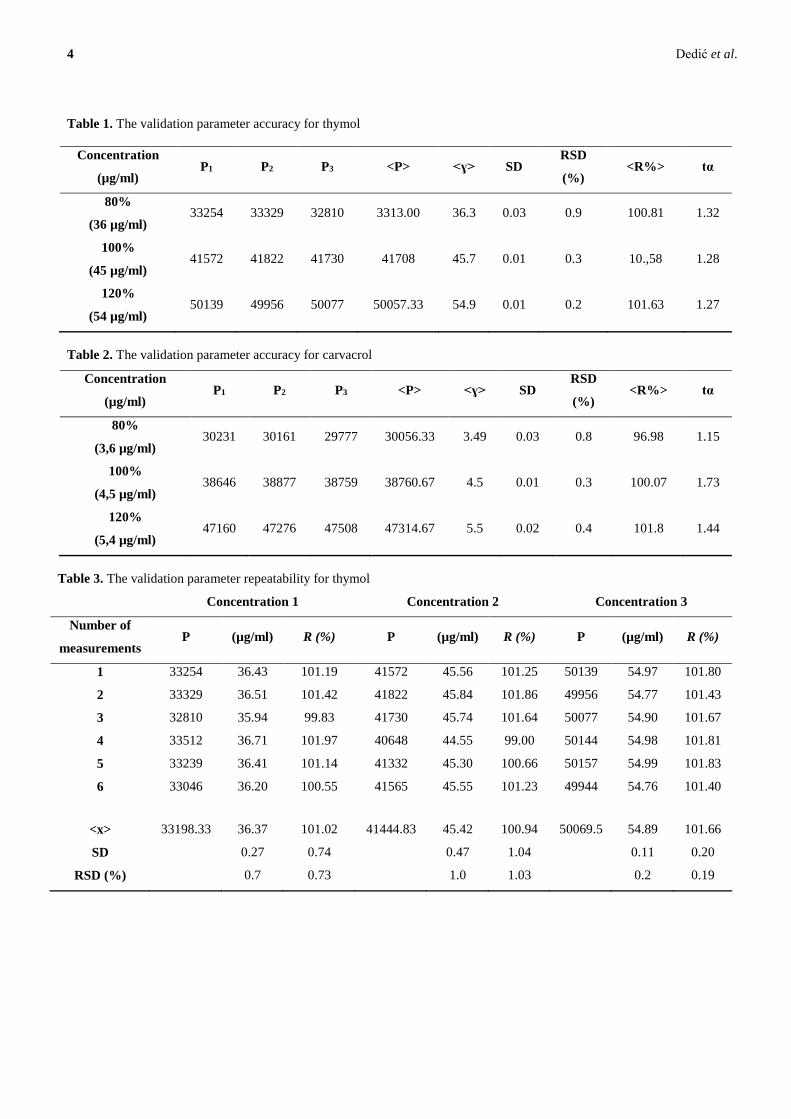
The accuracy of the test method was determined for thymol concentrations 36; 45; 54 μg/ml and carvacrol 3.6; 4,5; 5.4 μg/ml representing 80, 100, 120% of the base standard concentration. Tables 1 and 2 give the values for areas below the signal, concentration, recovery (R%),
standard deviation (SD), relative standard deviations (RSD) and reliability coefficient (tα). Repeatability of the test method was determined for thymol concentrations 36; 45; 54 μg/ml and carvacrol 3.6; 4,5; 5.4 μg/ml representing 80, 100, 120% of the base standard concentration. Tables 3. and 4. give the values for recovery (R%), standard deviation (SD) and relative standard deviations (RSD%).
Intermediate precision Intermediate precision for thymol and carvacrol was also assessed, with three analysts separately performing three sample analyzes in two different days. Sample analysis The chromatogram of the prepared tincture solution (preparation was previously explained) can be seen in Figure. 4, with associated retention times and area below the signal.
Figure 4. Sample chromatogram
Data analysisi showed that the solution contains 40.34 μg/ml of thymol, and 4.10 μg/ml of carvacrol. Considering the preparation of tincture and the dilution, the content of thymol per gram of tincture is 0.807 mg, and 0.082 mg per gram of tincture of carvacrol. The obtained ratio of the content between thymol and carvacrol corresponds to available literature and similar studies. The content of the carvacrol are about 1/10 of the thymol content. (Hajimehdipoor, Shekarchi, Khanavi, et al., 2010; Zeković, 2000)
The tincture preparation process must be standardized so that the manufacturer is assured in the exact contents of the active components of thymol and carvacrol, which come from a variety of plant material. Such preparations form an integral part of a herbal medicine which, in order to be registered on the market in a country, must pass strict quality control in the control laboratories. This analysis is very fast, reliable and economical. The method does not require a complicated sample preparation and as such can be used in the regular control of the content of thymol and carvacrol in the finished product and the semi-product (tincture).
4 Dedić et al.
Table 1. The validation parameter accuracy for thymol
Concentration
(µg/ml) P1 P2 P3 <P> <ɣ> SD
RSD
(%) <R%> tα
80%
(36 µg/ml) 33254 33329 32810 3313.00 36.3 0.03 0.9 100.81 1.32
100%
(45 µg/ml) 41572 41822 41730 41708 45.7 0.01 0.3 10.,58 1.28
120%
(54 µg/ml) 50139 49956 50077 50057.33 54.9 0.01 0.2 101.63 1.27
Table 2. The validation parameter accuracy for carvacrol
Concentration
(µg/ml) P1 P2 P3 <P> <ɣ> SD
RSD
(%) <R%> tα
80%
(3,6 µg/ml) 30231 30161 29777 30056.33 3.49 0.03 0.8 96.98 1.15
100%
(4,5 µg/ml) 38646 38877 38759 38760.67 4.5 0.01 0.3 100.07 1.73
120%
(5,4 µg/ml) 47160 47276 47508 47314.67 5.5 0.02 0.4 101.8 1.44
Table 3. The validation parameter repeatability for thymol
Concentration 1 Concentration 2 Concentration 3
Number of
measurements P (µg/ml) R (%) P (µg/ml) R (%) P (µg/ml) R (%)
1 33254 36.43 101.19 41572 45.56 101.25 50139 54.97 101.80
2 33329 36.51 101.42 41822 45.84 101.86 49956 54.77 101.43
3 32810 35.94 99.83 41730 45.74 101.64 50077 54.90 101.67
4 33512 36.71 101.97 40648 44.55 99.00 50144 54.98 101.81
5 33239 36.41 101.14 41332 45.30 100.66 50157 54.99 101.83
6 33046 36.20 100.55 41565 45.55 101.23 49944 54.76 101.40
<x> 33198.33 36.37 101.02 41444.83 45.42 100.94 50069.5 54.89 101.66
SD 0.27 0.74 0.47 1.04 0.11 0.20
RSD (%) 0.7 0.73 1.0 1.03 0.2 0.19

Bulletin of the Chemists and Technologists of Bosnia and Herzegovina 2018, 50, 1-6 5
Table 4. The validation parameter repeatability for carvacrol
Concentration 1 Concentration 2 Concentration 3
Number P (µg/ml) R (%) P (µg/ml) R (%) P (µg/ml) R (%)
1 30231 3.51 97.54 38646 4.49 99.77 47160 5.48 101.47
2 30161 3.50 97.32 38877 4.52 100.37 47276 5.49 101.72
3 29777 3.46 96.08 38759 4.50 100.06 47508 5.52 102.22
4 30066 3.49 97.01 38520 4.47 99.44 47170 5.48 101.49
5 29897 3.47 96.46 38406 4.46 99.15 47392 5.51 101.97
6 29993 3.48 96.77 38535 4.48 99.48 47476 5.52 102.15
<x> 30020,83 3.49 96.86 38623.83 4.49 99.71 47330.33 5.50 101.83
SD 0.02 0.54 0.02 0.45 0.02 0.33
RSD (%) 0.5 0.5 0.4 0.4 0.3 0.3
CONCLUSIONS The proposed HPLC methods can be used to identify and quantify thymol and carvacrol in the Thymi tincturae. Results obtained by statistical processing are in the reference interval, which are recommended by the ICH guidelines. By analyzing Thymi tincturae, it was found that the concentration of thymol was 0.807 mg/g of the tincture, while the concentration of carvacrol was 0.082 mg/g of the tincture. This analysis is very fast, reliable and economical.The method does not require a complicated sample preparation and as such can be used in the regular control of the content of thymol and carvacrol in the finished product and the semi-product (tincture). REFERENCE Alekseeva, L.I. (2009). Determining thymol and
carvacrol by reversed-phase high-performance liquid chromatography. Pharmaceutical Chemistry Journal, 43(12), 23-25.
Ashnagar, A., Gharib, N.N., Ramazani, M. (2011). Characterization of the major chemical compounds found in Thymus vulgaris plant grown wildly in Chahar Mahal and Bakhtiari province of Iran. Int. J. Pharm. Technol. Res., 3(1), 01-04.
Ezz, E., Aziz, E.E., Hendawy, S.F., Omer, E.A. (2009). Response of Thymus vulgaris L. to Salt Stress and Alar (B9) in Newly Reclaimed Soil. Journal of Applied Sciences Research, 5(12), 2165-2170.
Fachini-Queiroz, F.C., Kummer, R., Estevao-Silva, C.F., et al. ( 2012). Effects of Thymol and Carvacrol, Constituents of Thymus vulgaris L. Essential Oil, on the Inflammatory Response. Evid Based Complement Alternat Med, 2012.
Grigore, A., Paraschiv, I., Colceru-Mihul, S., Bubueanu,
C., Draghici, E., Ichim, M. (2010). Chemical composition and antioxidant activity of Thymus vulgaris L. volatile oil obtained by two different methods. Romanian Biotechnological Letters, 15(4), 5436-5443.
Hajimehdipoor, H., Shekarchi, M., Khanavi, M., Adib, N., Amri. M. (2010). A validated high performance liquid chromatography method for the analysis of thymol and carvacrol in Thymus vulgaris L. volatile oil. Pharmacognosy Magazine, 6(23), 154–158.
Kon, K., Rai, M. (2012). Antibacterial activity of Thymus vulgaris essential oil alone and in combination with other essential oils. Bioscience, 4(2), 50-56.
Marculescu, A., Vlase, L., Hanganu, D., et al. (2007). Polyphenols analyses from thymus species. Proc. Rom. Acad., Series B, 3, 117-121.
Shabnum, S., Wagay, M.G. (2011). Essential Oil Composition of Thymus Vulgaris L. and their Uses. Journal of Research & Development, 11, 83.
Syamasundar, K.V., Srinivasulu, B., Stephen, A. et al. (2008). Chemical composition of volatile oil of Thymus vulgaris L. from Western Ghats of India. Journal of Spices and Aromatic Crops, 17(3), 255-258.
Zeković, Z.P. (2000). Analysis of Thyme (Thymus vulgaris L.) extracts. APTEFF, 31, 617-622.
Zeković, Z.P., Lepojević, Ž., Markov, S., Milošević, S. (2002). Tablets with thyme (Thymus vulgaris L.) extracts. BIBLID, 33, 159-165.

6 Dedić et al.
Summary/Sažetak
Rod Thymus sadrži oko 300-400 vrsta, od kojih se veliki broj koristi u narodnoj medicini. Iz Thymus roda se najviše koristi
Thymus vulgaris (timijan). U službenoj medicini timijan se koristi kao opći lijek za prehladu, gripu, groznicu, kašalj i
bronhitis, i to kao: antiseptik, spazmolitik, antifungicid, antitusik, tonik, antihelmintik, antioksidativni agens, antivirotik,
sredstvo protiv nadimanja, sedativ, diaforetik, antibakterijsko i osvježavajuće sredstvo. Farmakološki efekti timijana se
najviše vezuju za njegove polifenolne komponente timol i karvakrol. Od hromatografskih metoda se najčešće koriste tečna
hromatografija visokih performansi. Rezultati dobiveni statističkom obradom se nalaze u referentnom intervalu, koji
preporučuju ICH smjernice. Analizom Thymi tincturae je dobijeno da je koncentracija timola 0,807 mg/g tinkture, dok je
koncentracija karvakrola 0,082 mg/g tinkture.
Ova analiza je vrlo brza, pouzdana i ekonomična. Metoda ne zahtjeva komplikovanu pripremu uzorak i kao takva se može
koristiti u redovnoj kontroli sadržaja timola i karvakrola u gotovom proizvodu i poluproizvodu (tinkturi).

The effects of a context-rich approach in teaching thermodynamics
Mahmutović, S.a, Mešić, V.b,*
aSrednja medicinska škola Sarajevo, Tahmiščina 2, 71000 Sarajevo, Bosnia and Herzegovina
bFaculty of Science, Zmaja od Bosne 33-35, 71000 Sarajevo, Bosnia and Herzegovina
INTRODUCTION Our students begin developing mental models about natural phenomena long before they enter formal education (Driver, Guesne, Tiberghien, 1985). Thereby their ideas about real-world objects and processes form spontaneously, mainly through physical experience with the environment (Bransford, Brown, Cocking, 2000). Taking into account that these ideas help the children to cope with everyday life, with time they become deeply rooted in children’s cognitive systems (Redish, 2003). Consequently, children enter formal education with strong preconceptions about their natural environment. According to basic principles of constructivism the effectiveness of learning new concepts in science classrooms mostly depends on the level of students’ mental efforts, as well as on the characteristics of students’ preconceptions (Bransford, Brown, Cocking, 2000). Learning is significantly impeded if students’ preconceptions are not scientifically accurate and such preconceptions are often called misconceptions or alternative conceptions (Driver, Guesne, Tiberghien, 1985).
One of the branches of science for which students’ misconceptions are particularly pronounced is thermodynamics. As a matter of fact, it has been shown that at all educational levels students have difficulties with differentiating heat from temperature, as well as with differentiating these concepts from internal energy (Sozbilir, 2003). Furthermore, many students believe that clothes keep us warm by generating heat (Lewis, 1996) and that heating an object is always associated with an increase of that object’s temperature (Driver, Guesne, Tiberghien, 1985). Finally, a common misconception is also reflected in the believe that heating is the only way for increasing the temperature of an object, although from the First law of thermodynamics it is clear that doing work on/by the system can also cause a change in temperature (Loverude, Kautz, Heron, 2002). Taking into account that students’ misconceptions about thermal phenomena are mostly rooted in their everyday language and experiences (Fox and Wilkinson, 1997), overcoming these misconceptions is very hard to achieve. In other words, the process of conceptual change requires
Article info Received: 13/02/2018 Accepted: 06/06/2018 Keywords: Context-Rich Instruction Thermodynamics Interest Gender Differences
*Corresponding author: E-mail: [email protected] Phone: +387-33-279-868
Abstract: Earlier research shows that at all educational levels students have many
misconceptions about thermal phenomena. Often these misconceptions are related to
difficulties with differentiating the meaning that concepts have in everyday language and
in the language of science. In this study we aimed to investigate the effects of enriching
traditional instruction about thermodynamics with qualitative and quantitative examples
from everyday life. To that end we conducted a pre-post quasi-experiment with 114 high-
school students (mostly 15-year-olds) divided into four subgroups. Two subgroups (n=60)
received the traditional instruction, whereas in the remaining two subgroups (n=54) a
context-rich approach to learning thermodynamics has been implemented. Analysis of
covariance showed that there are no statistically significant between-group differences
when it comes to conceptual understanding of thermodynamics. However, the context-rich
approach proved to be significantly more effective when it comes to increasing students'
interest in science. The level of aroused interest was higher in girls than in boys.
Bulletin of the Chemists and Technologists of Bosnia and Herzegovina
Print ISSN: 0367-4444
Online ISSN: 2232-7266
2018
50
7-12 UDC: __________________________
Original Scientific Article

8 Mahmutović and Mešić
investment of significant mental efforts from the student. Students’ readiness to invest significant efforts into learning is closely related to students’ motivation and interest for learning of science. Schunk, Pintrich and Meece (2008) define motivation as an intellectual process responsible for starting, directing and maintaining learning activities. From the expectancy-value theory it follows that students’ motivation can be increased by creating learning situations that students consider to be important for their lives, as well as by developing in students a feeling of self-efficacy (Eggen and Kauchak, 2010). Similarly, two defining dimensions of the interest construct are (Wiesner, Schecker, Hopf, 2013): a) perception of importance of the given object b) associating the given object with positive emotions. Most of the students who are enrolled in physics classes can be categorized into one of the following categories of types of interest (Mueller, 2006): a) physics and technology b) human body and nature c) physics and society. It is important to note that developing students’ interest for science should not be perceived as a mere tool for improving cognitive achievements in science – developing interest in science is a worthy goal on its own because it increases the probability of life-long learning and choosing a career in science (Wiesner, Schecker, Hopf, 2013).
Aim of the present study Although the idea of implementing authentic learning in science classes appears to be theoretically appealing, results of a meta-analysis show that in more than 50% of studies context-rich approaches proved to be equally effective as traditional instruction (Bennet, Lubben, Hogarth, 2006). There are also studies in which context-rich instruction was found to be significantly more effective than traditional instruction (see Yager and Weld, 1999), as well as studies in which it proved to be significantly less effective than traditional instruction (see Lubben, Campbell, Diamini, 1997). As a matter of fact, although context-rich approaches often positively affect the students’ motivation for learning science, sometimes real-world examples require various types of knowledge that are not systematically connected within the knowledge system of the corresponding scientific discipline (Mueller, 2006). Consequently, such learning environments are often less structured which can impede development of conceptual understanding (Kirschner, Sweller, Clark, 2006).In this study we aimed to investigate how a context-rich approach to teaching thermodynamics affects the conceptual understanding and interest for science in high-school students. Thereby we attempted to overcome the well-known difficulties of context-rich approaches by providing the real-life examples only in review lessons. This study potentially contributes to a better understanding of factors that moderate the effectiveness of context-rich approaches to teaching science.
Methodology
Research design In order to answer our research question we conducted a pre-post quasi-experiment (Cook, Campbell, Shadish 2002) with one group receiving traditional instruction and one group receiving the experimental treatment. The treatment lasted for four teaching hours (four review lessons). One week before and after the treatment students were administered the pretest and posttest, respectively.
Participants Our study included 114 students who were enrolled in the first year of a high-school in Zenica (Bosnia and Herzegovina). At the time of the study most of the participants were 15 years old. The sample included 44 male and 70 female participants and the gender distribution across the comparison groups was approximately the same.
Two classes (n=60) were assigned to the traditional treatment and the remaining two classes (n=54) to the experimental treatment.
Curriculum and Teaching treatment Our quasi-experiment has been conducted as part of the regular curriculum. The development lessons in both, the control and experimental group, followed a traditional approach to teaching thermodynamics. These lessons typically began by review of earlier covered, relevant concepts. Thereafter the teacher attempted to introduce new concepts, establishing thereby connections to students’ foreknowledge. Eventually, the teacher modeled solving of quantitative problems, i.e. she showed the students how to apply the newly introduced concepts. Development lessons have been followed by review lessons. In these lessons the approach to learning thermodynamics was different for the two groups. The control group continued to follow the traditional approach characterized by reviewing factual knowledge and solving of quantitative problems. On the other hand, in the experimental group the students were given the opportunity for context-rich learning. They were required to transfer the knowledge they learned in development lessons to carefully chosen real-world problems. These problems were mostly situated into the contexts of everyday life and simple hands-on experiments. Some contexts were selected from Physics of Everyday Life by Bloomfield (2006). If hands-on experiments were included, we attempted to also situate the quantitative examples within the context of these experiments. More detailed insight into differences between the two treatments can be gained through analysis of Table 1. Besides the topic from Table 1, our treatments also included the following topics: “Structure of matter. Molecular-kinetic theory of gases. Ideal gas law”, “Laws of thermodynamics. Entropy. Work done by ideal gas. Heat engines”.
Bulletin of the Chemists and Technologists of Bosnia and Herzegovina 2018, 50, 7-12 9
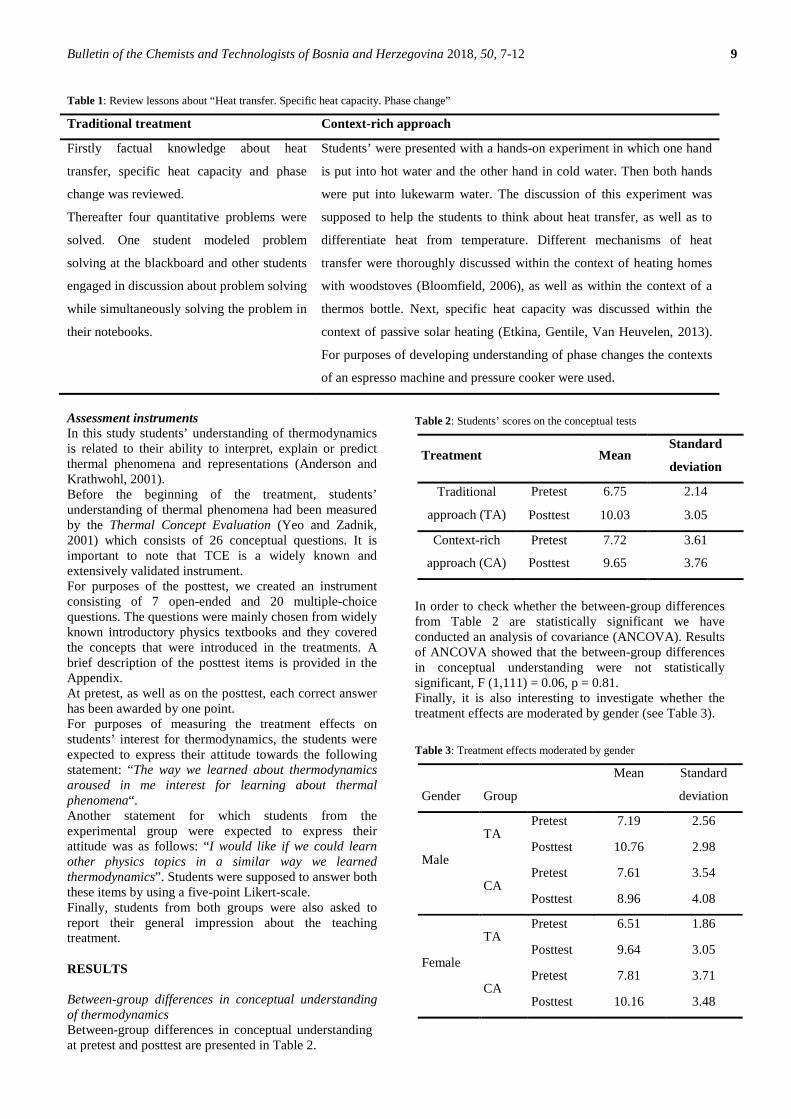
Table 1: Review lessons about “Heat transfer. Specific heat capacity. Phase change”
Traditional treatment Context-rich approach
Firstly factual knowledge about heat
transfer, specific heat capacity and phase
change was reviewed.
Thereafter four quantitative problems were
solved. One student modeled problem
solving at the blackboard and other students
engaged in discussion about problem solving
while simultaneously solving the problem in
their notebooks.
Students’ were presented with a hands-on experiment in which one hand
is put into hot water and the other hand in cold water. Then both hands
were put into lukewarm water. The discussion of this experiment was
supposed to help the students to think about heat transfer, as well as to
differentiate heat from temperature. Different mechanisms of heat
transfer were thoroughly discussed within the context of heating homes
with woodstoves (Bloomfield, 2006), as well as within the context of a
thermos bottle. Next, specific heat capacity was discussed within the
context of passive solar heating (Etkina, Gentile, Van Heuvelen, 2013).
For purposes of developing understanding of phase changes the contexts
of an espresso machine and pressure cooker were used.
Assessment instruments In this study students’ understanding of thermodynamics is related to their ability to interpret, explain or predict thermal phenomena and representations (Anderson and Krathwohl, 2001). Before the beginning of the treatment, students’ understanding of thermal phenomena had been measured by the Thermal Concept Evaluation (Yeo and Zadnik, 2001) which consists of 26 conceptual questions. It is important to note that TCE is a widely known and extensively validated instrument. For purposes of the posttest, we created an instrument consisting of 7 open-ended and 20 multiple-choice questions. The questions were mainly chosen from widely known introductory physics textbooks and they covered the concepts that were introduced in the treatments. A brief description of the posttest items is provided in the Appendix. At pretest, as well as on the posttest, each correct answer has been awarded by one point. For purposes of measuring the treatment effects on students’ interest for thermodynamics, the students were expected to express their attitude towards the following statement: “The way we learned about thermodynamics aroused in me interest for learning about thermal phenomena“. Another statement for which students from the experimental group were expected to express their attitude was as follows: “I would like if we could learn other physics topics in a similar way we learned thermodynamics”. Students were supposed to answer both these items by using a five-point Likert-scale. Finally, students from both groups were also asked to report their general impression about the teaching treatment. RESULTS Between-group differences in conceptual understanding of thermodynamics Between-group differences in conceptual understanding at pretest and posttest are presented in Table 2.
Table 2: Students’ scores on the conceptual tests
Treatment Mean Standard
deviation
Traditional
approach (TA)
Pretest 6.75 2.14
Posttest 10.03 3.05
Context-rich
approach (CA)
Pretest 7.72 3.61
Posttest 9.65 3.76
In order to check whether the between-group differences from Table 2 are statistically significant we have conducted an analysis of covariance (ANCOVA). Results of ANCOVA showed that the between-group differences in conceptual understanding were not statistically significant, F (1,111) = 0.06, p = 0.81. Finally, it is also interesting to investigate whether the treatment effects are moderated by gender (see Table 3). Table 3: Treatment effects moderated by gender
Gender
Group
Mean Standard
deviation
Male
TA Pretest 7.19 2.56
Posttest 10.76 2.98
CA Pretest 7.61 3.54
Posttest 8.96 4.08
Female
TA Pretest 6.51 1.86
Posttest 9.64 3.05
CA Pretest 7.81 3.71
Posttest 10.16 3.48
10 Mahmutović and Mešić
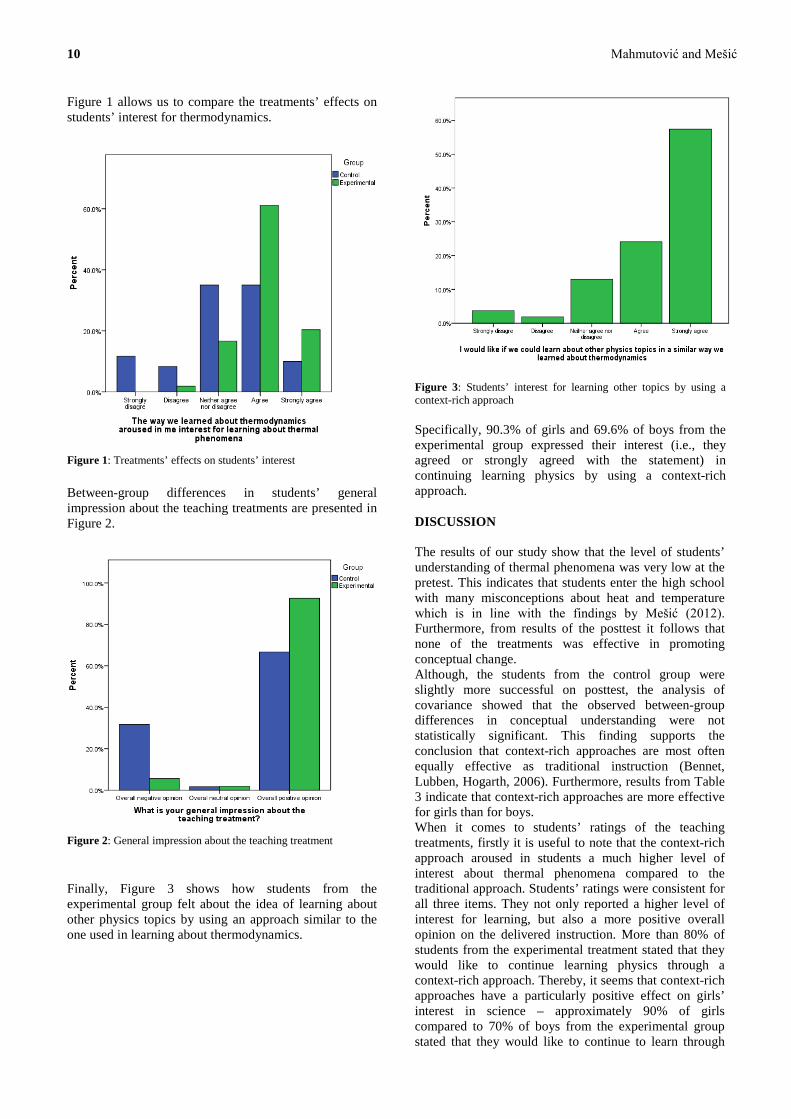
Figure 1 allows us to compare the treatments’ effects on students’ interest for thermodynamics.
Figure 1: Treatments’ effects on students’ interest
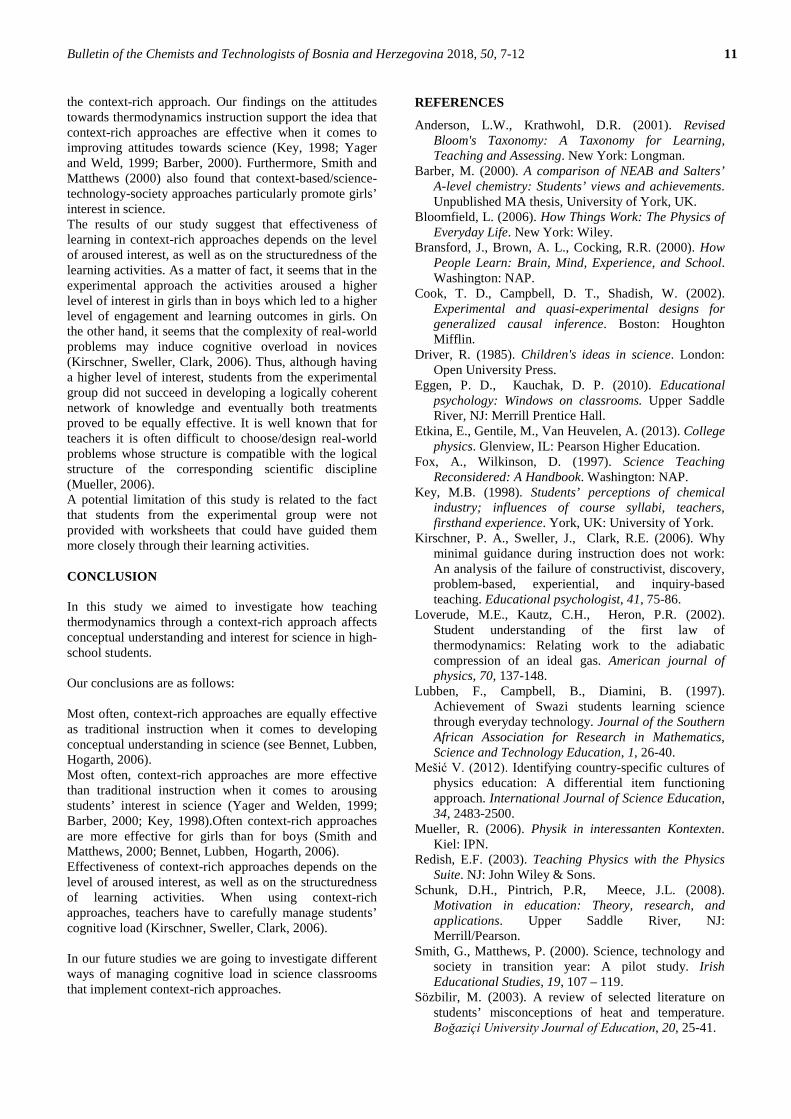
Between-group differences in students’ general impression about the teaching treatments are presented in Figure 2.
Figure 2: General impression about the teaching treatment
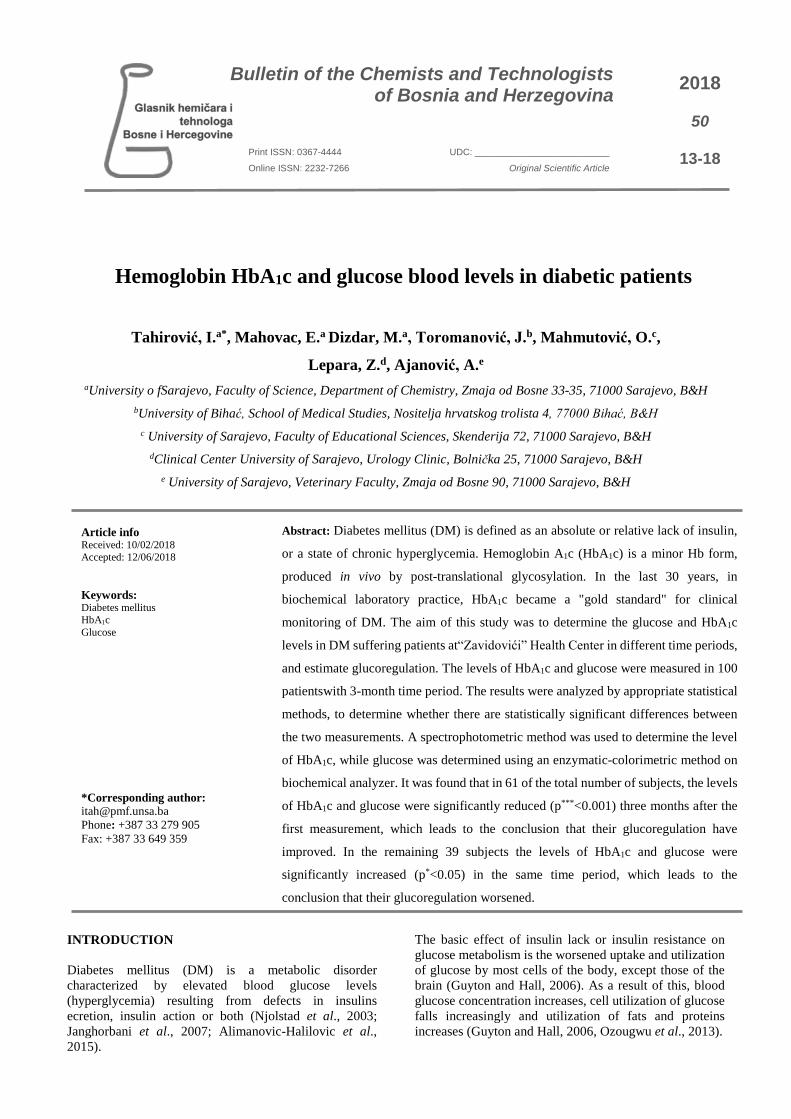
Finally, Figure 3 shows how students from the experimental group felt about the idea of learning about other physics topics by using an approach similar to the one used in learning about thermodynamics.
Figure 3: Students’ interest for learning other topics by using a context-rich approach
Specifically, 90.3% of girls and 69.6% of boys from the experimental group expressed their interest (i.e., they agreed or strongly agreed with the statement) in continuing learning physics by using a context-rich approach.
DISCUSSION
The results of our study show that the level of students’ understanding of thermal phenomena was very low at the pretest. This indicates that students enter the high school with many misconceptions about heat and temperature which is in line with the findings by Mešić (2012). Furthermore, from results of the posttest it follows that none of the treatments was effective in promoting conceptual change. Although, the students from the control group were slightly more successful on posttest, the analysis of covariance showed that the observed between-group differences in conceptual understanding were not statistically significant. This finding supports the conclusion that context-rich approaches are most often equally effective as traditional instruction (Bennet, Lubben, Hogarth, 2006). Furthermore, results from Table 3 indicate that context-rich approaches are more effective for girls than for boys. When it comes to students’ ratings of the teaching treatments, firstly it is useful to note that the context-rich approach aroused in students a much higher level of interest about thermal phenomena compared to the traditional approach. Students’ ratings were consistent for all three items. They not only reported a higher level of interest for learning, but also a more positive overall opinion on the delivered instruction. More than 80% of students from the experimental treatment stated that they would like to continue learning physics through a context-rich approach. Thereby, it seems that context-rich approaches have a particularly positive effect on girls’ interest in science – approximately 90% of girls compared to 70% of boys from the experimental group stated that they would like to continue to learn through
Bulletin of the Chemists and Technologists of Bosnia and Herzegovina 2018, 50, 7-12 11
the context-rich approach. Our findings on the attitudes towards thermodynamics instruction support the idea that context-rich approaches are effective when it comes to improving attitudes towards science (Key, 1998; Yager and Weld, 1999; Barber, 2000). Furthermore, Smith and Matthews (2000) also found that context-based/science-technology-society approaches particularly promote girls’ interest in science. The results of our study suggest that effectiveness of learning in context-rich approaches depends on the level of aroused interest, as well as on the structuredness of the learning activities. As a matter of fact, it seems that in the experimental approach the activities aroused a higher level of interest in girls than in boys which led to a higher level of engagement and learning outcomes in girls. On the other hand, it seems that the complexity of real-world problems may induce cognitive overload in novices (Kirschner, Sweller, Clark, 2006). Thus, although having a higher level of interest, students from the experimental group did not succeed in developing a logically coherent network of knowledge and eventually both treatments proved to be equally effective. It is well known that for teachers it is often difficult to choose/design real-world problems whose structure is compatible with the logical structure of the corresponding scientific discipline (Mueller, 2006). A potential limitation of this study is related to the fact that students from the experimental group were not provided with worksheets that could have guided them more closely through their learning activities. CONCLUSION In this study we aimed to investigate how teaching thermodynamics through a context-rich approach affects conceptual understanding and interest for science in high-school students.
Our conclusions are as follows: Most often, context-rich approaches are equally effective as traditional instruction when it comes to developing conceptual understanding in science (see Bennet, Lubben, Hogarth, 2006). Most often, context-rich approaches are more effective than traditional instruction when it comes to arousing students’ interest in science (Yager and Welden, 1999; Barber, 2000; Key, 1998).Often context-rich approaches are more effective for girls than for boys (Smith and Matthews, 2000; Bennet, Lubben, Hogarth, 2006). Effectiveness of context-rich approaches depends on the level of aroused interest, as well as on the structuredness of learning activities. When using context-rich approaches, teachers have to carefully manage students’ cognitive load (Kirschner, Sweller, Clark, 2006).
In our future studies we are going to investigate different ways of managing cognitive load in science classrooms that implement context-rich approaches.
REFERENCES
Anderson, L.W., Krathwohl, D.R. (2001). Revised Bloom's Taxonomy: A Taxonomy for Learning, Teaching and Assessing. New York: Longman.
Barber, M. (2000). A comparison of NEAB and Salters’ A-level chemistry: Students’ views and achievements. Unpublished MA thesis, University of York, UK.
Bloomfield, L. (2006). How Things Work: The Physics of Everyday Life. New York: Wiley.
Bransford, J., Brown, A. L., Cocking, R.R. (2000). How People Learn: Brain, Mind, Experience, and School. Washington: NAP.
Cook, T. D., Campbell, D. T., Shadish, W. (2002). Experimental and quasi-experimental designs for generalized causal inference. Boston: Houghton Mifflin.
Driver, R. (1985). Children's ideas in science. London: Open University Press.
Eggen, P. D., Kauchak, D. P. (2010). Educational psychology: Windows on classrooms. Upper Saddle River, NJ: Merrill Prentice Hall.
Etkina, E., Gentile, M., Van Heuvelen, A. (2013). College physics. Glenview, IL: Pearson Higher Education.
Fox, A., Wilkinson, D. (1997). Science Teaching Reconsidered: A Handbook. Washington: NAP.
Key, M.B. (1998). Students’ perceptions of chemical industry; influences of course syllabi, teachers, firsthand experience. York, UK: University of York.
Kirschner, P. A., Sweller, J., Clark, R.E. (2006). Why minimal guidance during instruction does not work: An analysis of the failure of constructivist, discovery, problem-based, experiential, and inquiry-based teaching. Educational psychologist, 41, 75-86.
Loverude, M.E., Kautz, C.H., Heron, P.R. (2002). Student understanding of the first law of thermodynamics: Relating work to the adiabatic compression of an ideal gas. American journal of physics, 70, 137-148.
Lubben, F., Campbell, B., Diamini, B. (1997). Achievement of Swazi students learning science through everyday technology. Journal of the Southern African Association for Research in Mathematics, Science and Technology Education, 1, 26-40.
Mešić V. (2012). Identifying country-specific cultures of physics education: A differential item functioning approach. International Journal of Science Education, 34, 2483-2500.
Mueller, R. (2006). Physik in interessanten Kontexten. Kiel: IPN.
Redish, E.F. (2003). Teaching Physics with the Physics Suite. NJ: John Wiley & Sons.
Schunk, D.H., Pintrich, P.R, Meece, J.L. (2008). Motivation in education: Theory, research, and applications. Upper Saddle River, NJ: Merrill/Pearson.
Smith, G., Matthews, P. (2000). Science, technology and society in transition year: A pilot study. Irish Educational Studies, 19, 107 – 119.
Sözbilir, M. (2003). A review of selected literature on students’ misconceptions of heat and temperature. Boğaziçi University Journal of Education, 20, 25-41.

12 Mahmutović and Mešić
Wiesner, H., Hopf, M., Schecker, H. (2011). Physikdidaktik kompakt. München: Aulis-Verlag.
Yager, R.E., Weld, J.D. (1999). Scope, sequence and coordination: The Iowa Project, a national reform effort in the USA. International Journal of Science Education, 21, 169-194.
Yeo, S., Zadnik, M. (2001). Introductory thermal concept evaluation: Assessing students' understanding. The Physics Teacher, 39, 496-504.
Appendix
A brief description of posttest items is provided in Table 4.
Table 4: Brief description of posttest items
Item 1
Measuring
temperature
Item 2
Heat capacity of
water
Item 3
Reflection of
thermal radiation
Item 4
“A sweating” glass
bottle
Item 5
How a bulb
influences entropy?
Item 6
Hand above a
flame
Item 7
How does air/water
at 20 °C feel?
Item 8
Temperature of
metal vs wood
Item 9
Isochoric process
Item 10
Isothermal process
Item 11
Isobaric process
Item 12
Thermal energy of
iceberg vs cup of
water
Item 13
Cooling of metal
plate and cookies
Item 14
Heat conductors vs
isolators
Item 15
Can work affect
temperature?
Item 16
Melting of ice
wrapped in paper
Item 17
How a fan cools us
down?
Item 18
Heating already
boiling water
Item 19
Cooking on a
mountain and in
valley
Item 20
Air humidity and
evaporation
Item 21
Fan in an isolated
room
Item 22
Interpreting p-V
diagram - heat
Item 23
Interpreting p-V
diagram - work
Item 24
Is this heat
pump/engine
possible?
Item 25
Is this heat
pump/engine
possible?
Item 26
Is this heat
pump/engine
possible?
Item 27
Is this heat
pump/engine
possible?
Summary/Sažetak Rezultati ranijih istraživanja pokazuju da kod učenika svih uzrasta postoje mnoge miskoncepcije o toplotnim pojavama.
Često su te miskoncepcije uzrokovane nerazlikovanjem značenja pojmova u jeziku struke i jeziku svakodnevnice. Studija
predstavljena u ovom radu imala je za cilj istraživanje efekata obogaćivanja tradicionalne nastave termodinamike sa
kvalitativnim i kvantitativnim primjerima iz svakodnevnog života. U tu svrhu proveden je predtest-posttest kvazi-
eksperiment koji je uključivao 114 učenika srednjih škola (uglavnom petnaestogodišnjaka) raspoređenih u čeitiri podgrupe.
Dvije podgrupe (n=60) podvrgnute su tradicionalnom tretmanu, dok se u preostale dvije podgrupe (n=54) implementirala
nastava termodinamike situirana u autentične kontekste. Rezultati analize kovarijanse pokazali su da nema statistički
značajnih međugrupnih razlika kada je u pitanju uticaj tretmana na konceptualno razumijevanje termodinamike. Međutim,
nastavni pristup zasnovan na obradi gradiva u autentičnim kontekstima bio je mnogo uspješniji po pitanju razvijanja
učeničkog interesa za prirodne nauke. Nivo interesa pobuđen ovim pristupom bio je znatno viši kod djevojčica nego kod
dječaka.
Hemoglobin HbA1c and glucose blood levels in diabetic patients
Tahirović, I.a*, Mahovac, E.a Dizdar, M.a, Toromanović, J.b, Mahmutović, O.c,
Lepara, Z.d, Ajanović, A.e aUniversity o fSarajevo, Faculty of Science, Department of Chemistry, Zmaja od Bosne 33-35, 71000 Sarajevo, B&H
bUniversity of Bihać, School of Medical Studies, Nositelja hrvatskog trolista 4, 77000 Bihać, B&H
c University of Sarajevo, Faculty of Educational Sciences, Skenderija 72, 71000 Sarajevo, B&H dClinical Center University of Sarajevo, Urology Clinic, Bolnička 25, 71000 Sarajevo, B&H
e University of Sarajevo, Veterinary Faculty, Zmaja od Bosne 90, 71000 Sarajevo, B&H
INTRODUCTION Diabetes mellitus (DM) is a metabolic disorder characterized by elevated blood glucose levels (hyperglycemia) resulting from defects in insulins ecretion, insulin action or both (Njolstad et al., 2003; Janghorbani et al., 2007; Alimanovic-Halilovic et al., 2015).
The basic effect of insulin lack or insulin resistance on glucose metabolism is the worsened uptake and utilization of glucose by most cells of the body, except those of the brain (Guyton and Hall, 2006). As a result of this, blood glucose concentration increases, cell utilization of glucose falls increasingly and utilization of fats and proteins increases (Guyton and Hall, 2006, Ozougwu et al., 2013).
Bulletin of the Chemists and Technologists of Bosnia and Herzegovina
Print ISSN: 0367-4444
Online ISSN: 2232-7266
2018
50
13-18 UDC: __________________________
Original Scientific Article
Article info Received: 10/02/2018 Accepted: 12/06/2018 Keywords: Diabetes mellitus HbA1c Glucose
*Corresponding author: [email protected] Phone: +387 33 279 905 Fax: +387 33 649 359
Abstract: Diabetes mellitus (DM) is defined as an absolute or relative lack of insulin,
or a state of chronic hyperglycemia. Hemoglobin A1c (HbA1c) is a minor Hb form,
produced in vivo by post-translational glycosylation. In the last 30 years, in
biochemical laboratory practice, HbA1c became a "gold standard" for clinical
monitoring of DM. The aim of this study was to determine the glucose and HbA1c
levels in DM suffering patients at“Zavidovići” Health Center in different time periods,
and estimate glucoregulation. The levels of HbA1c and glucose were measured in 100
patientswith 3-month time period. The results were analyzed by appropriate statistical
methods, to determine whether there are statistically significant differences between
the two measurements. A spectrophotometric method was used to determine the level
of HbA1c, while glucose was determined using an enzymatic-colorimetric method on
biochemical analyzer. It was found that in 61 of the total number of subjects, the levels
of HbA1c and glucose were significantly reduced (p***<0.001) three months after the
first measurement, which leads to the conclusion that their glucoregulation have
improved. In the remaining 39 subjects the levels of HbA1c and glucose were
significantly increased (p*<0.05) in the same time period, which leads to the
conclusion that their glucoregulation worsened.
14 Tahirović et al.
The chemical reaction of glucose with other compounds is termed glycation. If glucose reacts with hemoglobin, the resulting compound is named glycohemoglobin (Ibrahim et al., 2006; Selvinet al., 2010; Hinzmann et al., 2012). Hemoglobin A1c (HbA1c), which is irreversibly glycated on the N-terminal valine of the β-chain, is well known as the main diabetes marker protein used for clinically monitoring long-term glycemic control. (Rohlfing et al., 2002; Hinzmann et al., 2012; Alegre-Diaz et al., 2016).
The HbA1c test is not recommended for diagnosis because there is not a standard assay for the HbA1c and because many countries do not have ready access to the test (Montoya-Carralero et al., 2010; Mealey and Oates, 2006). Since red blood cells have an average lifespan of 3-4 months (80±10.9 days) in the blood circulation, %HbA1c becomes a better indicator of patient glycemic control in that time frame (Saudek et al., 2006; Tanaka et al., 2007; Beltran Del Rio et al., 2016).
There is a linear relationship between the levels of %HbA1c and the mean blood glucose concentrations (Hinzmann et al., 2012). Higher average blood glucose levels are reflected in higher HbA1c values. The reference HbA1c value is <6% (Janghorbani et al., 2007).
This study investigates blood levels of both,HbA1c and glucose in all DM subjects, and in DM subjects divided in two main age groups (40-60, and 61-80 years), in two separate time periods: second measurement (M-II) was performed about 90 days after the first measurement (M-I). Our aim was to evaluate potential differences in glucoregulation in all DM subjects, and between the two age groups of diabetic patients. By comparing HbA1c and glucose levels in M-II to the levels of these parameters in M-I, glucoregulation of these patients can be defined.
MATERIALS AND METHODS
Study population and design of experiment - Patients were males and females, aged 40-80 years at “Zavidovići” Health Center. A representative sample of this research was 100 subjects divided in two main age groups [40-60 years (Group 1, 34 patients) and 61-80 years (Group 2, 66 patients)]. The measurements were performed in two separate time periods: second measurement (M-II) was performed about 90 days after the first measurement (M-I). After obtaining the results, the main groups were divided into two subgroups (Group 1a and 1b, and Group 2a and 2b), according to the increase (a) or decrease (b) of HbA1c and glucose levels after M-II. Sample collection and storage - From each patient, a few milliliters of venous blood samples were collected in a container with EDTA. HbA1c and glucose were determined for each sample. Chemicals - Commercial enzyme assay kit (Glucose MR, Cat. No. 1129010), used as a reference method for glucose detection in real samples, was purchased from Cromatest (Barcelona, SPAIN). Another commercially available kit was used for the determination of HbA1c (Glycated HbA1c, Cat. No. 3155105; Barcelona, SPAIN).
Instrumental - HbA1c levels were determined using the ECOM-f6124 Eppendorf spectrophotometer, whereas glucose levels were determined using the Hitachi 902 Chemistry Analyzer. Determination of HbA1c HbA1c was extracted using a chromatographic ion-exchange method as described in the manual of the method for glycated HbA1c determination, supplied by Chromatest, LINEAR CHEMICALS S.L. A hemolyzed preparation of the whole blood was mixed continuously for 5 minutes with a weak binding cation-exchange resin (Hinzmann et al., 2012). During this time, HbA0 binds to the resin. HbA0 consists of all the other hemoglobins except A1c which remains in the solution (Hinzmann et al., 2012). After the mixing period, a filter is used to separate the supernatant containing the A1c from the resin (Hinzmann et al., 2012). The glycohemoglobin content (%) was determined by measuring the absorbance at 415 nm of the A1c fraction and the total hemoglobin fraction, and using the formula:
%𝐻𝐻𝐻𝐻𝐴𝐴1𝑐𝑐 =𝑅𝑅(𝑢𝑢𝑢𝑢𝑢𝑢𝑢𝑢𝑢𝑢𝑢𝑢𝑢𝑢)
𝑅𝑅(𝑠𝑠𝑠𝑠𝑠𝑠𝑢𝑢𝑠𝑠𝑠𝑠𝑠𝑠𝑠𝑠) ∙ 𝑠𝑠𝑠𝑠𝑠𝑠𝑠𝑠𝑠𝑠𝑠𝑠𝑠𝑠𝑠𝑠 𝑐𝑐𝑐𝑐𝑠𝑠𝑐𝑐.
where
𝑅𝑅(𝑢𝑢𝑢𝑢𝑢𝑢𝑢𝑢𝑢𝑢𝑢𝑢𝑢𝑢) =𝐴𝐴𝐻𝐻𝑠𝑠𝑐𝑐𝐴𝐴𝐻𝐻𝐻𝐻𝐴𝐴1𝑐𝑐(𝑢𝑢𝑢𝑢𝑢𝑢𝑢𝑢𝑢𝑢𝑢𝑢𝑢𝑢)
𝐴𝐴𝐻𝐻𝑠𝑠𝑐𝑐𝐴𝐴𝐻𝐻𝐻𝐻𝑇𝑇𝑐𝑐𝑠𝑠(𝑢𝑢𝑢𝑢𝑢𝑢𝑢𝑢𝑢𝑢𝑢𝑢𝑢𝑢)
𝑅𝑅(𝑠𝑠𝑠𝑠𝑠𝑠𝑢𝑢𝑠𝑠𝑠𝑠𝑠𝑠𝑠𝑠) =𝐴𝐴𝐻𝐻𝑠𝑠𝑐𝑐𝐴𝐴𝐻𝐻𝐻𝐻𝐴𝐴1𝑐𝑐(𝑠𝑠𝑠𝑠𝑠𝑠𝑢𝑢𝑠𝑠𝑠𝑠𝑠𝑠𝑠𝑠)
𝐴𝐴𝐻𝐻𝑠𝑠𝑐𝑐𝐴𝐴𝐻𝐻𝐻𝐻𝑇𝑇𝑐𝑐𝑠𝑠(𝑠𝑠𝑠𝑠𝑠𝑠𝑢𝑢𝑠𝑠𝑠𝑠𝑠𝑠𝑠𝑠)
Determination of glucose - The used model for quantitative determination of glucose in blood samples is based on the Trinder reaction (Lott and Turner, 1975). The glucose is oxidized to D-gluconate by the glucose oxidase (GOD) with the formation of hydrogen peroxide (H2O2). In the presence of peroxidase (POD), a mixture of phenol and 4-aminoantipyrine (4-AP) is oxidized by H2O2, to form a red quinone imine dye proportional to the concentration of glucose in the sample (Trinder, 1969; Raba and Mottola, 1995):
𝛽𝛽 − 𝐷𝐷 − 𝑔𝑔𝑔𝑔𝑔𝑔𝑐𝑐𝑐𝑐𝑠𝑠𝑔𝑔 + 𝐻𝐻2𝑂𝑂 + 𝑂𝑂2𝐺𝐺𝐺𝐺𝐺𝐺�⎯�𝐷𝐷 − 𝑔𝑔𝑔𝑔𝑔𝑔𝑐𝑐𝑐𝑐𝑠𝑠𝑠𝑠𝑠𝑠𝑔𝑔 + 𝐻𝐻2𝑂𝑂2
4 − 𝐴𝐴𝐴𝐴 + 𝑝𝑝ℎ𝑔𝑔𝑠𝑠𝑐𝑐𝑔𝑔
𝑃𝑃𝐺𝐺𝐺𝐺�⎯�𝑞𝑞𝑔𝑔𝑞𝑞𝑠𝑠𝑐𝑐𝑠𝑠𝑔𝑔𝑞𝑞𝑞𝑞𝑞𝑞𝑠𝑠𝑔𝑔 + 𝐻𝐻2𝑂𝑂.
The used procedure is described in commercially available kit that was utilized for measurements of glucose levels in a tested subjects. Absorbance of the samples and the standard was read at 500 nm against the blank. Calculation of the glucose content was estimated using the following formula
𝑐𝑐𝑠𝑠𝑠𝑠𝑠𝑠𝑠𝑠𝑠𝑠𝑠𝑠(𝑚𝑚𝑚𝑚𝑚𝑚𝑚𝑚𝐿𝐿 ) =
𝐴𝐴𝐻𝐻𝑠𝑠𝑠𝑠𝑠𝑠𝑠𝑠𝑠𝑠𝑠𝑠𝑠𝑠𝐴𝐴𝐻𝐻𝑠𝑠𝑠𝑠𝑠𝑠𝑠𝑠𝑢𝑢𝑠𝑠𝑠𝑠𝑠𝑠𝑠𝑠
∙ 𝑐𝑐𝑠𝑠𝑠𝑠𝑠𝑠𝑢𝑢𝑠𝑠𝑠𝑠𝑠𝑠𝑠𝑠(𝑚𝑚𝑚𝑚𝑚𝑚𝑚𝑚𝐿𝐿 )

Bulletin of the Chemists and Technologists of Bosnia and Herzegovina 2018, 50, 13-18 15
Statistical analysis - The one way ANOVA test was used to compare the differences in HbA1c and glucose levels in two measurements (the second measurement was performed 90 days after the first measurement). RESULTS AND DISCUSSION
Determination of HbA1c –HbA1c levels of the all subjects, and in both groups (Group 1 and Group 2) after the M-II were decreased, but without statistical significance (p>0.05, ANOVA test) as shown in Table 1. Table 1. Average levels of HbA1c (%) in the blood.
HbA1c ± SD (%) M-I
HbA1c ± SD (%) M-II
All patients 8.49±1.56 8.24±1.32 Group 1 (34) 8.49±1.67 8.02±0.94 Group 2 (66) 8.45±1.50 8.34±1.47
In Group 1, 12 patients (subgroup 1a) showed an increase in HbA1c levels after 90 days (M-II), while 22 patients (subgroup 1b) after the same time period showed lower levels of HbA1c (Figure 1).
Figure 1.Changes of HbA1c levels in the Group 1. M-II: second measurement of HbA1c, about 90 days after the first measurement (M-I)
The ANOVA test showed that the levels of HbA1c after the M-II were significantly higher in comparison to those in the M-I (subgroup 1a, p*<0.05), indicating worsened glucoregulation. In patients with reduced HbA1c levels after the M-II (subgroup 1b), ANOVA test confirmed that the levels of HbA1c were significantly lower compared to the M-I (p***<0.001), indicating improved glucoregulation. In Group 2, 27 patients (subgroup 2a) showed an increase in HbA1c levels, while 39 patients (subgroup 2b) showed lower levels of HbA1c (Figure 2).
Figure 2.Changes of HbA1c levels in the Group 2.
M-II: second measurement of HbA1c, about 90 days after the first measurement (M-I) In the subgroup 2a, the ANOVA test confirmed significantly higher HbA1c levels in M-II compared to M-I (Figure 2, p*<0.05). The statistical significantly increase of the HbA1c levels indicates worsened glucoregulation, whereas the statistical significantly decrease of the HbA1c levels (Figure 2, p***<0.001), indicates improved glucoregulation. Determination of glucose - glucose content in blood was analyzed for the same population. The average content of glucose for all patients and in both groups (Group 1 and Group 2) is presented in Table 2. Table 2. Average levels of glucose (mmol) in the blood
cglucose ± SD (mmol/L)
M-I
cglucose ± SD (mmol/L)
M-II All patients 10.62 ± 3.78 9.76 ± 3.37 Group 1 (34) 11.36 ± 3.64 9.78 ± 2.30* Group 2 (66) 10.41 ± 3.90 9.75 ± 3.82
* significantly decreased in comparison to M-I (p<0.05, one way ANOVA) M-I: the first measurement of glucose M-II: the second measurement of glucose (in the same time as we done the second measurement of HbA1c) The ANOVA test confirmed that the levels of glucose in Group 1 after 90 days (M-II) were significantly lower compared to the M-I (p*<0.05), indicating improved glucoregulation. Glucose levels in 12 patients of Group 1 (subgroup 1a) after the M-II were increased, while in 22 patients (subgroup 1b) glucose levels were decreased after the same time period (Figure 3).
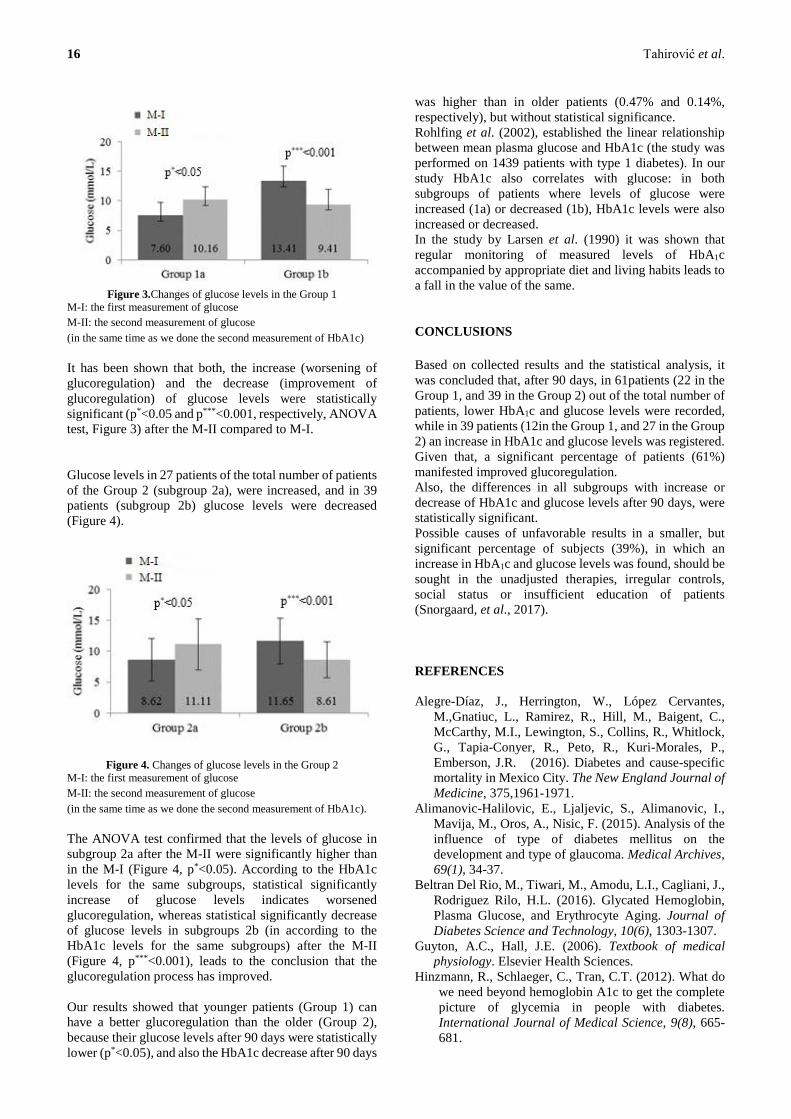
16 Tahirović et al.
Figure 3.Changes of glucose levels in the Group 1
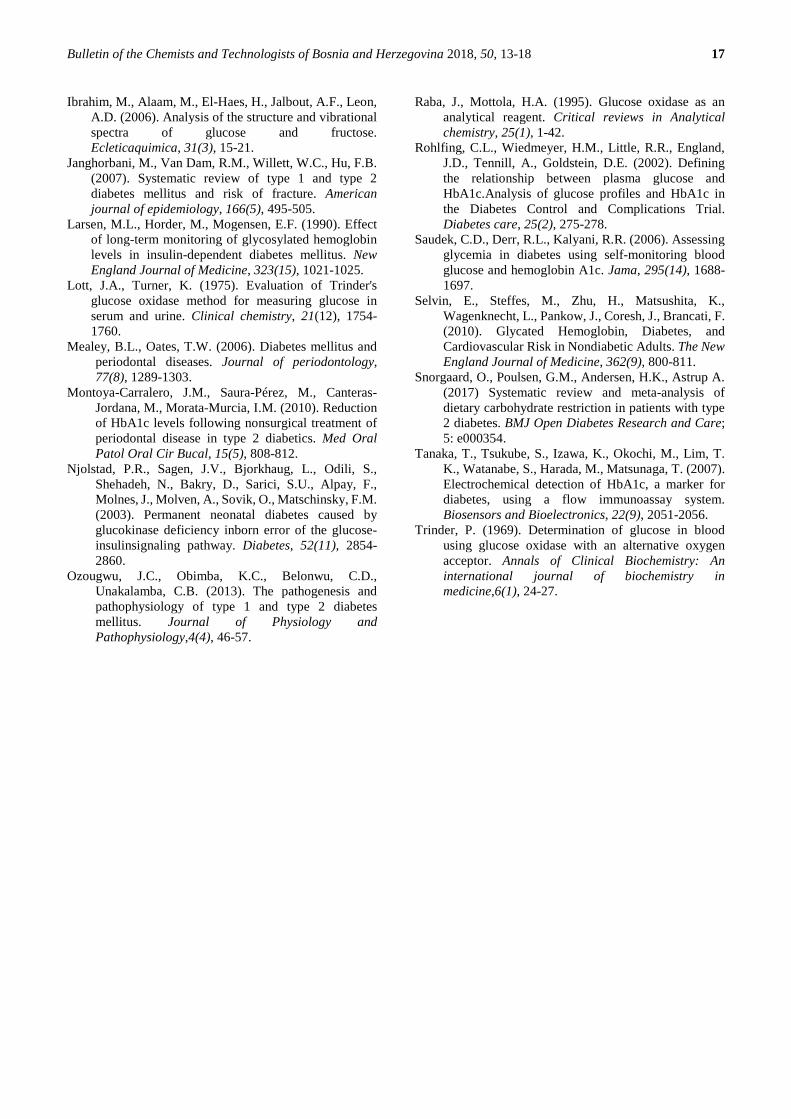
M-I: the first measurement of glucose M-II: the second measurement of glucose (in the same time as we done the second measurement of HbA1c) It has been shown that both, the increase (worsening of glucoregulation) and the decrease (improvement of glucoregulation) of glucose levels were statistically significant (p*<0.05 and p***<0.001, respectively, ANOVA test, Figure 3) after the M-II compared to M-I. Glucose levels in 27 patients of the total number of patients of the Group 2 (subgroup 2a), were increased, and in 39 patients (subgroup 2b) glucose levels were decreased (Figure 4).
Figure 4. Changes of glucose levels in the Group 2
M-I: the first measurement of glucose M-II: the second measurement of glucose (in the same time as we done the second measurement of HbA1c).
The ANOVA test confirmed that the levels of glucose in subgroup 2a after the M-II were significantly higher than in the M-I (Figure 4, p*<0.05). According to the HbA1c levels for the same subgroups, statistical significantly increase of glucose levels indicates worsened glucoregulation, whereas statistical significantly decrease of glucose levels in subgroups 2b (in according to the HbA1c levels for the same subgroups) after the M-II (Figure 4, p***<0.001), leads to the conclusion that the glucoregulation process has improved. Our results showed that younger patients (Group 1) can have a better glucoregulation than the older (Group 2), because their glucose levels after 90 days were statistically lower (p*<0.05), and also the HbA1c decrease after 90 days
was higher than in older patients (0.47% and 0.14%, respectively), but without statistical significance. Rohlfing et al. (2002), established the linear relationship between mean plasma glucose and HbA1c (the study was performed on 1439 patients with type 1 diabetes). In our study HbA1c also correlates with glucose: in both subgroups of patients where levels of glucose were increased (1a) or decreased (1b), HbA1c levels were also increased or decreased. In the study by Larsen et al. (1990) it was shown that regular monitoring of measured levels of HbA1c accompanied by appropriate diet and living habits leads to a fall in the value of the same. CONCLUSIONS Based on collected results and the statistical analysis, it was concluded that, after 90 days, in 61patients (22 in the Group 1, and 39 in the Group 2) out of the total number of patients, lower HbA1c and glucose levels were recorded, while in 39 patients (12in the Group 1, and 27 in the Group 2) an increase in HbA1c and glucose levels was registered. Given that, a significant percentage of patients (61%) manifested improved glucoregulation. Also, the differences in all subgroups with increase or decrease of HbA1c and glucose levels after 90 days, were statistically significant. Possible causes of unfavorable results in a smaller, but significant percentage of subjects (39%), in which an increase in HbA1c and glucose levels was found, should be sought in the unadjusted therapies, irregular controls, social status or insufficient education of patients (Snorgaard, et al., 2017).
REFERENCES Alegre-Díaz, J., Herrington, W., López Cervantes,
M.,Gnatiuc, L., Ramirez, R., Hill, M., Baigent, C., McCarthy, M.I., Lewington, S., Collins, R., Whitlock, G., Tapia-Conyer, R., Peto, R., Kuri-Morales, P., Emberson, J.R. (2016). Diabetes and cause-specific mortality in Mexico City. The New England Journal of Medicine, 375,1961-1971.
Alimanovic-Halilovic, E., Ljaljevic, S., Alimanovic, I., Mavija, M., Oros, A., Nisic, F. (2015). Analysis of the influence of type of diabetes mellitus on the development and type of glaucoma. Medical Archives, 69(1), 34-37.
Beltran Del Rio, M., Tiwari, M., Amodu, L.I., Cagliani, J., Rodriguez Rilo, H.L. (2016). Glycated Hemoglobin, Plasma Glucose, and Erythrocyte Aging. Journal of Diabetes Science and Technology, 10(6), 1303-1307.
Guyton, A.C., Hall, J.E. (2006). Textbook of medical physiology. Elsevier Health Sciences.
Hinzmann, R., Schlaeger, C., Tran, C.T. (2012). What do we need beyond hemoglobin A1c to get the complete picture of glycemia in people with diabetes. International Journal of Medical Science, 9(8), 665-681.
Bulletin of the Chemists and Technologists of Bosnia and Herzegovina 2018, 50, 13-18 17
Ibrahim, M., Alaam, M., El-Haes, H., Jalbout, A.F., Leon, A.D. (2006). Analysis of the structure and vibrational spectra of glucose and fructose. Ecleticaquimica, 31(3), 15-21.
Janghorbani, M., Van Dam, R.M., Willett, W.C., Hu, F.B. (2007). Systematic review of type 1 and type 2 diabetes mellitus and risk of fracture. American journal of epidemiology, 166(5), 495-505.
Larsen, M.L., Horder, M., Mogensen, E.F. (1990). Effect of long-term monitoring of glycosylated hemoglobin levels in insulin-dependent diabetes mellitus. New England Journal of Medicine, 323(15), 1021-1025.
Lott, J.A., Turner, K. (1975). Evaluation of Trinder's glucose oxidase method for measuring glucose in serum and urine. Clinical chemistry, 21(12), 1754-1760.
Mealey, B.L., Oates, T.W. (2006). Diabetes mellitus and periodontal diseases. Journal of periodontology, 77(8), 1289-1303.
Montoya-Carralero, J.M., Saura-Pérez, M., Canteras-Jordana, M., Morata-Murcia, I.M. (2010). Reduction of HbA1c levels following nonsurgical treatment of periodontal disease in type 2 diabetics. Med Oral Patol Oral Cir Bucal, 15(5), 808-812.
Njolstad, P.R., Sagen, J.V., Bjorkhaug, L., Odili, S., Shehadeh, N., Bakry, D., Sarici, S.U., Alpay, F., Molnes, J., Molven, A., Sovik, O., Matschinsky, F.M. (2003). Permanent neonatal diabetes caused by glucokinase deficiency inborn error of the glucose-insulinsignaling pathway. Diabetes, 52(11), 2854-2860.
Ozougwu, J.C., Obimba, K.C., Belonwu, C.D., Unakalamba, C.B. (2013). The pathogenesis and pathophysiology of type 1 and type 2 diabetes mellitus. Journal of Physiology and Pathophysiology,4(4), 46-57.
Raba, J., Mottola, H.A. (1995). Glucose oxidase as an analytical reagent. Critical reviews in Analytical chemistry, 25(1), 1-42.
Rohlfing, C.L., Wiedmeyer, H.M., Little, R.R., England, J.D., Tennill, A., Goldstein, D.E. (2002). Defining the relationship between plasma glucose and HbA1c.Analysis of glucose profiles and HbA1c in the Diabetes Control and Complications Trial. Diabetes care, 25(2), 275-278.
Saudek, C.D., Derr, R.L., Kalyani, R.R. (2006). Assessing glycemia in diabetes using self-monitoring blood glucose and hemoglobin A1c. Jama, 295(14), 1688-1697.
Selvin, E., Steffes, M., Zhu, H., Matsushita, K., Wagenknecht, L., Pankow, J., Coresh, J., Brancati, F. (2010). Glycated Hemoglobin, Diabetes, and Cardiovascular Risk in Nondiabetic Adults. The New England Journal of Medicine, 362(9), 800-811.
Snorgaard, O., Poulsen, G.M., Andersen, H.K., Astrup A. (2017) Systematic review and meta-analysis of dietary carbohydrate restriction in patients with type 2 diabetes. BMJ Open Diabetes Research and Care; 5: e000354.
Tanaka, T., Tsukube, S., Izawa, K., Okochi, M., Lim, T. K., Watanabe, S., Harada, M., Matsunaga, T. (2007). Electrochemical detection of HbA1c, a marker for diabetes, using a flow immunoassay system. Biosensors and Bioelectronics, 22(9), 2051-2056.
Trinder, P. (1969). Determination of glucose in blood using glucose oxidase with an alternative oxygen acceptor. Annals of Clinical Biochemistry: An international journal of biochemistry in medicine,6(1), 24-27.
18 Tahirović et al.
Summary/Sažetak Diabetes mellitus (DM) se definira kao potpuni ili relativni nedostatak inzulina, ili stanje hronične hiperglikemije.
Hemoglobin A1c (HbA1c) je manje zastupljeni, oblik Hb koji nastaje in vivo posttranslacijskom modifikacijom sa
glukozom. U biohemijskoj laboratorijskoj praksi u prošlih 30 godina HbA1c je postao “zlatni standard” za kliničko
praćenje DM. Cilj ovog izučavanja bio je odreditinivoe glukoze i HbA1c kod 100 bolesnika sa DM u Domu zdravlja
„Zavidovići” u različitom vremenskom intervalu, te na osnovu rezultata procijeniti glukoregulaciju. Nivoi HbA1c i
glukoze mjereni su u 3-mjesečnim vremenskim periodima. Dobiveni rezultati su analizirani odgovarajućom statističkom
metodom, da se utvrdi da li postoje statistički značajne razlike između nivoa glukoze, odnosno HbA1c, mjerenih u krvnoj
plazmi i punoj krvi u dva različita vremenska perioda. Za određivanje HbA1c korištena je spektrofotometrijska metoda,
a glukoza je određivana enzimatsko-kolorimetrijskom metodom na biohemijskom analizatoru. Od ukupnog broja
bolesnika, kod njih 61 je nađeno da su nivoi HbA1c i glukoze bili značajno sniženi (p***<0.001) tri mjeseca nakon prvog
mjerenja, što navodi na zaključak o poboljšanju glukoregulacije. U preostalih 39 bolesnika nivoi HbA1c i glukoze bili
su značajno povišeni nakon istog vremenskog perioda (p*<0.05, ANOVA), pri čemu se može zaključiti da je
njihovaglukoregulacija pogoršana.
Effect of solvents on phenolic compounds extraction and antioxidant
activity of Prunus spinosa L. fruits
Tahirović, A.a*, Bašić, N.a, Čopra-Janićijević, A.b
aUniversity of Sarajevo, Faculty of Forestry, Department of Forest Ecology, Zagrebačka 20, Sarajevo, B&H bUniversity of Sarajevo, Faculty of Science, Department for Organic Chemistry and Biochemistry, Zmaja od Bosne ,
Sarajevo, B&H
INTRODUCTION Blackthorn (Prunus spinosa L.) is a deciduous scrub or small tree, widespread in Europe, western Asia and Northwest Africa. Fruits are known for their astringent properties. It is also used in treatment of different health conditions such as cough, diarrhea, constipation, and inflammation. Fruit possess antiseptic properties and have relaxing effects on stomach inflammation (Lust, 1980; List and Horhammer, 1971; Tardio, Pardo de Santayana, Morales, 2006). In addition to its medicinal use, fruits are also used in the food industry for the production of jams, wine, tea or juices (Veličković, Stojanović, Kostić et al., 2014). In recent years wild fruits were intensively investigated due to their antioxidant properties and increasing demand for finding new natural antioxidants for food industry and pharmaceutical production (Carocho and Ferreira, 2013;
Egea, Sancez-Bel, Romojaro, et al., 2010). Blackthorn has been recognized by several research groups as a new source of antioxidants. It has been reported that fruits are rich source of phenols, including phenolic acids, anthocyanins and flavanols (Guimarães, Barros, Dueñas, et al., 2013; Barros, Carvalho, Morais, et al., 2010; Jabłońska-Ryś, Zalewska-Korona, Kalbarczyk, 2009) It was pointed out that these compounds play a significant role in the antioxidant capacity of the plant extracts (Ruiz-Rodriguez, de Ancos, Sancez-Moreno, et al., 2014; Ganhão, Estévez, Kylli et al., 2010; Egea et al., 2010). The aim of this study was quantitative determination of phenolic compounds in fruit extracts. Antioxidant activity of the extracts was tested by DPPH, ABTS and FRAP method using Trolox as a standard. Extracts obtained with different solvent systems (water, 50% methanol, 50% ethanol, 80% methanol, 80% ethanol) were investigated. To the best of our knowledge, this is the first report on
Bulletin of the Chemists and Technologists of Bosnia and Herzegovina
Print ISSN: 0367-4444
Online ISSN: 2232-7266
2018
50
19-24 UDC: __________________________
Original Scientific Article
Article info Received: 15/04/2018 Accepted: 14/06/2018 Keywords: Prunus spinosa L. Phenolic Antioxidant activity DPPH ABTS FRAP
*Corresponding author: [email protected] Phone: +387 33 279 905 Fax: +387 33 649 359
Abstract: The aim of this work was quantification of phenolic compounds and
determination of antioxidant activity of Prunusspinosa fruit extracts. Extractions of
phenolic compounds were carried out with water and four alcohol mixture (50%
methanol, 50% ethanol, 80% methanol, and 80% ethanol). Spectrophotometric
determination of phenolic compounds was done by Folin-Ciocalteu method and
flavonoids with AlCl3 method. Arnow reagent was used in determination of phenolic
acid content while anthocyanin content was determined with pH differential method.
Butanol-HCl assay was applied to determine proanthocyanidin content. Investigated
phenolic compounds were in the range of 14.02-30.20 mg GAE/g dw (total phenolic
compounds), 0.789-1.538 mf RE/g dw and 0.450-1.039 mg QE/g dw (flavonoids),
4.55-7.24 mg CAE/g dw (phenolic acids), 0.361-1.05 mg CGE/g dw (anthocyanins),
3.97-26.49 mg CE/g dw (proanthocyanins). The highest content of investigated
compounds was found for 50% ethanol extract (except anthocyanins) and the lowest
content was in water extract. The highest antioxidant activity had 50% ethanol
extract for all antioxidant methods. Very high correlations were found between
antioxidant activity and content of all analyzed compounds.
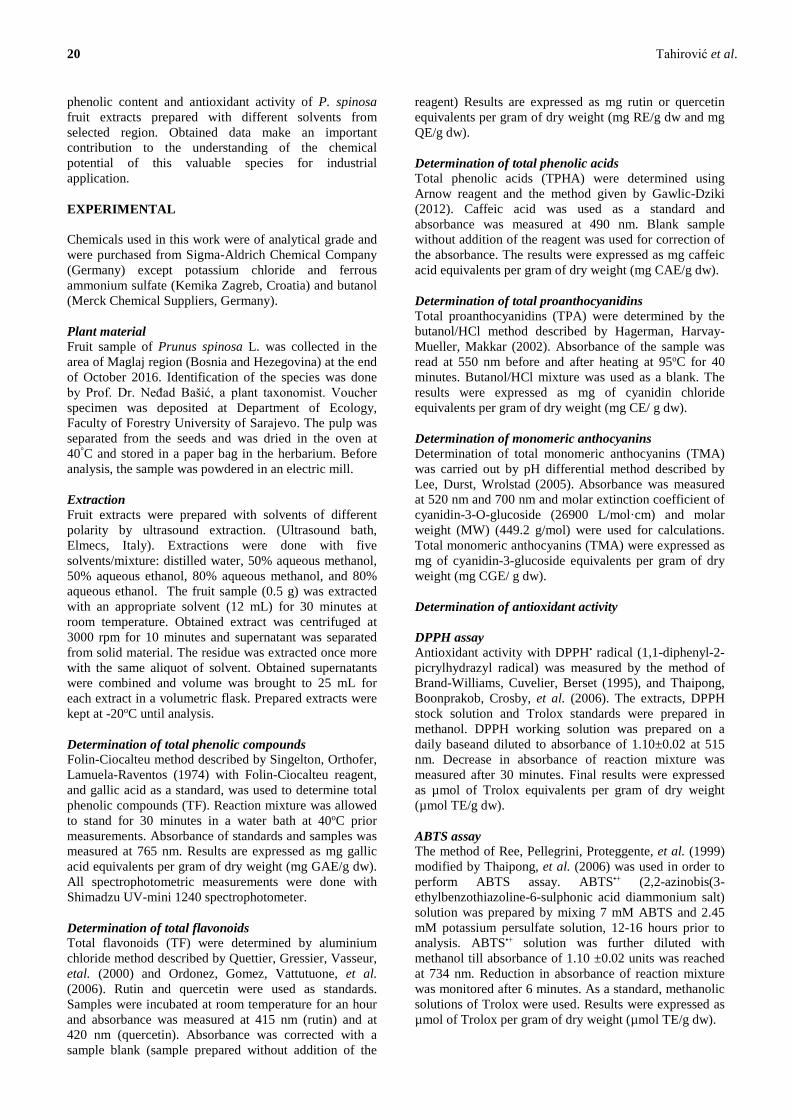
20 Tahirović et al.
phenolic content and antioxidant activity of P. spinosa fruit extracts prepared with different solvents from selected region. Obtained data make an important contribution to the understanding of the chemical potential of this valuable species for industrial application. EXPERIMENTAL Chemicals used in this work were of analytical grade and were purchased from Sigma-Aldrich Chemical Company (Germany) except potassium chloride and ferrous ammonium sulfate (Kemika Zagreb, Croatia) and butanol (Merck Chemical Suppliers, Germany). Plant material Fruit sample of Prunus spinosa L. was collected in the area of Maglaj region (Bosnia and Hezegovina) at the end of October 2016. Identification of the species was done by Prof. Dr. Neđad Bašić, a plant taxonomist. Voucher specimen was deposited at Department of Ecology, Faculty of Forestry University of Sarajevo. The pulp was separated from the seeds and was dried in the oven at 40°C and stored in a paper bag in the herbarium. Before analysis, the sample was powdered in an electric mill. Extraction Fruit extracts were prepared with solvents of different polarity by ultrasound extraction. (Ultrasound bath, Elmecs, Italy). Extractions were done with five solvents/mixture: distilled water, 50% aqueous methanol, 50% aqueous ethanol, 80% aqueous methanol, and 80% aqueous ethanol. The fruit sample (0.5 g) was extracted with an appropriate solvent (12 mL) for 30 minutes at room temperature. Obtained extract was centrifuged at 3000 rpm for 10 minutes and supernatant was separated from solid material. The residue was extracted once more with the same aliquot of solvent. Obtained supernatants were combined and volume was brought to 25 mL for each extract in a volumetric flask. Prepared extracts were kept at -20oC until analysis. Determination of total phenolic compounds Folin-Ciocalteu method described by Singelton, Orthofer, Lamuela-Raventos (1974) with Folin-Ciocalteu reagent, and gallic acid as a standard, was used to determine total phenolic compounds (TF). Reaction mixture was allowed to stand for 30 minutes in a water bath at 40oC prior measurements. Absorbance of standards and samples was measured at 765 nm. Results are expressed as mg gallic acid equivalents per gram of dry weight (mg GAE/g dw). All spectrophotometric measurements were done with Shimadzu UV-mini 1240 spectrophotometer. Determination of total flavonoids Total flavonoids (TF) were determined by aluminium chloride method described by Quettier, Gressier, Vasseur, etal. (2000) and Ordonez, Gomez, Vattutuone, et al. (2006). Rutin and quercetin were used as standards. Samples were incubated at room temperature for an hour and absorbance was measured at 415 nm (rutin) and at 420 nm (quercetin). Absorbance was corrected with a sample blank (sample prepared without addition of the
reagent) Results are expressed as mg rutin or quercetin equivalents per gram of dry weight (mg RE/g dw and mg QE/g dw). Determination of total phenolic acids Total phenolic acids (TPHA) were determined using Arnow reagent and the method given by Gawlic-Dziki (2012). Caffeic acid was used as a standard and absorbance was measured at 490 nm. Blank sample without addition of the reagent was used for correction of the absorbance. The results were expressed as mg caffeic acid equivalents per gram of dry weight (mg CAE/g dw). Determination of total proanthocyanidins Total proanthocyanidins (TPA) were determined by the butanol/HCl method described by Hagerman, Harvay-Mueller, Makkar (2002). Absorbance of the sample was read at 550 nm before and after heating at 95oC for 40 minutes. Butanol/HCl mixture was used as a blank. The results were expressed as mg of cyanidin chloride equivalents per gram of dry weight (mg CE/ g dw). Determination of monomeric anthocyanins Determination of total monomeric anthocyanins (TMA) was carried out by pH differential method described by Lee, Durst, Wrolstad (2005). Absorbance was measured at 520 nm and 700 nm and molar extinction coefficient of cyanidin-3-O-glucoside (26900 L/mol·cm) and molar weight (MW) (449.2 g/mol) were used for calculations. Total monomeric anthocyanins (TMA) were expressed as mg of cyanidin-3-glucoside equivalents per gram of dry weight (mg CGE/ g dw). Determination of antioxidant activity DPPH assay Antioxidant activity with DPPH• radical (1,1-diphenyl-2-picrylhydrazyl radical) was measured by the method of Brand-Williams, Cuvelier, Berset (1995), and Thaipong, Boonprakob, Crosby, et al. (2006). The extracts, DPPH stock solution and Trolox standards were prepared in methanol. DPPH working solution was prepared on a daily baseand diluted to absorbance of 1.10±0.02 at 515 nm. Decrease in absorbance of reaction mixture was measured after 30 minutes. Final results were expressed as µmol of Trolox equivalents per gram of dry weight (µmol TE/g dw). ABTS assay The method of Ree, Pellegrini, Proteggente, et al. (1999) modified by Thaipong, et al. (2006) was used in order to perform ABTS assay. ABTS•+ (2,2-azinobis(3-ethylbenzothiazoline-6-sulphonic acid diammonium salt) solution was prepared by mixing 7 mM ABTS and 2.45 mM potassium persulfate solution, 12-16 hours prior to analysis. ABTS•+ solution was further diluted with methanol till absorbance of 1.10 ±0.02 units was reached at 734 nm. Reduction in absorbance of reaction mixture was monitored after 6 minutes. As a standard, methanolic solutions of Trolox were used. Results were expressed as µmol of Trolox per gram of dry weight (µmol TE/g dw).
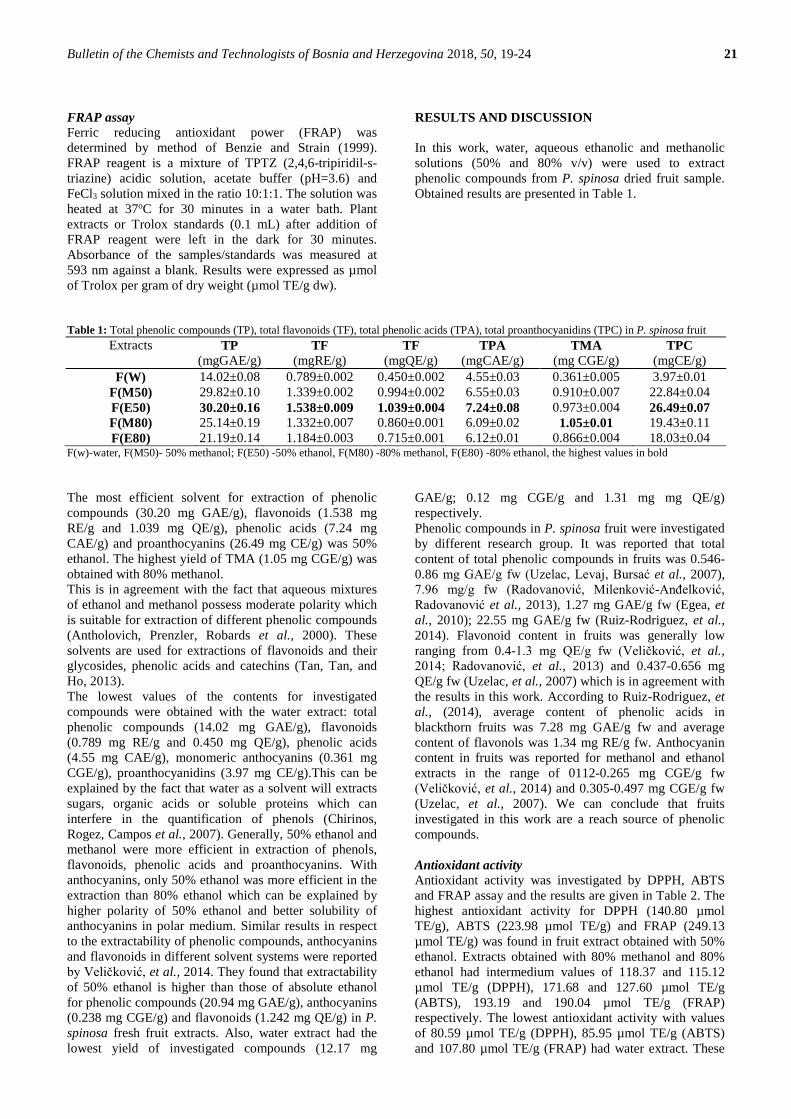
Bulletin of the Chemists and Technologists of Bosnia and Herzegovina 2018, 50, 19-24 21
FRAP assay Ferric reducing antioxidant power (FRAP) was determined by method of Benzie and Strain (1999). FRAP reagent is a mixture of TPTZ (2,4,6-tripiridil-s-triazine) acidic solution, acetate buffer (pH=3.6) and FeCl3 solution mixed in the ratio 10:1:1. The solution was heated at 37oC for 30 minutes in a water bath. Plant extracts or Trolox standards (0.1 mL) after addition of FRAP reagent were left in the dark for 30 minutes. Absorbance of the samples/standards was measured at 593 nm against a blank. Results were expressed as µmol of Trolox per gram of dry weight (µmol TE/g dw).
RESULTS AND DISCUSSION In this work, water, aqueous ethanolic and methanolic solutions (50% and 80% v/v) were used to extract phenolic compounds from P. spinosa dried fruit sample. Obtained results are presented in Table 1.
Table 1: Total phenolic compounds (TP), total flavonoids (TF), total phenolic acids (TPA), total proanthocyanidins (TPC) in P. spinosa fruit
Extracts TP (mgGAE/g)
TF (mgRE/g)
TF (mgQE/g)
TPA (mgCAE/g)
TMA (mg CGE/g)
TPC (mgCE/g)
F(W) 14.02±0.08 0.789±0.002 0.450±0.002 4.55±0.03 0.361±0.005 3.97±0.01 F(M50) 29.82±0.10 1.339±0.002 0.994±0.002 6.55±0.03 0.910±0.007 22.84±0.04 F(E50) 30.20±0.16 1.538±0.009 1.039±0.004 7.24±0.08 0.973±0.004 26.49±0.07 F(M80) 25.14±0.19 1.332±0.007 0.860±0.001 6.09±0.02 1.05±0.01 19.43±0.11 F(E80) 21.19±0.14 1.184±0.003 0.715±0.001 6.12±0.01 0.866±0.004 18.03±0.04
F(w)-water, F(M50)- 50% methanol; F(E50) -50% ethanol, F(M80) -80% methanol, F(E80) -80% ethanol, the highest values in bold The most efficient solvent for extraction of phenolic compounds (30.20 mg GAE/g), flavonoids (1.538 mg RE/g and 1.039 mg QE/g), phenolic acids (7.24 mg CAE/g) and proanthocyanins (26.49 mg CE/g) was 50% ethanol. The highest yield of TMA (1.05 mg CGE/g) was obtained with 80% methanol. This is in agreement with the fact that aqueous mixtures of ethanol and methanol possess moderate polarity which is suitable for extraction of different phenolic compounds (Antholovich, Prenzler, Robards et al., 2000). These solvents are used for extractions of flavonoids and their glycosides, phenolic acids and catechins (Tan, Tan, and Ho, 2013). The lowest values of the contents for investigated compounds were obtained with the water extract: total phenolic compounds (14.02 mg GAE/g), flavonoids (0.789 mg RE/g and 0.450 mg QE/g), phenolic acids (4.55 mg CAE/g), monomeric anthocyanins (0.361 mg CGE/g), proanthocyanidins (3.97 mg CE/g).This can be explained by the fact that water as a solvent will extracts sugars, organic acids or soluble proteins which can interfere in the quantification of phenols (Chirinos, Rogez, Campos et al., 2007). Generally, 50% ethanol and methanol were more efficient in extraction of phenols, flavonoids, phenolic acids and proanthocyanins. With anthocyanins, only 50% ethanol was more efficient in the extraction than 80% ethanol which can be explained by higher polarity of 50% ethanol and better solubility of anthocyanins in polar medium. Similar results in respect to the extractability of phenolic compounds, anthocyanins and flavonoids in different solvent systems were reported by Veličković, et al., 2014. They found that extractability of 50% ethanol is higher than those of absolute ethanol for phenolic compounds (20.94 mg GAE/g), anthocyanins (0.238 mg CGE/g) and flavonoids (1.242 mg QE/g) in P. spinosa fresh fruit extracts. Also, water extract had the lowest yield of investigated compounds (12.17 mg
GAE/g; 0.12 mg CGE/g and 1.31 mg mg QE/g) respectively. Phenolic compounds in P. spinosa fruit were investigated by different research group. It was reported that total content of total phenolic compounds in fruits was 0.546-0.86 mg GAE/g fw (Uzelac, Levaj, Bursać et al., 2007), 7.96 mg/g fw (Radovanović, Milenković-Anđelković, Radovanović et al., 2013), 1.27 mg GAE/g fw (Egea, et al., 2010); 22.55 mg GAE/g fw (Ruiz-Rodriguez, et al., 2014). Flavonoid content in fruits was generally low ranging from 0.4-1.3 mg QE/g fw (Veličković, et al., 2014; Radovanović, et al., 2013) and 0.437-0.656 mg QE/g fw (Uzelac, et al., 2007) which is in agreement with the results in this work. According to Ruiz-Rodriguez, et al., (2014), average content of phenolic acids in blackthorn fruits was 7.28 mg GAE/g fw and average content of flavonols was 1.34 mg RE/g fw. Anthocyanin content in fruits was reported for methanol and ethanol extracts in the range of 0112-0.265 mg CGE/g fw (Veličković, et al., 2014) and 0.305-0.497 mg CGE/g fw (Uzelac, et al., 2007). We can conclude that fruits investigated in this work are a reach source of phenolic compounds. Antioxidant activity Antioxidant activity was investigated by DPPH, ABTS and FRAP assay and the results are given in Table 2. The highest antioxidant activity for DPPH (140.80 µmol TE/g), ABTS (223.98 µmol TE/g) and FRAP (249.13 µmol TE/g) was found in fruit extract obtained with 50% ethanol. Extracts obtained with 80% methanol and 80% ethanol had intermedium values of 118.37 and 115.12 µmol TE/g (DPPH), 171.68 and 127.60 µmol TE/g (ABTS), 193.19 and 190.04 µmol TE/g (FRAP) respectively. The lowest antioxidant activity with values of 80.59 µmol TE/g (DPPH), 85.95 µmol TE/g (ABTS) and 107.80 µmol TE/g (FRAP) had water extract. These
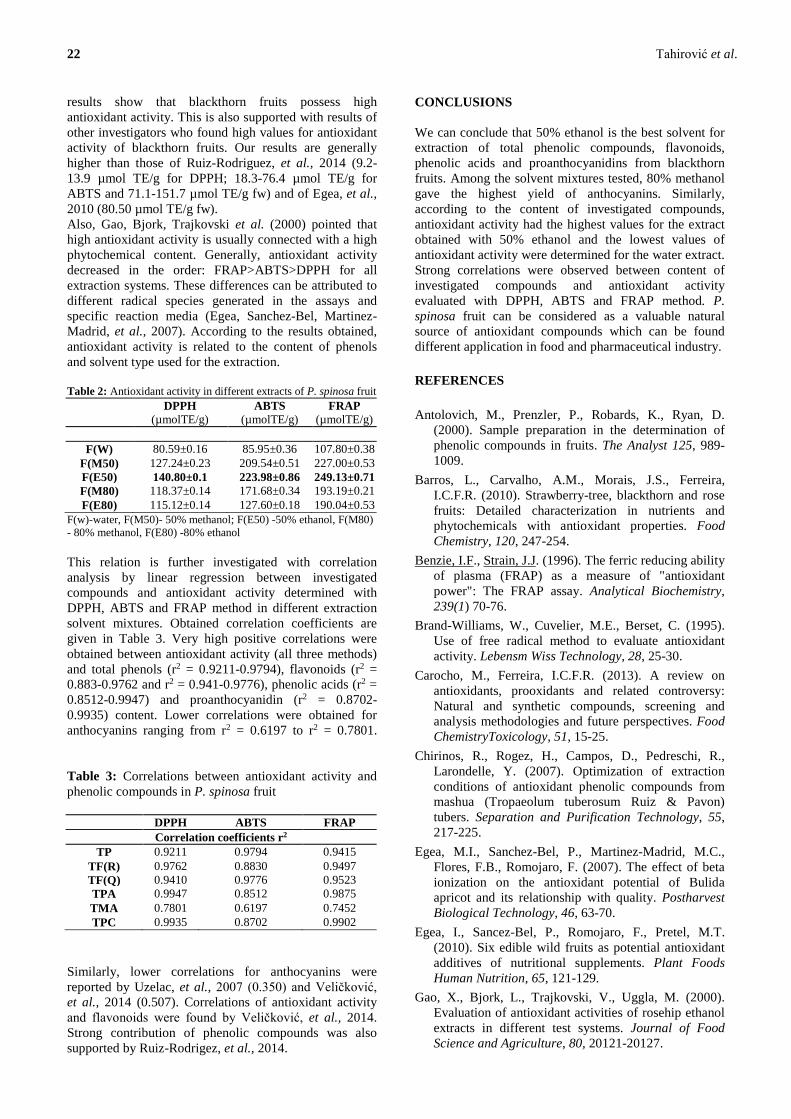
22 Tahirović et al.
results show that blackthorn fruits possess high antioxidant activity. This is also supported with results of other investigators who found high values for antioxidant activity of blackthorn fruits. Our results are generally higher than those of Ruiz-Rodriguez, et al., 2014 (9.2-13.9 µmol TE/g for DPPH; 18.3-76.4 µmol TE/g for ABTS and 71.1-151.7 µmol TE/g fw) and of Egea, et al., 2010 (80.50 µmol TE/g fw). Also, Gao, Bjork, Trajkovski et al. (2000) pointed that high antioxidant activity is usually connected with a high phytochemical content. Generally, antioxidant activity decreased in the order: FRAP>ABTS>DPPH for all extraction systems. These differences can be attributed to different radical species generated in the assays and specific reaction media (Egea, Sanchez-Bel, Martinez-Madrid, et al., 2007). According to the results obtained, antioxidant activity is related to the content of phenols and solvent type used for the extraction. Table 2: Antioxidant activity in different extracts of P. spinosa fruit
DPPH (µmolTE/g)
ABTS (µmolTE/g)
FRAP (µmolTE/g)
F(W) 80.59±0.16 85.95±0.36 107.80±0.38
F(M50) 127.24±0.23 209.54±0.51 227.00±0.53 F(E50) 140.80±0.1 223.98±0.86 249.13±0.71 F(M80) 118.37±0.14 171.68±0.34 193.19±0.21 F(E80) 115.12±0.14 127.60±0.18 190.04±0.53
F(w)-water, F(M50)- 50% methanol; F(E50) -50% ethanol, F(M80) - 80% methanol, F(E80) -80% ethanol This relation is further investigated with correlation analysis by linear regression between investigated compounds and antioxidant activity determined with DPPH, ABTS and FRAP method in different extraction solvent mixtures. Obtained correlation coefficients are given in Table 3. Very high positive correlations were obtained between antioxidant activity (all three methods) and total phenols (r2 = 0.9211-0.9794), flavonoids (r2 = 0.883-0.9762 and r2 = 0.941-0.9776), phenolic acids (r2 = 0.8512-0.9947) and proanthocyanidin (r2 = 0.8702-0.9935) content. Lower correlations were obtained for anthocyanins ranging from r2 = 0.6197 to r2 = 0.7801. Table 3: Correlations between antioxidant activity and phenolic compounds in P. spinosa fruit
DPPH ABTS FRAP Correlation coefficients r2
TP 0.9211 0.9794 0.9415 TF(R) 0.9762 0.8830 0.9497 TF(Q) 0.9410 0.9776 0.9523 TPA 0.9947 0.8512 0.9875 TMA 0.7801 0.6197 0.7452 TPC 0.9935 0.8702 0.9902
Similarly, lower correlations for anthocyanins were reported by Uzelac, et al., 2007 (0.350) and Veličković, et al., 2014 (0.507). Correlations of antioxidant activity and flavonoids were found by Veličković, et al., 2014. Strong contribution of phenolic compounds was also supported by Ruiz-Rodrigez, et al., 2014.
CONCLUSIONS We can conclude that 50% ethanol is the best solvent for extraction of total phenolic compounds, flavonoids, phenolic acids and proanthocyanidins from blackthorn fruits. Among the solvent mixtures tested, 80% methanol gave the highest yield of anthocyanins. Similarly, according to the content of investigated compounds, antioxidant activity had the highest values for the extract obtained with 50% ethanol and the lowest values of antioxidant activity were determined for the water extract. Strong correlations were observed between content of investigated compounds and antioxidant activity evaluated with DPPH, ABTS and FRAP method. P. spinosa fruit can be considered as a valuable natural source of antioxidant compounds which can be found different application in food and pharmaceutical industry. REFERENCES Antolovich, M., Prenzler, P., Robards, K., Ryan, D.
(2000). Sample preparation in the determination of phenolic compounds in fruits. The Analyst 125, 989-1009.
Barros, L., Carvalho, A.M., Morais, J.S., Ferreira, I.C.F.R. (2010). Strawberry-tree, blackthorn and rose fruits: Detailed characterization in nutrients and phytochemicals with antioxidant properties. Food Chemistry, 120, 247-254.
Benzie, I.F., Strain, J.J. (1996). The ferric reducing ability of plasma (FRAP) as a measure of "antioxidant power": The FRAP assay. Analytical Biochemistry, 239(1) 70-76.
Brand-Williams, W., Cuvelier, M.E., Berset, C. (1995). Use of free radical method to evaluate antioxidant activity. Lebensm Wiss Technology, 28, 25-30.
Carocho, M., Ferreira, I.C.F.R. (2013). A review on antioxidants, prooxidants and related controversy: Natural and synthetic compounds, screening and analysis methodologies and future perspectives. Food ChemistryToxicology, 51, 15-25.
Chirinos, R., Rogez, H., Campos, D., Pedreschi, R., Larondelle, Y. (2007). Optimization of extraction conditions of antioxidant phenolic compounds from mashua (Tropaeolum tuberosum Ruiz & Pavon) tubers. Separation and Purification Technology, 55, 217-225.
Egea, M.I., Sanchez-Bel, P., Martinez-Madrid, M.C., Flores, F.B., Romojaro, F. (2007). The effect of beta ionization on the antioxidant potential of Bulida apricot and its relationship with quality. Postharvest Biological Technology, 46, 63-70.
Egea, I., Sancez-Bel, P., Romojaro, F., Pretel, M.T. (2010). Six edible wild fruits as potential antioxidant additives of nutritional supplements. Plant Foods Human Nutrition, 65, 121-129.
Gao, X., Bjork, L., Trajkovski, V., Uggla, M. (2000). Evaluation of antioxidant activities of rosehip ethanol extracts in different test systems. Journal of Food Science and Agriculture, 80, 20121-20127.

Bulletin of the Chemists and Technologists of Bosnia and Herzegovina 2018, 50, 19-24 23
Ganhão, R., Estévez, M., Kylli, P., Heinonen, M., Morcuende, D. (2010). Characterization of selected wild mediterranean fruits and comparative efficacy as inhibitors of oxidative reactions in emulsified raw pork burger patties. Journal of Agriculture and Food Chemical, 58, 8854-8861.
Gawlic-Dziki, U. (2012). Dietary spices as natural effectors of lipoxygenase, xanthine oxidase, peroxidase and antioxidant agents. LTW-Food Science and Technology, 47, 138-146.
Guimarães, R., Barros, L., Dueñas, M., Carvalho, A.M., Queiroz, M.J.R.P., Santos-Buelga, C., Ferreira, I.C.F.R. (2013) Characterization of phenolic compounds in wild fruits from Northeastern Portugal. Food Chemistry, 141, 3721-3730.
Hagerman, A., Harvey-Mueller, I., Makkar, H.P.S. (2000b). Quantification of tannins in tree foliage–a laboratory manual. FAO/IAEA, Vienna, 4-7.
Jabłońska-Ryś, E., Zalewska-Korona, M., Kalbarczyk, J. (2009). Antioxidant capacity, ascorbic acid and phenolics content in wild edible fruits, Journal of Fruit Ornamental Plant Research, 17, 115-120.
Lee, J., Durst, R.W., Wrolstad, E. (2005). Determination of total monomeric anthocyanin pigment content of fruit juices, beverages, natural colorants, and wines by pH differential method: Collaborative study. Journal of AOAC International, 88(5), 1269-1278.
List, P. H. Horhammer, L. (1971). Hagers Handbuch der Pharmazeutischen Praxis, Bd.6, Springer, Berlin-Heidelberg - New York.
Lust, J. (1980). The herb book, New York, Bantam. Ordonez, A.A. Gomez, J.G., Vattuone, M.A., Isla, M.I.
(2006). Antioxidant activities of Sechium edule swart extracts. Food Chemistry, 97,452-458.
Quettier, D.C., Gressier, B., Vasseur, J., Dine, T., Brunet, C., Luyck, M.C., Cayin, J.C., Bailleul, F., Trotin, F. (2000). Phenolic compounds and antioxidant activities of buckwheat (Fagopyrum esculentum Moench) hulls and flour. Journal of Ethnopharmacology, 118, 418-428.
Radovanović, B.C., Milenković-Anđelković, A.S., Radovanović, A.B., Anđelković, M.Z. (2013). Antioxidant and antimicrobial activity of polyphenol extracts from wild berry fruits grown in Southeast Serbia. Tropical Journal of Pharmaceutical Research, 12(5), 813-819.
Re, R., Pellegrini, N., Proteggente, A., Pannala, A., Yang, M., Rice-Evans, C. (1999). Antioxidant activity applying an improved ABTS radical cation decolorization assay. Free Radical Biology and Medicine, 26, 1231-1237
Ruiz-Rodrigez, B., de Ancos, B., Sanchez-Moreno, C., Fernandez-Ruiz, V., Sancez-Mata, M.C., Camara, M., Tardio, J. (2014). Wild blackthorn (Prunus spinosa L.) and hawthorn (Crataegus monogyna Jacq.) as valuble source of antioxidants. Fruits, 69, 61-73.
Singleton, V.L., Orthofer, R., Lamuela-Raventos, R.M. (1974). Analysis of total phenols and other oxidation substrates and antioxidants by means of Folin-Ciocalteu reagent. Methods of Enzymology, 229, 152-178.
Tan, M.C., Tan, C.P., Ho, C.W. (2013). Effects of extraction solvent system, time and temperature on total phenolic content of henna (Lawson inermis) stems. Journal of International Food Research, 20, 3117-3123.
Tardio J., Pardo de Santayana M., Morales R. (2006). Ethnobotanical review of wild edible plants in Spain. Botanical Journal of the Linnean Society, 152, 27–71.
Thaipong, K., Boonprakob, U., Crosby, K., Cisneros-Zevallos, L., Byrne, D.H. (2006). Comparison of ABTS, DPPH, FRAP and ORAC assays for estimating antioxidant activity from guava fruit extracts. Journal of Food Composition and Analysis, 19, 669-675.
Uzelac, V., Levaj, B., Bursać, D., Pedisić, S., Radojčić, I., Biško, A. (2007). Total Phenols and antioxidant assays of selected fruits. Agriculturae Conspectus Scientificus, 72, 279-284.
Veličković, J.M., Kostić, D.A., Stojanović, G.S., Mitić, S.S., Mitić, M.N., Ranđelović, S.S., Đorđević, A.S. (2014). Phenolic composition, antioxidant and antimicrobial activity of the extracts from Prunus spinosa L. fruit. Hemijska industrija, 68(3) 297-303.
24 Tahirović et al.
Summary/Sažetak
Cilj ovoga rada bila je kvantifikacija fenolnih jedinjenja i određivanje antioksidacijskih svojstava ekstrakata plodova
Prunus spinosa. Ekstrakcije fenolnih jedinjenja su izvršene sa vodom i četiri vodeno-alkoholne smjese (50% metanolom,
50% etanolom, 80% metanolom i 80% etanolom). Spektrofotometrijsko određivanje fenola provedeno je metodom Folin-
Ciocalteu, a flavonoida sa AlCl3 metodom. Arnow reagens je korišten za određivanje sadržaja fenolnih kiselina, dok je
sadržaj antocijanina određen pH diferencijalnom metodom. Određivanje proantocijanidina izvršeno je primjenom
kiselinsko-butanolne metode. Sadržaj ispitivanih fenolnih jedinjenja kretao se u rasponu od 14,02 do 30,20 mg GAE/g dw
(ukupna fenolna jedinjenja), 0,789-1,538 mf RE/g dw i 0,450-1,039 mg QE/g dw (flavonoidi), 4,55-7,24 mg CAE/g dw
fenolne kiseline), 0,361-1,05 mg CGE/g dw (antocijanini), 3,97-26,49 mg CE/g dw (proantocijanidini). Najveći udio
ispitivanih jedinjenja imao je 50% -tni ekstrakt etanola (izuzev antocijanina) a najniži sadržaj određen je u ekstraktu vode.
Najveća antioksidacijska aktivnost određena je za 50%-tni etanolni ekstrakt za sve antioksidacijske metode. Utvrđene su
visoke korelacije između antioksidacijske aktivnosti i sadržaja svih analiziranih jedinjenja.
Gender differences in understanding of thermal expansion
Vidak, A.*
Faculty of Chemical Engineering and Technology, University of Zagreb, Savska cesta 16, 10000 Zagreb, Croatia
INTRODUCTION
Differentiation of instruction is defined as factoring students’ individual learning styles and levels of readiness before designing a lesson plan (Tomlinson, 2000). In order to be in the position to effectively differentiate instruction, it is important to be well acquainted with knowledge about students' individual differences and skills, as well as with gender differences (Tomlinson, 2000; Halpern et al., 2007). As a matter of fact, by knowing gender differences in learning science, we can more effectively plan conceptualization and conceptual change for all our students. Gender differences in science are typically analyzed from two perspectives: biological and environmental. According to the biological perspective it is often desirable to look for gender differences very early in life to find clues to relative contribution of biological factors (Kotovsky and Baillargeon, 1998; Phillips, Wellman, &Spelke, 2002; Xu). A common finding from many studies that were focused on early age is that cognitive skills related to knowledge of objects in the environment and quantitative thinking are equally well developed in boys and girls (Spelke, 2005). According to the environmental perspective, abilities are developed under the supportive influence of environment and learning experiences (Halpern et al., 2007). Many studies showed that differences in choosing science careers are influenced by the social structures where individuals are situated, environment resources and the social interactions in which subjects are involved (Eccles,
1994; Entwistle, Alexander, Olsson, 1994; Xie and Shuman, 2003). Halpern (2000, 2004) emphasized that it is very hard to separate environmental influences from biological ones because they are in constant interaction. Consequently, she advocated a biopsychosocial approach to studying gender differences. According to that approach, learning is influenced by biological and environmental factors because environmental events such as social victories or defeats stimulate endocrine glands to secret chemicals that are affecting a variety of behaviors and brain development (Schultheiss et al., 2005). Much of earlier research shows that boys outperform girls on visuospatial tasks (Voyer, Voyer, Bryden, 1995; Loring-Meier and Halpern, 1999), whereas girls outperform boys on verbal tasks and writing (Bae et al., 2000; Ogle et al., 2003). There are many topics in science that require visual reasoning and mental simulation (Nersessian, 2008). Although girls and boys on average are equally successful in science, earlier research shows that on certain tasks boys largely outperform girls. These tasks are mainly related to visuospatial reasoning and one such task is the water-level task (Myer and Hensley, 1984; Hecht and Proffitt, 1995). Furthermore, Burkitt, Widman and Saucier (2007) showed that males outperformed females in the tasks that were arranged in the 3-D graphical virtual reality environment. A science topic that requires rich visualization and mental simulation is thermal expansion. As a matter of fact, in order to understand thermal expansion one has to visualize and mentally simulate the model of particulate nature of matter. Thereby thermal expansion is explained
BBuulllleettiinn ooff tthhee CChheemmiissttss aanndd TTeecchhnnoollooggiissttss ooff BBoossnniiaa aanndd HHeerrzzeeggoovviinnaa
PPrriinntt IISSSSNN:: 00336677--44444444
OOnnlliinnee IISSSSNN:: 22223322--77226666
22001188
5500
2255--3300 UUDDCC:: ____________________________________________________
OOrriiggiinnaall SScciieennttiiffiicc AArrttiiccllee
Article info Received: 28/02/2018 Accepted: 14/06/2018
Keywords: Thermal Expansion Gender Differences Visualization
*Corresponding author:E-mail: [email protected], Phone: +385-1-4597-106
Abstract: Investigation of gender differences in science allows us to tailor our
instruction to the needs, interests and abilities of all our students. In this study we
aimed to investigate gender differences in conceptual understanding of thermal
expansion. To that end ten conceptual questions were administered to 195 first
year students at the Faculty of Chemical Engineering and Technology, University
of Zagreb. Male students significantly outperformed female students. Particularly
large differences in favor of males were observed on questions that required
reasoning about thermal expansion in one dimension.

26 Vidak
by the fact that heating results in faster motion of particles which, together with asymmetric shape of the potential energy well, leads to an increase in average interparticle distance. However, earlier research shows that students have many misconceptions related to this topic (Erceg, Aviani, Mešić, Glunčić and Žauhar, 2016). In the study by Yeo and Zadnik (2001) it has been shown that students often thought that the temperature of an object depends on its size. In addition it has been found that students often wrongly assume that phase changes are associated with a change of the size of particles (Yalcınkaya and Boz, 2015). Another well-known misconception is that in objects with holes the diameter of the hole decreases as a result of heating (McHugh and McCauley 2016; Watkins and Mazur 2013). Generally, it seems that many of these difficulties stem from the fact that students tend to transfer their experiences from the macroscopic world to the invisible, microscopic world (Duit, 2015).
Aim of the present study In this study we aimed to investigate gender differences in understanding of thermal expansion. This is potentially significant because it provides us with feedback that can improve the effectiveness of differentiating our instruction about that introductory science topic.
Methodology Research design To answer our research question we conducted a survey research after lectures and recitation sessions about thermal expansion.
Participants Our sample consisted of 195 first year students at the Faculty of Chemical Engineering and Technology, University of Zagreb (Croatia). All the students from our sample (mostly 19 year-olds) were enrolled in the first year introductory physics course. In our sample 73% of students were females.
Curriculum and teaching treatment Before they took our survey, all the students from our sample received traditional lectures about thermal expansion. The introductory physics course can be characterized as a typical introductory physics course for scientists and engineers in Croatia. Thermal expansion phenomena was firstly explained in lectures where the accent was on facts and procedures. Thereafter students additionally learned about this topic in recitation sessions.
Assessment instruments In this study we aimed to investigate gender differences in conceptual understanding of thermal expansion. To that end, a conceptual survey has been created. Short description of the survey is provided in Table 1. From Table 1, it follows that our survey consisted of multiple choice items and open ended items. In multiple-choice items, we used common student misconceptions as distractors.
Table 1: Short description of the conceptual survey
RESULTS
We conducted an analysis of variance (ANOVA) in order to check between-gender differences on the given ten survey items. Results of ANOVA showed that there was a statistically significant difference between male and female students on the selected test items, F (1, 193)=8.192, p<0.01, partial η2=0.041.
In what follows, we will focus our attention on presenting the results for four multiple-choice items with most prominent gender differences.
Table 2 provides a summarized overview of students’ achievement on four multiple choice items.
Item 1 Item 2 Item 3 Item 4a Item 4b
Predicting the length increment of rods with different initial lengths
How difference in thermal expansion
coefficients of liquid and container affect
the liquid level?
How heating affects the distance among two straight rods
positioned along the x-axis?
How temperature change affects the vertical heights of several rectangular
plates?
How temperature change affects the
surface area of several rectangular plates?
Multiple-choice Open-ended Multiple-choice Open-ended Open-ended Item 5 Item 6 Item 7 Item 8 Item 9
How heating affects the appearance of a circular
plate with a hole
How heating affects appearance of two concentric circular
plates (same material)
The effect of heating on the expansion of a
ring and a straight rod that is placed
inside the ring, along its diameter.
How heating affects the appearance of two
concentric circular plates made of
different material.
How heating affects the three-dimensional spatial arrangement
and size of particles in a metal.
Multiple-choice Multiple-choice Multiple-choice Multiple-choice Multiple-choice
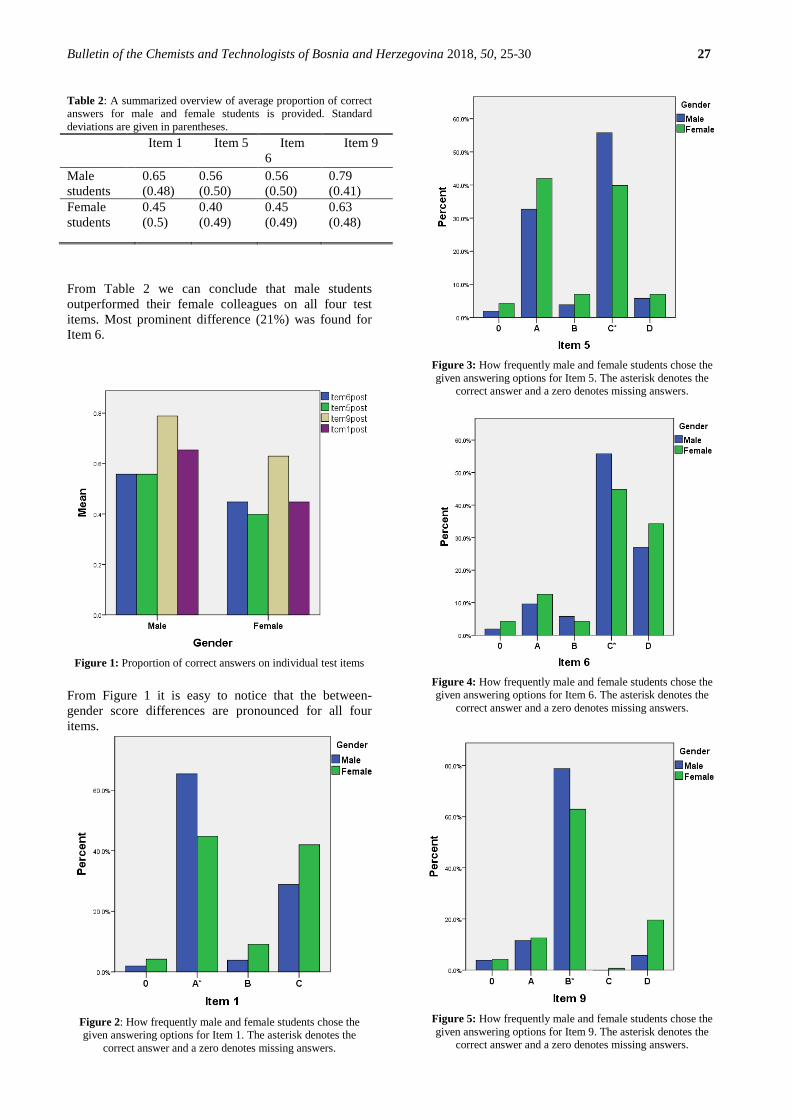
Bulletin of the Chemists and Technologists of Bosnia and Herzegovina 2018, 50, 25-30 27
Table 2: A summarized overview of average proportion of correct answers for male and female students is provided. Standard deviations are given in parentheses.
Item 1 Item 5 Item 6
Item 9
Male students
0.65 (0.48)
0.56 (0.50)
0.56 (0.50)
0.79 (0.41)
Female students
0.45 (0.5)
0.40 (0.49)
0.45 (0.49)
0.63 (0.48)
From Table 2 we can conclude that male students outperformed their female colleagues on all four test items. Most prominent difference (21%) was found for Item 6.
Figure 1: Proportion of correct answers on individual test items
From Figure 1 it is easy to notice that the between-gender score differences are pronounced for all four items.
Figure 2: How frequently male and female students chose the given answering options for Item 1. The asterisk denotes the
correct answer and a zero denotes missing answers.
Figure 3: How frequently male and female students chose the given answering options for Item 5. The asterisk denotes the
correct answer and a zero denotes missing answers.
Figure 4: How frequently male and female students chose the given answering options for Item 6. The asterisk denotes the
correct answer and a zero denotes missing answers.
Figure 5: How frequently male and female students chose the given answering options for Item 9. The asterisk denotes the
correct answer and a zero denotes missing answers.

28 Vidak
Figures 2, 3, 4 and 5 provide information about the frequency of choosing individual answering options in Items 1, 5, 6 and 9 for male and female students.
DISCUSSION
From Table 2 it follows that male students outperformed female students on all four items. However, it should be also noted that generally the proportions of correct answers were relatively low on three out of four items. Such low scores are not surprising because in earlier research many student misconceptions have been reported about this scientific topic (Yeo and Zadnik, 2001; Yalcınkaya and Boz, 2015). An alternative explanation for the low scores could be related to the fact that in the traditional lectures the accent was put on factual and procedural knowledge.
Most prominent between-gender differences on individual items Next, we are going to discuss the between gender differences on selected items. In Item 1 students were asked to compare the thermal expansion of rods with different initial lengths. Visualizing the process of thermal expansion could have facilitated solving of this item. As a matter of fact, one can model a rod as consisting of many particles connected by springs. Heating results in elongation of these springs. A larger initial length of the rod is associated with a larger number of atoms/springs which results in a larger total increase of length. On this item male students scored 20% higher than female students. In Item 5 students were showed a circular plate with a hole and they were supposed to predict what will happen with the area of the plate as a result of heating. In other words, students had to reason about two dimensional (or area) thermal expansion, in order to correctly solve this item. Again, male students outperformed their female peers by 16%. In Item 6 students were showed two circular plates (made of same material) with a hole and they were required to predict what will happen with area of these plates as result of heating. In order to correctly solve this item students had to reason about area thermal expansion, as well as to take into account of the different initial surface sizes. In this item male students scored 11% higher than their female colleagues. In Item 9 students needed to predict how heating influences particles inside a metal (three dimensional expansion). In order to correctly solve this item students needed to understand that increase of metal’s volume that was subjected to heating is not result of an increase in volume of the atoms but it is a result of an increase of average interparticle distance. In this item male students scored 16% higher than female students.
Finally, we can conclude that our data consistently supports earlier findings related to male’s higher performance on visuospatial tasks (Voyer, Voyer, Bryden, 1995; Loring-Meier and Halpern, 1999; Myer and Hensley, 1984; Hecht and Proffitt, 1995).
Students’ misconceptions about thermal expansion Next, we will discuss the identified misconceptions for our four test items. In Item 1 students were required to reason about one dimensional thermal expansion. From Figure 2 we can see that most common wrong answer for Item 1 was answer C (male students - 29%, female students – 42%). Incorrect option C reflects the erroneous belief that length increment depends only on the amount of temperature increase. We can see that this misconception was much more pronounced in female students than in male students. It seem that in the male subsample there were more students who tried to approach this problem by using visuospatial reasoning which resulted in a better performance of male students. In Item 5 and Item 6 students were expected to reason about two dimensional thermal expansion ie. to describe the effect of heating on the area of the presented plates. From Figure 3 we can see that the most frequent wrong answer for Item 5 was answer A (male students – 33%, female students - 42%). This wrong answer reflects a well-known misconception according to which the plate’s hole is shrinking as a result of heating (Watkins and Mazur, 2003; McHugh and McCauley, 2016). This misconception could stem from the fact that students tend to approach this problem by visualizing what happens in one dimension (x or y-axis) only. It seems that in the subsample of male students there is a larger percentage of students who approach this problem by simultaneously visualizing changes along the x- as well as along the y-axis.
From Figure 4 it follows that the most common wrong answer for Item 6 was answer D (male students - 27%, female students - 34%). In other words, similarly as in Item 5, many students wrongly believed that holes in the circular plates shrink as a result of heating. (Watkins and Mazur, 2013; McHugh and McCauley, 2016). In Item 9 students had to apply the three dimensional model of particulate nature of matter in order to predict effects of heating a metal. From Figure 5 we can see that the most common answer for Item 9 was D (20%) for female students and A (6%) for male students. Both answers reflect the common misconception that when thermal expansion happens atoms are getting bigger (Yeo and Zadnik, 2001; Yalcınkaya and Boz, 2015). It should be generally noted that students were more successful on the item that required reasoning about one dimensional expansion than on items that required reasoning about two dimensional expansion. Reasoning about two dimensional expansion was more demanding, for both, the male and female students. In other words, items that required two dimensional visualization probably induced a higher intrinsic load which negatively influenced the students’ performance (Sweller, 1994).
Finally, we need to note that the main limitation of our study is related to the relatively small sample of conceptual items. However, it should be also noted that the measured construct (conceptual understanding of thermal expansion) was also relatively narrow which could justify the selection of a small number of items.

Bulletin of the Chemists and Technologists of Bosnia and Herzegovina 2018, 50, 25-30 29
CONCLUSION
In this study we aimed to investigate gender differences in reasoning about thermal expansion.
The conclusions from our study are as follows: - Generally, male students significantly outperform female students in solving qualitative problems about thermal expansion. This is particularly true for problems that require visual reasoning. -Between-gender differences were lower on tasks that required reasoning about two dimensional thermal expansion which could be related to a higher intrinsic load of these tasks (Sweller, 1994). - Our results support earlier findings according to which male students outperform females on visuospatial tasks (Voyer, Voyer, Bryden, 1995; Loring-Meier and Halpern, 1999).
In future studies about students’ understanding of thermal expansion it could be useful to implement a mixed research design (Creswell and Clark, 2011) which would allow us to more deeply explore the patterns of students' reasoning.
REFERENCES
Bae, Y., Choy, S., Geddes, C., Sable, J., Snyder, T. (2000). Trends in Educational Equity of Girls & Women. ED Pubs, PO Box 1398, Jessup, MD 20794-1398.
Burkitt, J., Widman, D., Saucier, D.M. (2007). Evidence for the influence of testosterone in the performance of spatial navigation in a virtual water maze in women but not in men. Hormones and Behavior, 51(5), 649-654.
Creswell, J.W., Clark, V.L.P. (2011). Designing and Conducting Mixed Methods Research (2nd ed.). California: Sage Publications.
Duit, R. (2015). Alltagsvorstellungen und Physiklernen. In Physikdidaktik (pp. 657-680). Springer Spektrum, Berlin, Heidelberg.
Eccles, J.S. (1994). Understanding women's educational and occupational choices. Psychology of women quarterly, 18(4), 585-609.
Entwisle, D.R., Alexander, K.L., Olson, L.S. (1994). The gender gap in math: Its possible origins in neighborhood effects. American Sociological Review, 822-838.
Erceg, N., Aviani, I., Mešić, V., Glunčić, M., Žauhar, G. (2016). Development of the kinetic molecular theory of gases concept inventory: Preliminary results on university students’ misconceptions. Physical Review Physics Education Research, 12(2), 020139.
Halpern, D. F. (2004). A cognitive-process taxonomy for sex differences in cognitive abilities. Current directions in psychological science, 13(4), 135-139.
Halpern, D.F., Benbow, C.P., Geary, D.C., Gur, R.C., Hyde, J.S., Gernsbacher, M.A. (2007). The science of sex differences in science and mathematics. Psychological science in the public interest, 8(1), 1-51.
Halpern, DF. (2000). Sex differences in cognitive abilities. 3rd. Mahwah, NJ: Erlbaum.
Hecht, H., Proffitt, D.R. (1995). The price of expertise: Effects of experience on the water-level task. Psychological Science, 6(2), 90-95.
Kim, E., Pak, S.J. (2002). Students do not overcome conceptual difficulties after solving 1000 traditional problems. American Journal of Physics, 70(7), 759-765.
Kotovsky, L., Baillargeon, R. (1998). The development of calibration-based reasoning about collision events in young infants. Cognition, 67(3), 311-351.
Loring-Meier, S., Halpern, D.F. (1999). Sex differences in visuospatial working memory: Components of cognitive processing. Psychonomic Bulletin & Review, 6(3), 464-471.
McHugh, M., McCauley, V. (2016). Getting Hooked on Physics!.The Physics Teacher, 54(9), 548-550.
Myer, K.A., Hensley, J.H. (1984). Cognitive style, gender, and self-report of principle as predictors of adult performance on Piaget's water level task. The Journal of genetic psychology, 144(2), 179-183.
Nersessian, N.J. (2008). Creating Scientific Concepts, A Bradford Book. London: The MIT Press.
Ogle, L.T., Sen, A., Pahlke, E., Jocelyn, L., Kastberg, D., Roey, S., Williams, T. (2003). International Comparisons in Fourth-Grade Reading Literacy: Findings from the Progress in International Reading Literacy Study (PIRLS) of 2001.
Phillips, A.T., Wellman, H.M., Spelke, E.S. (2002). Infants' ability to connect gaze and emotional expression to intentional action. Cognition, 85(1), 53-78.
Schultheiss, O.C., Wirth, M.M., Torges, C.M., Pang, J.S., Villacorta, M.A., Welsh, K.M. (2005). Effects of implicit power motivation on men's and women's implicit learning and testosterone changes after social victory or defeat. Journal of personality and social psychology, 88(1), 174.
Spelke, E.S. (2005). Sex differences in intrinsic aptitude for mathematics and science?: a critical review. American Psychologist, 60(9), 950.
Sweller, J. (1994). Cognitive load theory, learning difficulty, and instructional design. Learning and instruction, 4(4), 295-312.
Tomlinson, C. A. (2000). Reconcilable differences: Standards-based teaching and differentiation. Educational leadership, 58(1), 6-13.
Voyer, D., Voyer, S., Bryden, M.P. (1995). Magnitude of sex differences in spatial abilities: a meta-analysis and consideration of critical variables. Psychological bulletin, 117(2), 250.
Watkins, J., Mazur, E. (2013). Retaining students in science, technology, engineering, and mathematics (STEM) majors. Journal of College Science Teaching, 42(5), 36-41.
Xie, Y., Shauman, K.A. (2003). Women in science: Career processes and outcomes. Cambridge: Harvard University Press.
Yalçınkaya, E., Boz, Y. (2015). The effect of case-based instruction on 10th grade students' understanding of gas concepts. Chemistry Education Research and Practice, 16(1), 104-120.
30 Vidak
Yeo, S., Zadnik, M. (2001). Introductory thermal concept evaluation: Assessing students' understanding. The Physics Teacher, 39(8), 496-504.
Summary/Sažetak
Istraživanje spolnih razlika u znanosti omogućuje nam da prilagodimo podučavanje prema potrebama, interesima I
sposobnostima svih naših studenata. U ovom istraživanju smo nastojali istražiti spolne razlike u konceptualnom
razumijevanju toplinske ekspanzije. U tu su svrhu 195 studenata prve godinena Fakultetu Kemijskog Inženjerstva I
Tehnologije Sveučilišta u Zagrebu je rješavalo deset konceptualnih pitanja. Studenti su znatno nadmašili studentice.
Posebno velike razlike u korist studenata su zabilježene na pitanjima koja su zahtijevala rasuđivanje o toplinskoj ekspanziji
u jednoj dimenziji.

Influence of the delta ferrite content on the corrosion behavior of austenitic stainless steel Nitronic 60
Gigović Gekić, A., Bikić, F., Avdušinović, H.
University of Zenica, Faculty of Metallurgy and Technology, Travničkacesta 1, Zenica, B&H
INTRODUCTION Nitronic 60 is the commercial name for austenitic stainless steel, which according to the chemical composition belongs to AISI 200 class of steels. This high manganese steel is really material for all purpose owing to mechanical and corrosion properties especially at elevated temperatures (Lula, 1986). Generally, austenitic stainless steel (ASS) is widely used in all industries sectors (transport, food, chemical, building industry etc.) thanks to good mechanical properties (strength and toughness at elevated and room temperature) and corrosion resistance. The austenite type stainless steels have different chemical compositions and properties but the common characteristic is an austenite microstructure that is stable at room temperature. Depending on chemical composition it is possible to find presence of some other phase in austenite matrix called delta ferrite. The main alloy in gelements in austenitic stainless steels can be classified as alphagenic and gamagenic group of elements. The alphagenic elements
(Cr, Si, Ti, Al, Mo, V, Nb and W) stabilize and support the formation of delta ferrite, until the gamagenic elements (Ni, Mn, C, N, and Cu) stabilize the austenitic phase (George and Shaikh, 2002; Gigović-Gekić et al., 2014). Delta ferrite has a body centered cubic structure and good stability at room temperature. In some cases, the delta ferrite phase is intentionally formed during manufacturing to improve hot workability or to prevent hot cracking in weld metal. On the other hand, the amount of delta ferrite in the weld metal should be considered very carefully because delta ferrite embrittles a weld metal and deteriorates corrosion properties (George and Shaikh, 2002). The effect of the delta ferrite content on the corrosion resistance of ASS can be explained with the following phenomena: the formation of Cr depleted zone, low concentrations of Cr and Mo in austenite phase and the segregation of sulfur or phosphorous along the δ/γ interface. The effects of delta ferrite content on the corrosion resistance of ASS were mutually contradictory and the mechanism was not clearly understood yet (Kim et al., 2007). There are
Bulletin of the Chemists and Technologists of Bosnia and Herzegovina
Print ISSN: 0367-4444
Online ISSN: 2232-7266
2018
50
31-34 UDC: __________________________
Original Scientific Article
Article info Received: 05/04/2018 Accepted: 14/06/2018 Keywords: Austenitic Stainless Steel Delta Ferrite General Corrosion Pitting Corrosion, Potentiostat/Galvanostat Nacl Solution
*Corresponding author: E-mail: [email protected] Phone: +38732401831, Fax: +38732406903
Abstract: Nitronic 60 (UNS S21800) is a highly alloyed austenitic stainless steel with
increased content of manganese and silicon. It has a good mechanical and corrosion
properties at elevated temperatures and loads. Nitronic 60 has the austenitic microstructure
at room temperature but depending on chemical composition the presence of other phase
in austenite matrix is possible, i.e. delta ferrite. The aim of this study is better
understanding of delta ferrite content influence on corrosion sensitivity of Nitronic 60.
The corrosion sensitivity test was conducted in the corrosion cell using
potentiostat/galvanostat according to Standard ASTM G5 (Princeton Applied Research,
model 263A-2, with the PowerCORR® software), (Standard, ASTM G5-94). Investigation
was performed in 0.9% NaCl solution. Taffel extrapolation method was used to test
general corrosion. Method of cyclic polarization was used for investigation of pitting
corrosion. Tests were performed at room temperature, 20±1°C.The corrosion tests results
indicate that the intensity of both examined forms of corrosion, general and pitting
corrosion, is increased with increasing delta ferrite content.
32 Gigović-Gekić et. al
several techniques for testing of corrosion behavior of ASS in different media but the most used ones are the electrochemical technique of cyclic voltammetry and potentiodynamic measurements in chloride-containing media (Kim et al., 2007; Kocijan and Conradi, 2010; Osoba et al., 2016; Tavares et al. 2017). For the purpose of testing the influence of the delta ferrite content on the corrosion properties of Nitronic 60, two forms of corrosion were tested (general and pitting corrosion). Both types of corrosion were tested in 0.9% aqueous solution of sodium chloride EXPERIMENTAL The aim of this research is to investigate an influence of the delta ferrite content on corrosion sensitivity of Nitronic 60. Following that idea, two types of corrosion were investigated (general and pitting corrosion). Two samples of Nitronic 60 were used for testing. Chemical composition of the samples and delta ferrite content are given in Table 1. The chemical composition of samples was within the limits prescribed by ASTM A276-96 standard, (Standard, ASTM A276-96). Table 1. Chemical composition of the samples
Sample
Chemical composition (wt.%) Delta ferrite
content (%)
C Si Mn Cr Ni N
V1692 0.04 4.4 7.4 18.0 8.1 0.18 10.25 V1696 0.05 3.5 7.9 16.9 8.6 0.12 1.4 The delta ferrite content was determined by Feritscope MP 30E-S probe EGAB 1.3 Fe using magnetic induction method (Gigović-Gekić et al., 2011), Table 1. Microstructures of initial state of the samples are presented in Figure 1. The metallographic examination was performed on Olympus optical microscope. The samples were previously prepared (grinding and polishing) and etched in the Kalling’s solution.
a) b) Figure 1. The sample microstructure: a) V1692 and b) V1696,
x100 Tafel extrapolation method was used for investigation of general corrosion of the Nitronic 60 samples. Tafel extrapolation method implies scanning of working electrode potential on the order of ±250 mV in relation to its Open Circuit Potential (EOCP), at the speed of 0.2 mVs-1. Method of cyclic polarization was used for investigation of pitting corrosion. The method of cyclic polarization includes scanning of the potential to a vertex potential and reverses at the current threshold after crossing the vertex potential. Scan rate was 0.5 mV/s. Investigations of corrosion were conducted in the
corrosion cell using potentiostat/galvanostat according to Standard ASTM G5, (Princeton Applied Research, model 263A-2, with the PowerCORR® software), (Standard, ASTM G5-94). Investigation was performed in 0.9% NaCl solutions. Tests were performed at room temperature, 20±1°C. The metallographic examination of the tested samples was performed on Olympus optical microscope with max. Magnification of 1000x and stereo microscope Leica with a maximum magnification of 60x.
RESULTS AND DISCUSSION The results of general corrosion tests of the tested stainless steel (Nitronic 60) are presented in Figure 2 and Table 2.
Figure 2. Tafel curves of the samples tested in 0.9% NaClsolution
1 – sample V1696, 2 – sample V1692
Table 2. The values of open circuit potential and corrosion current density
Designation samples Eocp(mV) Corrosion current
density, icor. (µAcm-
2) 1- V1696 -178,611 1,037·10-1 2- V1692 -203,57 1,641·10-1
The analysis of the results from the Table 2 and Figure 2 shows that sample having a lower delta ferrite content, sample 1, shows a significant moving of the open circuit potential (EOCP) to positive values comparing to the EOCP of the sample 2, (a sample with higher delta ferrite content). The results present in Table 2 indicate that sample with lower delta ferrite content, sample 1, has lower corrosion current density as compared to the samples with higher delta ferrite content. According to both parameters (EOCP and icor), sample with lower delta ferrite content has better corrosion stability. Pitting corrosion of stainless steels is manifested by the rapid growth of current at achieving specific values of anode potential, pitting potential (Epitt), Figure 3. Pitting potential is the potential at which pitting starts and that phenomenon is noticed when the current of the polarization curve suddenly start to rise. Generally, measure of the intensity of pitting corrosion is the surface of the hysteresis loop, Figure 3. The larger surface of the hysteresis loop means a higher intensity of pitting corrosion (Bikić et al., 2014).
-0,4
-0,3
-0,2
-0,1
0,0
0,1
0,00000001 0,0000001 0,000001 0,00001 0,0001
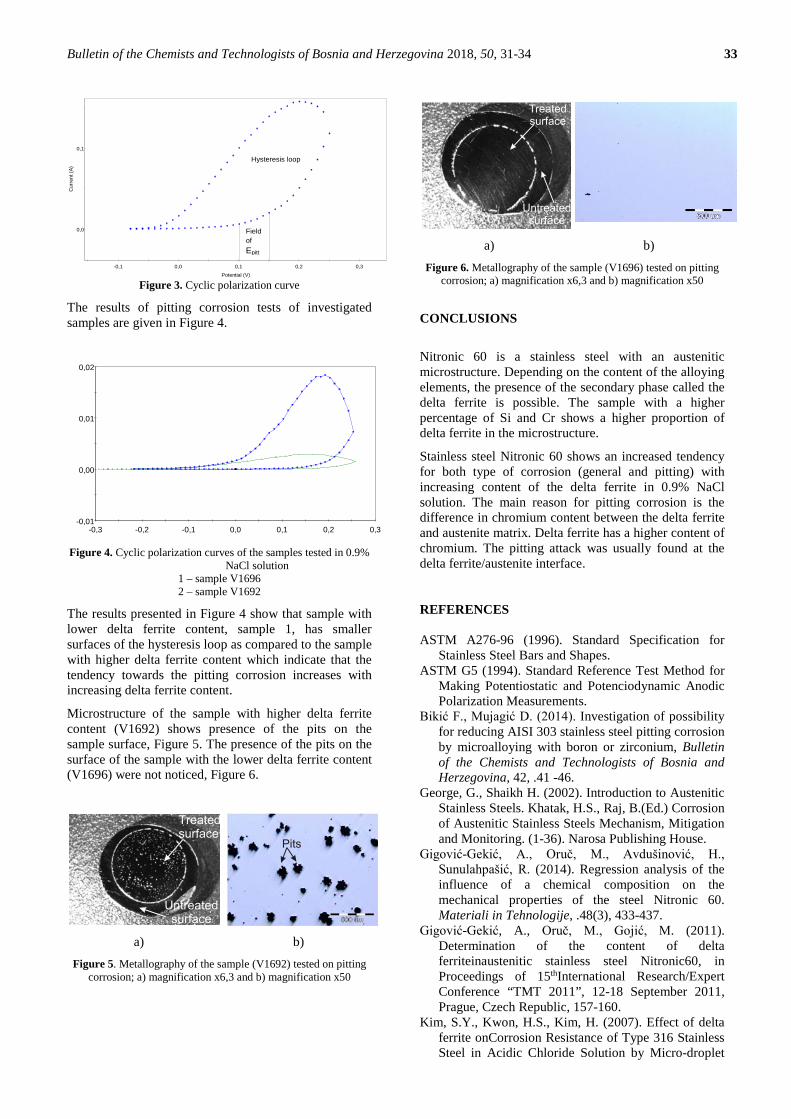
Bulletin of the Chemists and Technologists of Bosnia and Herzegovina 2018, 50, 31-34 33
Figure 3. Cyclic polarization curve
The results of pitting corrosion tests of investigated samples are given in Figure 4.
Figure 4. Cyclic polarization curves of the samples tested in 0.9%
NaCl solution 1 – sample V1696 2 – sample V1692
The results presented in Figure 4 show that sample with lower delta ferrite content, sample 1, has smaller surfaces of the hysteresis loop as compared to the sample with higher delta ferrite content which indicate that the tendency towards the pitting corrosion increases with increasing delta ferrite content.
Microstructure of the sample with higher delta ferrite content (V1692) shows presence of the pits on the sample surface, Figure 5. The presence of the pits on the surface of the sample with the lower delta ferrite content (V1696) were not noticed, Figure 6.
a) b)
Figure 5. Metallography of the sample (V1692) tested on pitting corrosion; a) magnification x6,3 and b) magnification x50
a) b) Figure 6. Metallography of the sample (V1696) tested on pitting
corrosion; a) magnification x6,3 and b) magnification x50
CONCLUSIONS
Nitronic 60 is a stainless steel with an austenitic microstructure. Depending on the content of the alloying elements, the presence of the secondary phase called the delta ferrite is possible. The sample with a higher percentage of Si and Cr shows a higher proportion of delta ferrite in the microstructure.
Stainless steel Nitronic 60 shows an increased tendency for both type of corrosion (general and pitting) with increasing content of the delta ferrite in 0.9% NaCl solution. The main reason for pitting corrosion is the difference in chromium content between the delta ferrite and austenite matrix. Delta ferrite has a higher content of chromium. The pitting attack was usually found at the delta ferrite/austenite interface. REFERENCES ASTM A276-96 (1996). Standard Specification for
Stainless Steel Bars and Shapes. ASTM G5 (1994). Standard Reference Test Method for
Making Potentiostatic and Potenciodynamic Anodic Polarization Measurements.
Bikić F., Mujagić D. (2014). Investigation of possibility for reducing AISI 303 stainless steel pitting corrosion by microalloying with boron or zirconium, Bulletin of the Chemists and Technologists of Bosnia and Herzegovina, 42, .41 -46.
George, G., Shaikh H. (2002). Introduction to Austenitic Stainless Steels. Khatak, H.S., Raj, B.(Ed.) Corrosion of Austenitic Stainless Steels Mechanism, Mitigation and Monitoring. (1-36). Narosa Publishing House.
Gigović-Gekić, A., Oruč, M., Avdušinović, H., Sunulahpašić, R. (2014). Regression analysis of the influence of a chemical composition on the mechanical properties of the steel Nitronic 60. Materiali in Tehnologije, .48(3), 433-437.
Gigović-Gekić, A., Oruč, M., Gojić, M. (2011). Determination of the content of delta ferriteinaustenitic stainless steel Nitronic60, in Proceedings of 15thInternational Research/Expert Conference “TMT 2011”, 12-18 September 2011, Prague, Czech Republic, 157-160.
Kim, S.Y., Kwon, H.S., Kim, H. (2007). Effect of delta ferrite onCorrosion Resistance of Type 316 Stainless Steel in Acidic Chloride Solution by Micro-droplet
0,0
0,1
-0,1 0,0 0,1 0,2 0,3
Cur
rent
(A)
Potential (V)
Field of Epitt
Hysteresis loop
-0,01
0,00
0,01
0,02
-0,3 -0,2 -0,1 0,0 0,1 0,2 0,3
34 Gigović-Gekić et. al
Cell, Solid State Phenomena Vols. 124-126, p.p.1533-1536 (doi:10.4028/www.scientific.net/SSP.124-126.1533) (03/03/2018)
Kocijan, A., Conradi, M. (2010). The corrosion behaviour of austenitic and duplex stainless steels in artificial body fluids. Materials and technology, 44(1)1, 21-24.
Lula R.A. (1986). Stainless Steel, ASM American Society for Metals.
Osoba, O., Elemuren, R.A., Ekpe, I.C. ( 2016). Influence of delta ferrite on corrosion susceptibility of AISI304 austenitic stainless steel. Cogent Engineering 3, (http://dx.doi.org/10.1080/23311916.2016.1150546) (08/11/2017)
Tavares, S.S.M., Feijo, G.F., Farneze, H.N., Sandim, M.J.R., Filho, I.R.S. (2017). Influence of Microstructure on the Corrosion Resistance of AISI 317L (UNS S31703). Materials Research, (doi: http://dx.doi.org/10.1590/1980-5373-MR-2016-1107)
Summary/Sažetak Nitronic 60 (UNS S21800) je visoko legirani austenitni čelik sa povećanim sadržajem mangana i silicija. Ovaj čelik ima
dobra mehanička i koroziona svojstva pri povišenim temperaturama i opterećenjima. Čelik ima austenitnu mikrostrukturu
na sobnoj temperaturi ali zavisno od hemijskog sastava moguće je prisustvo i druge faze tj. deltaferita. Cilj ovog ispitivanja
je bolje razumijevanje utjecaja sadržaja delta ferita na korozionu osjetljivost čelika Nitronic 60. Ispitivanje korozije je
provedeno u korozionoj ćeliji prema standardu ASTM G5, na uređaju potenciostat/galvanostat Princeton Applied
Research, model 263A-2, sasoftveromPowerCORR® (Standard, ASTM G5-94). Ispitivanje je provedeno u 0.9% vodenoj
otopini NaCl. Tafel-ova ekstrapolaciona metoda koristila se za ispitivanje opšte korozije. Metoda ciklične polarizacije
koristila se za ispitivanje pitting korozije. Ispitivanje je provedeno na sobnoj temperaturi 20±1°C. Rezultati ispitivanja
korozije su pokazali da se intenzitet korozije povećava sa povećanjem sadržaja delta ferita u oba slučaja korozije, opšta I
pitting korozija.
Correlation between hemoglobin A1c and lipid profile in Bosnian
diabetic patients - gender differences
Mandal, Š.a*, Čaušević, A. b
a Department of Natural Sciences in Pharmacy, Faculty of Pharmacy, University of Sarajevo, B&H
bDepartment of Biochemistry and Clinical Analysis, Faculty of Pharmacy, University of Sarajevo, B&H
INTRODUCTION Diabetes mellitus (DM) represent a chronic metabolic disease which was accompanied by hyperglycemia, either because the body does not produce enough insulin, or cells do not respond to the insulin. As a disease, it is characterized with acute and chronic complications, which contributed to diabetes morbidity and mortality rates. Chronically elevated glucose is an important
etiologic factor for macro and microvascular complications and the diagnostic feature of DM. For a long time, HbA1c was used as a reliable marker in glycaemia control which correlated well with the risk of long-term diabetes complications (Kautzky-Willer A., 2015; IDF Recommendations, 2017). In 2010, the American Diabetes Association (ADA) recommended the use of HbA1c as a diagnostic marker for diabetes and categories for increased risk of diabetes (formerly known as prediabetes) (Reynolds et al., 2006; Lyons et al., 2012;
Bulletin of the Chemists and Technologists of Bosnia and Herzegovina
Print ISSN: 0367-4444
Online ISSN: 2232-7266
2018
50
35-42 UDC: __________________________
Original Scientific Article
Article info Received: 11/04/2018 Accepted: 29/06/2018 Keywords: HbA1c Type 2 diabetes Gender Age Dyslipidemia
*Corresponding author: E-mail: [email protected]; Phone: +387 61 614 203
Abstract: The prevalence of Type 2 diabetes mellitus (T2D) as a metabolic disease is
rapidly rising worldwide. The purpose of this study was to determine concentrations of
hemoglobin A1c (HbA1c), fasting glucose, and lipid profile in a total of 104 adults, 24
patients with newly diagnosed Type 2 diabetes (40-60 years of the age), 40 Type 2
diabetes, and 40 healthy subjects as control group (the same ages). On the basis of these
results, we were able to assess the differences due to gender and age in tested population
as well as the relationship between glycemic control (HbA1c) and serum lipid profile.
Therefore, we properly evaluated the importance of HbA1c as an indicator of
dyslipidemia in patients with T2D in selected Bosnian population. Hemoglobin A1c
was determined by immunoturbidimetric assay, while fasting glucose and lipid profile
were analyzed according to standard clinical methods on BT PLUS 2000-Biotechnic
Instruments Bioanalyzer. We found that glycated hemoglobin concentrations in newly
diabetic subjects were higher than those in other two groups. Statistically significant
differences between study populations were seen at the level of glucose, cholesterol,
HDL and LDL cholesterol, HbA1c, triacylglycerol and patient age. Also, our results
have shown the significant negative correlation between HbA1c and cholesterol and
HDL levels (p***<0.001) while positive correlation was observed with glucose and
patient age (p***<0.001) in all study groups. According to our results, hemoglobin A1c
can also be used as a predictor of dyslipidemia and thus early diagnosis of dyslipidemia
can be used as a preventive measure for the development of cardiovascular diseases in
patients with Type 2 diabetes mellitus.
36 Mandal & Čaušević
Gupta et al., 2017). Persons with HbA1c of 6.5% and above are to be diagnosed as diabetes and those with HbA1c between 5.7-6.4% are considered to be in categories for increased risk of diabetes (Paterson A. D, 2017; Sherwani et al., 2016; Sequeira and Poppitt, 2017). HbA1c levels differ for different diabetes patients, depending on their history of diabetes and whether they are on tablets or long-term and/or short-term insulin dosage (Cheneke et al., 2016; International Diabetes Federation, 2017; Xu et al., 2014). Numerous studies have shown that patients with Type 2 diabetes (T2DM) have an increased prevalence of dyslipidemia, which contributes mostly to a high risk of cardiovascular diseases (CVDs) in these patients. In all of these studies, HbA1c proved to be independent risk factor for CV disease. Moreover, for each 1% rise in HbAc levels, there is 18% rise in cardiovascular risk. The same type of risk was reported even when HbA1c concentration were within normal range (Syed and Khan, 2011; VinodMahato et al., 2011). Since, the data related to diagnostic significance of hemoglobin A1c and lipidemia status are often contradictory and lacking for different world populations, in this work we tried to evaluate the importance of hemoglobin A1c as an indicator of dislipidema in selected Bosnian male and female population. The effect of age influence was also evaluated. EXPERIMENTAL Subjects A total of 104 participants (40 controls, 24 newly diagnosed T2D patients and 40 diabetic) have been screened for plasma lipid profile, fasting plasma glucose (FPG), and hemoglobin A1c (HbA1c) after obtaining informed consent. Participants involved in this study were free of evidence of hepatitis B or C viral infection or active liver and kidney damage, and were selected on the basis of presence of history of diabetes mellitus type 2 (T2D) for more than five years. Initial diagnosis of T2D was established by a specialist of internal medicine who used World Health Organization (WHO) criteria for diagnosis of the disease accompanied by classical symptoms such as polyuria, polydipsia, polyphagia as well as a weight loss of over 10 kg or glycemia levels more than 11.1 mmol/L obtained after performing the oral glucose tolerance (GT) test. Newly diagnosed T2D patients were between 40-80 years old and with a recent diagnosis of T2D (less than 12 weeks or 6 months) and were not taking any medication i.e. were without therapy. Nondiabetic (controls, C) were of approximately same age (40-80 years old), with normal GT (fasting plasma glucose less than 6.2 mmol/L and two hours postprandial glycemia less than 7.8 mmol/L). All research involving human subjects and material derived from it in this study was done in accordance with ethical principles outlined in World Medical Association Declaration of Helsinki – Ethical Principles for Medical Research Involving Human Subjects (initiated in June 1964, last amendment in October 2000) and write consistent of participants. Sample Analysis
Blood samples were withdrawn by using sterile syringe from 12 to 14 hours of overnight fasting diabetic patients and control subjects in the morning. All samples, after collection in sterile tubes were centrifuged at 3000 rpm for 10 minutes and serum was stored at 4°C. Fasting blood glucose concentration was measured by an enzymatic glucose hexokinase method, lipid profile analyzed by standard methods, while immunoturbidimetric assay was used for measurement of HbA1c. Glucose, lipids and HbA1c were measured on BT PLUS 2000-Biotechnic Instruments Bioanalyzer (Rome, Italy). Principle of immunoturbidimetric assay for HbA1c There is a number of techniques that can be used to measure hemoglobin A1c because different and various factors may affect the accuracy of HbA1c measurements i.e. contribute older age, female gender, duration diabetes and others. Briefly, immunoturbidimetric method used in this protocol, utilizes the interaction of antigen and antibody to directly determine HbA1c in whole blood. Mouse antihuman A1c monoclonal antibodies are added to whole blood, latex A1c antihuman A1c antibody complex is formed. Agglutination occurs when goat anti-mouse immunoglobulin G (IgG) polyclonal antibody interacts with the monoclonal antibody. After that, the amount of agglutination is measured as absorbance is proportional to the amount of A1c absorbed onto the surface of latex particles. One dried blood spot corresponding to 8 µl of blood was punched out and dispensed in 400 µl of hemolysis reagent, mixed well, and kept at room temperature for 30 min for complete lysis. In addition, the hemolysate was incubated with latex reagent followed by the addition of antibody reagent containing mouse antihuman A1c antibody and goat anti-mouse IgG polyclonal antibody in glycine buffer and further incubation followed by measurement of absorbance at 600 nm. For this analysis, hemolysate was prepared by incubating 10 µl of blood with 500 µl of hemolysis reagent for 10 min, and the measurement carried out on a BT PLUS Autoanalyzer. Statistical analysis All statistical analyses were done by SPSS (version 17.0 for Windows, SPSS Inc; Chicago, IL, USA). P values smaller than 0.05 were accepted as significant. The compare means of the differential values between each of biochemical parameters and HbA1c was done by ANOVA test. Within the program, nonparametric Mann-Whitney U-test was used in order to estimate differences in glucose, hemoglobin A1c, and lipid concentration between groups. Spearman’s correlation coefficient was calculated in order to analyze the relationships between the study variables. RESULTS AND DISCUSSION The study was conducted on 104 participants of both genders, ranging from 35 to 65 years. In our study, HbA1c concentrations, in newly diagnosed T2D patients of both sexes were slightly higher when compared to T2D subjects (7.2% and 6.8, respectively) which is represented in Figure 1a and 1b. This finding is expected because
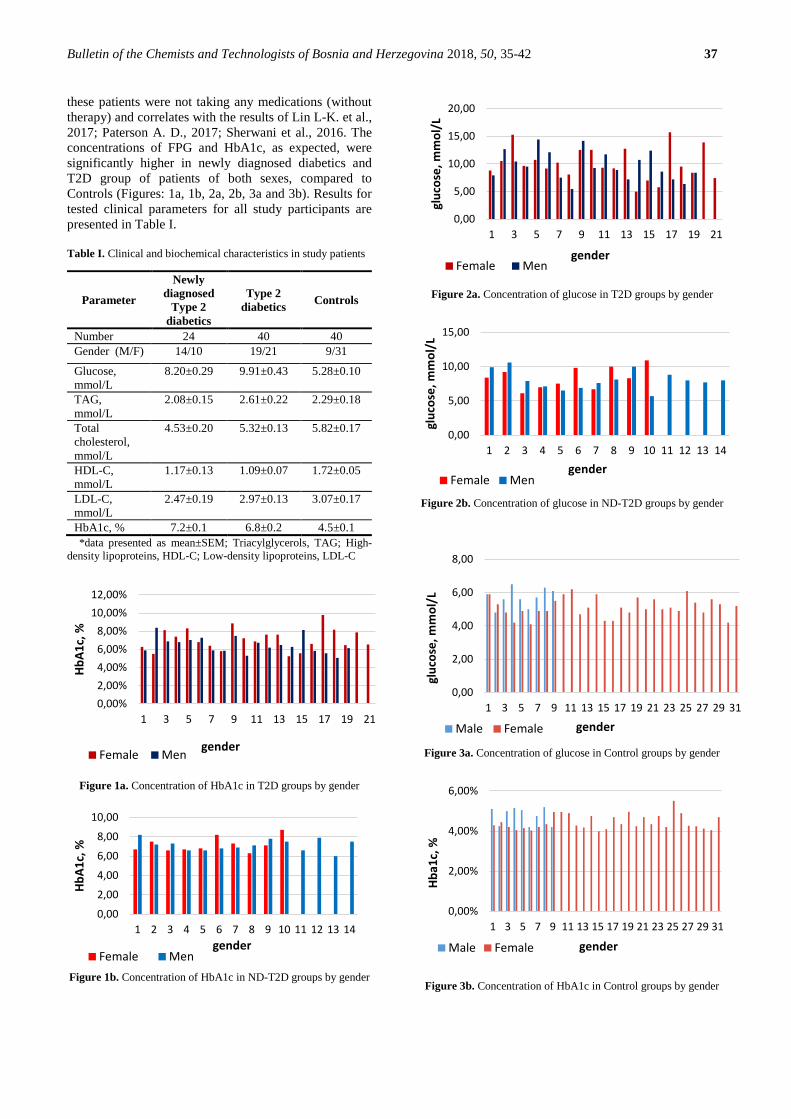
Bulletin of the Chemists and Technologists of Bosnia and Herzegovina 2018, 50, 35-42 37
these patients were not taking any medications (without therapy) and correlates with the results of Lin L-K. et al., 2017; Paterson A. D., 2017; Sherwani et al., 2016. The concentrations of FPG and HbA1c, as expected, were significantly higher in newly diagnosed diabetics and T2D group of patients of both sexes, compared to Controls (Figures: 1a, 1b, 2a, 2b, 3a and 3b). Results for tested clinical parameters for all study participants are presented in Table I. Table I. Clinical and biochemical characteristics in study patients
*data presented as mean±SEM; Triacylglycerols, TAG; High-density lipoproteins, HDL-C; Low-density lipoproteins, LDL-C
Figure 1a. Concentration of HbA1c in T2D groups by gender
Figure 1b. Concentration of HbA1c in ND-T2D groups by gender
Figure 2a. Concentration of glucose in T2D groups by gender
Figure 2b. Concentration of glucose in ND-T2D groups by gender
Figure 3a. Concentration of glucose in Control groups by gender
Figure 3b. Concentration of HbA1c in Control groups by gender
0,00%2,00%4,00%6,00%8,00%
10,00%12,00%
1 3 5 7 9 11 13 15 17 19 21
HbA1
c, %
genderFemale Men
0,00
2,00
4,00
6,00
8,00
10,00
1 2 3 4 5 6 7 8 9 10 11 12 13 14
HbA1
c, %
genderFemale Men
0,00
5,00
10,00
15,00
20,00
1 3 5 7 9 11 13 15 17 19 21
gluc
ose,
mm
ol/L
genderFemale Men
0,00
5,00
10,00
15,00
1 2 3 4 5 6 7 8 9 10 11 12 13 14
gluc
ose,
mm
ol/L
genderFemale Men
0,00
2,00
4,00
6,00
8,00
1 3 5 7 9 11 13 15 17 19 21 23 25 27 29 31
gluc
ose,
mm
ol/L
genderMale Female
0,00%
2,00%
4,00%
6,00%
1 3 5 7 9 11 13 15 17 19 21 23 25 27 29 31
Hba1
c, %
genderMale Female
Parameter
Newly diagnosed
Type 2 diabetics
Type 2 diabetics Controls
Number 24 40 40 Gender (M/F) 14/10 19/21 9/31
Glucose, mmol/L
8.20±0.29 9.91±0.43 5.28±0.10
TAG, mmol/L
2.08±0.15 2.61±0.22 2.29±0.18
Total cholesterol, mmol/L
4.53±0.20 5.32±0.13 5.82±0.17
HDL-C, mmol/L
1.17±0.13 1.09±0.07 1.72±0.05
LDL-C, mmol/L
2.47±0.19 2.97±0.13 3.07±0.17
HbA1c, % 7.2±0.1 6.8±0.2 4.5±0.1
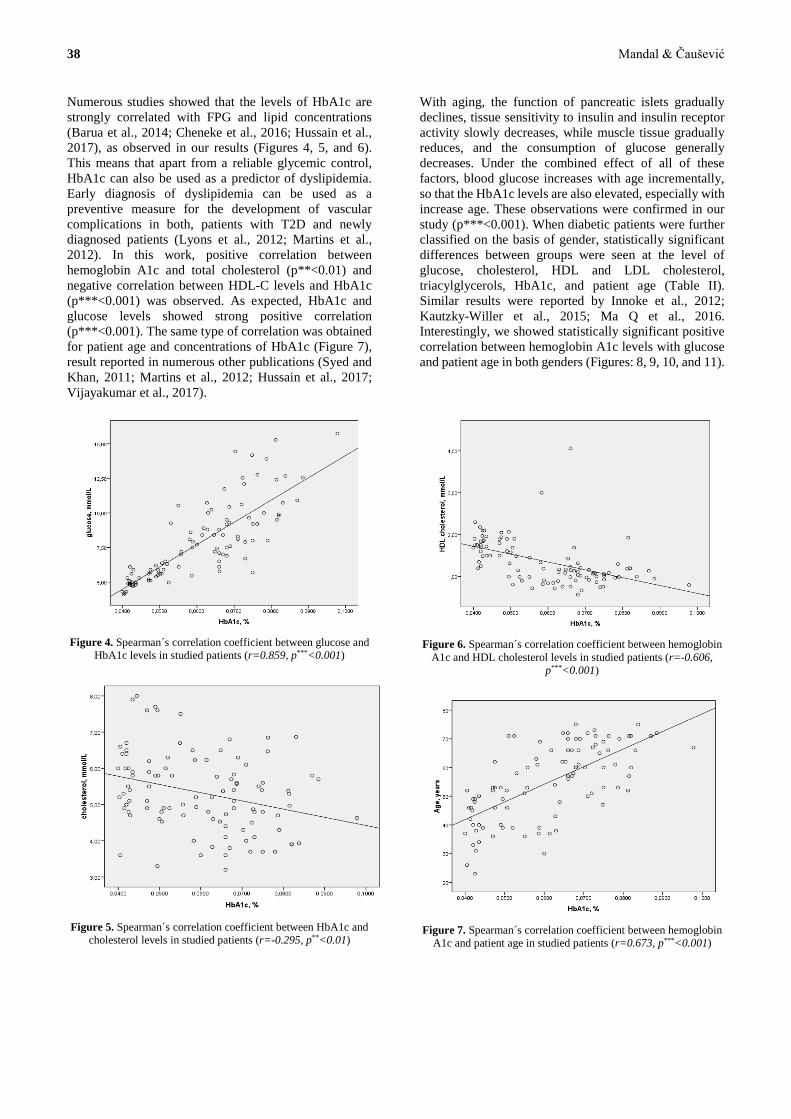
38 Mandal & Čaušević
Numerous studies showed that the levels of HbA1c are strongly correlated with FPG and lipid concentrations (Barua et al., 2014; Cheneke et al., 2016; Hussain et al., 2017), as observed in our results (Figures 4, 5, and 6). This means that apart from a reliable glycemic control, HbA1c can also be used as a predictor of dyslipidemia. Early diagnosis of dyslipidemia can be used as a preventive measure for the development of vascular complications in both, patients with T2D and newly diagnosed patients (Lyons et al., 2012; Martins et al., 2012). In this work, positive correlation between hemoglobin A1c and total cholesterol (p**<0.01) and negative correlation between HDL-C levels and HbA1c (p***<0.001) was observed. As expected, HbA1c and glucose levels showed strong positive correlation (p***<0.001). The same type of correlation was obtained for patient age and concentrations of HbA1c (Figure 7), result reported in numerous other publications (Syed and Khan, 2011; Martins et al., 2012; Hussain et al., 2017; Vijayakumar et al., 2017).
With aging, the function of pancreatic islets gradually declines, tissue sensitivity to insulin and insulin receptor activity slowly decreases, while muscle tissue gradually reduces, and the consumption of glucose generally decreases. Under the combined effect of all of these factors, blood glucose increases with age incrementally, so that the HbA1c levels are also elevated, especially with increase age. These observations were confirmed in our study (p***<0.001). When diabetic patients were further classified on the basis of gender, statistically significant differences between groups were seen at the level of glucose, cholesterol, HDL and LDL cholesterol, triacylglycerols, HbA1c, and patient age (Table II). Similar results were reported by Innoke et al., 2012; Kautzky-Willer et al., 2015; Ma Q et al., 2016. Interestingly, we showed statistically significant positive correlation between hemoglobin A1c levels with glucose and patient age in both genders (Figures: 8, 9, 10, and 11).
Figure 4. Spearman´s correlation coefficient between glucose and
HbA1c levels in studied patients (r=0.859, p***<0.001)
Figure 5. Spearman´s correlation coefficient between HbA1c and
cholesterol levels in studied patients (r=-0.295, p**<0.01)
Figure 6. Spearman´s correlation coefficient between hemoglobin
A1c and HDL cholesterol levels in studied patients (r=-0.606, p***<0.001)
Figure 7. Spearman´s correlation coefficient between hemoglobin
A1c and patient age in studied patients (r=0.673, p***<0.001)
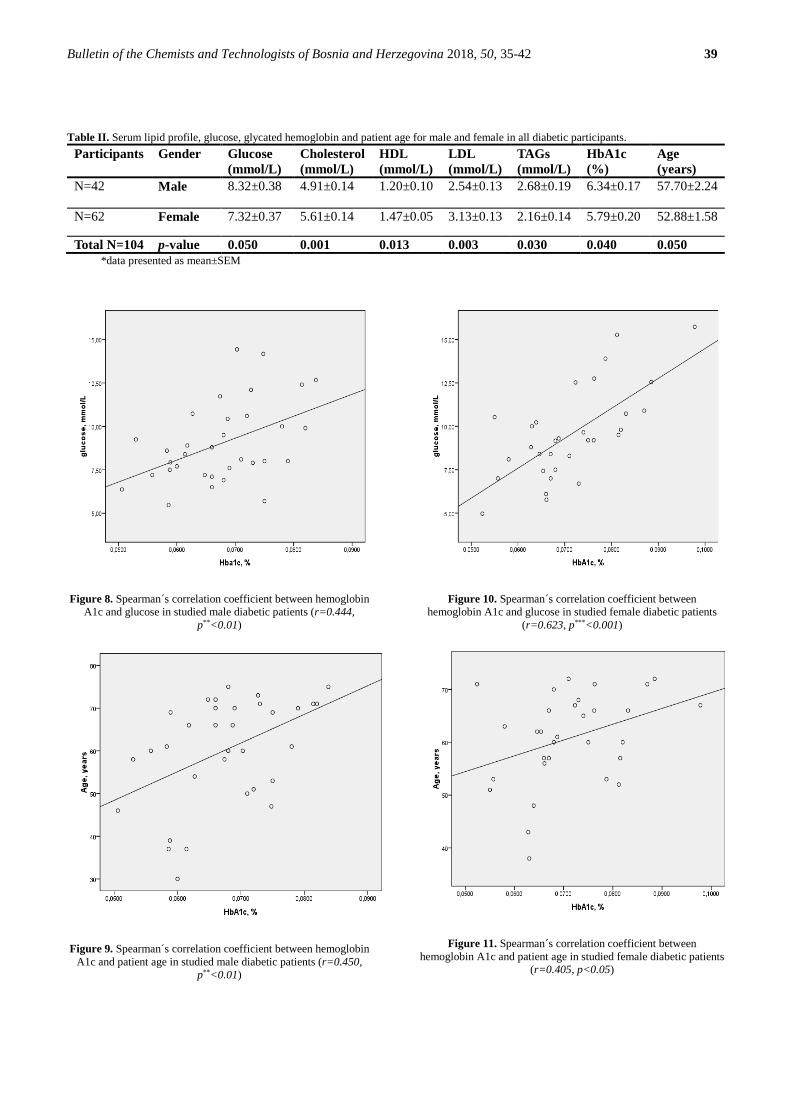
Bulletin of the Chemists and Technologists of Bosnia and Herzegovina 2018, 50, 35-42 39
Table II. Serum lipid profile, glucose, glycated hemoglobin and patient age for male and female in all diabetic participants. Participants Gender Glucose
(mmol/L) Cholesterol (mmol/L)
HDL (mmol/L)
LDL (mmol/L)
TAGs (mmol/L)
HbA1c (%)
Age (years)
N=42 Male 8.32±0.38 4.91±0.14 1.20±0.10 2.54±0.13 2.68±0.19 6.34±0.17 57.70±2.24
N=62 Female 7.32±0.37 5.61±0.14 1.47±0.05 3.13±0.13 2.16±0.14 5.79±0.20 52.88±1.58
Total N=104 p-value 0.050 0.001 0.013 0.003 0.030 0.040 0.050 *data presented as mean±SEM
Figure 8. Spearman´s correlation coefficient between hemoglobin
A1c and glucose in studied male diabetic patients (r=0.444, p**<0.01)
Figure 9. Spearman´s correlation coefficient between hemoglobin
A1c and patient age in studied male diabetic patients (r=0.450, p**<0.01)
Figure 10. Spearman´s correlation coefficient between
hemoglobin A1c and glucose in studied female diabetic patients (r=0.623, p***<0.001)
Figure 11. Spearman´s correlation coefficient between
hemoglobin A1c and patient age in studied female diabetic patients (r=0.405, p<0.05)

40 Mandal & Čaušević
CONCLUSION
Type 2 diabetes mellitus, as metabolic disorder, results in numerous pathophysiological changes due to hyperglycemia in various systems in the body. Because the complications of disease are related to glycemic control, normoglycemia is an appropriate goal for most of the patients. Analysis of hemoglobin A1c is a gold standard to check long-term glycemia in patients with diabetes mellitus. In our study a significant correlation between HbA1c and various circulating lipid parameters was observed. This may indicate that HbA1c can be used as a potential biomarker for predicting dyslipidemia in newly diagnosed diabetics and patients with T2DM. In our study, 59.62% of diabetic female patients and 40.38% of male diabetics were found to have dyslipidemia and positive significant correlation between HbA1c with glucose levels and patient age was demonstrated. Hyperlipidemia in women may be attributed to the effects of sex hormones on body fat distribution. These findings are consistent with some previous studies. The results of our study suggest the importance of glycemic control in managing dyslipidemia and further reducing the risk for CVD in patients with T2DM, shown at the level of significant association of HbA1c with various lipid parameters. To our knowledge, this is one of the first studies addressing diagnostic value of HbA1c in relation to status of lipidemia in context of gender and age influences performed on Bosnian diabetic population. However, further studies with a higher number of patients involved and better controlled protocols are needed in order to make more definite conclusions.
REFERENCES
American Diabetes Association. (2012). Diagnosis and classification of diabetes mellitus. Diabetes Care, 35(Suppl 1), S64–S71.
American Diabetes Association. (2013). Standards of medical care in diabetes—2013. Diabetes Care, 36(Suppl 1), S11–S66.
Barua, A., Acharya, J., Ghaskadbi, S., Goel, P. (2014). The relationship between fasting plasma glucose and HbA1c during intensive periods of glucose control in antidiabetic therapy. Journal of Theoretical Biology 363,158–163.
Braga, F., Dolci, A., Mosca, A., Panteghini, M. (2010). Biological variability of glycated hemoglobin. Clinica Chimica Acta, 411,1606–1610.
Cheneke, W., Suleman, S., Yemane, T., Abebe, G. (2016). Assessment of glycemic control using glycated hemoglobin among diabetic patients in Jimma University specialized hospital, Ethiopia. BMC Res Notes, 9(9), 1-10.
Gupta, S., Jain, U., Chauhan, N. (2017). Laboratory Diagnosis of HbA1c: A Review. J Nanomed Res, 5(4), 1-10.
Hussain, A., Ali, I., Ijaz, M., Rahim, A. (2017). Correlation between hemoglobin A1c and serum lipid profile in Afghani patients with type 2 diabetes: hemoglobin A1c prognosticates dyslipidemia. Ther Adv Endocrinol Metab, 8(4), 51-57.
Inoue, M., Inoue, K., Akimoto, K. (2012). Effects of age and sex in the diagnosis of type 2 diabetes using glycated haemoglobin in Japan: The Yuport Medical Checkup Centre study. PLoS ONE, 7(7), 1-4.
International Diabetes Federation. (2017). IDF Recommendations For Managing Type 2 Diabetes In Primary Care, 1-43.
Kautzky-Willer, A., Kosi, L., Lin, J., Mihaljevic, R. (2015). Gender-based differences in glycaemic control and hypoglycaemia prevalence in patients with type 2 diabetes: results from patient-level pooled data of six randomized controlled trials. Diabetes, Obesity and Metabolism 17, 533–540.
Lin, L-K., Sun, Y., Heng, B. H., Chew, DE. K., Chong, P.-N. (2017). Medication adherence and glycemic control among newly diagnosed diabetes patients. BMJ Open Diab Res Care, 5, 1-10.
Lyons, T. J., Basu, A. (2012). Biomarkers in diabetes: hemoglobin A1c, vascular and tissue markers. Transl Res., 159(4), 303–312.
Ma, Q., Liu, H., Xiang, G., Shan, W., Xing, W. (2016). Association between glycated hemoglobin A1c levels with age and gender in Chinese adults with no prior diagnosis of diabetes mellitus. Biomedical Reports 4, 737-740.
Martins, R. A., Jones, J. G., Cumming, S. P., Coelho e Silva, M. J., Teixeira, A. M., Veríssimo, M. T. (2012). Glycated hemoglobin and associated risk factors in older adults. Cardiovascular Diabetology, 11:13, 1-8.
Paterson, A. D. (2017). HbA1c for type 2 diabetes diagnosis in Africans and African Americans: Personalizedmedicine NOW! PLoS Med, 14(9), 1-6.

Bulletin of the Chemists and Technologists of Bosnia and Herzegovina 2018, 50, 35-42 41
Reynolds, T. M., Smellie, W. A. (2006). Glycated haemoglobin (HbA1c) monitoring. BMJ, 333, 586.
Sequeira, I. R., Poppitt, S. D. (2017). HbA1c as a marker of prediabetes: A reliable screening tool or not? Insights Nutr Metabol, 1(1), 21-29.
Sherwani, S. I., Khan, H. A., Ekhzaimy, A., Masood, A., Sakharkar, M. K. (2016). Significance of HbA1c Test in Diagnosis and Prognosis of Diabetic Patients. Biomarker Insights, 11, 95-104.
Syed, I., Khan, W. A. (2011). Glycated haemoglobin – a marker and predictor of cardiovascular disease. J Pak Med Assoc, 61, 690–695.
Xu, N., Wu, H., Lic, D., Wang, J. (2014). Diagnostic accuracy of glycated hemoglobin compared with oral glucose tolerance test for diagnosing diabetes mellitus in Chinese adults: A meta-analysis. Diabetes Research and Clinical Practice, 106, 11-18.
Vijayakumar, P., Nelson, R. G., Hanson, R. L., Knowler, W. C., Sinha, M. (2017). HbA1c and the Prediction of Type 2 Diabetes in Children and Adults. Diabetes Care, 40(1), 16-21.
VinodMahato, R., Gyawali, P., Raut, P. P., et al. (2011). Association between glycaemic control and serum lipidprofile in type 2 diabetic patients: glycated haemoglobin as a dual biomarker. Biomed Res, 22, 375–380.

42 Mandal & Čaušević
Summary/Sažetak
U svijetu, učestalost Tip 2 diabetes mellitusa (T2D) kao metaboličkog oboljenja, rapidno raste. Cilj ove studije bio je odrediti
koncentracije hemoglobina A1c (HbA1c), natašte glukoze i lipidni profil kod ukupno 104 odrasle osobe, 24 bolesnika sa
novodijagnosticiranim Tip 2 dijabetesom (40-60 godina starosti), 40 bolesnika sa T2D i 40 referentnih ispitanika kao
kontrolne grupe (iste starosne dobi). Na osnovu tih rezultata, mogli smo procijeniti razlike prema spolu i starosnoj dobi u
ispitivanoj populaciji, kao i odnos između kontrole glikemije (HbA1c) i lipidnog profila u serumu. Stoga smo pravilno
analizirali značaj HbA1c kao indikatora dislipidemije kod bolesnika sa T2D u odabranoj bosansko-hercegovačkoj populaciji.
Hemoglobin A1c određen je imunoturbidimetrijskom metodom, dok su natašte glukoza i lipidni profil analizirani prema
standardnim kliničkim metodama na BT PLUS 2000-Biotechnic Instruments bioanalizatoru. Nađeno je da je koncentracija
glikiranog hemoglobina kod novo dijagnosticiranih dijabetičara veća od izmjerene koncentracije u druge dvije analizirane
grupe. Pokazana je statistički značajna razlika na nivou ispitivane populacije (kada se porede biohemijski parametri i nivo
HbA1c) u vrijednostima glukoze, holesterola, HDL i LDL holesterola, HbA1c i starosne dobi bolesnika. Također, naši
rezultati su pokazali i statistički značajnu negativnu korelaciju između vrijednosti HbA1c i holesterola i HDL holesterola
(p***<0,001) i pozitivnu korelaciju s koncentracijom glukoze i starosnom dobi bolesnika (p***<0,001), u svim ispitivanim
grupama. Prema našim rezultatima, hemoglobin A1c, također, može biti korišten kao prediktor dislipidemije i time rana
dijagnoza dislipidemije može biti upotrebljena kao preventivna mjera za razvoj kardiovaskularnih oboljenja kod pacijenata
sa Tip 2 diabetes mellitusom.

Chemical characterization, antimicrobial and antioxidant properties of
Mentha spicata L. (Lamiaceae) essential oil
Nikšić, Ha., a*, Durić, K., a Omeragić, E.,a, Nikšić, He.,b Muratović, S.,a, Bečić, F.a
a University of Sarajevo, Faculty of Pharmacy, Zmaja od Bosne 8, Sarajevo, B&H
b PZU Oaza zdravlja, Mustafe Pintola bb, Sarajevo, B&H
INTRODUCTION Many plant species from the Lamiaceae family have been used for centuries as folk remedies and today's medicine accepts the fact that these plants have healing properties. Genus Mentha is one of most important in Lamiaceae family with the essential oils of a high economic value. The chemical composition of essential oil depends on many factors, including geographical region, harvest period, climatic and soil conditions, (Harley, 1972; Gobert et al., 2002). Mentha spicata, spearmint is a hybrid commercially cultivated aromatic plant, characterized by high amount essential oil, but it is still wild species in Balkan region.
Two main groups of constituents in essential oil are monoterpene hydrocarbonates and oxygenated monoterpenes. The most abundant compound in M. spicata essential oil is carvone that gives to essential oil distinctive smell. Both groupes of supstances possess powerful antimicrobial and antioxidant properties (Boukhebti et al., 2011). The essential oil of M. spicata is used as a flavoring in the perfume production, food and pharmaceutical industry. In addition, essential oil of spearmint shows strong antifungal, fumigant and antioxidant activity (Lawrence 2007).
Bulletin of the Chemists and Technologists of Bosnia and Herzegovina
Print ISSN: 0367-4444
Online ISSN: 2232-7266
2018
50
43-48 UDC: __________________________
Original Scientific Article
Article info Received: 11/01/2018 Accepted: 28/06/2018 Keywords: Mentha spicata Carvone Antimicrobial Antioxidative
*Corresponding author: E-mail: [email protected] Phone: +387 61 219 444
Abstract: The aim of the present study was to examine chemical composition,
antibacterial and antioxidative activity of essential oil extracted from the leaf of Mentha
spicata. The essential oil composition was investigated by GC/MS. Thirty three
components were identified, accounting for 98,9% of the essential oil. Dominant
components were carvone (56,4%), limonene (16,2%), 1,8 cineole (7%), β-pinene (2,4)
and α- terpinene (2,3%). Agar disk diffusion assay was used to evaluate antibacterial
activity of essential oil. The essential oil exhibited significant level of antibacterial
activity against all tested bacterial strains. In general, Gram-negative bacteria were
more susceptible to M. spicata essential oil than Gram-positive bacteria. E coli was the
most sensitive of the microorganisms to the antibacterial activity of M. spicata essential
oil. The 2,2-diphenyl-l-1-phthydrazide (DPPH) radical removal method was used for
evaluating the antioxidant potential of the essential oils.. The result showed a
considerable level of antioxidant activities of the essential oil investigated with (IC50
= 41, 23 µg/mL). Based on our results, M. spicata essential oil with a strong antioxidant
and antibacterial activities, could serve as a safe natural antioxidant and antiseptic
supplements in the pharmaceutical and food industry.
44 Nikšić et al.
Leading problem of massive use of antibiotics has resulted in resistance against pathogenic Gram positive and Gram negative bacteria. Clinical efficacy of many existing synthetic antibiotics has been reduced due to the developed bacterial resistance, so the pharmaceutical industry is looking for alternative new sources of antimicrobial agents (Sulieman et al. 2011). Nowdays there has been an increasing interest in the use of plant extracts and essential oils as a novel antimicrobial compounds for the treatment of various infectious diseases. Essential oils are sources that can provide a huge range of complex supstances with antifungal, antibacterial, and antiviral properties and can serve as a powerful tool to reduce the bacterial resistance (Burt, 2004). Beside antimicrobial activity of many essential oils nowadays, a large number of research is focused on determining antioxidant activity that these natural products possess (Dahiya, and Manglik 2013). Based on these assumptions, this research was aimed to determine in vitro antimicrobial and antioxidative activity and describe the qualitative and quantitative composition of essential oil of M. spicata native toBosnia and Herzegovina. EXPERIMENTAL Chemicals and Reagents: (-)–α Thujone (≥ 96% GC) analytical standard (Sigma Germany)( No. 89231); (-)- β Pinene 99+% (Sigma Germany); R -/+) – Limonene analytical standard (Fluka Germany) (No.62118); Eucalyptol analytical standard (Fluka Germany) (No. 29210); Linalool analytical standard (Fluka Germany) (No. 51782); (+)-Carvone analytical standard (Fluka Germany) (No. 22070); Thimol standard (Fluka Germany) (No.50409); (−)-trans-Caryophyllene ≥98.5% (sum of enantiomers, GC) (Sigma Germany) (No. 22075). Plant Material Leaf of wild growing flowering plants of Mentha spicata L. during flowering stage were collected on the bank of the Jablanicko lake in Bosnia and Herzegovina in 2016. Voucher specimen of collected plant No.1059/2 after were confirmed by an independent expert and deposited at the Herbarium of the Department of Pharmacognosy, Faculty of Pharmacy, University of Sarajevo. Isolation of the Essential Oil The leaves of Mentha spicata were shade dried (15 days) at room temperature. Air-dried leaf of Mentha spicata were submitted to hydrodistillation according to European Pharmacopoeia 4th Ed., using Clevenger apparatus (Klaus Hofmann GmbH, Germany). The essential oil samples of each phenophase were dried over anhydrous sodium sulfate. The quantity of predistilled essential oils was determined volumetrically (Council of Europe, 2002). Essential Oil Analysis Qualitative and quantitative analyses of the essential oils were carried out by using gas chromatography/mass spectrometry system (GC-MS, Agilent Tecnologies series 6890N/5975B United States of America) at electron energy of 70eV, equipped with a split-splitless injector
(200°C) and a flame ionization detector (FID) (250°C). As a carrier gas helium (1 mL/min) was used. The capillary columns (HP 5MS 30m x 0.25mm; film thickness 0.25μm Agilent Tecnologies) were used. The temperature programmes were 50°C to 280°C at a rate of 10°C/min until 130°C and 130-280°C at a rate of 12°C/min, respectively with split ratio, 1:10. Co-elution and MS analysis based on the identification of the individual compounds, and the comparison of their relative retention times (RI) with those of the reference samples were performed. For the components, mostly sesquiterpenes and aliphatic compounds, for which reference substances were not available, the identification was performed by matching their retention times and mass spectra with those obtained from the authentic samples and/or the The National Institute of Standards and Technology, known as the National Bureau of Standards (NIST/NBS), Wiley libraries spectra as well as with literature data (Adams, 2007). Evaluation of Antibacterial Activity. Antimicrobial activity of essential oils, isolated from Mentha spicata L., using diffusion method was performed in this study. A collection of six test organisms, including three Gram-positive and three Gram-negative bacterial strains, was used. The groups included five organisms of American Type of Culture Collection (ATCC) and one organism of National Collection of Type Cultures (NCTC). The source of the bacterial strains is shown in Table 2. All test organisms were stored at +4 °C on Mueller-Hinton (MH) agar slants, subcultured every 2 weeks and checked for purity. Antibiotics which are therapeutically important in treating infections caused by these microorganisms were used as comparative substances (as positive control): ciprofloxacine for evaluation of antimicrobial activity of Pseudomonas aeruginosa, Penicilin for Bacillus subtilis, Gentamycin for Escherichia coli, Staphylococcus aureus and Staphylococcus epidermidis and tetracycline for Salmonella enterica subsp.enterica serotype ABONY. All samples were applied as solution with n-hexane as a solvent. The effect of the solvent (n-hexane) on the microbial growth was also analyzed. On the surface of the agar, the 6 mm holes in diameter were punched. Hundred microliters of the tested essential oils (10 %, 5%, 1%, 0.5% and 0.1% solutions in n-hexane was applied to the holes. The plates were incubated overnight at 37 °C, and the diameter of the resulting zone of inhibition was measured. Each test point of antimicrobial activity was performed in quadruplicate in minimum three individual experiments. (Niksic et al. 2012). Chemicals and apparatus used: 1,1-Diphenyl-2- picrylhydrazyl (DPPH•) as free radical form (90% purity) and 6-hydroxy-2,5,7,8 tetramethylchroman-2- carboxylic acid (Trolox) were obtained from Sigma- Aldrich Quimica (Alcobendas, Spain). N- hexane was provided by Merck (Mollet del Valle´s, Spain). All reagents were of analytical grade. Double distilled water (Millipore Co.) was used throughout. Absorbance measurements were recorded on a UV/VIS mini- 1240 Spectrophotometer (Shimadzu, Japan).
Bulletin of the Chemists and Technologists of Bosnia and Herzegovina 2018, 50, 43-48 45
Determination of antioxidant activity using the 2,2-diphenyl-1-picrylhydrazyl (DPPH) radical scavenging method The antioxidant activity was measured in terms of hydrogen donating or radical scavenging ability using the stable radical DPPH. Experiments were carried out according to the method we used in our earlier study (Niksic et al. 2012). The reduction of the radical is followed by a decrease in the absorbance at 517 nm. A volume of 2 mL of a n-hexanic stock solution of the essential oils was put into test tubes and 2 mL of 90 μM DPPH solution was added. The tubes were covered with parafilm and kept again in the dark for 1.5 h. Five working standards of trolox (0.05-0.1nM) is prepared. Absorbance at 515 nm was measured with a spectrophotometer UV-VIS. Free radical scavenging capacity in percent (RSC (%)) was calculated by Eq. [1]: RSC (%)=100*(Ablank -Asample) / Ablank [1] The amount of sample necessary to decrease the absorbance of DPPH by 50% (IC50) was calculated from graphs for solutions of the essential oils with n-hexane as a solvent with six different concentrations. RESULTS AND DISCUSSION Essential oil content and chemical composition The yield of M. spicata essential oils were 1.67%-2.02% v/w in dry leaf. Our results showed higher content then M. spicata grown in south Europe (Greece) and north Africa (Tunisia) ranging from 0.1-1.8 % (Asekun et al. 2007). A total of 34 compounds were identified, representing 98.9% of the total content in the essential oils extracted from M. spicata leaves collected in Bosnia and Herzegovina. The identified compounds are listed in Table 1 in elution order from the HP-5 MS column, along with the percentage composition of each component. The essential oil contains 71.2% oxygenated monoterpenes, 21.1% monoterpene hydrocarbons, and 5.2% of sesquiterpene hydrocarbons. The main constituents were carvone (56.4%) and limonene (16.2%) followed by 1,8-cineole (7.0%), terpinen-4-ol (3.0) β-pinene (2.4%), α-terpineol (2.3%) and E- caryophyllene (1.5%). The investigated oil can be classified to the carvone/limonene chemotype. Generally, there is a variation in the chemical composition of M. spicata essential oil wild and cultivated, around the world. Different chemotypes have been described in previous studies classified as chemotypes: carvone, limonene, carvone/limonene, pulegone/menthone/isomenthone, and pulegone/piperitone. (Telci et al. 2004; Telci et al. 2010). Carvone content also varies in the essential oil of M. spicata growing in different regions: Egypt (46.4%–68.55%) (Foda 2010), Canada (59%–74%) (Zheljazkov et al., 2010), Colombia (61.53%) (Roldán et al. 2010); Turkey (78.35%–82.2%) (Telci et al. 2005) and China (55.45%–74.6%) (Hua et al. 2011). M. spicata essential oil from Iran was characterized by a low amount of carvone 22.4% (Hadjiakhoondi et al. 2000). A linalool chemotype (82.8%) was also reported from Turkey. A low content of
limonene (5.7%) was reported in essential oil from Serbia (Sokovic et al. 2009). However, differences in the yield and chemical composition of M. spicata essential oil can be attributed to several factors such as the geographic region, harvesting period, climatic and soil conditions, and phenophases in collection time. Antimicrobial Activity The antibacterial activity of essential oil against a range of Gram-positive and Gram-negative microrganisams is shown in Table 2. Significant antimicrobial activity was exhibited by essential oil against all tested Gram positive and Gram-negative microorganisms. Especially considerable is that the highest sensitivity to essential oil of M. spicata was observed by Escherichia coli ATCC 8739 producing the maximum zone of inhibition (11,8 - 21 mm), Salmonella enterica (8-18mm) and Pseudomonas aeruginosa (10-16mm). Gram-negative bacteria appear to be more sensitive to the different examined essential oils than Gram-positive bacteria. Gram positive stains showed moderate antimicrobial activity in concentrations 1%, 5% and 10%, Staphylococcus aureus maximum zone of inhibition (8-13mm), Staphylococcus epidermidis (10,1-11,2mm) and Bacillus subtilis (9-11,5mm). According to the literature, M. spicata essential oil showed an antibacterial effect on the growth of both Gram-negative and Gram-positive bacteria (Lorenzi et al. 2009). Mahboubi and Haghi, reported that the essential oil of M. spicata exhibited a high antibacterial activity in the range of 8-21 against Staphylococcus aureus, Listeria monocytogenes, Bacillus cereus, Escherichia coli. Recently, Mimica-Dukic et al. (2004) reported that the M. spicata essential oil was active against Gram-negative bacteria, Pseudomonas aeruginosa, Escherichia coli, Salmonella enteritidis, Salmonella typhi, and Shigella strains. However, antibacterial activities of essential oils are likely related to the percentage of oxygenated monoterpenes and monoterpene hydrocarbons (Dahiya et al. 2013). In conclusion, there was a close relationship between antimicrobial activity and carvone and limonene levels in essential oils.
46 Nikšić et al.
Table 1. Chemical Composition of M. spicata Essential Oil
Components RIa percent % Identification method b monoterpene hydrocarbons 21,1 α-pinene 938 1,2 RT GC MS camfene 954 0,2 RT* MS sabinene 974 0,6 RT* MS β-pinene 978 2,4 RT GC MS limonene 1035 16,2 RT* MS E-β-ocimene 1050 0,2 RT* MS γ−terpinene 1063 0,1 RT GC MS terpinolene 1080 0,2 RT GC MS oxygenated monoterpenes 71,2 1.8-cineole 1036 7 RT GC MS Z-sabinene hydrate 1067 0,1 RT GC MS E-sabinene hydrate 1098 0,1 RT GC MS terpinen-4-ol 1178 3 RT GC MS α-terpineol 1188 2,3 RT GC MS dihydrocarveol 1194 0,6 RT GC MS E-carveol 1217 0,9 RT GC MS carvone 1243 56,4 RT GC MS bornyl acetate 1288 0,2 RT GC MS Z-jasmone 1395 0,3 RT GC MS sesquiterpene hydrocarbons 5,2 β-burbonene 1383 1,2 RT GC MS β-cubebene 1390 0,1 RT GC MS β-elemene 1391 0,6 RT GC MS α-gurjunene 1410 0,2 RT GC MS E- caryophyllene 1419 1,5 RT GC MS α-humulene 1452 0,1 RT GC MS γ-gurjunene 1477 tr. RT GC MS germacrene D 1490 1,1 RT* MS bicyclogermacrene 1501 0,2 RT* MS γ−cardinene 1514 0,2 RT GC MS δ-cadinene 1523 0,1 RT GC MS oxygenated sesquiterpenes 0,7 spathulenol 1578 0,3 RT GC MS caryophyllene oxide 1582 0,2 RT* MS α-cadinol 1654 0,1 RT GC MS aliphatic compounds 0,7 3-octanol 991 0,7 RT GC MS total identified 98,9 a Retention indices relative to C9-C24 n-alkanes on the HP 5MS column b RT, comparison with pure standard retention time; GC, gas chromatographic coelution with pure standard; MS, mass spectrometry; RT∗, comparison of the relative retention time with those obtained from the NIST/NBS, Wiley libraries spectra and those reported by Adams14

Bulletin of the Chemists and Technologists of Bosnia and Herzegovina 2018, 50, 43-48 47
Table 2 Antibacterial Activity (Inhibition Zone Measured in mm, Including Hole 6 mm in Diameter) of Essential Oils of Mentha spicata source organism 10 % 5 % 1% 0,5% 0,1% Positive control ATCC 6633 Bacillus subtilis 11,5±0,61 10,1±0,70 9±0,71 - 32±0,70 penicilin ATCC 6538 Staphylococcus
aureus 13±1,52 10,5±1,62 8±0,71 - - 10,5±0,00
gentamycine ATCC 11228 Staphylococcus
epidermidis 11,2±1,61 10,1±1,92 - - - 15,2 ±0,00
gentamycine ATCC 8739 Escherichia coli 21±0,90 19±1,22 11,8±0,6 - - 17 ±0,22
gentamycine ATCC 9027 Pseudomonas
aeruginosa 16±1,9 14±1,71 11±0,77 10±0,87 - 28 ±0,85
ciprofloxacine NCTC 6017 Salmonella
enterica subsp. enterica serotype ABONY
18±1,33 17±0,50 14±1,23 8±1,22 - 20±0,22 tetracycline
The values shown represent the average of three determinations ± standard deviations. All essential oils were diluted in n-hexane (solvent expressed no activity on bacterial growth). Antioxidant Activity This study, also, determined the antioxidant activity of M. spicata essential oil. The results indicate that the hexane solution of the essential oil exhibited high antioxidant activity with a value of IC50 41.2 μg / mL (Table 3). Based on obtained results appeared to be an association between antioxidant and antimicrobial activity. Oxygenated monoterpenes and monoterpene hydrocarbons are mainly responsible for the antioxidant activity of essential oil. However, spearmint essential oil are mixture of different types of terpenoids and we can not attribute the antioxidant effect of a total essential oil only to the major compounds,because of synergistic or antagonistic interaction between supstances can occur, thus having effect on antioxidative activity. Essential oils of M. spicata native from Turkey showed higher antioxidative activity IC50 77.40 μg/mL (Kizil et al. 2010). Also higher antioxidative activity was reported in spermint essential oil from Iran with the IC50 87.89 µg/mL (Nickavar et al. 2008) The lower antioxidative activity of investigated M. spicata essential oils might be due to lower presence of some components that have antioxidant activity such 1,8 cineole. Table 3 . Percentage of neutralization of DPPH. Of essential oil of M. spicata and trolox as positive control) in DPPH assay Source Concentracion (µg/ml)
7,40 14,80 29,60 44,40 IC50
M. spicata
24,27 30,10 42,72 51,55 41,23
Trolox 3,53
CONCLUSION The essential oil of M. spicata was characterized by GC-MS and 34 compounds were identified as carvone chemotype. The main components were carvone (56,4%), limonene (16,2%), 1,8 cineole (7%), β-pinene and α- terpinene (2,3%). The results obtained from M. spicata essential oil showed high antibacterial activity, especially against Gram-negative bacteria. The antibacterial activity of the essential oil could be attributed to the presence of
mixture of various group of compounds, such as oxygenated monoterpenes and monoterpene hydrocarbons as dominant group of constituents. The examined essential oil exhibited high antioxidative activity that was attributed to majority constituents carvone, limonene and 1.8 cineole. Present study indicated that essential oil of M. spicata possess important volatile compounds with antimicrobial and antioxidative activity. These results indicate that M. spicata essential oil could serve as safe natural flavor agent with antioxidant and antiseptic activity in pharmaceutical and food industry. REFERENCES Adams, R., Adams, R. (2007). Identification of essential
oil components by gas chromatography/quadrupole mass spectroscopy. (1st Ed.) Carol Stream, Ill.: Allured Pub. Corp.
Asekun, O. T., Grierson, D. S., Afolayan, J. (2007). Effects of drying methods on the quality and quantity of the essential oil of Mentha longifolia L. subsp. Capensis. Food Chemistry, 101, 995-998.
Boukhebti, H., Chaker, A.N., Belhadj, H., Sahli, F., Ramdhani, M., Laouer, H., Harzallah, D. (2011). Chemical composition and antibacterial activity of Mentha pulegium L. and Mentha spicata L. essential oils. Der Pharmacia Lettre, 3, 267–275.
Boukhebti, H., Chaker, A.N., Belhadj, H., Sahli, F., Ramdhani, M., Laouer, H., Harzallah, D. (2011). Chemical composition and antibacterial activity of Mentha pulegium L. and Mentha spicata L. essential oils. Der Pharmacia Lettre, 3, 267–275.
Burt, S. (2004). Essential oils: their antibacterial proprieties and potential application in food. Journal of Applied Microbiology. 94, 223-253.
Chauhan, R.S., Nautiyal, M.C., Tava, A. (2010). Essential oil composition from aerial parts of Mentha spicata L. Journal of Essential Oil Bearing Plants, 13, 353–356.
Council of Europe. (2002). European Pharmacopeia. (4th Ed.), Strasbourg Cedex, France, (p.p. 183–184).
Dahiya, P., Manglik, A. (2013). Evaluation of antibacterial, antifungal and antioxidant potential of essential oil from Amyris Balsamifera against multi drug resistant clinical isolates. Asian Journal of Pharmaceutical and Clinical Research, 6(5), 57-60.
48 Nikšić et al.
Foda, M.I., El-Sayed, M.A., Hassan, A.A., Rasmy, N.M., El-Moghazy, M.M. (2010). Effect of spearmint essential oil on chemical composition and sensory properties of white cheese. The Journal of American Science, 6, 272–279.
Hadjiakhoondi, A., Aghel, N., Zamanizadech-Nadgar, N., Vatandoost, H. (2000). Chemical and biological study of Mentha spicata L. essential oil from Iran. DARU Journal of Pharmaceutical Sciences, 8, 19–21.
Hua, C.X., Wang, G.R., Lei, Y. (2011). Evaluation of essential oil composition and DNA diversity of mint resources from China. African Journal of Biotechnology, 10, 16740–16745.
Kizil, S., Hasimi, N., Tolan, V., Kilinç, E., Yüksel, U. (2010). Mineral content, essential oil components and biological activity of two Mentha species (M. piperita L., M. spicata L.). Turkish Journal of Field Crops, 15, 148–153.
Lawrence, B.M. (2007). Mint: The Genus Mentha. Taylor and Francis Group: Boca Raton, FL, USA.
Lorenzi, V., Muselli, A., Bernardini, A.F., Berti, L., Pagès, J.M., Amaral, L., Bolla, J.M. (2009). Geraniol restores antibiotic activities against multidrug resistant isolates from gram-negative species. Antimicrobial Agents and Chemotherapy, 53, 2209–2211.
Mimica-Dukić, N., Božin, B. (2007). Essential Oils from Lamiaceae Species as Promising Antioxidant and Antimicrobial agents. Natural Product Communications, 2(4), 445-452.
Mimica-Dukić, N., Božin, B, Sokovic, M., Natasa Simin, N.(2004) Antimicrobial and Antioxidant Activities of Melissa officinalis L.(Lamiaceae) Essential Oil. Journal of Agriculture Food Chemistry, 52 (9), 2485–2489
Nickavar, B., Alinaghi, A., Kamalinejad, M. (2008). Evaluation of the antioxidant properties of five Mentha species. Iranian Journal of Pharmaceutical Research, 7, 203–209.
Niksic, H., Besovic, E., Makarevic, E. and Duric, K. (2012). Chemical composition, antimicrobial and antioxidant properties of Mentha longifolia (L.) Huds. essential oil. Journal of Health Sciences, 2(3), 192--200.
Roldán, L.P., Díaz, G.J., Duringer, J.M. (2010). Composition and antibacterial activity of essential oils obtained from plants of the Lamiaceae family against pathogenic and beneficial bacteria. Revista Colombiana de Ciencias Pecuarias, 23, 451–461.
Sokovic, M.D., Vukojevic, J., Marin, P.D., Brkic, D.D., Vajs, V., van Griensven, L.J.L.D. (2009). Chemical composition of essential oils of Thymus and Mentha species and their antifungal activities. Molecules, 14, 238–249.
Sulieman, A.M.E., Abdelrahman, S.E., Abdel Rahim, A.M. (2011). Phytochemical analysis of local Spearmint (Mentha spicata) leaves and detection of the antimicrobial activity of its oil. Journal of Microbiology Research, 1(1), 1-4.
Telci, I., Demirtas, I., Bayram, E., Arabaci, O., Kacar, O. (2010). Environmental variation on aroma components of pulegone/piperitone rich spearmint (Mentha spicata L.). Industrial Crops and Products, 32, 588–592.
Telci, I., Sahbaz, N. (2005). Variations in yield, essential oil and carvone contents in clones selected from Carvone-scented landraces of Turkish Mentha species. Journal of Agronomy and Crop Science, 4, 96–102.
Telci, I., Sahbaz, N., Yilmaz, G., Tugay, M.E. (2004). Agronomical and chemical characterization of spearmint (Mentha spicata L.) originating in Turkey. Economic Botany, 58, 721–728.
Zheljazkov, V.D., Cantrell, C.L., Astatkies, T. (2010). Yield and composition of oil from Japanese cornmint fresh and dry material harvested successively. Agronomy Journal, 102, 1652–1656.
Summary/Sažetak
Cilj rada bio je ispitati hemijski sastav, antibakterijsku i antioksidativnu aktivnost eteričnog ulja iz liste vrste Mentha spicata.
GC-MS analizom identificirane su 33 komponente, koje čine 98,9% eteričnog ulja. Dominantne komponente su karvon
(56,4%), limonen (16,2%), 1,8 cineol (7%), β-pinen (2,4) i a-terpinen (2,3%). Antibakterijsko djelovanje eteričnog ulja je
procijenjeno disk difuzionom metodom. Eterično ulje pokazalo je visoku razinu antibakterijskog djelovanja protiv svih
testiranih mikroorganizama. Generalno Gram negativne bakterije bile su osjetljivije na ispitivano eterično ulje od Gram-
pozitivnih bakterija. E. coli bila je najosjetljiviji soj. Također je procjenjena antioksidativna aktivnost eteričnog ulja metodom
DPPH. Rezultat je pokazao značajnu antioksidativnih aktivnosti ispitivanog eteričnog ulja istraženog kao (IC50 = 41, 23 ug
/mL). Na osnovu dobijenih rezultata, eterično ulje vrste M. spicata može poslužiti kao siguran dodatak u farmaceutskoj I
prehrambenoj industriji sa antioksidativnim i antiseptičkim učinkom.
Determination of clindamycin hydrochloride content in 1% clindamycin lotion
Dedić, M.,a * Bečić, E.,a Imamović, B.,a Žiga, N.b
a Faculty of Pharmacy University of Sarajevo, Department for Pharmaceutical Analysis, Zmaja od Bosne 8, 71000 Sarajevo, B&H
b Faculty of Pharmacy University of Sarajevo, Department for Clinical Pharmacy, Zmaja od Bosne 8, 71000 Sarajevo, B&H
INTRODUCTION
Clindamycin Clindamycin (IUPAC name: (2S,4R)-N-[2-chloro-1-[(2R,3R,4S,5R,6R)-3,4,5-trihydroxy-6-methylsulphanyloxan-2-yl]propyl]-1-methyl-4-propylpyrrolidine-2-carboxamide) is an antibiotic belonging to the lincosamide group (Figure. 1). Clindamycin is formed by the synthesis of linkomycin with thionyl chloride, where at position seven OH groups are replaced with Cl. (Mateja, 2015, Zhou, Zheng, Wu, et al, 2006). Figure 1. Chemical structure of clindamycin [1]
Bulletin of the Chemists and Technologists of Bosnia and Herzegovina
Print ISSN: 0367-4444
Online ISSN: 2232-7266
2018
50
49-54 UDC: __________________________
Original Scientific Article
Article info Received: 14/04/2018 Accepted: 28/06/2018
Keywords: Clindamycin Clindamycin Hydrochloride Ex Tempore Preparation 1% Clindamycin Lotion Uv-Vis Spectrophotometry
*Corresponding author:E-mail: [email protected] Phone: +387-61-349-288
Abstract: Clindamycin is a broad spectrum antibiotic that belongs to the
lincosamide group. It acts mostly as a bacteriostatic antibiotic, but it also has mild
bactericidal activity. The most common clinical conditions in which they are used
are: infections in gynecology, gingiva infections, respiratory tract, skin and soft
tissue infections, intra-abdominal infections, pneumonia caused by Pneumocystis
jiroveci, toxoplasmosis, malaria, babesiosis, and acne. Clindamycin is available in
several pharmaceutical forms, which can be administered orally, intravenously,
intramuscularly or intradermally. It is usually prepared as an ex tempore 1%
clindamycin lotion that is used dermally, in the treatment of a mild form of acne.
The proposed UV-Vis spectrophotometric method allows analyzing the content of
clindamycin hydrochloride in the extemporaneous formulation of 1% clindamycin
lotion. Clindamycin chloride content analysis was performed on samples of 1%
clindamycin lotions purchased in pharmacies in Canton Sarajevo. The results
showed that the content of clindamycin hydrochloride in the ex tempore prepared
preparations varied from 21% to 142%.
The UV-Vis method does not require complicated preparation of the sample, and
is therefore fast, reliable and economical, and as such can be used in regular control
of the content of clindamycin hydrochloride in ex tempore prepared lotion.
50 Dedić et al.
Mechanism of action Clindamycin acts predominantly as bacteriostatic. Although it also has bactericidal activity, it depends on the concentration itself at the site of action and on the type of pathogen. It acts by binding to the 50S subunit of bacterial ribosomes and inhibiting the formation of a peptide bond, i.e. it inhibits the synthesis of bacterial proteins (Mifsud, Vella, Ferrito, et al, 2014).
Spectrum of action and clinical use Clindamycin acts against gram-positive aerobic and gram-negative and gram-positive anaerobic bacteria. It is especially effective for the treatment of infections caused by Bacteroides fragilis in the treatment of most Gram-positive cocci, such as pneumococci, β-hemolytic streptococcus A and B and staphylococci. It also acts on staphylococcal strains that secret beta-lactamase, and especially exhibits action on Staphylococcus epidermidis. It is not effective against methicillin resistant Staphylococcus aureus (MRSA), and against Corynebacterium diphteriae, but does not exhibit anti-Corynebacterium jeikeum activity. Clindamycin does not exhibit an effect on gram negative aerobic bacteria and enterococci, and is less effective in gram negative cocci and coccobacilli, such as Neisseria spp. and Haemophilus influenzae. However, it exhibits action against Chlamydia trachomatis. The most common clinical conditions in which clyndamicin is used are: infections in gynecology, gingiva infections, respiratory tract, skin and soft tissue, intra-abdominal infections, pneumonia caused by Pneumocystis jiroveci, toxoplasmosis, malaria, babesiosis, and acne. Clindamycin is available in several pharmaceutical forms, which can be administered orally, intravenously, intramuscularly or intradermally. Oral preparations are available in the form of capsules containing clindamycin chloride or as a suspension for use in pediatrics containing clindamycin palmitate hydrochloride. Clindamycin phosphate ester is used in preparations intended for intravenous or intramuscular administration. It can be given in the form of gel, cream or lotion (Mateja, 2015, Mifsud, Vella, Ferrito, et al, 2014, Rang, Dale, Ritter, et al, 2005, Prakash and Nehal, 2014, Zaenglein, Pathy, Schlosser, et al, 2016).
Extemporaneous preparation of clindamycin Extemporaneous drug is a drug prepared in a pharmacy in accordance with the prescribed prescription for an individual patient (Federalno ministarstvo zdravstva, 2008). According to the European Pharmacopoeia, the extemporaneous medicines belong to a group of pharmaceutical preparations that are made for a patient or group of patients and are issued immediately after manufacturing process , thus are called extemporaneous preparations. In the market, the extemporaneous preparation is 1% clindamycin lotion. Its most common indication is acne, i.e., cases of moderately severe acne. Besides lotions, it can be made both in the form of gel and as an aqueous solution (Rohit, Rashmin, Mrunali, 2014, Stanković, Savić, Marinković, 2013, Tamaddon, Mostafavi, 2012, Wang, Kuo, Shu, et al, 2014).
Extemporaneous preparation (Clindamycini solutio 1% - Clindamycin, 1% solution for skin) is prepared according to Formulae Magistrales, and the ex-tempore composition, in certain proportions, include: Clindamycin hydrochloridum, Propylenglycolum, Ethanolum 70%, Aqua purificata. After production of this preparation, 1g of the clindamycin base corresponds to 1.13 g of clindamycin hydrochloride. The lotion is packed in dark, dry, glass or plastic bottles. The antibiotic preparation as mentioned above, is used in the treatment of acne. The solution is applied 2x daily (Hadžović and Čatić 2012).
Analytical methods for the determination of clindamycin There are many analytical methods for analyzing clindamycin in various pharmaceutical compositions, as well as in biological samples. The most commonly used are high performance liquid chromatography (HPLC), gas chromatography, capillary electrophoresis, micellar electrocinetic chromatography, and spectrophotometry (Mifsud, Vella, Ferrito, et al, 2014, Olbrich and Corbett 2013, Prakash, Nehal, 2014, Rajendar, Potnuri, Rao, 2015).
The objectives of this paper were to: optimize the UV-Vis spectrophotometric method for the determination of clindamycin hydrochloride in the primary preparation of 1% clindamycin lotion and to determine the content of clindamycin hydrochloride in ex tempore preparations of 1% clindamycin lotions, which are sold in pharmacies in Canton Sarajevo.
EXPERIMENTAL
Apparatus The analysis was carried out on spectrophotometer UV mini 1240, Shimadzu. The water used in the analysis was ultrapure water, obtained on the ultra clean water machine. (Arium mini, Sartorius).
Chemicals NaH2PO4·H2O (sodium dihydrogen phosphate monohydrate); Merck. H3PO4 (orthophosphoric acid, 85%); Merck. C2H5OH (ethanol 96%). C3H8O2 (propylene glycol). Clindamycin chloride (Reference standard), C18H3ClN2O5·HCl; (Purity of 94.8% clindamycin hydrochloride, equivalent to 87.3% clindamycin), Pfizer.
Terms of analysis Solvent: NaH2PO4 buffer pH 2.5. Blank test: NaH2PO4 buffer pH 2.5. The wavelength at which the analysis was performed is 210 nm.
Preparation of buffer pH 2.5 6 g of Na2HPO4 in a volumetric flask was dissolved in a 1 L solution and dissolved in ultra pure water. The pH was then adjusted with orthophosphoric acid. The buffer solution was used in the preparation of samples and as a blank test in the spectrophotometric analysis.
Bulletin of the Chemists and Technologists of Bosnia and Herzegovina 2018, 50, 49-54 51
1% clindamycin lotion 1.13 g of Clindamycin hydrochloridum was weighed and transerred into a 10 mL volumetric flask and with constant stirring dissolved in a mixture of 10 mL of propylene glycol, 70 mL of 70% ethanol and the flask was filled with ultra pure water to the mark.
Blind test (blank) A blank test of clindamycin lotion was prepared by mixing all the components that were added when using 1% clindamycin lotions, except the active component (clindamycin hydrochloride).
Preparation of the basic solution of clindamycin chloride 10 mg standard clindamycin hydrochloride standards was weighed and trasferred into a 10 mL volumetric flask and dissolved in pH 2.5 buffer. The concentration of the solution was 1 mg / mL.
Clindamycin hydrochloride dilution series for calibration curve From the basic solution of concentration 1 mg/mL, concentration dilution series was prepared of 0.05; 0.1; 0.15; 0.2; 0.25 mg/mL The dilutions were prepared with NaH2PO4 buffer pH 2.5. Additionally prepared concentrations: 0.1; 0.15; 0.2 mg/mL, were used for repeatability.
Samples for analysis: Samples of 1% clindamycin lotions were purchased in pharmacies in Canton Sarajevo. According to pharmacists, the extemporaneous preparations were prepared ex tempore. 1.5 mL was transferred from each lotion to a 100 mL volumetric flask and filled with a pH 2.5 buffer to the mark. They were analyzed spectrophotometrically with NaH2PO4 buffer pH 2.5 as a blank test.
RESULTS AND DISCUSSION
Optimization of UV-Vis spectrophotometric methods These validation parameters were tested: selectivity, linearity, accuracy, repeatability, detection limit and quantification limit. The selectivity was tested by measuring the absorbance of a blank test at a wavelength of 210 nm and 1% of clindamycin lotions. No blank test absorbance was observed, while 1% clindamycin lotion showed absorption at mentioned wavelength, suggesting that the proposed method was selective for the determination of clindamycin hydrochloride. Linearity was carried out on a dilution series (0.05, 0.1, 0.15, 0.2, 0.25 mg/mL), which were prepared as described in the section Material and Methods. Results for the validation parameter linearity are shown in Table 1. and Figure 2.
Figure 2. Calibration curve for the dilution series of clindamycin hydrochloride
Table 1 shows the values of the limit of detection and limit of quantification.
Table 1. Validation parameter linearity for clindamycin hydrochloride
Parameter Value Concentration range 0,05- 0,25 mg/mL
Curve inclination 2,978 Section on the Y axis 0,0775
Correlation coefficient 0,9997 LOD 7,58E-10 LOQ 2,53E-09
The repeatability of the method was carried out at 3 different concentrations of clindamycin hydrochloride standards, and the solutions were prepared according to the regulation given in the section Material and Methods. The results are shown in Table 2.
Statistical analysis of the results showed that this validation parameter meets the requirements set in the ICH guidelines.
Sample analysis There is no legal regulation that defines the allowed deviation of contents for the extemporaneous and galenical preparations, as these preparations are not subject to registration. There is only a recommendation on the expiry date given by the Formulae Magistrales, according to which clindamycin lotion is classified into a group of preparations with preservatives and the recommended shelf life of 6 months. Consequently, the content of ex tempore prepared samples was determined, and the results are shown in Table 3. The content of clindamycin hydrochloride varies from sample to sample and ranges from 21 to 142%. Each extemporaneous preparation should have been prepared in the same way, according to Formulae Magistrales. The absorbance of sample 6 was not possible to measure due to the turbidity of solution, and according to the declaration, in addition to the components prescribed by Formulae Magistrales, other components were detected (2-propanol 85%, aloe vera 2%, eucalyptus oil 1% and chamomile oil 1%).
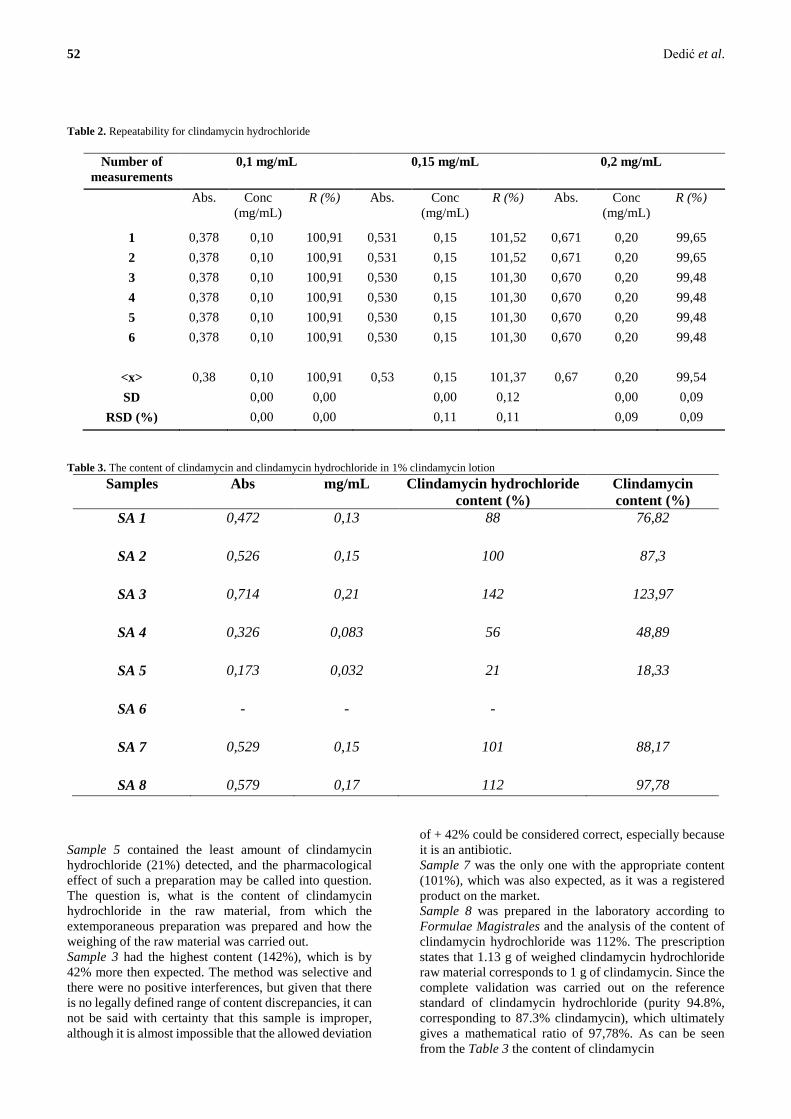
52 Dedić et al.
Table 2. Repeatability for clindamycin hydrochloride
Number of measurements
0,1 mg/mL 0,15 mg/mL 0,2 mg/mL
Abs. Conc (mg/mL)
R (%) Abs. Conc (mg/mL)
R (%) Abs. Conc (mg/mL)
R (%)
1 0,378 0,10 100,91 0,531 0,15 101,52 0,671 0,20 99,65 2 0,378 0,10 100,91 0,531 0,15 101,52 0,671 0,20 99,65 3 0,378 0,10 100,91 0,530 0,15 101,30 0,670 0,20 99,48 4 0,378 0,10 100,91 0,530 0,15 101,30 0,670 0,20 99,48 5 0,378 0,10 100,91 0,530 0,15 101,30 0,670 0,20 99,48 6 0,378 0,10 100,91 0,530 0,15 101,30 0,670 0,20 99,48
<x> 0,38 0,10 100,91 0,53 0,15 101,37 0,67 0,20 99,54 SD 0,00 0,00 0,00 0,12 0,00 0,09
RSD (%) 0,00 0,00 0,11 0,11 0,09 0,09
Table 3. The content of clindamycin and clindamycin hydrochloride in 1% clindamycin lotion Samples Abs mg/mL Clindamycin hydrochloride
content (%) Clindamycin content (%)
SA 1 0,472 0,13 88 76,82
SA 2 0,526 0,15 100 87,3
SA 3 0,714 0,21 142 123,97
SA 4 0,326 0,083 56 48,89
SA 5 0,173 0,032 21 18,33
SA 6 - - -
SA 7 0,529 0,15 101 88,17
SA 8 0,579 0,17 112 97,78
Sample 5 contained the least amount of clindamycin hydrochloride (21%) detected, and the pharmacological effect of such a preparation may be called into question. The question is, what is the content of clindamycin hydrochloride in the raw material, from which the extemporaneous preparation was prepared and how the weighing of the raw material was carried out. Sample 3 had the highest content (142%), which is by 42% more then expected. The method was selective and there were no positive interferences, but given that there is no legally defined range of content discrepancies, it can not be said with certainty that this sample is improper, although it is almost impossible that the allowed deviation
of + 42% could be considered correct, especially because it is an antibiotic. Sample 7 was the only one with the appropriate content (101%), which was also expected, as it was a registered product on the market. Sample 8 was prepared in the laboratory according to Formulae Magistrales and the analysis of the content of clindamycin hydrochloride was 112%. The prescription states that 1.13 g of weighed clindamycin hydrochloride raw material corresponds to 1 g of clindamycin. Since the complete validation was carried out on the reference standard of clindamycin hydrochloride (purity 94.8%, corresponding to 87.3% clindamycin), which ultimately gives a mathematical ratio of 97,78%. As can be seen from the Table 3 the content of clindamycin

Bulletin of the Chemists and Technologists of Bosnia and Herzegovina 2018, 50, 49-54 53
hydrochloride was within the range of 21% to 142% calculated at the expected concentration. Only the sample 8 had a concentration that should have therapeutic activity. All other tested samples had a lower content than expected, except sample 3 which had an unexpectedly high content of clindamycin hydrochloride. Theoretically, there are several possible reasons for such results. Given that preparations are not prepared in the same laboratory, the question may be raised as to quality of the raw materials were prepared, its purity, the content of the active substance, the presence of impurities, etc., which could interfere and influence spectrophotometric measurement. In addition, spectrophotometric determination may also be influenced by the presence of keto group in the clindamycin structure, which under certain conditions may be subject to keto-enol tautomerism.
CONCLUSIONS
The spectrophotometric method for the determination of clindamycin hydrochloride was optimized and validation of the same through validation parameters (selectivity, linearity, repeatability, detection limit and limit of quantification) was carried out. This method allows the analysis of the content of clindamycin hydrochloride in the extemporaneous formulations of 1% clindamycin lotion. The UV-Vis method does not require complicated preparation of the sample, and is therefore fast, reliable and economical, and as such can be used in regular control of the content of clindamycin hydrochloride in ex tempore prepared lotions. On the basis of the obtained results we can conclude that the content of clindamycin hydrochloride in the ex tempore prepared lotions varied from 21% to 142%. This proved justified preliminary control of the above preparations. Due to the large differences in the content of clindamycin, it is necessary to pay more attention when preparing the extemporaneous formulations. It is necessary to carry out further studies which will include all critical parameters of preparing of clindamycin lotion, starting from the quality of the active substance, the quality of all substances used in the formulation as well as possible influence other parameters (e.g., temperature, pH) which may affect the active ingredient, solvents and excipiens used in the formulation.
REFERENCES
Federalno ministarstvo zdravstva. (2008). "Zakon o lijekovima i medicinskim sredstvima, Službeni glasnik BiH: 58. 2008.".
Hadžović, S., Čatić, T. (2012). Formulae Magistrales, Farmaceutsko društvo Federacije Bosne i Hercegovine.
Mateja, R. (2015). "Vrednotenje stabilnosti klindamicina v vodnih raztopinah z metodo tekočinske kromatografije visoke ločljivosti." from <URL:http://www.ffa.unilj.si/fileadmin/datoteke/Knjiznica/diplome/2015/Rozmarin_Mateja_dipl_nal_2015.pdf>pristupljeno 02.12.2017.godine.
Mifsud, M., Vella, J., Ferrito, V., et al. (2014). A simple HPLC-UV method for the determination of clindamycin in human plasma. Journal of Chemical and Pharmaceutical Research, 6(1), 696-704.
Olbrich, J., Corbett, J. (2013). Development and Utilization of Reversed Phase High Performance Liquid Chromatography Methods for a Series of Therapeutic Agents. Mod Chem appl, 1:2.
Prakash, B. M., Nehal, J. S. (2014). Novel Stability-Indicating RP-HPLC Method for the Simultaneous Estimation of Clindamycin Phosphate and Adapalene along with Preservatives in Topical Gel Formulations. Sci Pharm, 82, 799–813.
Rajendar, L., Potnuri, N. R., Rao, N. (2015). A stability indicating RP-HPLC method for the simultaneous estimation of metronidazole, clindamycin and clotrimazole in bulk and their combined dosage form. World J Pharm Sci, 3(1), 93-103.
Rang, H.P., Dale, M. M., Ritter, J.M., Moore, P.K. (2005). Farmakologija, Beograd, Data status.
Rohit, H. K., Rashmin, B. P., Mrunali, R. P. (2014). A new RP-HPLC method for estimation of clindamycin and adapalene in gel formulation: development and validation consideration. TJPS, 38 (1), 44-48.
Stanković, M., Savić, V., Marinković, V. (2013). Determination of Clindamycin Phosphate in Different Vaginal Gel Formulations by Reverse Phase High Performance Liquid Chromatography. Acta Facultatis Medicinae Naissensis, 30(2), 63-71.
Tamaddon, L., Mostafavi, S. A. (2012). Development and validation of a new HPLC analytical method for the quality control of clindamycin capsules. Research in Pharmaceutical Sciences, 7(5).
Wang, Y., Kuo, S., Shu, M., et al. (2014 ). Staphylococcus epidermidis in the human skin microbiome mediates fermentation to inhibit the growth of Propionibacterium acnes: Implications of probiotics in acne vulgaris. Appl Microbiol Biotechnol, 98(1), 411–424.
Zaenglein, A. L. , Pathy, A. L., Schlosser, B. J., et al. (2016). Guidelines of care for the management of acne vulgaris. J Am Acad Dermatol.
Zhou, H., Zheng, Z., Wu, S., Tai, Y., Cao, X., Pan, Y. (2006). Separation and characterization of clindamycin and related impurities in bulk drug by high-performance liquid chromatography-electrospray tandem mass spectrometry. J Pharm Biomed Anal, 41, 1116-1123.
54 Dedić et al.
Summary/Sažetak
Klindamicin je širokospektralni antibiotik koji pripada grupi linkozamida. Najviše djeluje kao bakteriostatski antibiotik, ali
posjeduje i blago baktericidno djelovanje. Najčešća klinička stanja u kojima se koristi su: infekcije u ginekologiji, infekcije
gingive, respiratornog trakta, kože i mekog tkiva, intraabdominalne infekcije, pneumonia uzrokovana Pneumocystis jiroveci,
toksoplazmoza, malarija, babezioza, te akne. Klindamicin je dostupan u nekoliko farmaceutskih oblika, koji se mogu davati
oralno, intravenozno, intramuskularno ili dermalno. Na tržištu se najčešće priprema kao ex tempore 1% klindamicin losion
koji se koristi dermalno, u tretmanu blagog oblika akni. Predložena UV-Vis spektrofotometrijska metoda omogućava analizu
sadržaja klindamicin hidrohlorida u extemporaneousnom pripravku 1% klindamicin losionu. Analiza sadržaja klindamicin
hlorida se provela na uzorcima 1% klindamicin losiona kupljenih u apotekama u Kantonu Sarajevo. Rezultati su pokazali da
je sadržaj klindamicin hidrohlorida u ex tempore pripremljenim pripravcima varirao od 21- 142%. UV-Vis metoda ne
zahtjeva komplikovanu pripremu uzorka, te je s toga brza, pouzdana i ekonomična i kao takva se može koristiti u redovnoj
kontroli sadržaja klindamicin hidrohlorida u ex tempore pripremljenom losionu.
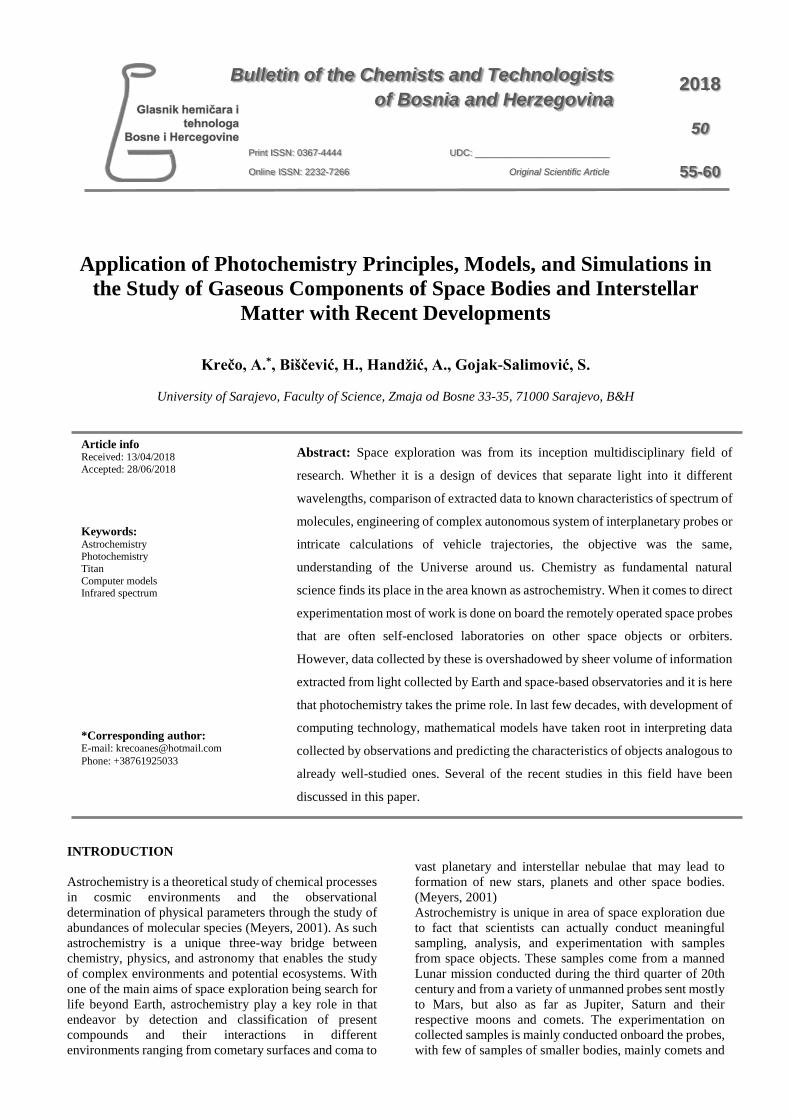
Application of Photochemistry Principles, Models, and Simulations in
the Study of Gaseous Components of Space Bodies and Interstellar Matter with Recent Developments
Krečo, A.*, Biščević, H., Handžić, A., Gojak-Salimović, S.
University of Sarajevo, Faculty of Science, Zmaja od Bosne 33-35, 71000 Sarajevo, B&H
INTRODUCTION Astrochemistry is a theoretical study of chemical processes in cosmic environments and the observational determination of physical parameters through the study of abundances of molecular species (Meyers, 2001). As such astrochemistry is a unique three-way bridge between chemistry, physics, and astronomy that enables the study of complex environments and potential ecosystems. With one of the main aims of space exploration being search for life beyond Earth, astrochemistry play a key role in that endeavor by detection and classification of present compounds and their interactions in different environments ranging from cometary surfaces and coma to
vast planetary and interstellar nebulae that may lead to formation of new stars, planets and other space bodies. (Meyers, 2001) Astrochemistry is unique in area of space exploration due to fact that scientists can actually conduct meaningful sampling, analysis, and experimentation with samples from space objects. These samples come from a manned Lunar mission conducted during the third quarter of 20th century and from a variety of unmanned probes sent mostly to Mars, but also as far as Jupiter, Saturn and their respective moons and comets. The experimentation on collected samples is mainly conducted onboard the probes, with few of samples of smaller bodies, mainly comets and
Bulletin of the Chemists and Technologists of Bosnia and Herzegovina
Print ISSN: 0367-4444
Online ISSN: 2232-7266
2018
50
55-60 UDC: __________________________
Original Scientific Article
Article info Received: 13/04/2018 Accepted: 28/06/2018 Keywords: Astrochemistry Photochemistry Titan Computer models Infrared spectrum
*Corresponding author: E-mail: [email protected] Phone: +38761925033
Abstract: Space exploration was from its inception multidisciplinary field of
research. Whether it is a design of devices that separate light into it different
wavelengths, comparison of extracted data to known characteristics of spectrum of
molecules, engineering of complex autonomous system of interplanetary probes or
intricate calculations of vehicle trajectories, the objective was the same,
understanding of the Universe around us. Chemistry as fundamental natural
science finds its place in the area known as astrochemistry. When it comes to direct
experimentation most of work is done on board the remotely operated space probes
that are often self-enclosed laboratories on other space objects or orbiters.
However, data collected by these is overshadowed by sheer volume of information
extracted from light collected by Earth and space-based observatories and it is here
that photochemistry takes the prime role. In last few decades, with development of
computing technology, mathematical models have taken root in interpreting data
collected by observations and predicting the characteristics of objects analogous to
already well-studied ones. Several of the recent studies in this field have been
discussed in this paper.
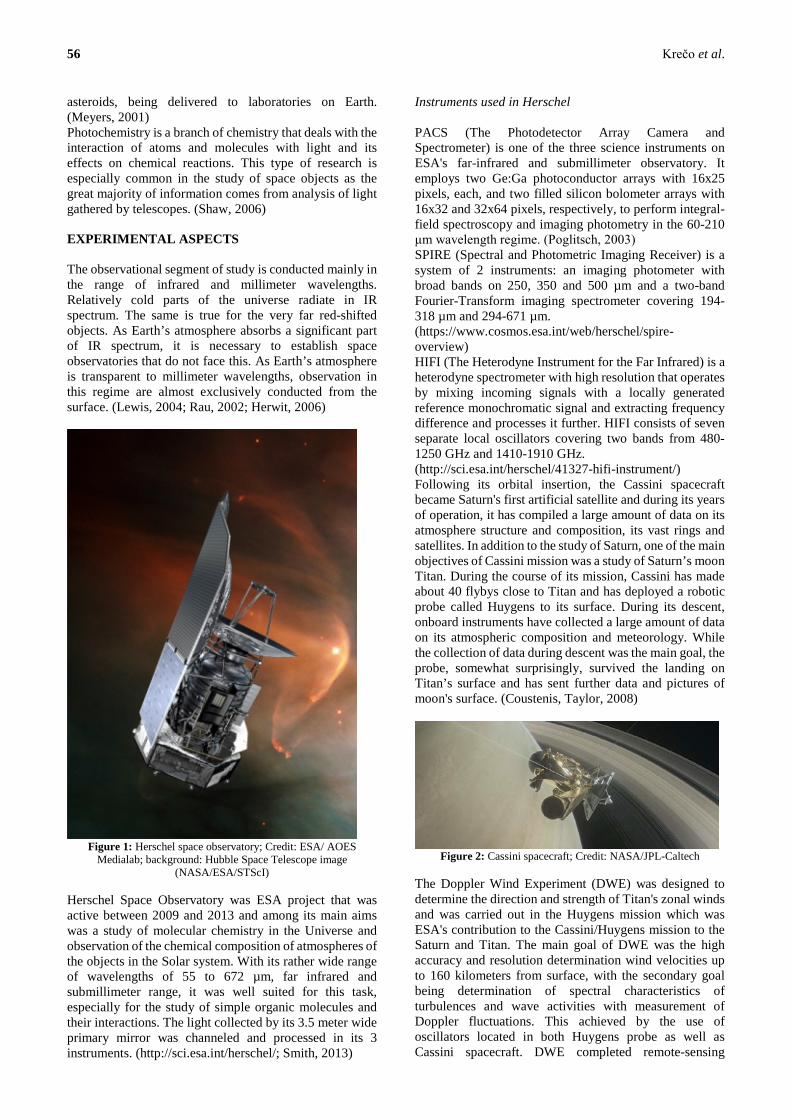
56 Krečo et al.
asteroids, being delivered to laboratories on Earth. (Meyers, 2001) Photochemistry is a branch of chemistry that deals with the interaction of atoms and molecules with light and its effects on chemical reactions. This type of research is especially common in the study of space objects as the great majority of information comes from analysis of light gathered by telescopes. (Shaw, 2006) EXPERIMENTAL ASPECTS The observational segment of study is conducted mainly in the range of infrared and millimeter wavelengths. Relatively cold parts of the universe radiate in IR spectrum. The same is true for the very far red-shifted objects. As Earth’s atmosphere absorbs a significant part of IR spectrum, it is necessary to establish space observatories that do not face this. As Earth’s atmosphere is transparent to millimeter wavelengths, observation in this regime are almost exclusively conducted from the surface. (Lewis, 2004; Rau, 2002; Herwit, 2006)
Figure 1: Herschel space observatory; Credit: ESA/ AOES
Medialab; background: Hubble Space Telescope image (NASA/ESA/STScI)
Herschel Space Observatory was ESA project that was active between 2009 and 2013 and among its main aims was a study of molecular chemistry in the Universe and observation of the chemical composition of atmospheres of the objects in the Solar system. With its rather wide range of wavelengths of 55 to 672 µm, far infrared and submillimeter range, it was well suited for this task, especially for the study of simple organic molecules and their interactions. The light collected by its 3.5 meter wide primary mirror was channeled and processed in its 3 instruments. (http://sci.esa.int/herschel/; Smith, 2013)
Instruments used in Herschel PACS (The Photodetector Array Camera and Spectrometer) is one of the three science instruments on ESA's far-infrared and submillimeter observatory. It employs two Ge:Ga photoconductor arrays with 16x25 pixels, each, and two filled silicon bolometer arrays with 16x32 and 32x64 pixels, respectively, to perform integral-field spectroscopy and imaging photometry in the 60-210 μm wavelength regime. (Poglitsch, 2003) SPIRE (Spectral and Photometric Imaging Receiver) is a system of 2 instruments: an imaging photometer with broad bands on 250, 350 and 500 µm and a two-band Fourier-Transform imaging spectrometer covering 194-318 µm and 294-671 µm. (https://www.cosmos.esa.int/web/herschel/spire-overview) HIFI (The Heterodyne Instrument for the Far Infrared) is a heterodyne spectrometer with high resolution that operates by mixing incoming signals with a locally generated reference monochromatic signal and extracting frequency difference and processes it further. HIFI consists of seven separate local oscillators covering two bands from 480-1250 GHz and 1410-1910 GHz. (http://sci.esa.int/herschel/41327-hifi-instrument/) Following its orbital insertion, the Cassini spacecraft became Saturn's first artificial satellite and during its years of operation, it has compiled a large amount of data on its atmosphere structure and composition, its vast rings and satellites. In addition to the study of Saturn, one of the main objectives of Cassini mission was a study of Saturn’s moon Titan. During the course of its mission, Cassini has made about 40 flybys close to Titan and has deployed a robotic probe called Huygens to its surface. During its descent, onboard instruments have collected a large amount of data on its atmospheric composition and meteorology. While the collection of data during descent was the main goal, the probe, somewhat surprisingly, survived the landing on Titan’s surface and has sent further data and pictures of moon's surface. (Coustenis, Taylor, 2008)
Figure 2: Cassini spacecraft; Credit: NASA/JPL-Caltech
The Doppler Wind Experiment (DWE) was designed to determine the direction and strength of Titan's zonal winds and was carried out in the Huygens mission which was ESA's contribution to the Cassini/Huygens mission to the Saturn and Titan. The main goal of DWE was the high accuracy and resolution determination wind velocities up to 160 kilometers from surface, with the secondary goal being determination of spectral characteristics of turbulences and wave activities with measurement of Doppler fluctuations. This achieved by the use of oscillators located in both Huygens probe as well as Cassini spacecraft. DWE completed remote-sensing

Bulletin of the Chemists and Technologists of Bosnia and Herzegovina 2018, 50, 55-60 57
observations of temperature and wind from Cassini Orbiter providing us with information about zonal wind using Composite Infrared Spectrometer (CIRS) experiment. (http://sci.esa.int/cassini-huygens/31193-instruments/?fbodylongid=735)
Figure 3: Huygens probe; Credit: Credit: ESA
The largest and probably most well-known and productive millimeter/submillimeter regime observatory is the astronomical interferometer complex located in the Atacama Desert in Chile, the Atacama Large Millimeter/submillimeter Array or ALMA, constructed and operated by European Southern Observatory and National Radio Astronomy Observatory. Among most significant discoveries made by ALMA was the detection of molecules of water, ammonia and methanol in interstellar space that was previously thought to be almost exclusively hydrogen and dust. It is now shown that molecules can be created in reaction to dust grains that can lead to further reactions to form more complex organic compounds. (http://www.almaobservatory.org)
DISCUSSION FOR SOME SPACE BODIES
Atmospheres of space bodies significantly vary depending on type and size of the object, its location relative to its parent star as well as its evolution. Generally, the majority of atmospheric masses are simple molecules, with more complex ones and noble gases being present in traces. However, as each molecule has its unique fingerprint in the electromagnetic spectrum, mostly in IR and submillimeter range, it is possible with instruments of sufficient sensitivity to detect these patterns and therefore to some extent deduce the atmospheric compositions. Comets are objects that are made up of nucleus and coma. The nucleus is composed of mostly rocks, frozen water and gases such as carbon oxides, methane and ammonia and are also shown to contain various organic compounds such as simple hydrocarbons, alcohols, and aldehydes. Comets in Solar system mostly follow highly eccentric orbits around Sun and once they approach it the frozen and trapped gases and dust are released forming cometary coma that reflects Sun’s light. As comets albedo (amount of light reflected by an object) is quite small they are mostly visible only when vast clouds of coma are formed, that are also known as comet’s tail. The very fact that
cometary albedo is small was deduced to be due to the presence of organic molecules on cometary nucleus surfaces (Morison, 2008). Venus is a second planet from the Sun, it is similar in size to Earth but quite different in atmospheric aspects, mainly due to the fact that it is composed of carbon dioxide, small amount of nitrogen with other gases mostly in trace amounts, such as nitrogen oxides, and sulfur dioxide for which the content is shown to significantly vary in relation to the location and time which is presumed to be due to volcanic activity. Its atmosphere is 93 times larger in mass than Earth's which leads to surface pressure to be over 92 bar. It is also presumed that atmospheric and meteorological factors can lead to rains of acid in the upper atmosphere which however cannot reach the surface in the liquid form due to the high surface temperatures of over 730 K (Morison, 2008). While Saturn is one of the most spectacular views through the telescope, it is no less interesting in a scientific sense. It is a gas giant positioned as a sixth planet from the Sun and it is shown that it is composed mostly of molecular hydrogen and helium, with smaller percentages of simple organic molecules like methane, ammonia, etc. (Morison, 2008) Titan, as the largest moon of Saturn, was for a long time target of many observations and studies, with most recent being Cassini-Huygens mission robotic mission. Studies have shown that Titan’s atmosphere contains a significant amount of organic molecules including hydrocarbons and nitriles, generally considered to be created from methane and nitrogen contained in the Titan’s atmosphere. Cassini-Huygens is instrumental in these discoveries with providing a large amount of data regarding chemistry in the atmosphere and Titan’s seasonal characteristics. Titan’s atmosphere is not in the chemical equilibrium, in fact it is a chemical factory that initiates the formation of significant amounts of complex positive and negative ions, UV radiation, energetic ions, and electrons. (Coustenis, Taylor, 2008; Elkins-Tanton, 2006; Gargaud, Amils, Quintanilla, et al., 2006; Coustenis, 2016)
RECENT DEVELOPMENTS IN PHOTOCHEMISTRY
In recent years, a lot of research has been done on photochemical models of Titan's atmosphere. That is because of the feature of Titan to be the only moon in the solar system to have a dense atmosphere. In designing these models, researchers are trying to learn more about the composition of the atmosphere and that data can be used to investigate hazy exoplanets detected by telescopic surveys. Lara et al. (2014) made a time-dependent photochemical model of Titan’s atmosphere to calculate effective lifetimes and the response of Titan’s oxygen compounds to changes in the oxygen input flux. Hickson et al. (2014) made a detailed photochemical model of sulfur compounds in the Titan's atmosphere. These connect hydrocarbon, nitrogen, oxygen, and sulfur chemistries. The results mostly concern the substances that are produced in a specific part of the atmosphere. In the upper Titan's atmosphere, photochemical processes produce mainly CS and H2CS and C3S, H2S and in the lower atmosphere
58 Krečo et al.
CH3SH. Having modeled the atmosphere content, other data about detected exoplanets can be extrapolated by referencing known variables. This is quite useful as most current telescopes do have sufficient strength to resolve subtle characteristics. This is expected to change with the deployment of James Webb Space telescope that is designed to study, among others, atmospheric characteristics and possibly direct imaging of exoplanets that should be an excellent test for current models and the basis for corrections and improvements. Regarding simulation, Titan's photochemistry of atmosphere was simulated using infrared analysis (Couturier-Tamburelli et al., 2015). They came to a result that in Titan’s atmosphere, the cyanoacetylene class of molecules would condense first, followed by the dicyanoacetylenes which leads to fractionation of different class of molecules. Titan is uniquely useful in photochemical research as large amount data about it has been obtained by Cassini orbiter and Huygens Lander. Also, there was an attempt to construct a numerical model of Titan's atmosphere (Zhu, Strobel, 2007). It gives an insight into some of the physical characteristics concerning transport and photochemistry of Titan. It also stimulates further research that could enrich the observations by Voyager and Cassini spacecraft. Similarly, other planets' atmospheres are modeled. Some researchers tried to model specific compounds that atmosphere contains in order to study it deeper. Mills et al. (2011) were working on a photochemical model of NOx on Venus. These were preliminary simulations that resulted in the conclusion that odd nitrogen chemistry has significant effects on specific aspects of SO and SO2 abundances at 80-90 km altitude, but the overall effects from the observed NO abundance are small. It is left for further research to investigate other situations where odd nitrogen chemistry could have more influence as well as additional measurement of NO on Venus. The pseudo 2D chemical model was made by Agúndez et al. (2013) and applied to exoplanets HD 209458b and HD 189733b. Chemical model in this situation is very useful because hot Jupiters do not have an analogue in our solar system so a model provides an insight into their atmospheres. Other reason is that there is a lot of hot Jupiter exoplanets discovered, but very little is known about them. During modeling, thermochemical kinetics, photochemistry, vertical mixing, and horizontal transport were considered. Sub-millimeter spectroscopy was used to investigate trace gas composition of Saturn's atmosphere (Fletcher et al., 2011). Specifically, the method used was Fourier transform spectroscopy from the Herschel/SPIRE (Spectral and Photometric Imaging Receiver) instrument. The data were compared for consistency with Cassini data. They came to several results. Saturn's disk is quasi-isothermal. Also, there is a certain amount of research dedicated to the interstellar medium and different methods are used. One of them is of Paardekooper et al. (2016) in which a new measurement concept is presented for determining photodesorption rates. These are used to quantify the role that light has on the content of gas and solid stateparticles in nebulae. It was demonstrated on CO ice and the result was that photodesorption rate of CO ice at 20 K is (1.4±0.7)10-3 molecules per incident vacuum ultraviolet (VUV) photon. As it is well established that CO often is
present in significant amounts in nebulae, it was useful for testing in laboratory conditions as it is quite easy to manipulate. The studies were conducted mostly with IR and mass spectrometry-based methods. The measurements made can be used to make a model for comparing the photodesorption rates of CO extrapolated from astronomical data with a model to ascertain the content of the observed area of space. Other method is chemical modeling. Example of such research is reported by Bovino et al. (2016) where three-dimensional hydrodynamic simulations of galaxies were made in order to test effects of key parameters such as metallicity, radiation, and non-equilibrium versus equilibrium metal cooling approximations on the transition between the gas phases in the interstellar medium by using a public chemistry package KROME. Considering very detailed work involving a very broad range of temperatures used in the model including cooling functions, heating and photochemical processes relevant for the study under investigation, it can be concluded that complete model and simulation was designed useful for applications in examining galaxies in the future which was also one of the aims of this research. Use of mathematics and computers in research is more and more frequent in past years to either help in solving scientific problems or give different perspective to problems in question. That is also the case for photochemistry and we reference to this field of study as computational photochemistry. Ziegler (2015) worked on magneto-gasdynamical simulations implemented using NIRVANA code. It is done by constructing a partial differential equation that describes the chemical kinetics, separating advection and reaction part of the process using second-order Strang-splitting and solving a correspondent system of ordinary differential equation using fourth-order generalised Runge-Kutta method. Proper validations and tests were carried out and it was assured that time-dependent simulation that was done is adequate to successfully handle astrochemical processes. More specific research was done by Bisikalo et al. (2014) in which Monte Carlo simulation was used in order to model oxygen photochemistry in cometary atmospheres. Metastable O(1D) and O(1S) species was considered by computing the energy distribution functions (EDF) and red and green spectral line shapes were obtained. The model is tested on the atmospheres of comets C/1996 B2, Hyakutake and 103P/Hartley 2. The result was that both species investigated had a severely non-Maxwellian EDF which led to broad spectral lines and the suprathermal broadening dominates due to the expansion motion. CONCLUSIONS Creation of credible models in astrochemistry and the increasing viability was and is still being fueled by advancements in computer technology and accumulation of data from observations and direct or indirect experiments that are being incorporated in existing models with the aim of improving the end results. As analysis of chemical composition and content of distant objects is very difficult, due to limitations in available instruments, and often yields results of insufficient accuracy, it is possible
Bulletin of the Chemists and Technologists of Bosnia and Herzegovina 2018, 50, 55-60 59
to use data obtained from well studies objects to construct models of environments which in turn can be used to extrapolate information about objects whose basic characteristics are analogous to known ones. Computer modeling while accurate in its execution of algorithms, is significantly limited by a large number of variables that are difficult to accurately model and therefore existing frameworks are continuously being updated as new data available.
REFERENCES
Agúndez, M., Parmentier, V., Venot, O., Hersant, F., Selsis, F. (2014). Pseudo 2D chemical model of hot-Jupiter atmospheres: application to HD 209458b and HD 189733b. Astronomy and Astrophysics, 564.
Bisikalo, D.V., Shematovich, V.I., Gerard, J.C., Jehin E., Decock, A., Hutsemekers, D., Manfroid, J., Hubert, B. (2014). Monte carlo simulation of metastable oxygen photochemistry in cometary atmospheres. The Astrophysical Journal, 798, 21.
Bovino, S., Grassi, T., Capelo, P.R., Schleicher, D.R. G., Banerjee, R. (2016). A chemical model for the interstellar medium in galaxies. Astronomy and Astrophysics, 590.
Coustenis, A. (2016). Titan’s organic chemistrya planetary-scale laboratory to study primitive Earth. MÈTODE Science Studies Journal, 6.
Coustenis, A., Taylor, F.W. (2008). Titan Exploring an Earthlike World. (2nd Ed.) World Scientific Publishing Co. Pte. Ltd.
Couturier-Tamburelli, I., Piétri, I., Gudipati, M.S. (2015). Simulation of Titan’s atmospheric photochemistry - Formation of non-volatile residue from polar nitrile ices. Astronomy and Astrophysics, 578.
Elkins-Tanton, L.T. (2006). Jupiter and Saturn. Infobase Publishing.
Fletcher, L.N., Swinyard, B., Salji, C., Polehampton, E., Fulton, T., Sidher, S., Lellouch, E., Moreno, R., Orton, G., Cavalié, T., Courtin, R., Rengel, M., Sagawa, H., Davis, G.R., Hartogh, P., Naylor, D., Walker, H., Lim, T. (2011). Sub-millimetre spectroscopy of Saturn’s trace gases from Herschel/SPIRE. Astronomy and Astrophysics, 539.
Gargaud, M., Amils, R., Quintanilla, J.C., Cleaves, H.J., Irvine, W.M., Pinti, D.L., Viso, M. (2001). Encyclopedia of Astrobiology. Springer-Verlag Berlin Heidelberg. Harwit, M. (2006). Astrophysical Concepts. (4th Ed.) Springer Science+Business Media, LLC.
Hickson, K.M., Loison, J.C., Cavalié, T., Hébrard, E., Dobrijevic, M. (2014). The evolution of infalling sulfur species in Titan’s atmosphere. Astronomy and Astrophysics, 572.
http://sci.esa.int/cassini-huygens/31193-instruments/?fbodylongid=735 (03/04/2018).
http://sci.esa.int/herschel/ (02/04/2018). http://sci.esa.int/herschel/41327-hifi-instrument/
(03/04/2018). http://www.almaobservatory.org (02/04/2018). Lara, L.M., Lellouch, E., González, M., Moreno, R.,
Rengel, M. (2014). A time-dependent photochemical model for Titan’s atmosphere and the origin of H2O. Astronomy and Astrophysics, 566.
Lewis, J.S. (2004). Physics and Chemistry of the Solar System. (2nd Ed.), Elsevier Academic Press.
Meyers, R. (2001). Encyclopedia of Physical Science and Technology-Astronomy. (3rd Ed.) Academic Press.
Mills. F.P., Sundaram Shunmuga, M., Allen, M., Yung, Y.L. (2011). Preliminary modelling of NOx photochemistry on Venus. EPSC Abstracts. Vol. 6, EPSC-DPS Joint Meeting 2011.
Morison, I. (2008). Introduction to Astronomy and Cosmology. John Wiley & Sons.
Paardekooper, D.M., Fedoseev, G., Riedo, A., Linnartz, H. (2016). A novel approach to measure photo desorption rates of interstellar ice analogues - The photo desorption rate of CO ice reinvestigated. Astronomy and Astrophysics, 596.
Poglitsch, A., Waelkens, C., Bauer, O., Cepa, J., Feuchtgruber, H., Henning, T., Van Hoof, C., Kerschbaum, F., Lemke, D., Renotte, E., Rodriguez, L., Saraceno, P., Vandenbussche, B. (2003). The Photodetector Array Camera and Spectrometer (PACS) for the Herschel Space Observatory. Proceedings of SPIE - The International Society for Optical Engineering.
Rau, A.R.P. (2002). Astronomy-inspired atomic and molecular physics. Kluwer Academic Publishers.
Shaw, A. M. (2006). Astrochemistry from Astronomy to Astrobiology. John Wiley & Sons Ltd.
Smith, I.W.M., Cockell, C.S., Leach, S. (2013). Astrochemistry and Astrobiology. Springer-Verlag Berlin Heidelberg.
Zhu, X., Strobel, D.F. (2007). Numerical modeling of transport and photochemistry of Titan's atmosphere. Workshop on Planetary Atmospheres, Johns Hopkins University.
Ziegler, U. (2015). A chemical reaction network solver for the astrophysics code NIRVANA. Astronomy and Astrophysics, 586.
60 Krečo et al.
Summary/Sažetak
Istraživanje svemira je od svog početka bilo multidisciplinarno područje istraživanja. Bilo da je u pitanju dizajn uređaja koji
razdvajaju svjetlost na različite talasne dužine, usporedba dobivenih podataka s poznatim karakteristikama spektra molekula,
inženjering kompleksnih autonomnih sistema međuplanetarnih sondi ili složenih proračuna putanja letjelica, cilj je bio isti,
razumijevanje svemira oko nas. Hemija kao fundamentalna prirodna nauka pronalazi svoje mjesto u području poznatom kao
astrohemija. Kada je u pitanju izravno eksperimentiranje, većina istraživanja se obavlja na daljinski upravljanim sondama,
koje su često zatvorene laboratorije na drugim svemirskim objektima, ili orbiterima. Međutim, ovako prikupljeni podaci su
zasjenjeni količinom informacija prikupljenih analizom svjetlosti koju su sakupljale opservatorije bazirane na Zemlji ili van
nje, a ovdje fotohemija igra važnu ulogu. U posljednjih nekoliko decenija, s razvojem računarske tehnologije, matematički
modeli su uzeli korijen u tumačenju podataka prikupljenih promatranjima i predviđanjem karakteristika analognih objekata
koji su već dobro proučeni. U ovom radu su razmatrana nedavna istraživanja iz ovog područja.
Na osnovu člana 18. Zakona o udruženjima i fondacijama ("Službene novine
Federacije BiH", broj 45/02), i člana 19. Statuta Udruženja "Društvo kemičara i
tehnologa Kantona Sarajevo" Skupština Društva na sjednici održanoj dana
23.02.2017. godine donijela je
ODLUKU
o razrješenju i imenovanju lica za zastupanje i predstavljanje
Član 1.
Razrješavaju se dužnosti lica za zastupanje i predstavljanje udruženja „Društvo
kemičara i tehnologa Kantona Sarajevo“:
1. Edhem Mulaosmanović, predsjednik Društva
2. Jelena Ostojić, član Upravnog odbora
3. Sabina Begić, član Upravnog odbora
Član 2.
Imenuju se lica za zastupanje i predstavljanje udruženja „Društvo kemičara i
tehnologa Kantona Sarajevo“:
1. Lejla Klepo, Predsjednik društva
2. Almir Olovčić, član Upravnog odbora
3. Sabina Begić, član Upravnog odbora
Član 3.
Izabrana lica za zastupanje i predstavljanje su po članu 7. Statuta Udruženja DKTKS
predsjednik Društva i dva odabrana člana Upravnog odbora. Mandat lica za
zastupanje i predstavljanje traje 2 godine.
Član 4.
Ova odluka stupa na snagu danom donošenja, a objavit će se u glasilu Društva.
Broj: P-01/17 Predsjednik Skupštine
23.02.2017.g
Sarajevo Šaćira Mandal

Na osnovu člana 18. Zakona o udruženjima i fondacijama ("Službene novine
Federacije BiH", broj 45/02), i člana 19. Statuta Udruženja "Društvo kemičara i
tehnologa Kantona Sarajevo" Skupština Društva na sjednici održanoj dana
23.02.2017. godine donijela je
ODLUKU O RAZRJEŠENJU PREDSJEDNIKA I ČLANOVA
Upravnog Odbora
Udruženja - Društvo kemičara i tehnologa Kantona Sarajevo
Član 1.
Razrješavaju se dužnosti članovi Upravnog odbora udruženja „Društvo kemičara i
tehnologa Kantona Sarajevo“:
1. Edhem Mulaosmanović, predsjednik
2. Almir Olovčić, potpredsjednik
3. Jelena Ostojić, sekretar
4. Sabina Begić, blagajnik
5. Safija Herenda, urednik glasila
6. Dragan Krešić, član
7. Emina Ramić, član
Član 2.
Ova odluka stupa na snagu danom donošenja, a objavit će se u glasilu Društva.
Broj: P-02-1/17 Predsjednik Skupštine
23.02.2017.g
Sarajevo Šaćira Mandal

Na osnovu člana 18. Zakona o udruženjima i fondacijama ("Službene novine
Federacije BiH", broj 45/02), i člana 19. Statuta Udruženja "Društvo kemičara i
tehnologa Kantona Sarajevo" Skupština Društva na sjednici održanoj dana
23.02.2017. godine donijela je
ODLUKU O RAZRJEŠENJU ČLANOVA
Nadzornog Odbora
Udruženja - Društvo kemičara i tehnologa Kantona Sarajevo
Član 1.
Razrješavaju se dužnosti članovi Nadzornog odbora udruženja „Društvo kemičara i
tehnologa Kantona Sarajevo“:
1. Aida Šapčanin, predsjednik
2. Hajrudin Hajdar, član
3. Jozo Ćorić, član
Član 2.
Ova odluka stupa na snagu danom donošenja, a objavit će se u glasilu Društva.
Broj: P-02-2/17 Predsjednik Skupštine
23.02.2017.g
Sarajevo Šaćira Mandal


Na osnovu člana 18. Zakona o udruženjima i fondacijama ("Službene novine
Federacije BiH", broj 45/02), i člana 19. Statuta Udruženja "Društvo kemičara i
tehnologa Kantona Sarajevo" Skupština Društva na sjednici održanoj dana
23.02.2017. godine donijela je
ODLUKU O RAZRJEŠENJU ČLANOVA
Suda časti
Udruženja - Društvo kemičara i tehnologa Kantona Sarajevo
Član 1.
Razrješavaju se dužnosti članovi Suda časti udruženja „Društvo kemičara i tehnologa
Kantona Sarajevo“:
1. Faiza Muštović-Biščević, član
2. Ismet Tahirović, član
3. Borivoj Galić, član
4. Nurudin Avdić, član
5. Mirza Nuhanović, član
Član 2.
Ova odluka stupa na snagu danom donošenja, a objavit će se u glasilu Društva.
Broj: P-02-3/17 Predsjednik Skupštine
23.02.2017.g
Sarajevo Šaćira Mandal


Na osnovu člana 18. Zakona o udruženjima i fondacijama ("Službene novine
Federacije BiH", broj 45/02), i člana 19. Statuta Udruženja "Društvo kemičara i
tehnologa Kantona Sarajevo" Skupština Društva na sjednici održanoj dana
23.02.2017. godine donijela je
ODLUKU O RAZRJEŠENJU PREDSJEDNIKA,
POTPREDSJEDNIKA I GLAVNOG UREDNIKA DRUŠTVENIH
GLASILA
Skupštine Udruženja - Društvo kemičara i tehnologa Kantona
Sarajevo
Član 1.
Razrješavaju se dužnosti predsjednik, potpredsjednik i glavni urednik društvenih
glasila Skupštine udruženja „Društvo kemičara i tehnologa Kantona Sarajevo“
imenuju se:
1. Mustafa Memić, predsjednik
2. Šaćira Mandal, potpredsjednik
3. Fehim Korać, glavni urednik društvenih glasila
Član 2.
Ova odluka stupa na snagu danom donošenja, a objavit će se u glasilu Društva.
Broj: P-02-4/17 Predsjednik Skupštine
23.02.2017.g
Sarajevo Šaćira Mandal

Na osnovu člana 18. Zakona o udruženjima i fondacijama ("Službene novine
Federacije BiH", broj 45/02), i člana 19. Statuta Udruženja "Društvo kemičara i
tehnologa Kantona Sarajevo" Skupština Društva na sjednici održanoj dana
23.02.2017. godine donijela je
ODLUKU O IMENOVANJU ČLANOVA
Skupštine Udruženja - Društvo kemičara i tehnologa Kantona
Sarajevo
Član 1.
U Skupštinu udruženja „Društvo kemičara i tehnologa Kantona Sarajevo“ imenuju se:
1. Šaćira Mandal, predsjednik Skupštine
2. Edhem Mulaosmanović, zamjenik predsjednika Skupštine
3. Fehim Korać, glavni i odgovorni urednik društvenih glasila
Član 2.
Izabrani članovi Skupštine Udruženja su postali kandidati sa najvećim brojem
glasova. Mandat članova Skupštine traje 2 godine.
Član 3.
Ova odluka stupa na snagu danom donošenja, a objavit će se u glasilu Društva.
Broj: P-03/17 Predsjednik Skupštine
23.02.2017.g
Sarajevo Šaćira Mandal


Na osnovu člana 18. Zakona o udruženjima i fondacijama ("Službene novine
Federacije BiH", broj 45/02), i člana 19. Statuta Udruženja "Društvo kemičara i
tehnologa Kantona Sarajevo" Skupština Društva na sjednici održanoj dana
23.02.2017. godine donijela je
ODLUKU O IMENOVANJU PREDSJEDNIKA I ČLANOVA
Upravnog Odbora
Udruženja - Društvo kemičara i tehnologa Kantona Sarajevo
Član 1.
U Upravni odbor udruženja „Društvo kemičara i tehnologa Kantona Sarajevo“
imenuju se:
1. Lejla Klepo, predsjednik
2. Dragan Krešić, potpredsjednik
3. Almir Olovčić, sekretar
4. Sabina Begić, blagajnik
5. Safija Herenda, urednik glasila
6. Mirel Subašić, član
7. Anes Krečo, član
Član 2.
Izabrani članovi Upravnog odbora Udruženja su postali kandidati sa najvećim brojem
glasova. Mandat članova Upravnog odbora traje 2 godine.
Član 3.
Ova odluka stupa na snagu danom donošenja, a objavit će se u glasilu Društva.
Broj: P-04/17 Predsjednik Skupštine
23.02.2017.g
Sarajevo Šaćira Mandal

Na osnovu člana 18. Zakona o udruženjima i fondacijama ("Službene novine
Federacije BiH", broj 45/02), i člana 19. Statuta Udruženja "Društvo kemičara i
tehnologa Kantona Sarajevo" Skupština Društva na sjednici održanoj dana
23.02.2017. godine donijela je
ODLUKU O IMENOVANJU PREDSJEDNIKA I ČLANOVA
Nadzornog Odbora
Udruženja - Društvo kemičara i tehnologa Kantona Sarajevo
Član 1.
U Nadzorni odbor udruženja „Društvo kemičara i tehnologa Kantona Sarajevo“
imenuju se:
1. Nevzeta Ljubijankić, predsjednik
2. Mustafa Memić, član
3. Nermina Korać, član
Član 2.
Izabrani članovi Nadzornog odbora Udruženja su postali kandidati sa najvećim
brojem glasova. Mandat članova Nadzornog odbora traje 2 godine.
Član 3.
Ova odluka stupa na snagu danom donošenja, a objavit će se u glasilu Društva.
Broj: P-05/17 Predsjednik Skupštine
23.02.2017.g
Sarajevo Šaćira Mandal

Na osnovu člana 18. Zakona o udruženjima i fondacijama ("Službene novine
Federacije BiH", broj 45/02), i člana 19. Statuta Udruženja "Društvo kemičara i
tehnologa Kantona Sarajevo" Skupština Društva na sjednici održanoj dana
23.02.2017. godine donijela je
ODLUKU O IMENOVANJU ČLANOVA
Suda časti
Udruženja - Društvo kemičara i tehnologa Kantona Sarajevo
Član 1.
U Sud časti udruženja „Društvo kemičara i tehnologa Kantona Sarajevo“ imenuju se:
1. Nurudin Avdić, član
2. Milka Maksimović, član
3. Meliha Zejnilagić Hajrić, član
Član 2.
Izabrani članovi Suda časti postali su kandidati sa najvećim brojem glasova. Mandat
članova Suda časti traje 2 godine.
Član 3.
Ova odluka stupa na snagu danom donošenja, a objavit će se u glasilu Društva.
Broj: P-06/17 Predsjednik Skupštine
23.02.2017.g
Sarajevo Šaćira Mandal

Na osnovu člana 2. I 19. Zakona o udruženjima i fondacijama ("Službene novine
Federacije BiH", broj 45/02), i člana 34. i 48. Statuta Udruženja "Društvo kemičara i
tehnologa Kantona Sarajevo" Upravni odbor Društva na elektronskoj sjednici
održanoj 27.04.2017. godine donijelo je
ODLUKU O FINANSIRANJU STUDENATA ZA UČEŠĆE NA
MANIFESTACIJI „44. PRIMATIJADA“
Član 1.
Upravni odbor Društva na 1. elektronskoj sjednici održanoj 27.04.2017. godine
donijelo je odluku da finansira učešće studenata Odsjeka za hemiju, Prirodno-
matematičkog fakulteta na „44. Primatijadi“ koja se odžava u Čanju, Crna Gora. U
svrhu povezivanja studenata PMF-a sa studentima iz regiona kao i pomociji nauke,
Društvo je finansiralo učešće studenata Odsjeka za hemiju sa iznosom od 500,00
eura.
Član 2.
Ova odluka stupa na snagu danom donošenja, a objavit će se u glasilu Društva.
Broj: P-07/17 Predsjednik Društva
27.04.2017.g
Sarajevo Lejla Klepo

81 Bulletin of the Chemists and Technologists of Bosnia and Herzegovina
INSTRUCTIONS FOR AUTHORS
GENERAL INFORMATION
Bulletin of the Chemists and Technologists of Bosnia and Herzegovina (Glasnik hemičara i tehnologa Bosne i Hercegovine) is a semiannual international journal publishing papers from all fields of chemistry and related disciplines.
Categories of Contributions 1. Original Scientific Papers – (about 10 typewritten pages) report original research
which has not been published previously, except in a preliminary form. The papershould contain all the necessary information to enable reproducibility of thedescribed work.
2. Short Communications – (about 5 typewritten pages) describing work that may beof a preliminary nature but which merits immediate publication.
3. Notes – (about 3 typewritten pages) report unpublished results of short, butcomplete, original research or describe original laboratory techniques.
4. Reviews – (about 30 typewritten pages) present a concise and critical survey of aspecific research area. Generally, these are prepared by the invitation of theEditor.
5. Book and Web Site Reviews – (about 2 typewritten pages).6. Extended Abstracts – (about 2 typewritten pages) of Lectures given at
international meetings.7. Technical Papers – (about 10 typewritten pages) report on applications of an
already described innovation. Typically, technical articles are not based on newexperiments.
Reviewing the Manuscript All contributors are evaluated according to the criteria of originality and quality of
their scientific content, and only those deemed worthy will be accepted for publication. To facilitate the reviewing process, authors are encouraged to suggest three persons competent to review their manuscript. Such suggestions will be taken into consideration but not always accepted. The Editor-In-Chief and Editors have the right to decline formal review of a manuscript when it is deemed that the manuscript is:
1. on a topic outside the scope of the Journal;2. lacking technical merit;3. of insufficient novelty for a wide international readership;4. fragmentary and providing marginally incremental results; or5. is poorly written.
82
Bulletin of the Chemists and Technologists of Bosnia and Herzegovina
Proofs When a manuscript is ready for printing, the corresponding author will receive a
PDF-formatted manuscript for proof reading, which should be returned to the journal within one week. Failure to do so will be taken as the authors are in agreement with any alteration which may have occurred during the preparation of the manuscript. Copyright
Subscribers may reproduce tables of contents or prepare lists of articles including abstracts for internal circulation within their institutions. Permission of the Publisher is required for resale or distribution outside the institution and for all other derivative works, including compilations and translations. Professional Ethics and Publication Policy
The journal expects the Editors, Referees and authors to adhere to the well-known standards of professional ethics. Authors are responsible for the factual accuracy of their contributions. Submission of the paper commits the author not to submit the same material elsewhere. Referees should act promptly. If certain circumstances preclude prompt attention to the manuscript at the time it is received, the non-received manuscript should be returned immediately to the Editor or the Referee should contact the Editor for possible delay of the report submission date. The Editor accepts full responsibility for his decisions on the manuscripts. PREPARATION AND SUBMISSION OF MANUSCRIPT Cover Letter
Manuscripts must be accompanied by a cover letter in which the type of the submitted manuscript. It should contain:
1. full name(s) of the author(s), 2. mailing address (address, phone and fax numbers, e-mail) of the author to whom
correspondence should be addressed, 3. title of the paper (concise, without any abbreviations), 4. type of contribution, 5. a statement that the article is original and is currently not under consideration by
any other journal or any other medium, including preprints, electronic journals and computer databases in the public domain, and
6. the names, full affiliation (department, institution, city and country), and 7. e-mail addresses of three potential Referees. Contributors from Bosnia and Herzegovina should provide the name and full
affiliation of at least one Referee from abroad. Authors are fully encouraged to use Cover Letter Template.
83 Bulletin of the Chemists and Technologists of Bosnia and Herzegovina
Manuscript preparation
The submitted articles must be prepared with Word for Windows. Manuscripts should be typed in English (either standard British or American English, but consistent throughout) with 1.5 spacing (12 points Times New Roman; Greek letters in the character font Symbol) in A4 format leaving 2.5 cm for margins. Authors are fully encouraged to use Manuscript Template.
All contributions should be written in a style that addresses a wider audience than papers in more specialized journals. Manuscripts with grammar or vocabulary deficiencies are disadvantaged during the scientific review process and, even if accepted, may be returned to the author to be rewritten in idiomatic English. The authors are requested to seek the assistance of competent English language expert, if necessary, to ensure their English is of a reasonable standard. The journal maintains its policy and takes the liberty of correcting the English of manuscripts scientifically accepted for publication.
Tables and figures and/or schemes should not be embedded in the manuscript but their position in the text indicated. In electronic version (Word.doc document) tables and figures and/or schemes should follow the text, each on a separate page. Please number all pages of the manuscript including separate lists of references, tables and figures with their captions.
IUPAC and International Union of Biochemistry and Molecular Biology recommendations for the naming of compounds should be followed.
SI units, or other permissible units, should be employed. The designation of physical quantities should be in Times New Roman font. In text, graphs, and tables, brackets should be used to separate the designation of a physical quantity from the unit. Please do not use the axes of graphs for additional explanations; these should be mentioned in the figure captions and/or the manuscript (example: “pressure at the inlet of the system, kPa” should be avoided).
Percents and per mills, although not being units in the same sense as the units of dimensioned quantities, can be treated as such. Unit symbols should never be modified (for instance: w/w %, vol.%, mol.% ) but the quantity measured has to be named, e.g. mass fraction, w=95 %; amount (mole) fraction, x=20 %.
Latin words, as well as the names of species, should be in italic, as for example: i.e., e.g., in vivo, ibid, Artemisia annua L., etc. The branching of organic compound should also be indicated in italic, for example, n-butanol, tert-butanol, etc.
Decimal numbers must have decimal points and not commas in the text (except in the Bosnian/Croatian/Serbian abstract), tables and axis labels in graphical presentations of results. Thousands are separated, if at all, by a comma and not a point. Structure of the Manuscript
The manuscript must contain, each on a separate page, the title page, abstract in English, (abstract in Bosnian/Croatian/Serbian), graphical abstract (optional), main text,
84
Bulletin of the Chemists and Technologists of Bosnia and Herzegovina
list of references, tables (each table separately), illustrations (each separately), and legends to illustrations (all on the same page). 1. Title page must contain: the title of the paper (bold letters), full name(s) of the
author(s), full mailing addresses of all authors (italic), keywords (up to 6), the phone and fax numbers and the e-mail address of the corresponding author.
2. A one-paragraph abstract written of 150–200 words in an impersonal form indicating the aims of the work, the main results and conclusions should be given and clearly set off from the text. Domestic authors should also submit, on a separate page, a Summary/Sažetak. For authors outside Bosnia and Herzegovina, the Editorial Board will provide a Bosnian/Croatian/Serbian translation of their English abstract.
3. Authors are encouraged to submit a graphical abstract that describes the subject matter of the paper. It should contain the title of the paper, full name(s) of the author(s), and graphic that should be no larger than 11 cm wide by 5 cm tall. Authors are fully encouraged to use Graphical Abstract Template.
4. Main text should have the following form: - Introductionshould include the aim of the research and a concise description of
background information and related studies directly connected to the paper. - Experimental section should give the purity and source of all employed
materials, as well as details of the instruments used. The employed methods should be described in sufficient detail to enable experienced persons to repeat them. Standard procedures should be referenced and only modifications described in detail.
- Results and Discussionshould include concisely presented results and their significance discussed and compared to relevant literature data. The results and discussion may be combined or kept separate.
- The inclusion of a Conclusionsection, which briefly summarizes the principal conclusions, is highly recommended.
- Acknowledgement (optional). - Please ensure that every reference cited in the text is also present in the
reference list (and vice versa). Unpublished results and personal communications are not recommended in the reference list, but may be mentioned in the text. If these references are included in the reference list they should follow the standard reference style of the journal and should include a substitution of the publication date with either "Unpublished results" or "Personal communication" Citation of a reference as "in press" implies that the item has been accepted for publication. As a minimum, the full URL should be given and the date when the reference was last accessed. Any further information, if known (DOI, author names, dates, reference to a source publication, etc.), should also be given. No more than 30 references should be cited in your manuscript. In the text refer to the author's name (without initials) and year of publication (e.g. "Steventon, Donald and Gladden (1994) studied the effects..." or "...similar to values reported by others (Anderson, Douglas, Morrison, et al., 1990)..."). Type the names of the first three authors at first citation. At subsequent citations use

85 Bulletin of the Chemists and Technologists of Bosnia and Herzegovina
first author et al. The list of references should be arranged alphabetically by authors' names and should be as full as possible, listing all authors, the full title of articles and journals, publisher and year. Examples of reference style: a) Reference to a journal publication:
Warren, J. J., Tronic, T. A., Mayer, J. M. (2010). Termochemistry of proton-coupled electron transfer reagents and its implications. Chemical Reviews, 110 (12), 6961-7001.
b) Reference to a book: Corey, E. J., Kurti, L. (2010). Enantioselective chemical synthesis. (1st Ed.) Direct Book Publishing, LLC.
c) Reference to a chapter in an edited book: Moody, J. R., Beck II, C. M. (1997). Sample preparation in analytical chemistry. In Setlle, F. A. (Ed.), Handbook of instrumental techniques for analytical chemistry. (p.p. 55-72). Prentice Hall.
d) Reference to a proceeding: Seliskar, C. J., Heineman, W.R., Shi, Y., Slaterbeck, A.F., Aryal, S., Ridgway, T.H., Nevin, J.H. (1997). New spectroelectrochemical sensor, in Proceedings of 37th Conference of Analytical Chemistry in Energy and Technology, Gatlinburg, Tenesee, USA, p.p. 8-11.
e) Patents: Healey, P.J., Wright, S.M., Viltro, L.J., (2004).Method and apparatus for the selection of oral care chemistry, The Procter & Gamble Company Intellectual Property Division, (No.US 2004/0018475 A1).
f) Chemical Abstracts: Habeger, C. F., Linhart, R. V., Adair, J. H. (1995). Adhesion to model surfaces in a flow through system. Chemical Abstracts, CA 124:25135.
g) Standards: ISO 4790:1992. (2008). Glass-to-glass sealings - Determination of stresses.
h) Websites: Chemical Abstract Service, www.cas.org, (18/12/2010).
- Tables are part of the text but must be given on separate pages, together with their captions. The tables should be numbered consequently in Latin numbers. Quantities should be separated from units by brackets. Footnotes to tables, in size 10 font, are to be indicated consequently (line-by-line) in superscript letters. Tables should be prepared with the aid of the Word table function, without vertical lines. Table columns must not be formatted using multiple spaces. Table rows must not be formatted using Carriage returns (enter key; key). Tables should not be incorporated as graphical objects.
- Figures and/or Schemes (in high resolution) should follow the captions, each on a separate page of the manuscript. High resolution illustrations in TIF or EPS format (JPG format is acceptable for colour and greyscale photos, only) must be uploaded as a separate archived (.zip or .rar) file.
86
Bulletin of the Chemists and Technologists of Bosnia and Herzegovina
Figures and/or Schemes should be prepared according to the artwork instructions. - Mathematical and chemical equations must be numbered, Arabic numbers,
consecutively in parenthesis at the end of the line. All equations should be embedded in the text except when they contain graphical elements (tables, figures, schemes and formulae). Complex equations (fractions, inegrals, matrix…) should be prepared with the aid of the Word Equation editor.
Artwork Instructions
Journal accepts only TIF or EPS formats, as well as JPEG format (only for colour and greyscale photographs) for electronic artwork and graphic files. MS files (Word, PowerPoint, Excel, Visio) are NOT acceptable. Generally, scanned instrument data sheets should be avoided. Authors are responsible for the quality of their submitted artwork.
Image quality: keep figures as simple as possible for clarity - avoid unnecessary complexity, colouring and excessive detail. Images should be of sufficient quality for the printed version, i.e. 300 dpi minimum.
Image size: illustrations should be submitted at its final size (8 cm for single column width or 17 cm for double column width) so that neither reduction nor enlargement is required.
Photographs: please provide either high quality digital images (250 dpi resolution) or original prints. Computer print-outs or photocopies will not reproduce well enough for publication. Colour photographs rarely reproduce satisfactorily in black and white.
The facility exist for color reproduction, however the inclusion of color photographs in a paper must be agreed with Editor in advance.
Reporting analytical and spectral data
The following is the recommended style for analytical and spectral data presentation:
1. Melting and boiling points: mp 163–165°C (lit. 166°C) mp 180°C dec. bp 98°C Abbreviations: mp, melting point; bp, boiling point; lit., literature value; dec, decomposition.
2. Specific Rotation: [a]23D –222 (c 0.35, MeOH). Abbreviations: a, specific rotation; D, the sodium D line or wavelength of light used for determination; the superscript number, temperature (°C) at which the determination was made; In parentheses: c stands for concentration; the number following c is the concentration in grams per 100 mL; followed by the solvent name or formula.
87 Bulletin of the Chemists and Technologists of Bosnia and Herzegovina
3. NMR Spectroscopy: 1H NMR (500 MHz, DMSO-d6) d 0.85 (s, 3H, CH3), 1.28–1.65 (m, 8H, 4´CH2), 4.36–4.55 (m, 2H, H-1 and H-2), 7.41 (d, J 8.2 Hz, 1H, ArH), 7.76 (dd, J 6.0, 8.2 Hz, 1H, H-1'), 8.09 (br s, 1H, NH). 13C NMR (125 MHz, CDCl3) d 12.0, 14.4, 23.7, 26.0, 30.2, 32.5, 40.6 (C-3), 47.4 (C-2'), 79.9, 82.1, 120.0 (C-7), 123.7 (C-5), 126.2 (C-4). Abbreviations: d, chemical shift in parts per million (ppm) downfield from the standard; J, coupling constant in hertz; multiplicities s, singlet; d, doublet; t, triplet; q, quartet; and br, broadened. Detailed peak assignments should not be made unless these are supported by definitive experiments such as isotopic labelling, DEPT, or two-dimensional NMR experiments.
4. IR Spectroscopy: IR (KBr) n 3236, 2957, 2924, 1666, 1528, 1348, 1097, 743 cm–1. Abbreviation: n, wavenumber of maximum absorption peaks in reciprocal centimetres.
5. Mass Spectrometry: MS m/z (relative intensity): 305 (M+H, 100), 128 (25). HRMS–FAB (m/z): [M+H]+calcd for C21H38N4O6, 442.2791; found, 442.2782. Abbreviations: m/z, mass-to-charge ratio; M, molecular weight of the molecule itself; M+, molecular ion; HRMS, high-resolution mass spectrometry; FAB, fast atom bombardment.
6. UV–Visible Spectroscopy: UV (CH3OH) lmax (log e) 220 (3.10), 425 nm (3.26). Abbreviations: lmax, wavelength of maximum absorption in nanometres; e, extinction coefficient.
7. Quantitative analysis: Anal.calcd for C17H24N2O3: C 67.08, H 7.95, N 9.20. Found: C 66.82, H 7.83, N 9.16.All values are given in percentages.
8. Enzymes and catalytic proteins relevant data: Papers reporting enzymes and catalytic proteins relevant data should include the identity of the enzymes/proteins, preparation and criteria of purity, assay conditions, methodology, activity, and any other information relevant to judging the reproducibility of the results1. For more details check Beilstein Institut/STRENDA (standards for reporting enzymology data) commission Web site (http://www.strenda.org/documents.html).
1 For all other data presentation not mentioned above please contact Editor for instructions.

88
Bulletin of the Chemists and Technologists of Bosnia and Herzegovina
Submission Checklist The following list will be useful during the final checking of an article prior to
sending it to the journal for review:
• E-mail address for corresponding author, • Full postal address, • Telephone and fax numbers, • All figure captions, • All tables (including title, description, footnotes), • Manuscript has been "spellchecked" and "grammar-checked", • References are in the correct format for the journal, • All references mentioned in the Reference list are cited in the text, and vice versa.
Submissions
Submissions should be directed to the Editor by e-mail: [email protected], or [email protected]. All manuscripts will be acknowledged on receipt (by e-mail) and given a reference number, which should be quoted in all subsequent correspondence.
Sponsors
www.prevent.ba
www.higracon.ba
Bulletin of the Chemists and Technologists of Bosnia and Herzegovina
Print ISSN: 0367-4444 Online ISSN: 2232-7266
Zmaja od Bosne 33-35, BA-Sarajevo Bosnia and Herzegovina
Phone: +387-33-279-918 Fax: +387-33-649-359
E-mail: [email protected] [email protected]

www.elektroprivreda.ba/stranica/te-kakanj
www.fmon.gov.ba
Zahvaljujemo se Federalnom ministarstvu obrazovanja i nauke na finansijskoj
pomoći za izdavanje ovog broja Glasnika hemičara i tehnologa Bosne i
Hercegovine.
Redakcija GLASNIKA-a
Bulletin of the Chemists and Technologists of Bosnia and Herzegovina
Print ISSN: 0367-4444 Online ISSN: 2232-7266
Zmaja od Bosne 33-35, BA-Sarajevo Bosnia and Herzegovina
Phone: +387-33-279-918 Fax: +387-33-649-359
E-mail: [email protected] [email protected]