531 - freit forum for research on empirical international trade
TRANSCRIPT
1
What drives Africa’s export diversification?
Dick Nuwamanya Kamuganga.1
The Graduate Institute of International and Development Studies, Geneva
Abstract
What drives export diversification in Africa? The primary purpose of this paper is to seek
empirical answers to this question. Using a highly disaggregated bilateral trade flows at HS 6
digit level for African countries for a period 1995-2009 and a conditional logit technique, I
find 3 main empirical results. First, intra-Africa regional trade cooperation enhances the
likelihood of an African nation exporting across the new-product, new-market margin.
Second, I also find evidence that both product and market experience help to increase the
chances of African exporters exporting on new-product and new market margins thus
providing support for the learning effects hypothesis. The third result shows that
infrastructure related trade frictions such as export costs; time to export; procedures to export
as well as weak export supporting institutions have a negative effect on African export
diversification. Similarly macroeconomic developments particularly exchange rate volatility,
financial underdevelopments and inappropriate foreign direct investments hurt African
nation’s chances to diversify its exports. In policy terms this study suggests that for African
exporters learning to export from regional markets before exploring major distant markets, a
reduction in intra-African trade barriers, deepening and strengthening regional trade
cooperation could be a significant channel for encouraging export diversification in Africa.
Key Words: Extensive Margin of trade, Firm Heterogeneity, unilateral trade preferences &
regional trade agreements. JEL: F1, F13, F14, F15
1 Department of International Economics, Graduate Institute of International and Development Studies,
Pavillion Rigot, office R13,
Avenue de la Paix 11A, 1202 Geneva. Email: [email protected].
Tel: +41788642348.
2
1.Introduction
Primary commodities, mainly mineral fuels, constituted 56 percent of the total African
exports in 2009.2 Why is the composition of African exports heavily concentrated in
unprocessed primary commodities in contrast to other regions of the world – East Asia for
instance?3
Shifting away from primary commodity exports remains an uphill task for almost all African
countries. Yet successful economic transformation that guarantees wage employment requires
these economies to move away from the enclave economies of single commodity exports into
a diversified non-traditional basket of new products and new markets. 4
If Africa is to take
full advantage of its participation in international trade, it must upgrade its export basket
composition, product quality and range of export markets.
A country’s export diversification can occur through three major channels: new products to
old markets; new products to new markets, and old products to new markets. This paper
investigates empirically the underlying factors that drive Africa’s export diversification along
these three channels. It covers all African countries using trade data at HS 6 digit level of
disaggregation.5,6
The paper attempts to answer four related empirical research questions. First, how much of
Africa’s trade growth can be attributed to exports on the new-product, new-market margin?
Second, does intra-African regional trade cooperation increase the likelihood of African
nations exporting across the new-product, new-market margin? Third, do learning effects
from exporting promote export diversification? And fourth, what are the other underlying
factors that determine the probability that an African exporter will export a new product or
export a product to a new market? I use a conditional logit technique to answer these
questions and control for exporter-product-market and time fixed effects in all my
specifications.
The paper’s contribution is fourfold. It is the first paper to focus on the issue of whether intra-
African regional trade cooperation enhances Africa`s export diversification. Second, it
explores how much of recent African export growth can be attributed to the export of new
products and exporting to new markets (establishes some stylized facts on the significance of
Africa`s new products and new trading partners) between 1995 and 2009. Third, it reports the
significance of learning effects in exporting activities along the new-product and new-market
margins among African exporters. Fourth, it explores other factors that determine the
probability that an African exporter will export a new product or export to a new market
among African exports.
The paper presents three main empirical results. The first result is that intra-regional trade
cooperation in Africa matters. It increases the likelihood of an African nation exporting on
2 Author`s calculation based on UN COMTRADE database
3 That is the high performing East Asian countries of Hong Kong, S. Korea, Singapore, Taiwan and newest
industrialising countries of Indonesia, Malaysia and Thailand-East Asian NICs.
4 I define traditional exports as those exports that constituted the top 10 exported products in 1995
5 African countries refer to the entire continent (Sub Saharan plus North Africa)
6 Regarding level of disaggregation, for African countries, 6-digit level is disaggregated enough to look at the
changes in the numbers of products to give a convincing picture of diversification. I believe I will be able to
pick up on individual products without underestimating the importance of the newly traded products in Africa
because of the level of development in the region.

3
the new-product, new-market margins and significantly affects the export-basket
composition. The second unambiguous result is that export experience matters. The discovery
of new-varieties (products) and new-markets (new trading partners) is positively related to
exporting experience. Third, is that policy and institutions can hinder export diversification.
There is a negative and statistically significant relationship between the probability of
expanding export margins and infrastructure related trade frictions, negative policy shocks,
financial underdevelopment, inappropriate FDI and quality of bureaucracy supporting
exporting activities within Africa.
This empirical evidence means that intra-African regional trade cooperation is also an
important channel of Africa`s trade growth and creating new opportunities for export
diversification. The public policy implication is that emphasis should also be pressed on the
reduction of intra-African trade barriers and strengthening of intra-Africa trade facilitation as
a means to foster export basket expansion and overall export growth.
The rest of the paper is organised as follows in six sections. The next section reviews the
literature. Section 3 present the prima facie evidence on African export performance over the
last 15 years. Section 4 presents the theoretical framework and Section 5 presents the
econometric analysis. The final section presents a brief summary and concluding remarks.
2.Literature
My empirical approach is motivated by heterogeneous firm theoretical framework, but before
turning to a review of these models, I briefly consider the pre-Melitz work.
Before Melitz (2003), the microfoundations for the introduction of new varieties were not
well developed. The models used in the early empirical work (e.g. Roberts & Tybout 1997)
were loosely based on the existence of firm level sunk costs for entering new markets, but the
competitive interactions were not well accounted for. For instance, Baldwin (1988, 1989),
Baldwin & Krugman (1989), Dixit (1989a, b), and Krugman (1989) looked at sunk entry
costs in settings that assumed simple market structures.7
Less closely related was the well-known model of Dornbusch, Fischer & Samuelson (1977)
which presented a framework of a two country Ricardian model with a continuum of goods
and extended it to analyse a many-commodity case. This framework focused on how changes
in tariffs and transport costs could change the range of commodities that were traded. Later,
Eaton & Kortum (2002) presented a Ricardian trade framework that permits analysis of
bilateral trade flows along the absolute advantage, to comparative advantage (trade
promoting) and to geographic barriers (resisting trade). In this framework, technological
heterogeneity and geographic barriers determine which products various countries exported.
Bernard & Jensen (1995, 1999) work showed that heterogeneity in firm productivity is
systematically related to trade participation. That is within an industry, some firms export
while many others do not and even among exporters, the fraction of shipments exported is
often small. They also show that exporters are larger, more productive, and pay higher wages
than other firms within the same industry.
7 Models of hysteresis of trade flows, this analysis emphasised such costs of breaking into foreign markets as
upgrading product quality, packaging, establishment of marketing channels and acquiring information on
foreign demand.
4
Since, I want to investigate the patterns of export diversification-new product and new-
market margins for Africa`s exports at product level, Melitz (2003) theoretical framework
and its extensions provide a natural framework for my empirical investigations. Its two key
empirical implications will help my investigations. First, it provides a natural, firm-level
interpretation of why a particular trade flow between an African exporting country (origin
country) and the destination country might not be observed.8 This is important since the
traditional ‘new trade models’ of Helpman and Krugman (1985) made assumption that meant
all varieties were traded – a feature that renders them useless for consideration of changes in
diversification. The ‘old’ trade models before Helpman and Krugman went even further and
assumed away firms and varieties of products all together. In this context, the Melitz model
was the first flexible framework in which the number of products exported was a key focus of
the theory. This is why I use this family of models as the backbone for my empirical
estimation strategy.
Second, it provides a simple model of the determinants of which flows should be positive.
Specifically, a typical product in Africa will be exported as a new product, if the exporting
firm is productive enough9 to incur fixed costs of its production plus sunk and variable costs
of entering a foreign market. While Melitz was a break through, it worked in an economic
setting that was too symmetrical to inform my empirical work. Fortunately, there have been
extensions to Melitz (2003) that include multiple destinations and multisector economic
settings; here I review the most relevant (see Redding 2011 for a complete survey of the
Melitz-inspired literature).
Helpman, Melitz and Yeaple (2004), develop a variant of Melitz (2003) by introducing
multiple destinations and multiple sectors. Firms within sector are differentiated by
productivity as in Melitz (2003) and can decide to serve either the foreign markets through
exports or through local subsidiary sales. They face lower fixed costs if they export and lower
variable costs if they invest. The key feature of this set-up relevant to this study is that
multiple firms facing lower fixed costs (in multiple destinations) deciding to export can help
explain the patterns of export diversification for African exporters.10
When applied for my
purposes, this can be interpreted as providing determinants of African firms’ choice on the
extensive margin (new-product and new-destination margins). Bernard, Redding & Schott
(2007) go beyond Helpman, Melitz and Yeaple by developing a framework with endowment
differences across origin and destination countries in a heterogeneous firms setting. Their
framework adds to the list of potential determinants of African extensive margins, namely as
trade costs fall, firms in the nation’s comparative advantage sector are more likely to export
their product. It also shows that relative firm size and relative number of firms increases more
in the comparative advantage industries. Freer trade, however, has the opposite effect in a
nation’s comparative dis-advantage sectors.
Finally, the theory paper most closely related to my empirical strategy is that of Helpman et
al. (2008). This is a multi-country version of the Melitz (2003) model that is consistent with
the kind of stylized features of the data used in this paper. The authors use their theory to
8 This setting provides an explanation for the change of trade along the extensive margin, i.e., the number of
new products exported as a result of changes in cut-off condition for a typical product in a foreign market. Also
changes in variable costs could affect firms’ decisions in two ways: - first, new firms which previously could not
export due to the higher variable costs start to sell also in the foreign market; Second, changes in the fixed costs
of entering a new market impact trade also at the extensive margin thus permitting export diversification. 9 Has low marginal cost of production (its labour per unit output is high enough)
10 In the model firms sort according to productivity into different organisational forms
5
motivate a novel regression strategy related to the gravity equation. What makes their
framework suitable for my analysis is that it permits positive as well as zero trade flows
across pairs of countries, and it allows the number of exporting firms to vary across
destination countries. Therefore permits me to investigate the impact of trade frictions on the
Africa`s extensive margin of trade (export diversification) i.e., number of exporters and
destination markets.
These theoretical insights guide my main hypothesis on the causes of export growth on the
new-product and new-market margin of African trade. With positive fixed exporting costs,
and for significant large values of fixed and variable trade costs, a certain number of
productive African firms will export certain products to certain markets. This results into a
pattern of export diversification along the new-product and new-market margins. By
implication, a reduction in the specific fixed exporting costs and variable trade costs, from
changes in regional trade integration or destination country market access conditions or
reduction in intra-Africa trade barriers, infrastructure related trade and information frictions
should lead to African firms’ discovery new products as well as new markets leading to
export growth at the extensive margin.
Besides this strand of analytical literature offering insights on how firm characteristics and
trade costs can impact export performance of an individual firm, the industry export
performance and consequently the aggregate trade performance of a country, I review
empirical literature that is closely related to the problem I investigate in the current study.
2.1. Empirics
The first modern attempts to understand the range of goods a nation exports came in the early
1990s. Feinberg (1992) using time series data for US manufacturing industries first tested the
hysteresis hypothesis from the sunk-cost papers discussed above. He finds that exports
became dispersed across destination markets as the dollar depreciated, suggesting that there
was firm entry into new country markets. He reports weaker effects in industries where
distribution networks with high sunk costs. However, Parsley and Wei (1993) focusing on
bilateral US-Canada and US-Japan trade flows for very disaggregated commodities find that
both the past history of US exchange rate changes and measures of exchange-rate volatility
had no significant effect on trade flows thus contesting the findings of the hysteresis model.
The pre-Melitz empirical tests to data on trade flows and prices relied on aggregate or
sectoral data. Roberts & Tybout (1997) pioneered the convergence of theory and empirics by
developing an econometric model of plants’ decision to diversify into new markets and used
it to test the sunk-cost explanation for hysteresis of trade flows at plant-level. Using
Colombian plant-level data for the period 1981-1989, the authors find evidence that sunk cost
hysteresis models were empirically relevant and found that the probability that a firm will
export, if it exported last period was significantly as high as 60 percent. Similarly Sullivan
(1997), Bernard and Jensen (1999), Campas (1999) adopt a dynamic probit or logit technique
to empirically test whether sunk entry costs affected export participation. Their universal
finding was that sunk costs are important and that export aggregates were indeed subject to
important hysteresis effects and that sunk costs matter for export participation.
Bernard and Jensen (1995, 2004) have also empirically provided substantial insights into the
characteristics of exporting firms. They report that exporting firms tend to be more
productive than non-exporting firms and that exporting process is very persistent and firms
rarely change their status from non-exporting to exporters and vice versa. Das, Roberts and
6
Tybout (2008) found that sunk costs are quantitatively more important for small scale
exporters among Colombian Chemical producers whose foreign demand is relatively limited,
suggesting that hysteresis effects are important only for fringe players in the export markets.
In Bernard et al (2003), the most productive firms out-compete others and export by
incurring both the market entry costs including transport costs associated with international
trade. In Bernard et al (2006) industries experiencing relatively large declines in trade costs
exhibit relatively strong productivity growth and the relatively high-productive non-exporters
are more likely to start exporting in response to falling trade costs while existing exporters
increase their shipments abroad as trade costs fall. They further provide evidence of
productivity growth within firms in response to decrease in industry-level trade costs. Eaton
et al (2011) simulate using a method of moments an extended version of the Melitz model
based on French trade data by firm and destination market. They report that number of
exporting firms selling to a market increases with market size; secondly, export sales
distributions are similar across markets of very different size and extent of French
participation and third, average sales in France are higher for firms selling to less popular
foreign markets and to more foreign markets. Baldwin & Harrigan (2011) focussing on the
pattern of zeros in product-level bilateral trade data show that “export zeros” are correlated
with distance and destination market size. They also show that high quality firms are the most
competitive, with heterogeneous quality increasing with firms heterogeneous cost.
2.1.1. Empirics on origin country characteristics and export diversification
Evenett & Venables (2002), Feenstra & Kee (2004), Hummels & Klenow (2005) and
Felbemayer & Kohler (2006) have shown that there is a difference in product varieties
countries export in a range of countries and these patterns change over time. Hummels and
Klenow (2005) find that export elasticity with both per capita income and market size is due
to the extensive margin three-quarters and one-third due to the intensive margin. They report
that within a category of the 60 poorest countries, those with twice the GDP per worker
export 39 percent more quantities at unchanged prices, whereas doubling GDP per worker
among the 61 richest countries leads to 39 percent higher prices for the same quantities
shipped. Thus, they point that a country’s trade participation evolves along the course of its
development.Dutt, Mihov & Van Zandt (2011) and Christodoulopoulou (2010) have shown
empirically that there is an increase in the extensive margin of trade with respect to regional
trade agreements and WTO membership. Similarly Foster, Poschl and Stehrer (2010) also
report trade creating effects of preferential trade agreements and much trade creation takes
place along the extensive margin. Rose (2000) found large statistically significant effects of
currency unions on international trade and a small negative effect of exchange rate volatility.
He notes that two countries that share the same currency are likely to trade three times as
much as they would with different currencies. Also Barro & Tenreyro (2007) report positive
effects of a common currency on international trade. Baldwin & Di Nino (2006) report
positive and significant effects of the euro on trade, the authors provide a supportive evidence
of the “new-goods hypothesis”.
7
2.1.2. Empirics on destination characteristics and export diversification
These papers Baldwin & Harrigan (2011), Kang (2006), Campbell and Hopenhayn (2005) in
different contexts have shown that the destination country market size matter for exporting
large number of varieties. Intuitively, for any given pair of trading countries, the number of
varieties exported to a particular country should be positively related to the size of its
effective demand or its income per capita, thus the finding that rich countries should import
more varieties. Baliamoune-Lutz (2010) investigates growth effects of Africa’s trade with
China using Africa’s trade flows for a period of 1995-2008 and finds evidence supporting the
“growth by destination” hypothesis. This implies that destination of exports can play an
important role in determining the country’s trade patterns as well as its development
trajectory. The author also notes that inward foreign direct investments can be a channel to
influence trade patterns of a developing country’s exports, especially for FDI targeting
specific export sectors. Bernasconi (2009) analyses the two extensive margins of international
trade flows using Linder Hypothesis11
.The author finds that countries with more similar
demand structures also have a higher probability to exhibit positive trade via product level
extensive margin.
2.1.3. Empirics on trade barriers and export diversification
Debaere and Mostashari (2010) investigate the role of tariff changes and tariff preferences on
the changes in the range of goods that the United States imports from its trading partners.
Their strategy was to compare trade patterns that occurred in 1989 and those that occurred in
1999. They report significant changes in the extensive margin of US imports between the
beginning and the end of their sample period but find that these changes can only be in part
accounted for by tariff reductions and tariff preferences. Farazi Binti (2011) shows that
greater economic integration in East Asian economies led to export diversification but
exchange rates and tariff rates had a negative effect on diversification.
Gamberoni (2007) found that European unilateral trade preferences had anti-diversification
effects along with concentration of exports in agricultural sector for the case of ACP
preferences. However, Frazer and Van Biesebroeck (2010) report positive results using a
triple difference-in-difference estimation technique for AGOA beneficiaries on the extensive
margin. Specifically, they find product categories grew largest where tariffs removed were
largest, but smaller though significant impact for agricultural products.
Amurgo Pacheco (2006) investigates the Euro-Mediterranean Preferential Trade Agreement
(PTA) effects on range of products exported by member nations using disaggregated HS 6
digit level data and his results reveal a positive expansion in the range of products traded by
its members providing empirical evidence for his “new varieties hypothesis” that free trade
agreements lower costs of entering a foreign market for exporting firms and thus lead to a
drop of zeros in export sectors especially in the most liberalized sectors. Similarly Amurgo-
Pacheco and Pierola (2008) report positive effects of FTAs and trading with North countries
contributing to export diversification of developing countries.
11Linder Hypothesis: This predicts the intensity of trade to increase with the similarity in demand structures &
that the more similar per capita incomes are the more diversified are the traded good bundles. Also the more
uneven the within income distribution is the higher is the extensive margin of trade.
8
2.2. Empirics on geography and export diversification
McCallum (1995), Anderson & Wincoop (2003) and Evans (2003) indicate that international
borders do indeed play a role in determining the patterns of international trade. Overall, their
results indicate that international borders significantly reduce trade between countries. I
expect countries that share borders to trade more at the extensive margin in this analysis.
Bernard et al (2007) demonstrate the negative effects of distance on trade flows by finding
that the number of exporting firms is strongly decreasing in distance (but increasing in
destination market size), but the export value per product and firm increases with distance.
Furthermore, Baldwin and Harrigan (2011) confirm a strong positive association between
distance and “zero exports”.
Frankel et al., (1995) inter alia have also shown that geography is also a powerful
determinant of bilateral trade flows, implying that simply knowing how far a country is from
other countries provides a considerable information about the amount of trade activity it
performs at the extensive margin.
3.Data and Prima facie evidence
To fix ideas and establish the unconditional facts to be explained in my regression analysis,
this section provides an overview of Africa’s export activities for the period 1995 to 2009
including intra-African trade performance. I use bilateral trade data at 6-digit level based on
Harmonised System (HS) of classification. The data is obtained from BACI dataset based on
UN COMTRADE database. This description involves export performance in terms of
changes in the export basket along the old-and new-product margins and destination markets
(old and new-market margins)
3.1. Geographical Distribution and overall Africa’s Export Performance
African exports grew at an average of 11 percent during the sample period (Table 1) but fell
drastically in 2009.12
Intra-Africa regional trade grew faster as well at 12 percent for the first
14 years, intra- Africa trade constitutes what I have called the non-traditional markets for
African exports. In this group of markets, African exports grew fastest for Latin America (14
percent), Middle East (13 percent), and Asia (13 percent). In traditional markets, North
America (United States and Canada mainly), African exports grew at 13 percent annually and
10 percent for Europe.
For all destinations, African exports grew fastest in the mid-2000s reflecting the upturn of
commodity prices and international demand conditions for African commodities of 2004 till
2006. During this period (2004 to 2006) African exports grew remarkably at 21 percent per
annum. This double digit growth rates sustained in the past few years resulted in average
annual growth rate of 25 percent since 1995. However, the growth rates declined in all
12 Exports fell close to 60 percent in 2009. This could possibly be a reporting problem in 2009 or it reflects the
on-going global financial crisis.

9
regions in a synchronized fashion in 2007 following the financial crisis. Though in all
regions, African exports rebounded to double digit growth averaging remarkably at 27
percent in 2008.
In terms of growth of regional market shares (Table 3), a number of significant changes can
be noticed regarding regional distribution of African exports in the last 15 years. In the rich
traditional markets of African exports composed of Canada, Europe, Japan and the United
States (the traditional QUAD countries) imported 76 percent of African exports in 1995 but
this share shrunk to 63 percent. This is also the largest unilateral preference trade between
Africa and its partners. In this category of markets, Europe has been the largest African
traditional market; it constituted 56 percent of overall export market in 1995 which shrinks to
41 percent (by 15 percent) by the end of the sample period. While North America (United
States and Canada) share of imports from Africa expanded by a mere 2 percentage points
((15 percent in 1995 to 17 percent in 2009). Within the traditional markets, the USA the most
single significant destination of African exports expanded its share of imports from Africa
from 13.7 percent in 1995 to 15.7 percent in 2009. France followed within Europe and its
share which was 10 in 1995, shrunk to only 7.5 percent. Within Europe also Italy, Germany
and Britain ranked among the top 5 destinations of African exports in 1995 but their share
shrunk from 9.8, 7.8 and 5.8 to 8.6 4.8 and 3.7 percent respectively (see Table 4 for
distribution of African exports by top 20 destination markets). Japan share as one of the main
markets for African exports within the QUAD shrunk from 4.2 percent in 1995 to only 2.4
percent in 2009. Exports to Canada rose from 1.1 percent in 1995 to 1.7 percent in 2009.
In the non-traditional traditional markets Africa’s share of exports to Asia expanded by a
remarkable 8 percent in the last 15 years from 14 percent to 22 percent. African exports grew
fastest particularly to China which gained the leading significance as the destination of
African exports with its share rising from 1.0 percent in 1995 to take the second rank as
Africa’s export destination at 10 percent in 2009. A remarkable 900 percent growth in share
of export by value destined to China. In non-traditional markets its share rose from 3.1
percent, as a 9th
major African market to the 1st major market with 21.6 percent share of
imports from Africa among non-traditional markets. The second most important market for
African exports in non-traditional markets is India, Africa’s export share to India rose from
1.8 percent in 1995 to being the 5th
most important market at 5.2 percent in 2009. India is
followed by Switzerland as the other major African non-traditional market. Its share rose
from 1.2 in 1995 to 2.3 percent, a 92 percent increase in significance for this market. Also
Brazil in the non-traditional markets grew, African exports to Brazil rose from 1.4 percent in
1995 to 2.1 percent in 2009.
Within the rest of non-traditional markets, intra-Africa trade increased by only 3 percentage
points from 9 percent share to 12 percent. The main markets of intra-African exports were led
by South Africa, Equatorial Guinea, and Nigeria with 1.7, 1.0, and 0.9 percent share
respectively. These were the only intra-African markets in the top 20 markets of non-
traditional African markets (Table 4) in 2009. For the major intra- African market, Zimbabwe
constituted the largest market by share of African exports at 12 percent of intra-African
exports, followed by South Africa at 8 percent, then Mozambique, Ivory coast, Tunisia at 7, 6
percent respectively in 1995 as the top 5 markets for intra-African exports. By the 2009, the
major intra-African markets were South Africa (15 percent), Equatorial Guinea (8 percent),
Nigeria (7.4 percent), Zimbabwe (6 percent) and Zambia (5 percent). Overall, intra-African
exports have progressively become more significant and less reliant on the traditional QUAD
markets.
10
Overall, at least three stylized facts can be noted from this section; first, the share of exports
to traditional markets (the QUAD) has shrunk from 76 percent to 63 percent over the sample
period. Second, African exports to non-traditional markets rose from 24 percent to 37
percent, with exports to Asia leading the expansion. Third, intra-African trade become
significant for the first time in the post-colonial period. It rose at 12 percent per annum and
accounted for 12 percent of total African exports in 2009. It also reveals that intra-African
export expanded more along the new-product margin than the new-market margin and the
reverse is true for the ROW exports. Below, I will interpret all three points in the light of
new-product, new-market margins.
3.2. Within Regions Distribution of African Exports
Table 5, Table 7 & Table 8 provides further evidence that Africa’s export growth can also be
significantly attributed to intra-Africa product diversification as well as to increasing
significance of non-traditional markets as major destinations of African exports. First, the
total African markets (the total number of destination markets increased from 127 at the
beginning of the sample to 151 in 2009. Second, the average number of markets per exporter
rose from 57 markets in 1995 to 78 markets in 2009. Third, while in 1995 each product was
being exported to an average of 31 markets, in 2009 the average number of destination
markets per product had reached to 49 markets.
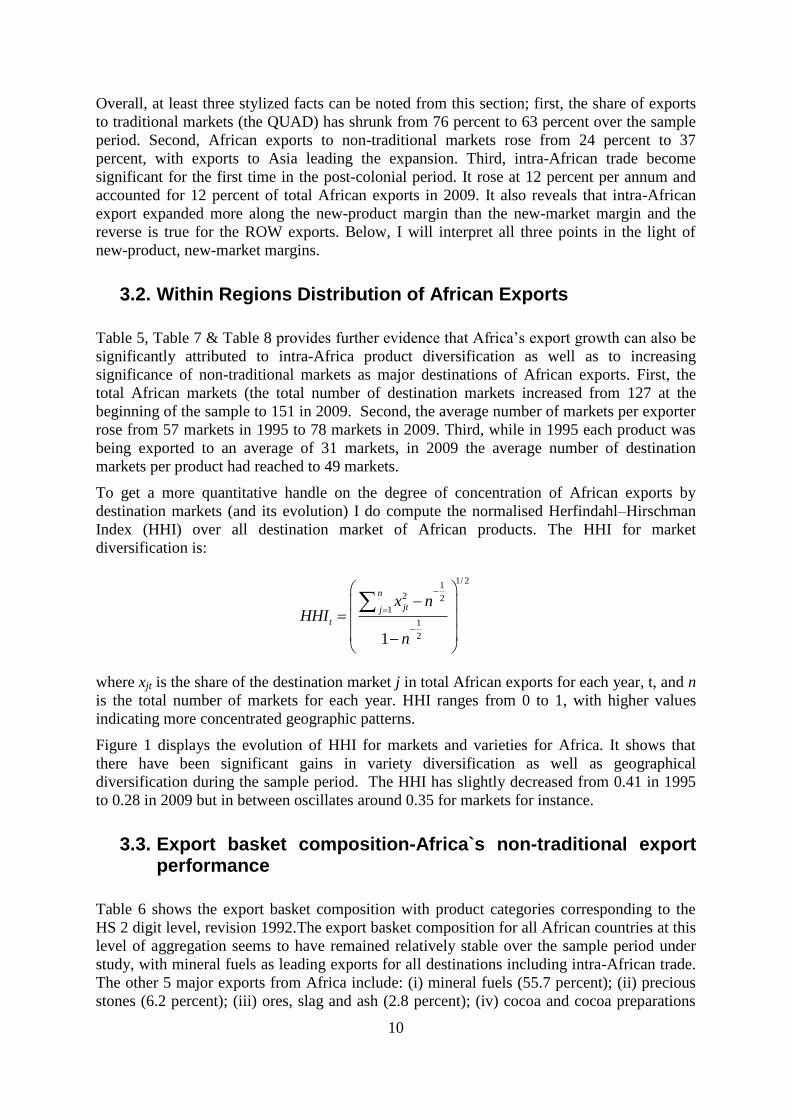
To get a more quantitative handle on the degree of concentration of African exports by
destination markets (and its evolution) I do compute the normalised Herfindahl–Hirschman
Index (HHI) over all destination market of African products. The HHI for market
diversification is:
1/ 21
2 2
1
1
21
n
jtj
t
x nHHI
n
where xjt is the share of the destination market j in total African exports for each year, t, and n
is the total number of markets for each year. HHI ranges from 0 to 1, with higher values
indicating more concentrated geographic patterns.
Figure 1 displays the evolution of HHI for markets and varieties for Africa. It shows that
there have been significant gains in variety diversification as well as geographical
diversification during the sample period. The HHI has slightly decreased from 0.41 in 1995
to 0.28 in 2009 but in between oscillates around 0.35 for markets for instance.
3.3. Export basket composition-Africa`s non-traditional export performance
Table 6 shows the export basket composition with product categories corresponding to the
HS 2 digit level, revision 1992.The export basket composition for all African countries at this
level of aggregation seems to have remained relatively stable over the sample period under
study, with mineral fuels as leading exports for all destinations including intra-African trade.
The other 5 major exports from Africa include: (i) mineral fuels (55.7 percent); (ii) precious
stones (6.2 percent); (iii) ores, slag and ash (2.8 percent); (iv) cocoa and cocoa preparations
11
(2.4 percent); (v) Electrical machinery equipment parts (2.2 percent). These top five
commodities accounted for 69.3 percent of African total exports for the year 2009 and 78.8
percent for the top 10 exported commodities exported from Africa.
Most notable changes in the export basket composition, is the rapidly increasing share of
mineral fuels both in volume and value for the last 15 years, which accounted for less than
37.4 of total exports in 1995 but increased to their current share of 55.7 percent of total
African exports in 2009. This rapid rise of mineral fuels follows a rise of the number of
African countries discovering and initiating exploitation of oil products in the last 10 years,
new petroleum exporting countries increased their participation in total exports by almost 60
percent since 1995.
At the beginning of the sample period coffee, tea, spices ranked the 5th
most important
export, but it has been losing its participation in total exports over the years and its position
went down and was not in the top 10 exports in 2009. Precious metals and mineral ores show
resilience in all traditional markets constituting the second most important exports by
proportion to traditional markets and some non-traditional markets like India.
Again concentration of Africa’s export basket composition can be quantified with the HHI
defined for products. This focuses on the distribution of shares of products; again HHI is 1 if
only one product is exported, and 0 if an infinite number are. I notice a slight reduction in the
degree of concentration of the export basket as confirmed by the HHI for product exports that
slightly decreased from 0.48 in 1995 to 0.13 in 2009 (Figure 1) shows the variation of non-
traditional exports and their HHI index at HS2 and HS 6). These statistics show that the
composition of the structure of African exports during 1995 to 2009 gradually changed in the
export basket product or chapter composition.
3.4. New product and new market margins
In this sub-section I decompose African export performance on the extensive margin into
new-product (number of active product lines) and new-market (number active destinations)
margins. For each margin, I analyse the contribution of each toward Africa’s export growth
over the sample period.
First, I split African export performance into 3 main product categories – those that are new,
those that disappear, and those that are exported throughout the sample period. Second, I
define new products at the HS 6 digit level and set a ‘window’ for the definition of ‘new’.
The point is to address the possibility that produce which is exported every other year would
be considered a ‘new’ product each time. To filter out such hit and run exporting, I set the
window for a product to be considered ‘new’ to (1, 2, 3, 4, and 5) years.13
These thresholds
reduce the sample size from over 15 million observations for the years 1995-2009 to within
the range of 1.6 million observations points. This helps me capture the changes induced by
the explanatory variables shocks under study and offer robustness checks for my analysis.
13
On hit and run exporting see Békés and Muraközy (2012).
12
3.4.1. New products
NP1- is a new product k in the sample if it was not exported anywhere in any of the
thresholds I impose on the sample. This means it was not exported either in the preceding
1,2,3,4 or 5 years before this product is first exported and then its exported consecutively in
the next 1,2, 3,4 or 5 years. The paper chooses these thresholds on the basis of the fact that
export spells in Africa are likely to be short-lived but also for robustness checks on what
constitutes a new product14
; besides, African exporters are more likely to face uncertainty,
imperfect information on foreign demand so their export activity is by trial and error on
different products for a short while after incurring sunk costs of reaching a new foreign
market15
.
NP2- is a new product k if it was positively exported to destination market-d in 2009 and was
not exported (zero flow) in 1995.
NP3- is a new product k if it was positively exported to destination market-d in 2009 and its
value was larger than US$ 1000 dollars, and its value was equal or less than US$ 1,000
dollars in 1995.
NP4- is a new product k if it was positively (an active line) exported to destination market-d
in 2009 and its value was larger than US$ 5000 US dollars and it was equal or less than US$
5000 dollars.
I start my investigation of changes at the new-product and new-market margin by looking at
the total African exports regardless of the exporting country and of destination market, and I
then proceed to a country-level analysis by looking at exports established products to
countries the products had not yet been exported to.
Table 7 shows the number of new products in 1995-2009 as well as their shares in the total
number of products exported in the sample period, for 6 digit product lines. All African trade
relationships are recorded in my dataset regardless of export value. Following the four
windows for defining products as new, I find on average 630 new products were discovered
annually for the entire sample period. This means considering all export destinations, and all
exporters, just a small proportion of the potentially exported products were active product
lines in 1995. The value of these exports represented an annual average of 37 percent in share
of total African exports and 46 percent by share in 2009.
The performance of African countries on these margins varies per country and per
destination; with new products it’s significant large for traditional markets like Europe but
less pronounced for other major distant rich markets. Exports to India, USA, Great Britain,
Italy, German and France (with 49 new products) emerged as the leading destination for
Africa’s new products (see table 7) for the top 20 destination markets for new products). The
second major destinations for new products are Hong Kong, Malaysia, China (48 products),
Canada, Austria, Netherlands and Japan (47 products). For the intra-African new-product
margin, only South Africa, with its 46 new products were exported in 2009, is among the top
10 destinations for new products. Within other regions, EU has the largest share of new
products created. This is noteworthy since it does not seem in line with the widely held
perception that unilateral trade preferences have had no effect.
14
To reduce noise due to volatility in reporting within the data
15 See (Besedes and Prussa, 2006) for export survival insights.

13
For most of intra-regional groupings, new products represented 18 percent for intra-African
trade, 4 percent for North American trade, 17 percent for Asia, 15 percent for region Middle
East, 23 percent for Latin America, 23 percent for Oceania and the pacific and 9.6 percent for
the European Union markets Table 9 shows regional variation in number of new products
and shares of new products in total regional trade and their ranks). Table 10 takes different
views of the data by separating African nations into coastal and landlocked nations.16
The
table shows that coastal countries (Kenya, South Africa, Egypt, Morocco, Senegal,
Madagascar, Tunisia, Ghana, and Nigeria) experienced a significant trade growth on the new-
product and new-market margins. Landlocked countries, by contrast, saw less expansion
along the new-product margin compared to the coastal countries, but they still saw important
growth (four times more at the end of the sample). The largest increases in new products was
seen by Kenya, South Africa, and Ghana, although Ghana’s big improvement is from a very
low base.
3.4.2. Disappearing products
Disappearing products are those products that were exported somewhere in those threshold
proceeding years but were not exported again within the window set. Since many trade flows
occur at very low levels – suggesting that the exports are not really commerce – I set a
threshold for an observed product-destination pair to be considered a ‘real’ exports (as
opposed to, say, a family posting a present to an overseas family member).17
The thresholds I
work with are $0, $1000, and $5000. Table 7 also shows the number of disappearing
products by destination and regional variation and exporting country. In overall African
exports disappearing products constituted an annual average share of 23.2 percent.
3.4.3. Permanent products
Lastly, permanent products are those that were exported in all those threshold periods I
choose for my analysis (from the beginning of the sample 1995 to the end of the sample
period 2009). Table 7, also shows the summary statistics of permanent products for the
sample period. By presenting permanent products as products which had already been
exported somewhere by African exporters over the thresholds, I do control for variation in
product code reclassifications. In overall, African exports, the permanent products
contributed and average of 41.6 percent per year.
3.4.4. New market margin
3.5. Data quality issues
The quality of trade flow dataset may be undermined by at least two factors and therefore
results need to be viewed in this prism. First, unreported or underreporting of trade data by
16 One third of the economies on the continent are landlocked countries whose trade and development depend
on events beyond their own borders. 17
That is product k is a disappearing product if 1) it was exported to destination market-d in 1995 and 1996, but
2) it exports in 2008 or 2009 were below the threshold of zero dollars, $1000, and $5000.
14
customs officials due to limited institutional capacity to report regularly may be endemic
among African countries. Second, erratic reporting would also affect the analysis in the sense
that an erratically reported product may appear as a new product in the analysis, yet it was
simply undeclared trade previously. I take account of these two factors in the analysis in the
following way:
For the first problem, I rely on the improved data set by BACI database, which attempts to
solve the problem of underreporting and erratic reporting by using mirrored data. BACI data
uses mirror data based on the most reliable trading partner. This quality would partially
alleviate measurement errors that may correlated with the main explanatory variable18
.
The second step, I impose thresholds (time windows) in the definition of a new product-
destination export, both for the number of years of duration of this export and the number of
years since it was first exported. Specifically, I define two time windows:
Yo: The first year of a new product-destination is exported at least Yo after the
beginning of sample.
YT: The new product-destination is exported at least for Yt years. These years
might not be consecutives.
Table 10 shows examples of country-pair product sub-samples that meet the minimum
requirement for the least demanding thresholds (Yo=1, Yt=1) and the most demanding
thresholds (Yo=5, Yt=5) that I will use in my empirical specification. This procedure helps
me to filter the data though does not completely solve the problem of estimating the
probability of products with high hazard rates (low rates of survival), but it helps in terms of
interpreting the results as a true new exported product thus overcoming the simple
measurement errors.
While the use of these time windows to filter the data will not completely solve the problem
of estimating the probability of products with low rates of survival, at least it helps in terms
of interpreting the results as a true new exported product instead of simple measurement
error.
The other potential problem (limitation of my data) worthy of noting on the quality of the
data is that infrastructure related trade frictions data for African countries is only available for
the years 2004-2009. I have therefore built panels for only 6 years with the analysis of these
covariates. This implies that I have further reduced my T & N within my panels. Further still
the product level tariff data does not yield good results and therefore, I have excluded market
access analysis within the current research.
To take account of movement in relative prices during the sample period 1995-2009, I deflate
GDP to yield real GDP variables.
4.Theoretical Framework
This section turns the theoretical framework that forms the backbone of my empirical
approach. Following Melitz (2003), Helpman, Melitz and Yeaple (2004), and Helpman et al
18
See Gaulier, G. & S. Zignago (2010) “BACI: International Trade Database at the Product-level
The 1994-2007 Version”
15
(2008), I adopt a simplified version of heterogeneous-firms trade model by Baldwin (2005) to
structure my empirical work on margins of trade. This framework helps since it allows for
explicit consideration of “zeros” in the export matrix.
The basic ingredients of this framework are well known. Each exporting firms is associated
with one exported varieties; firms are heterogeneous in their marginal costs of production,
and markets are heterogeneous in fixed market-entry costs. The natural result is that not all
firms export to all markets, i.e. the range of varieties exported is endogenous and is
determined by each firm`s marginal cost and market-specific entry costs.
4.1. The Model Set Up
For simplicity, the model works with Dixit-Stiglitz monopolistic competition and a
distribution of firm-level marginal costs generated by a probability distribution (Helpman,
Melitz and Yeaple 2004). Since the intermediate steps are well known, I turn directly to the
fulcrum of the model, namely a typical firm’s cut-off conditions since this governs whether
the firm sell to the various markets.
For the African firm to sell in its own market it will depend on its ability to meet the marginal
cost to produce a variety and still sell a variety at zero profit at least i.e., break even.
Therefore, all firms that cannot breakeven will exit the market. Therefore for producing for
the domestic market, the cut-off conditions as defined as follows:19
oooD
o
BaF
1
/11 (1)
Where D
OF is the cost of entering the domestic market, ooa defines the cut-off marginal cost
(or productivity) for selling a variety in the domestic market, 1 is the constant elasticity of
substitution among varieties. oB is the demand shifter in the African exporter`s market and is
equal 1
o
o
P
E where
oE is the total expenditure in the domestic market and P is the domestic
CES price index for all varieties sold domestically.
Among the African firms that produce for their domestic markets, there will be some firms
with high productivity (low marginal cost) that will export to destination markets. These
firms will, on top of covering the marginal cost of producing a variety, be able to cover the
costs of foreign market-entry. Therefore the exporting cut-off condition is:
dododX
d
BaF
1
/11 (2)
Where X
dF is the fixed cost of exporting to destination market, oda is the cut-off marginal
cost for exporting to destination market-d, 1(1 )od od
is the ‘freeness’ of trade between
exporting nation-o and destination nation-d countries (od is the bilateral trade friction), dB is
the demand shifter in the foreign destination market defined analogously to Eo.
19
See Melitz (2003), Helpman, Melitz and Yeaple (2004), Baldwin (2005) and Helpman, Melitz and Rubinstein
(2008) for details of these calculations. The notation is from Baldwin (2005).

16
These cut-off conditions determine which firms export to which markets and thus define the
zeros in the African trade matrix. Thus, African firms that export to destination market-d
from origin nation-o are defined by:
,
/11
,0
1
dod B
a
odv
od
od
aa
aa
(3)
Using standard CES demand functions and the cut-off conditions, it is easy to show that the
total bilateral exports equal:
,
1
0
11 11/
,0
oo
oda
odod aadGanB
odV od
od
aa
aa
(4)
This is the expression for bilateral trade volume, where ooaaG / defines the conditional
density function, that is G is cut atooa as a typical African firm will only export a variety
conditional on being able to produce it at home. As is well known, this is the basis of
gravity-like estimation of extensive margins. That total expenditure of the destination market
on varieties can be proxied by its GDP. Also the GPD of the exporting African country can
be proxy for on i.e., the exporter`s endowment.
od represents the bilateral freeness of trade
(bilateral trade costs).
This set-up helps to explain a number of observable features of the bilateral trade exports for
African countries particularly changes along the new-variety and new-market margin
(Africa`s extensive margin of trade) in a number of ways. First, change in the cut-off
conditions for a variety, leads to changes in new-product (variety margin) for the African
exports. Second, changes in the market-entry fixed costs, leads to both changes in new-
variety and new-market margin for African exports. Third, Intra-regional trade cooperation in
Africa could increase the freeness of trade between parties to free trade agreements by
reducing border duties on imports, reducing other trade related frictions at the border
including border delays and documentation. That is if the fixed costs of entering a regional
market falls, then a wider range of varieties will be exported to within this market.
These frictions constitute both the variable and fixed costs of exporting within the region.
And a reduction in these costs could result into positive effects for creation of trade along the
new-variety and new-market margins. That is new firms that were previously unable to
export could begin to export within the region creating both the new-variety and new-market
margins of trade within the region. Similar reasoning can be applied with multilateral
liberalisation of trade across the board in reducing variable costs incurred by African
exporting firms.
The empirical section also considers export-learning effects which are outside the model.
Informally, however, the cut-off conditions in the model help clarifies how reductions in
exporting firms’ marginal costs (stemming from learning-by-exporting) could affect the
extensive margin in other markets and varieties.
These testable implications can be summarized as follows:
First, a decline in fixed cost to export X
dF and increase in freeness of trade (reduction
in variable trade costs) od within intra-Africa and its trading partners leads to
discovery of new-varieties and new-markets by African exporting firms.
17
Second, higher export profits as a result of declining fixed costs X
dF and increase in
freeness of tradeod in regional markets, reduces the productivity threshold for
exporting , thus increasing the discovery of new-varieties, and new-markets.20
.
Third, as multilateral, inter-regional, bilateral, unilateral liberalisation takes foot, so
should new markets and new products rather than unilateral preferences merge for
Africa diversified products that would change the trade patterns of Africa.
The empirical work uses equation (4) to investigate the effect of regional trade agreements on
African exporters discovering new-varieties and new-markets. The strategy is to focus on the
bilateral trade flows that switch from zero to a positive value for each potential destination
(210) markets and also changes within the existing trade flows i.e., existing varieties to new
markets or new products to existing markets. This switch is defined at exporter-product-
market level.
5.Empirical Analysis
This section turns the empirical analysis of the questions presented in Section 1. Specifically,
a switch from a zero to a positive entry in the export matrix – either at new-variety level or at
new-market level – is taken as the definition of export diversification. When looking at the
effects of the intra- Africa regional trade agreements as well as other underlying factors in
determining some of Africa`s bilateral trade relationships switching from zero to positive
values, the idea is that these variables affect the extensive margins by lowering marginal
costs or market entry costs. A key hypothesis is that intra-Africa regional trade cooperation
boosts the probability of observing a product switch from zero to positive (discovery of a
new-variety or discovering a new-market). I also associate infrastructure related trade
frictions, bureaucratic frictions, policy shocks, financial underdevelopment and weak
institutions with a negative probability of observing a product switch from zero to positive
trade flow.
5.1. Model Specification: Estimation Equations
Therefore my empirical strategy aims to provide evidence for my three related hypothesis:
HI: The likelihood of discovering a new-variety or new-market increases with an African
country`s membership in an Intra-regional trade cooperation
H2: The likelihood of an African exporter discovering a new-variety or a new-market
increases with the exporters experience in the regional markets and markets in the rest of the
world
H3: The likelihood of an African exporter discovering a new-variety or new-market declines
with presence of infrastructure related trade frictions, policy shocks, financial
underdevelopment, inappropriate FDI and weak institutions supporting exporting activity
For each of these hypotheses, I estimate the change in the likelihood of discovering a new-
product k exported from origin country-o to an existing market-d (or to newly discovered
20 See Bigsten et al (2003) “Do African Manufacturing Firms Learn from Exporting?” University of Oxford

18
market-d) with respect to membership in an intra-regional trade agreement as well others to
other control (underlying factors) variables as specified. I estimate the following equation
using a conditional logit technique.
1 0 1 , 2 , 3 , 4 , 5Pr( 1/ 0) ( _ )..........(5)kodt kodt od t o t d t od t tV V G RTA K V X X
Where (*)G is the logistic cumulative distribution function, kodtV takes a value of 1 if a product
k (at HS 6 digit level) that was not previously exported from origin-o African country to
destination-d market in the range period OY starts being exported in year t and is exported at
least TY years (the thresholds 0Y and TY is being defined in section 3.5 above).
The effect of intra-regional trade cooperation will be tested with the parameter 1 , given for
the variables, Monetary Union, Common Market, Customs Union, and Preferential Trade
Area (PTA) as a dummy taking a value of 1 if the country-pairs are in each of these regional
groupings. It also indicates in some specifications the number of years the country-pair has
effectively been in a regional trade agreement21
. That is, this variable has two specifications:
a dummy variable to proxy if two trading partners are in regional trade agreement and a set of
dummies for each year after the regional trade agreement has been in force. If HI is true, I
expect 1 to be positive and statistically significant. I include a measure of export
experience defined at product level and market level, which is export experience, is exporter-
product specific or exporter-market specific. If H2 is true, I expect 2 to be positive and
statistically significant.
For testing hypothesis H3, I include measures of infrastructure related trade frictions, policy
shocks, financial underdevelopment, inappropriate FDI and weak institutions supporting
exporting activity for African origin country toX , , and if H3 is true, I expect 3 to be negative
and statistically significant.
The rest of the variables in Equation 1 are time-variant controls at different levels. I include
the natural log of the sum of the exporting and importing country GDP, natural log of the
absolute difference in exporter and importing country GDP, the sum of GDP per capita and
the absolute difference in GDP per capita to capture the effects of changing market size (see
Baldwin & Harrigan (2011) for instance) effects of level of development (See Hummels and
Klenow, 2005). I also include the control for trade openness for both the exporter and the
importing country. I estimate each specification separately for intra African trade, and
Africa’s trade with the rest of the world as well as the full sample for the period 1995-2009. I
also include a time trend,t . Some of the conventional time invariant determinants of
bilateral trade flows are not included because my empirical technique inherently directly
deals with such controls as geographical distance, common language, and common border or
land-lockedness. I cluster robust standard errors by country-pair-product level.
5.2. Econometric issues and caveats
There are at least four specific econometric problems that warrant concern in interpretation of
my results. First, regional trade agreements are potentially endogenous, indeed whether
21
The intra-regional trade agreements include those notified by the parties to the WTO, they obtained from
WTO RTA database accessed here http://rtais.wto.org/UI/PublicAllRTAList.aspx
19
regional governments sign a regional trade agreement or not may depend on how many
products are traded and the potential for expansion. In an extreme case (see Grossman and
Helpman 1995), trade agreements are only signed when there is trade diversion and not when
there is trade creation. If RTAs are endogenous, my empirical estimates on new-products or
new-markets may be biased and the effects of RTAs on the extensive margin may be
seriously over-or-under-estimated22
. I have not been able to find a clean solution for this
potential endogeneity problem in the current version of the paper2324
. However, I do believe
my use of country-pair fixed effects should be able to deal to a great extent with this problem
(see Baier & Bergstrand: 2004; 2007) on use of panel data techniques to deal with
endogeneity.
The second potential econometric problem in my empirical analysis is that most of my
covariates do not vary at product level but rather at country level, which would have
warranted the use of aggregate level data rather than product level or transaction level
variation. However, I implement exporter-product-market fixed effects, but also the results
need to be understood as an approximation as I face a trade-off between the loss of
information that is contained at product level and the efficiency of my estimates.
The third plausible limitation with my approach is that my unit of analysis is the exporter-
product-market level (dyadprod), so the structure of the errors may not be homoscedastic. To
correct this problem of heteroscedastic errors, I cluster the standard errors at the dyadprod
level in all specifications.
The fourth econometric caveat is that my conditional logit estimates cannot reveal the
quantitative effects of the change in the covariates on the likelihood of exporting across a
new-product margin or new-market margin. Future research will be devoted on quantifying
the economic effects of the change in covariates on the likelihood of exporting across a new-
product, new-market margin in the next version of the paper.
5.3. Empirical Results and Discussions
As earlier stated, the paper tests three key hypotheses: 1) whether intra-Africa’s regional
trade cooperation increases the likelihood of an African country exporting on the new-
product, new-market margin; 2) whether export experience increases the likelihood of an
African exporter exporting on new-product, new-market margin i.e., whether exporting
activity is subject to learning effects; and 3) whether infrastructure-related trade frictions
and/or market access challenges decrease the likelihood of an African country exporting on
new-product, new-market margin i.e. whether Africa’s export concentration is correlated with
infrastructure-related trade frictions and/or market access challenges.
22
See Baier & Bergstrand (2007) for detailed treatment of endogeneity with FTAs (more interestingly in their
results they find that on average, an FTA approximately doubles two members bilateral trade after 10 years). 23
I am exploring use of instrumental variables (IV) approach following Arcand, Olarreaga and Zoratto (2010)
use as determinants of PTAs 24
See Egger and Larch (2007) for details in the solutions to the problem of interdependence of FTA
membership (i.e., in Baldwin and Jaimovich deal with this problem by using lagged values of the contagion
index to alleviate a great deal of the potential problem of endogeneity that arises from spatial dependency of
FTA formation]
20
Results on hypothesis H1 are presented the tests in Table 12, namely the results for the
effects of an RTA on the likelihood of African countries exporting across a new product-
destination pair limiting the study to products that have been exported somewhere in the past
two years. In the columns 1-3, I report estimates for the new-product margin while in
columns 4-6, I report estimates for the new-market margin. For each of the margins, I show
the effects with full sample in 1st column, intra-African sample (only African countries) in
2nd column, and rest of world sample in the 3rd column respectively. The findings for each
margin show that intra-regional trade arrangements namely the monetary union, common
market, customs union do positively affect the likelihood of African nations exporting across
a new-product margin as well as a new-market margin. Interestingly, the probability is
higher for monetary union and customs union but negative for a weaker form of integration
namely preferential trade agreements (PTAs). The standard errors are estimated by both
clustering at dyadic level and two-way country level. In terms of inference, these results are
always statistically significant when errors are clustered at dyadic level.
For other controls, all the conventional measures of economic size-market size are
statistically significant with dyadic level of clustering of standard errors. The results show
that an increase in real GDP per capita for both exporter and the market tend to increase the
probability of an African nation exporting on the new-product, new-market margin. In
literature this control variable reflects the economic size of the trading partners. It reflects the
available income to spend on a number of varieties from African exporters; the larger the
economic size the higher the probability that African countries will export new varieties. For
brevity purposes these results are not reported here.
Among the other control variables, the absolute GDP per capita difference between the
African exporting nation and destination market-d as included to capture different levels of
development. In some specifications, the coefficient on GDP per capita difference is negative
implying that the richer the market, the less likely an African nation will export to this nation
a new-variety. However, this result is not robust. If I take this variable to reflect differences
in consumer preferences and technology for African trading partners, it’s possible that a wide
gap in GDP per capita could reflect difference tastes and preferences of quality products from
Africa. Therefore, a negative coefficient signifies that rich nations consider African products
inferior and therefore lowers the probability of an African nation exporting its new-product to
these nations. For example, rich countries consumers besides negative quality perception,
they may be biased against African products or towards the goods produced in their own
countries.
Interestingly absolute difference in exporter-importer GDP has a negative effect on the
probability to export on the new-product margin but not on the new-market margin- that is
reducing the chances to export to a new product line, indicating a possible difference in
quality preference between rich and poor inhabitants i.e., the “economic distance” between
the trading partners can depict the quality premium of exports. That is the larger the absolute
difference between the market GDP and the exporter GDP, the less likely for an African
nation to export new products to this market probably because of differences in quality, tests
and preferences between the two countries. When I run the specification by region, the
absolute GDP difference changes sign to positive for intra-African sample. This could signify
that small income differences in Africa and thus closely related consumption preferences-that
is possibly African countries import similar or can afford similar products imported from
each other. This result is also reflected in the prima facie evidence in the description of data
on the evolution of the number of traded products and number of trading partners.
21
The other control variable of interest to note is the measure of trade openness; I included the
total bilateral trade between the exporter and importer as a control for trade openness. Its
coefficient is positive as expected. From literature, previously exported products have a
positive influence on the probability that an exporting African nation will export a new
product or to a new-market.
Table 13 presents results for the test of hypothesis H2 for the impact of exporting experience
on the likelihood of exporting across a new-product and new-market. Like before, columns 1-
3 indicate results for the new-product margin and columns 4-6 indicate results for the new-
market margin with full sample, intra-African sample and the rest of the world samples. It
can be seen that 2 the parameter for exporting experience [which is both exporter-product
specific and exporter-market-product specific]. The result shows that export experience
matters for increasing likelihood to export a new product. The coefficient is positive and
statistically significant for all specifications (robust). This would imply that African exporters
learn by exporting i.e., confirms the presence of learning effects on the new-product, new-
market margins (Africa`s extensive margin of trade). That is a product exported in a previous
market is a launching pad for a new market. The magnitudes and significance of s1 are
similar to those described in table 10, and for other controls, they are all generally statistically
significant and maintain their signs in both specifications-for new-product and new-market
margins and with the same inference strategy i.e., clustering standard errors at the dyadic
level.
For testing of hypothesis H3, I include a variety of measures for infrastructure induced
frictions in estimating equation 5. These include costs to export, the cost of doing business,
time to export or transit delays. I also include measures policy shocks or policy uncertainty
such as exchange rate volatility, a measure of financial underdevelopment, FDI flows as well
as the measure of the quality of export supporting bureaucracy. Table 14 presents the
estimates for parameters in equation 5.
For infrastructure induced trade frictions as well as the bureaucratic frictions, results are as
expected and robust in all specifications. As expected coefficients on costs to export, cost of
doing business, time to export or transitional delays as well as the measure of quality of
export supporting bureaucracy carry a negative but always statistically significant
coefficients.25
26
These results imply that the higher these infrastructure related trade frictions
and bureaucratic frictions, the less likely the African nations to export across the new-
product, new-market margin27
. Columns 1-3 report the results for the new-product margin
and columns 4-6 report results for the new-market margin. Columns 1& 4 report the full
sample specification results. Columns 2 &5 reports intra-African sample specification and
column 3&6 report for the rest of the world (ROW) sample specification. In all these
specification, costs to export, time to export, and cost of doing business do have anti-
diversification effects along the new-product and new-market margin. Overall these results
suggest that a reduction in these kinds of fixed costs for African exporters can play an
important role in diversifying and expansion of African exports and trade partners.
25
See the appendix for how these measures are calculated (Source: WDI, 2011) 26
The nature of transit delays are that they could be increasing the transaction costs facing exporting firms in
Africa. 27
Earlier studies like Bloom and Sachs (1998) had argued that Africa`s true comparative advantage was in
manufactures and services but this could only be realised only in Africa`s coastal regions, since transport costs
in the interior were too prohibitive for trade.
3
22
Measures of policy induced trade frictions are also carrying the right or expected signs, are
always statistically significant at least 5 percent level. In these I have included exchange rate
volatility to proxy policy shocks due to macroeconomic management among African nations.
This covariate has a negative coefficient and always statistically significant. It suggests that
exchange rate volatility has an anti-diversification effects on both new-product and new-
market margins. Largely these results support the hypothesis that exchange rate volatility
reflects macroeconomic mismanagement in most African countries that makes their export
sector uncompetitive in international markets28
. In previous work, Elbadawi (1998)
emphasises the influence of exchange rate misalignment on manufactured exports.
Within this category of variables, I also find that financial underdevelopment in Africa has
deleterious effects on export diversification along the new-product, new-market
diversification. This covariate is the ratio of private credit over GDP for each exporter. In all
specifications, it’s always statistically significant and with a negative sign. The negative
correlation implies that financial underdevelopment among African countries is not
supportive for entrepreneurial activities leading to start-ups in the exporting new products or
to new markets. A deepening of financial services supporting export participation is not
observed in many of the African countries especially private credit, provided to more
enterprises and households to initiate new economic activities.
The other covariate worthy noting in the specification is the FDI. The sign of its coefficient
is negative but switches in some of the specifications. It’s not robust, but always statistically
significant. It indicates ambiguous effects of the FDI inflows. Overall, it carries a negative
sign signifying that FDI inflows in Africa diminish the likelihood of an African nation
exporting across a new-product, new-market margin. Rodrik (2006) among others have
argued that government`s FDI policy is a key reason why China can export products that are
associated with a technology level that is much higher than a country at China`s level of
income.
Similarly, the measure of bureaucracy induced frictions (or measure of quality of export
supporting bureaucracy) is negative and statistically significant in all specifications. I use
polity index for this covariate as a measure of quality of bureaucracy or institutions
supporting export activities in African countries. The negative correlation signifies that the
quality of institutions in Africa affect negatively the probability of exporting across a new-
product, new-market margin. Other studies, though in different frameworks has indicated that
indeed institutions matter for trade flows29
.
As a measure of trade policy changes, I included product level tariff in specification of
equation 5. This is to control for any change in market access conditions. The covariate is
simple average of applied MFN tariff for product k in destination market-d. The sign of the
coefficient on the covariate is negative and statistically significant but sensitive to different
specifications reflecting lack of robustness. But also reduces the size of the sample
significantly because of the quality of data at this level. But overall, higher tariffs do
significantly reduce the chances of exporting across a new-product, or new-market margin.
28
Bigsten et al. (1999) finds limited evidence that firms respond to real exchange rate variation for a sample of
African countries (though a short period was used in the investigation)-macroeconomic policy changes which
changes the real exchange rate will benefit those firms which export, it will reduce the profitability of firms
which are intensive users of imported inputs, which should explain why it’s difficult for African firms to
achieve vertical diversification or quality upgrading. 29
See Anderson and Marcouiller (2002), Caldeira Cabra and Veiga (2010) among others.
23
5.4. Robustness Tests
In the first robustness test, I run a linear probability estimate using the concentration indices
for the products and for the markets respectively (Table 15 and Table 16) as the dependent
variable i.e., testing whether determinants of likelihood to export are also determinants of
export concentration or market concentration. Results are strikingly qualitatively similar as
those obtained by the conditional logit technique with the new-product, new-market margins.
I repeat the exercise, this time testing my hypotheses using the number of products each
country exports as a dependent variable (for product diversification) and the number of
markets each exporter exports to (for market diversification), I once again produce the
qualitatively similar evidence for the three hypotheses (Table 16).
In the third test I change the thresholds in Table 12, in columns 1-3 we restrict the sample to a
product not being exported in the last 2 years conditional on the fact that is exported in the
consecutive next 2, 3, 4, 5 years. The results do not change for Regional trade cooperation
variables. Except for intra-Africa trade when the restriction is for a product line to have been
exported at least for 3 years, the coefficient on intra-Africa RTA is negative but not
significant. For space considerations, I have not included robustness checks results here.
6.Concluding remarks
This paper explores the empirical determinants of export diversification by African nations.
The unconditional evidence shows that diversification of African exports seems to mostly
occur at the new-product margin within Africa and at new-market margin with the rest of the
world as new-and old products. Specifically, 35 percent of the total export growth during
1995-2009 can be explained by the trade of new-product margin and 10 percent by the new-
market margin for trade flows disaggregated at the 6 digit level. Intra-African trade growth
on the new-product margin contributed 18 percent of the total trade growth on the new-
product margin, while contributing 4 percent, on new trading partner’s trade growth (i.e.,
trade growth resulting from the new-market margin) during 1995-2009 within Africa. The
average number of new products discovered in intra-African markets is 232 per year relative
to 365 new-products to non-African markets discovered during the sample period.
Additionally, the average trading partners in intra-Africa trade are 40 (out of 53 potential
trading partners) while the average trading partners for non-African markets is only 94 (out of
157 of potential trading partners) in 2009. This implies that for overall changes in the number
of exported products, intra-African region new-product and new-market margin contributed
significantly to the overall export growth of the new-product & new-market margin created
during the sample period, making intra-African regional trade a crucial channel for Africa’s
export expansion and diversification.
Turning to regression results that control for many covariates, there are three main results.
First, I find a statistically significant correlation between a nation’s participation in intra-
African trade cooperation and export diversification. Participation in customs unions and
monetary unions are found to boost the probability of new product-destination pairs, while
participation in weaker forms of integration, namely preferential trade arrangements (that
often involve little liberalisation) tends to have the opposite effect. These results hold for both
the new-product and new-market margins. Similar evidence is reported by Beine &
Coulombe (2007) for Canadian-U.S. Free Trade Agreement at industry SIC 4 level data and
24
Christodoulopoulou (2010), Foster et al. (2010) at product (HS 6 digit) level. Also in a
broader framework and controlling for endogeneity, Baier & Bergstrand (2007) report that
FTAs on average doubles two members’ bilateral trade. Implying these results are consistent
with literature on the impact of FTAs on trade flows.
Second, I show that exporting experience matters for Africa’s export diversification. African
exporters learning by exporting and both product and market experience help to increase the
chances of African exporters exporting on new-product and new-market margins. This result
provides evidence for the support of the learning effects hypothesis.
Finally, I present evidence that shows infrastructure-related trade frictions have a negative
effect on African export diversification, where such frictions are measured by: costs to
export, time to export, documentation to export, and transit delays. Again the frictions have
negative effects on both the product-margin and destination-margin. This confirms on
African data, findings that have been shown by Freund & Rocha (2010) and Brenton et al.
(2011).
I also show macroeconomic development affect the probability of new product and new
destination exports, specifically exchange rate volatility, financial underdevelopment, and
inappropriate foreign direct investment inflows. Poor quality institutions also lower the
likelihood of observing an expansion along the new-product and new-market margins.
Future research is needed to sharpen the policy recommendation that might follow from this
research. In particular it would be important for future research to explore further which
features of regional trade cooperation promote African export diversification i.e. efforts can
be devoted on a systematic investigation on which characteristics of an RTA and its members
determine the extent to which export diversification increase within the region.
References
Amurgo-Pacheco, Alberto & Pierola, Martha Denisse (2008) “Patterns of Export
Diversification in Developing Countries: Intensive & Extensive Margins,” Policy Research
Working Paper series 4473, The World Bank
Amurgo-Pacheco, Alberto (2006) “Preferential Trade Liberalization and the Range of
Exported Products: The Case of Euro-Mediterranean FTA,” HEI Working Paper No: 18/2006
Anderson J., E. Van Wincoop (2003) “Gravity with Gravitas: a Solution to the Border
Puzzle,” American Economic Review, Vol. 93, No.1 Pp 170-192.
Anderson J., E. Van Wincoop (2003) “Trade Costs,” Journal of Economic Literature, Vol.
42, No.3. pp 691-751.
Anderson. E., James and D. Marcouiller (2002) “Insecurity and the Patterns of Trade: An
Empirical Investigation,” The Review of Economics and Statistics, MIT press, Vol. 84(2), pp
342-352.
Andrew B. Bernard & J. Bradford Jensen (2004) "Why Some Firms Export,"The Review of
Economics and Statistics, MIT Press, vol. 86(2), pages 561-569, May.
Andrew K. Rose, (2000) "One money, one market: the effect of common currencies on
trade,"Economic Policy, CEPR & CES & MSH, vol. 15(30), pages 7-46, 04.
25
Arcand, Jean-Louis & Olarreaga, Marcelo & Zoratto, Laura (2011) "Weak Governments
and Trade Agreements,"CEPR Discussion Papers 8595, C.E.P.R. Discussion Papers.
Arne Bigsten & Paul Collier & Stefan Dercon & Marcel Fafchamps & Bernard Gauthier &
Jan Willem Gunning & Abena Oduro & Remco Oostendorp & Catherine Pattillo &
Soderbom & Francis Teal & Albert Z, (2004) "Do African Manufacturing Firms Learn
from Exporting?,"The Journal of Development Studies, Taylor and Francis Journals, vol.
40(3), pages 115-141.
Arora and Vamvakidis (2005) “China’s Economic Growth: International Spillovers,” IMF
working paper WP/10/165.
Aw, B., Chung, S. and Roberts, M., (2000) “Productivity and Turnover in the Export Market:
Micro Evidence from Taiwan and South Korea”, World Bank Economic Review 14, 65-90.
Baier, Scott L. & Bergstrand, Jeffrey H., (2007) "Do free trade agreements actually
increase members' international trade?"Journal of International Economics, Elsevier, vol.
71(1), pages 72-95, March.
Baier, Scott L. & Bergstrand, Jeffrey H., (2007) "Do free trade agreements actually
increase members' international trade?,"Journal of International Economics, Elsevier, vol.
71(1), pages 72-95, March.
Baldwin and Harrigan (2010) “Zeros, Quality and Space: Trade Theory and Trade Evidence”
American Economic Journal: Microeconomics 3 pp 60-88.
Baldwin, Richard & Krugman, Paul, (1989) "Persistent Trade Effects of Large Exchange
Rate Shocks,"The Quarterly Journal of Economics, MIT Press, vol. 104(4), pages 635-54,
November
Baldwin, Richard and Virginia Di Nino (2006) “Euros and Zeros: The common Currency
Effect on Trade in New Goods” CEPR discussion paper No. 5973
Baldwin, Richard, (1988) "Hyteresis in Import Prices: The Beachhead Effect,"American
Economic Review, American Economic Association, vol. 78(4), pages 773-85, September.
Baldwin, Richard, (1990) "Hysteresis in Trade,"Empirical Economics, Springer, vol. 15(2),
pages 127-42.
Baliamoune-Lutz (2010) “Growth by Destination (Where you Export Matters): Trade with
China and Growth in African Countries” International Centre for Economic Research,
Working Paper No. 22/2010.
Baltagi, B.H. (2005): Econometric Analysis of Panel Data, Third edition.
Beine, M. & S. Coulombe, (2007) "Economic integration and the diversification of
regional exports: evidence from the Canadian--U.S. Free Trade Agreement,"Journal of
Economic Geography, Oxford University Press, vol. 7(1), pages 93-111, January.
Békés, G and B Muraközy (2012), "Temporary trade and heterogeneous firms," Journal of
International Economics 87, 232-246.
Bergestrand (1985) “The Gravity Equation in International Trade: Some Microeconomic
Foundations and Empirical Evidence,” The Review of Economics and Statistics, Vol.67 No.3
pp. 474-481
Bernard A B, Jensen JB, Schott PK (2006) “Trade Costs, Firms, and Productivity,” Journal
of Monetary Economics.53 (5): 917-37.
26
Bernard A.B., J. Eaton, J.B. Jensen and S. Kortum (2003) “Plants and Productivity in
International Trade,” American Economic Review, Vol.93, No.4, 1268-1290.
Bernard AB, Eaton J, Jensen JB, Kortum SS (2003) “Plants and Productivity in International
Trade,” American Economic Review, vol. 93(4), pages 1268-1290
Bernard AB, Jensen JB (1995) “Exporters, Jobs, and Wages in US Manufacturing 1976-87,”
Brookings Papers on Economic Activity: Microeconomics
Bernard AB, Jensen JB (1997) “Exporters, Skill Upgrading and the Wage Gap,” Journal of
International Economics
Bernard AB, Jensen, JB (1999) “Exceptional Exporter Performance: Cause, Effect, or Both?”
Journal of International Economics 47(1): 1-25.
Bernard AB, Redding SJ, Schott PK (2007) “Comparative Advantage and Heterogeneous
Firms,” Review of Economic Studies. 74: 31-66.
Bernard and Wagner (2001) “Export Entry and Exit by German Firms,” Review of World
Economics Vol.137, No.1, pp.105-123
Bernard, Andrew B, J. Bradford Jensen (1997) “Exporters, Skills Upgrading, and the Wage
Gap,” Journal of International Economics Vol. 47 #1 Pp 1-25.
Bernard, Andrew B., J. Bradford Jensen, Stephen J. Redding, and Peter K. Schott (2007)
“Firms in International Trade,” Journal of Economic Perspectives –Volume 21, No.3 pp 105-
130.
Bernard, Andrew B., J.Bradford Jensen and Peter K. Schott, (2006) “Trade Costs, Firms and
Productivity,” Journal of Monetary Economics 53(5)
Bernard, Andrew B., Jonathan Eaton, J. Bradford Jensen, and Samuel S. Kortum, (2003)
“Plants and Productivity in International Trade,” American Economic Review, 93(4), 1268-
16.
Bernasconi (2009) “New Evidence for the Linder Hypothesis and the two Extensive Margins
of Trade,” University of Zurich.
Bloom, D. and Sachs, J. (1998) “Geography, Demography, and Economic Growth in Africa,”
Brookings Papers on Economic Activity, No.2, 207-95.
Bloom, D.E. and Jeffrey D. Sachs (1998) “Geography, Demography, and Economic Growth
in Africa,” Harvard Institute for International Development, Harvard University
Brenton P., O. Cadot and M. Pierola (2012) “Pathways to African Export Sustainability,” The
World Bank, Washington D.C.
Cameron, Colin A. and Pravin K. Trivedi, (2005) “Microeconometrics, Methods and
Applications” New York: Cambridge University Press.
Campa, J.M., (2004) “Exchange rates and trade: how important is hysteresis in trade?”
European Economic Review 48, 527–548.
Campbell J, Hopenhayn H (2005) “Market Size Matters,” Journal of Industrial Economics.
53: 1-25.
Christodoulopoulou, Styliani (2010): “THE Effects of Multilateral Trade Liberalization on
the Extensive and the Intensive Margins of Trade” unpublished
Das M, Roberts MJ, and Tybout .J (2007) “Market Entry Costs, Producer Heterogeneity and
Export Dynamics,” Econometrica, 75(3): 837-73.
27
Debaere, P. and S. Mostashari (2010), “Do Tariffs Matter for the Extensive Margin of
International Trade? An Empirical Analysis,” Journal of International Economics, Vol. 35.
81, No.2, pp.163-169.
Dixit, Avinash K, (1989) "Entry and Exit Decisions under Uncertainty,"Journal of
Political Economy, University of Chicago Press, vol. 97(3), pages 620-38, June.
Dixit, Avinash K, (1989) "Hysteresis, Import Penetration, and Exchange Rate Pass-
Through,"The Quarterly Journal of Economics, MIT Press, vol. 104(2), pages 205-28, May.
Dornbusch, Rudiger & Fischer, Stanley & Samuelson, Paul A, (1977) "Comparative
Advantage, Trade, and Payments in a Ricardian Model with a Continuum of
Goods,"American Economic Review, American Economic Association, vol. 67(5), pages
823-39, December.
Dutt, Pushan & Mihov, Ilian & Van Zandt, Timothy (2011) "Does WTO Matter for the
Extensive and the Intensive Margins of Trade?"CEPR Discussion Papers 8293, C.E.P.R.
Discussion Papers.
Eaton, Jonathan, Samuel Kortum, and Francis Kramarz, (2004) “Dissecting Trade: Firms,
Industries, and Export Destination,” American Economic Review Vol. 94, Pp.150-154
Egger, Peter & Larch, Mario, 2008 "Interdependent preferential trade agreement
memberships: An empirical analysis,"Journal of International Economics, Elsevier, vol.
76(2), pages 384-399, December
Elbadawi (1999) “Can Africa Export Manufactures?” World Bank Policy Research Paper
No.2120, Washington, DC
Evans (2003) “The Economic Significance of National Border Effects,” The American
Economic Review, Vol. 93. No. 4 pp.1291-1312
Evenett, Simon J. and Anthony J. Venables (2002) “Export Growth in Developing Countries:
Market Entry and Bilateral Trade Flows” University of Bern, Working paper, mimeo.
Farazi Binti (2011) “Export Diversification in East Asian Economies: Some Factors
Affecting the Scenario,” International Journal of Social Science and Humanity, Vol. 1, No. 1,
May 2011
Feenstra and Kee (2004) “On the Measurement of Product Variety in Trade,” American
Economic Review Vol. 94, No.2
Felbemayer and Kohler (2006) “Exploring the Intensive and Extensive Margins of World
Trade” Review of World Economics, Vol. 142(4)
Foster, Neil & Poeschl, Johannes & Stehrer, Robert, 2011. "The impact of Preferential Trade
Agreements on the margins of international trade," Economic Systems, Elsevier, vol. 35(1),
pages 84-97, March.
Foster, Neil & Poeschl, Johannes & Stehrer, Robert, 2011. "The impact of Preferential
Trade Agreements on the margins of international trade,"Economic Systems, Elsevier,
vol. 35(1), pages 84-97, March.
Frankel, Jeffrey A. (1997) “Regional Trading Blocs in the World Trading System”
Washington, DC: Institute of International Economics
Frankel, Jeffrey A.; Stein, Ernesto and Wei, Shang-jin (1995) “Trading Blocs and the
Americas: The Natural, the Unnatural, and the Supernatural,” Journal of Development
Economics, 47(1), PP.61-95.
28
Frazer and van Biesebroeck (2010) “Trade Growth under the African Growth and
Opportunity Act,” The Review of Economics and Statistics, 92(1):128-144
Freund, Caroline & Rocha, Nadia (2010) "What constrains Africa's exports?" Policy
Research Working Paper Series 5184, The World Bank.
Freund, Caroline & Rocha, Nadia, 2010 "What constrains Africa's exports?"Policy
Research Working Paper Series 5184, The World Bank.
Gamberoni, E., (2007) “Do Unilateral Trade Preferences help Export Diversification? An
Investigation of the Impact of European Unilateral Trade Preferences on the Extensive and
Intensive margin of Trade,” IHEID working paper 17-2007
Gaulier and Zignago (2010) “BACI: International Trade Database at the Product-level the
1994-2007 Version,” CEPII working paper 2010-23
Greene, William (2004) “The Behaviour of the Maximum Likelihood Estimator of Limited
Dependent Variable Models in the Presence of Fixed Effects,” Econometrics Journal, Vol. 7,
No. 1, pp. 98-119.
Grossman, Gene M & Helpman, Elhanan, 1995 "The Politics of Free-Trade
Agreements,"American Economic Review, American Economic Association, vol. 85(4),
pages 667-90, September.
Helpman E, Melitz MJ, Rubinstein Y (2008) “Estimating Trade Flows: Trading Partners and
Trading Volumes” Quarterly Journal of Economics, 123(2): 441-87.
Helpman E, Melitz MJ, Yeaple SR (2004) “Export Versus FDI with Heterogeneous Firms”
American Economic Review. 94(1): 300-16.
Helpman, E. and P. Krugman (1985), Market Structure and International Trade. MIT Press
Helpman, Elhan, Melitz, Marc and Yona Rubinstein (2007), “Estimating Trade Flows:
Trading Partners and Trading Volumes,” Quarterly Journal of Economics, Vol.123 # 2 Pp
441-.487
Helpman, Elhanan, and Paul R. Krugman (1985) “Market Structure and Foreign Trade:
Increasing Returns, Imperfect Competition, and the International Economy” Cambridge, MA:
MIT press.
Hummels, David and Peter Klenow (2005) “The Variety and Quality of a Nation’s Exports”
American Economic Review, 95, 704-723.
Jonathan Eaton & Samuel Kortum & Francis Kramarz, (2011) "An Anatomy of
International Trade: Evidence from French Firms,"Econometrica, Econometric Society,
vol. 79(5), pages 1453-1498, 09.
Jonathan Eaton & Samuel Kortum, (2002) "Technology, Geography, and
Trade,"Econometrica, Econometric Society, vol. 70(5), pages 1741-1779, September.
Kang (2006) “Finding the Order of Export Destination and Product: Evidence from Korea”
Journal of Korea Trade, Vol.10, No.1
Kehoe, T. J. and K.J. Ruhl (2003), “How Important is the New Goods Margin in International
Trade?” Federal Reserve Bank of Minneapolis Staff Report 324.
Manuel Herédia Caldeira Cabra & Paula Veiga (2010) “Determinants of Export
Diversification and Sophistication in Sub-Saharan Africa” mimeo

29
McCallum, J. (1995) “National Borders Matter: Canada-U.S. Regional Trade Patterns” The
American Economic Review, Vol. 85, No. 3, (Jun., 1995), pp. 615-623
Melitz, M.J., (2003) “The Impact of Trade on Intra-Industry Reallocations and Aggregate
Industry Productivity,” Econometrica 71(6): 1695-1725
Michel Beine & Serge Coulombe, (2007) "Economic integration and the diversification of
regional exports: evidence from the Canadian--U.S. Free Trade Agreement," Journal of
Economic Geography, Oxford University Press, vol. 7(1), pages 93-111.
Paul Brenton & Christian Saborowski & Erik von Uexkull, 2010. "What Explains the Low
Survival Rate of Developing Country Export Flows?,"World Bank Economic Review,
World Bank Group, vol. 24(3), pages 474-499, December.
Redding S. (2011) “Theories of Heterogeneous Firms and Trade” Annual Review of
Economics.
Redding, Stephen J. (2011) “Theories of Heterogeneous Firms and Trade,” Annual Review of
Economics, 3, 77-105.
Richard Baldwin & James Harrigan, (2011) "Zeros, Quality, and Space: Trade Theory and
Trade Evidence,"American Economic Journal: Microeconomics, American Economic
Association, vol. 3(2), pages 60-88, May.
Richard Baldwin, (2005) "Heterogeneous Firms and Trade: Testable and Untestable
Properties of the Melitz Model,"NBER Working Papers 11471, National Bureau of
Economic Research, Inc.
Robert Barro & Silvana Tenreyro, (2007) "Economic Effects of Currency
Unions,"Economic Inquiry, Western Economic Association International, vol. 45(1), pages
1-23, 01.
Robert Barro & Silvana Tenreyro, (2007) "Economic Effects of Currency
Unions,"Economic Inquiry, Western Economic Association International, vol. 45(1), pages
1-23, 01.
Roberts MJ, Tybout J (1997) “The Decision to Export in Colombia: An Empirical Model of
Entry with Sunk Costs” American Economic Review. 87(4): 545-64.
Roberts, Mark J. and James Tybout, (1997) “The Decision to Export in Colombia: An
Empirical model of Entry with Sunk Costs”, American Economic Review, 87(4), 545-64.
Rodrik (2006) “What’s So Special about China’s Exports?” China and World Economy/1-19,
Vol. 14, No.5
Tibor Besedes & Thomas Prusa, 2006. "Ins, outs, and the duration of trade,"Canadian
Journal of Economics, Canadian Economics Association, vol. 39(1), pages 266-295,
February.
Van Biesebroeck, Johannes (2005) “Exporting Raises Productivity in Sub-Saharan African
Manufacturing firms”, Journal of International Economics, 67 (2), 373-391.
Vicard, Vincent, 2011. "Determinants of successful regional trade
agreements,"Economics Letters, Elsevier, vol. 111(3), pages 188-190, June.
World Bank (2010), “World Development Indicators”. World Bank, Washington DC.
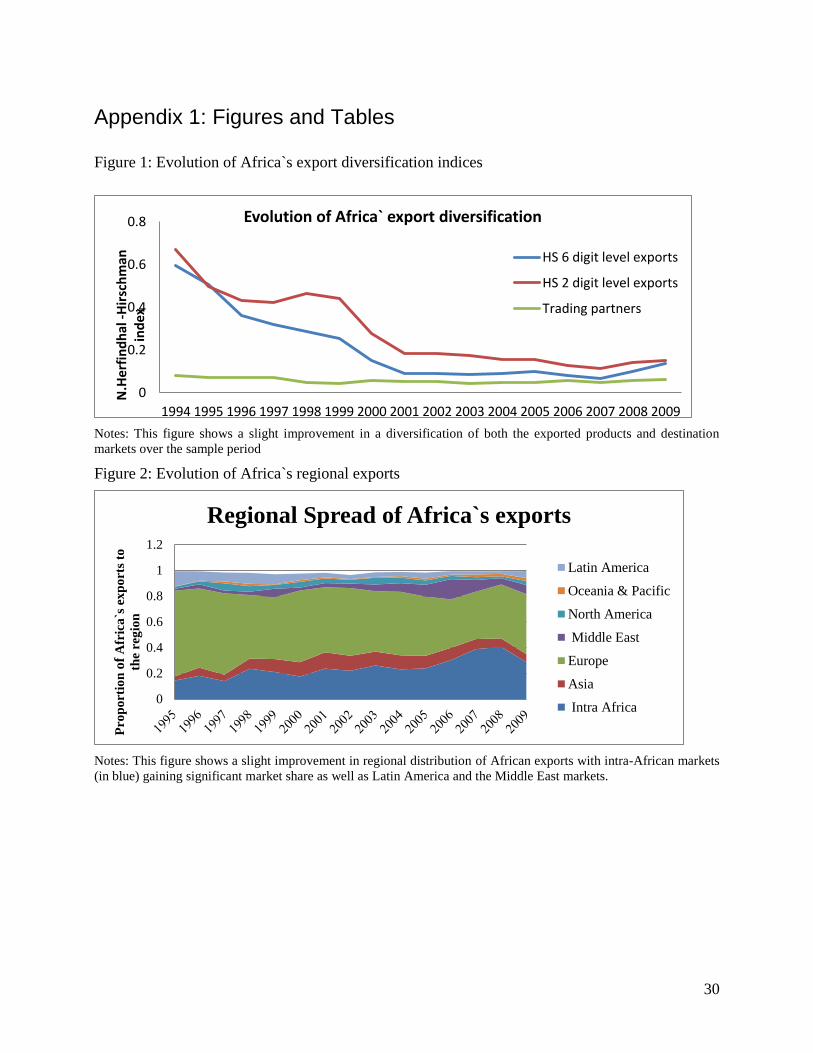
30
Appendix 1: Figures and Tables
Figure 1: Evolution of Africa`s export diversification indices
Notes: This figure shows a slight improvement in a diversification of both the exported products and destination
markets over the sample period
Figure 2: Evolution of Africa`s regional exports
Notes: This figure shows a slight improvement in regional distribution of African exports with intra-African markets
(in blue) gaining significant market share as well as Latin America and the Middle East markets.
0
0.2
0.4
0.6
0.8
1994 1995 1996 1997 1998 1999 2000 2001 2002 2003 2004 2005 2006 2007 2008 2009
N.H
erfi
nd
hal
-H
irsc
hm
an
ind
ex
Evolution of Africa` export diversification
HS 6 digit level exports
HS 2 digit level exports
Trading partners
0
0.2
0.4
0.6
0.8
1
1.2
Pro
po
rtio
n o
f A
fric
a`s
exp
ort
s to
the
reg
ion
Regional Spread of Africa`s exports
Latin America
Oceania & Pacific
North America
Middle East
Europe
Asia
Intra Africa
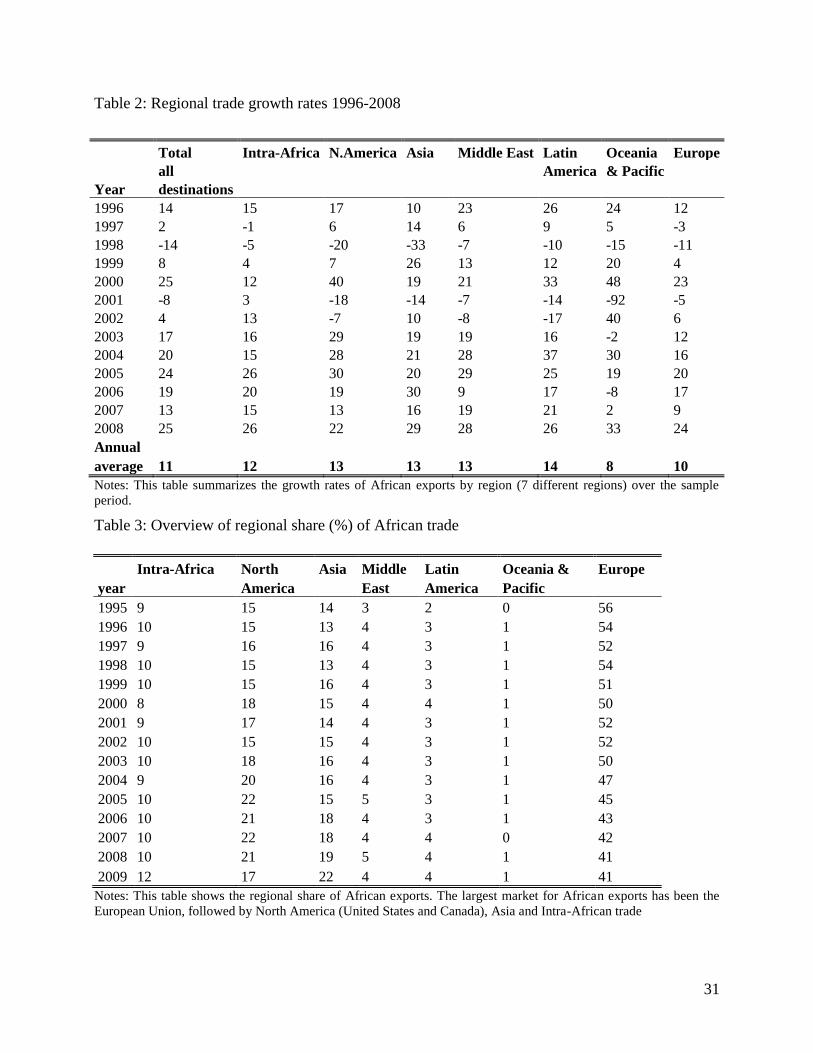
31
Table 2: Regional trade growth rates 1996-2008
Total Intra-Africa N.America Asia Middle East Latin Oceania Europe
all
America & Pacific
Year destinations
1996 14 15 17 10 23 26 24 12
1997 2 -1 6 14 6 9 5 -3
1998 -14 -5 -20 -33 -7 -10 -15 -11
1999 8 4 7 26 13 12 20 4
2000 25 12 40 19 21 33 48 23
2001 -8 3 -18 -14 -7 -14 -92 -5
2002 4 13 -7 10 -8 -17 40 6
2003 17 16 29 19 19 16 -2 12
2004 20 15 28 21 28 37 30 16
2005 24 26 30 20 29 25 19 20
2006 19 20 19 30 9 17 -8 17
2007 13 15 13 16 19 21 2 9
2008 25 26 22 29 28 26 33 24
Annual average 11 12 13 13 13 14 8 10
Notes: This table summarizes the growth rates of African exports by region (7 different regions) over the sample
period.
Table 3: Overview of regional share (%) of African trade
Intra-Africa North Asia Middle Latin Oceania & Europe
year America East America Pacific
1995 9 15 14 3 2 0 56
1996 10 15 13 4 3 1 54
1997 9 16 16 4 3 1 52
1998 10 15 13 4 3 1 54
1999 10 15 16 4 3 1 51
2000 8 18 15 4 4 1 50
2001 9 17 14 4 3 1 52
2002 10 15 15 4 3 1 52
2003 10 18 16 4 3 1 50
2004 9 20 16 4 3 1 47
2005 10 22 15 5 3 1 45
2006 10 21 18 4 3 1 43
2007 10 22 18 4 4 0 42
2008 10 21 19 5 4 1 41
2009 12 17 22 4 4 1 41
Notes: This table shows the regional share of African exports. The largest market for African exports has been the
European Union, followed by North America (United States and Canada), Asia and Intra-African trade

32
Table 4: Distribution of African exports by main destination markets (%)
Rank 1995 2000 2005 2009
1 USA 13.7 USA 17.2 USA 19.9 USA 15.7
2 France 10.0 Italy 10.2 Italy 9.1 China 9.8
3 Italy 9.8 France 7.8 France 7.4 Italy 8.6
4 Germany 7.8 Spain 6.5 Spain 6.8 France 7.5
5 Britain 5.8 Britain 6.5 China 6.4 India 5.2
6 Spain 5.5 Germany 6.1 Germany 5.0 Germany 4.8
7 Belgium 5.1 India 3.8 Britain 4.9 Britain 3.7
8 Japan 4.2 Belgium 3.4 Netherlands 3.1 Netherlands 3.5
9 Netherlands 3.6 Japan 3.0 Japan 3.1 Spain 3.4
10 S.korea 2.0 China 3.0 Belgium 2.8 Japan 2.4
11 India 1.8 Netherlands 2.8 Brazil 2.0 Switzerland 2.3
12 Portugal 1.5 Brazil 2.2 Turkey 2.0 Brazil 2.1
13 Hong Kong 1.5 Turkey 1.9 India 1.7 Belgium 2.0
14 Brazil 1.4 S. Korea 1.8 Canada 1.6 South Africa 1.7
15 Switzerland 1.2 Switzerland 1.7 Switzerland 1.5 Canada 1.7
16 Turkey 1.2 Portugal 1.2 Portugal 1.4 Turkey 1.6
17 Canada 1.1 Canada 1.2 South Africa 1.4 S. Korea 1.2
18 Zimbabwe 1.1 South Africa 0.7 S. Korea 1.1 Portugal 1.2
19 Taiwan 1.0 Taiwan 0.6 United Arab Emirates 0.7 Equatorial Guinea 1.0
20 China 1.0 Saudi Arabia 0.6 Saudi Arabia 0.7 Nigeria 0.9 Total proportion of top
20 80.5 82.3 82.5 80.4
Notes: This table shows the major destination of African exports by share considering a five year moving average. United States
remains the most single important market, recently followed by China.
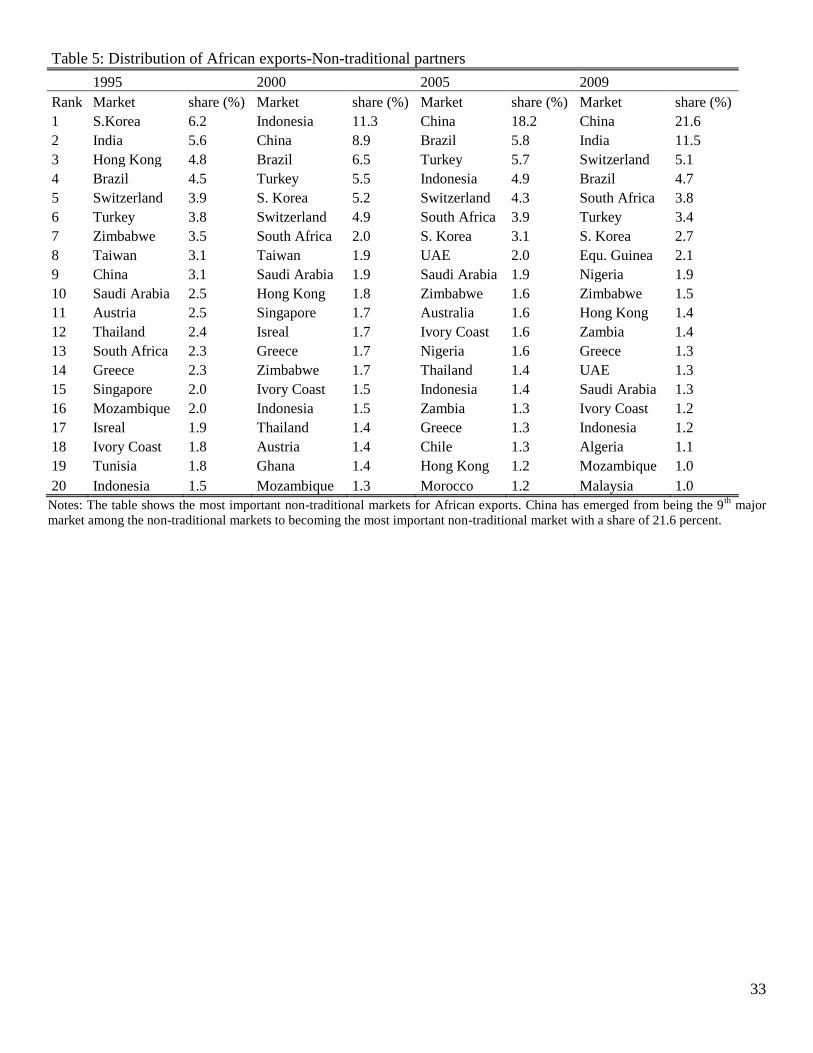
33
Table 5: Distribution of African exports-Non-traditional partners
1995 2000 2005 2009
Rank Market share (%) Market share (%) Market share (%) Market share (%)
1 S.Korea 6.2 Indonesia 11.3 China 18.2 China 21.6
2 India 5.6 China 8.9 Brazil 5.8 India 11.5
3 Hong Kong 4.8 Brazil 6.5 Turkey 5.7 Switzerland 5.1
4 Brazil 4.5 Turkey 5.5 Indonesia 4.9 Brazil 4.7
5 Switzerland 3.9 S. Korea 5.2 Switzerland 4.3 South Africa 3.8
6 Turkey 3.8 Switzerland 4.9 South Africa 3.9 Turkey 3.4
7 Zimbabwe 3.5 South Africa 2.0 S. Korea 3.1 S. Korea 2.7
8 Taiwan 3.1 Taiwan 1.9 UAE 2.0 Equ. Guinea 2.1
9 China 3.1 Saudi Arabia 1.9 Saudi Arabia 1.9 Nigeria 1.9
10 Saudi Arabia 2.5 Hong Kong 1.8 Zimbabwe 1.6 Zimbabwe 1.5
11 Austria 2.5 Singapore 1.7 Australia 1.6 Hong Kong 1.4
12 Thailand 2.4 Isreal 1.7 Ivory Coast 1.6 Zambia 1.4
13 South Africa 2.3 Greece 1.7 Nigeria 1.6 Greece 1.3
14 Greece 2.3 Zimbabwe 1.7 Thailand 1.4 UAE 1.3
15 Singapore 2.0 Ivory Coast 1.5 Indonesia 1.4 Saudi Arabia 1.3
16 Mozambique 2.0 Indonesia 1.5 Zambia 1.3 Ivory Coast 1.2
17 Isreal 1.9 Thailand 1.4 Greece 1.3 Indonesia 1.2
18 Ivory Coast 1.8 Austria 1.4 Chile 1.3 Algeria 1.1
19 Tunisia 1.8 Ghana 1.4 Hong Kong 1.2 Mozambique 1.0
20 Indonesia 1.5 Mozambique 1.3 Morocco 1.2 Malaysia 1.0
Notes: The table shows the most important non-traditional markets for African exports. China has emerged from being the 9th
major
market among the non-traditional markets to becoming the most important non-traditional market with a share of 21.6 percent.
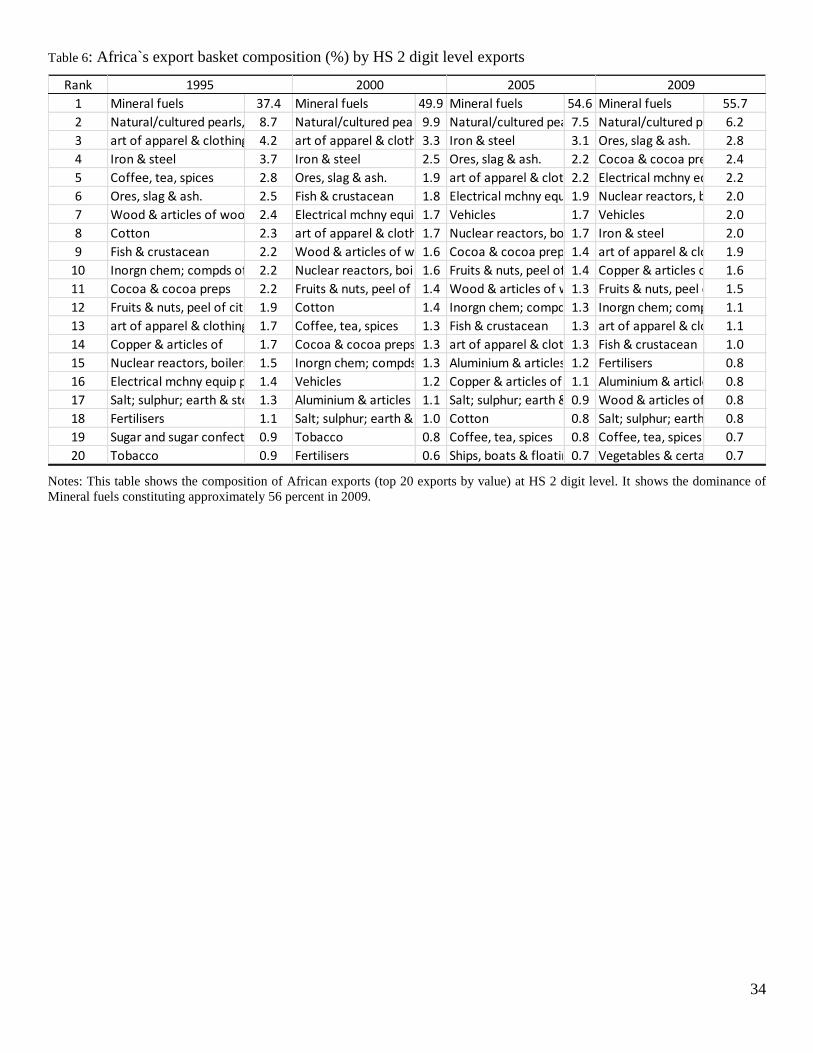
34
Table 6: Africa`s export basket composition (%) by HS 2 digit level exports
Notes: This table shows the composition of African exports (top 20 exports by value) at HS 2 digit level. It shows the dominance of
Mineral fuels constituting approximately 56 percent in 2009.
Rank
1 Mineral fuels 37.4 Mineral fuels 49.9 Mineral fuels 54.6 Mineral fuels 55.7
2 Natural/cultured pearls, prec stone8.7 Natural/cultured pearls, prec stone9.9 Natural/cultured pearls, prec stone7.5 Natural/cultured pearls, prec stone6.2
3 art of apparel & clothing access4.2 art of apparel & clothing access3.3 Iron & steel 3.1 Ores, slag & ash. 2.8
4 Iron & steel 3.7 Iron & steel 2.5 Ores, slag & ash. 2.2 Cocoa & cocoa preps 2.4
5 Coffee, tea, spices 2.8 Ores, slag & ash. 1.9 art of apparel & clothing access2.2 Electrical mchny equip parts2.2
6 Ores, slag & ash. 2.5 Fish & crustacean 1.8 Electrical mchny equip parts1.9 Nuclear reactors, boilers,2.0
7 Wood & articles of wood 2.4 Electrical mchny equip parts1.7 Vehicles 1.7 Vehicles 2.0
8 Cotton 2.3 art of apparel & clothing access1.7 Nuclear reactors, boilers,1.7 Iron & steel 2.0
9 Fish & crustacean 2.2 Wood & articles of wood1.6 Cocoa & cocoa preps 1.4 art of apparel & clothing access1.9
10 Inorgn chem; compds of prec mtl2.2 Nuclear reactors, boilers,1.6 Fruits & nuts, peel of citrus1.4 Copper & articles of 1.6
11 Cocoa & cocoa preps 2.2 Fruits & nuts, peel of citrus1.4 Wood & articles of wood1.3 Fruits & nuts, peel of citrus1.5
12 Fruits & nuts, peel of citrus1.9 Cotton 1.4 Inorgn chem; compds of prec mtl1.3 Inorgn chem; compds of prec mtl1.1
13 art of apparel & clothing access1.7 Coffee, tea, spices 1.3 Fish & crustacean 1.3 art of apparel & clothing access1.1
14 Copper & articles of 1.7 Cocoa & cocoa preps 1.3 art of apparel & clothing access1.3 Fish & crustacean 1.0
15 Nuclear reactors, boilers, 1.5 Inorgn chem; compds of prec mtl1.3 Aluminium & articles of1.2 Fertilisers 0.8
16 Electrical mchny equip parts1.4 Vehicles 1.2 Copper & articles of 1.1 Aluminium & articles of0.8
17 Salt; sulphur; earth & ston; plaster1.3 Aluminium & articles of1.1 Salt; sulphur; earth & ston; plaster0.9 Wood & articles of wood0.8
18 Fertilisers 1.1 Salt; sulphur; earth & ston; plaster1.0 Cotton 0.8 Salt; sulphur; earth & ston; plaster0.8
19 Sugar and sugar confectionary0.9 Tobacco 0.8 Coffee, tea, spices 0.8 Coffee, tea, spices 0.7
20 Tobacco 0.9 Fertilisers 0.6 Ships, boats & floating structure 0.7 Vegetables & certain roots0.7
1995 2000 2005 2009

35
Table 7: New-Product margin and its contribution to African exports 1995-2009
% % of intra-Africa
% of
% of
New of new new products in Disappearing disappearing Permanent
permanent
year Product margin Products new product margin Products products products products 1995 411 37 16 267 24 351 39 1996 429 35 18 278 23 351 42 1997 469 40 13 304 26 351 34 1998 496 37 20 322 24 351 39 1999 516 33 18 335 22 351 45 2000 552 39 15 359 26 351 35 2001 556 27 21 361 18 351 55 2002 617 30 23 401 20 351 50 2003 675 30 24 438 20 351 50 2004 689 31 18 447 22 351 47 2005 772 35 17 501 24 351 41 2006 788 31 22 512 20 351 49 2007 868 38 18 564 25 351 37 2008 928 38 21 603 25 351 37 2009 739 46 24 480 30 351 24
Notes: this table shows the evolution of the new-product margin of African trade-the new product margin as well as the share of the
new products in the export growth
Table 8: New-market margin and its contribution to African exports 1995-2009
New
% of New
% of Intra-Africa Av. Number of Av. Number of Average number of
Market Market New market Intra African Row markets destination markets for
year
Margin Margin Margin Markets per exporter for African exports each product 1995 7 11 3 37 90 31 1996 8 13 2 35 94 33 1997 9 14 2 36 97 36 1998 9 15 3 40 97 37 1999 9 12 3 40 99 38 2000 10 9 2 37 99 40 2001 10 12 2 39 99 40 2002 11 13 2 44 101 43 2003 11 12 2 43 106 46 2004 12 12 3 40 109 47 2005 13 9 2 37 103 49 2006 13 8 2 39 109 49 2007 14 7 2 44 109 51 2008 14 6 1 46 106 53 2009 13 8 2 44 107 49
Notes: this table shows the evolution of the new-market margin of African trade-the new market margin as well as the share of the
new markets in the export growth in Africa
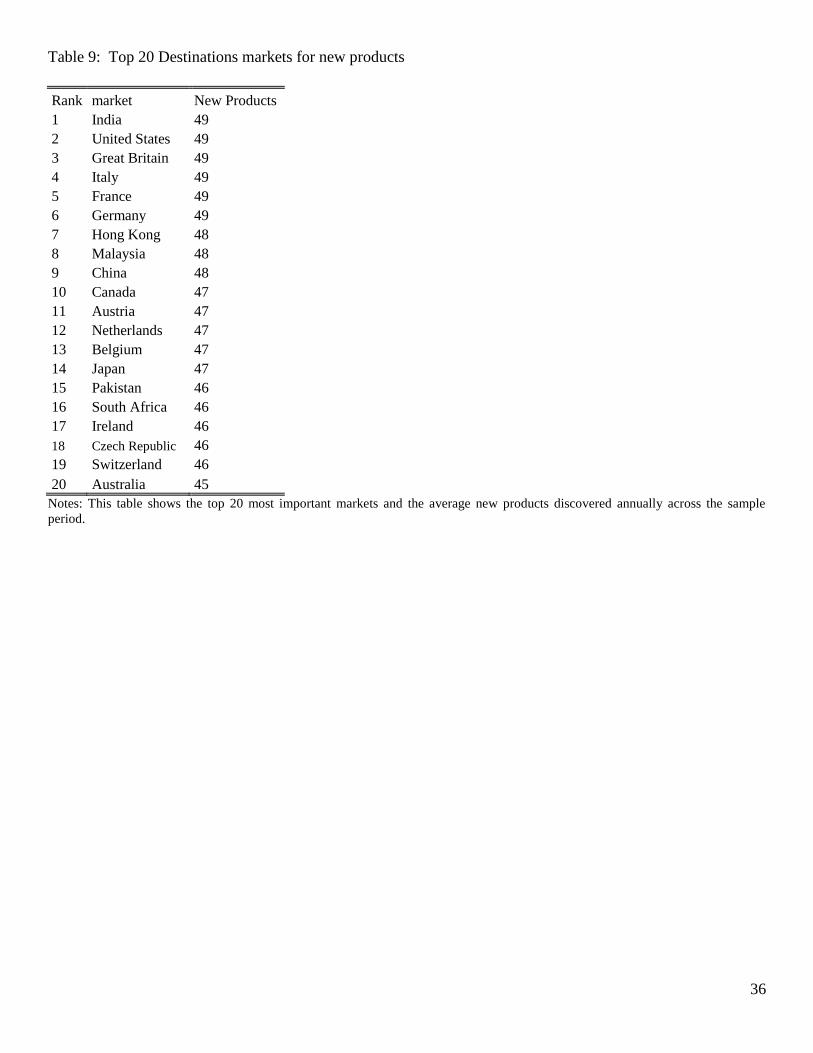
36
Table 9: Top 20 Destinations markets for new products
Rank market New Products
1 India 49
2 United States 49
3 Great Britain 49
4 Italy 49
5 France 49
6 Germany 49
7 Hong Kong 48
8 Malaysia 48
9 China 48
10 Canada 47
11 Austria 47
12 Netherlands 47
13 Belgium 47
14 Japan 47
15 Pakistan 46
16 South Africa 46
17 Ireland 46
18 Czech Republic 46
19 Switzerland 46
20 Australia 45
Notes: This table shows the top 20 most important markets and the average new products discovered annually across the sample
period.
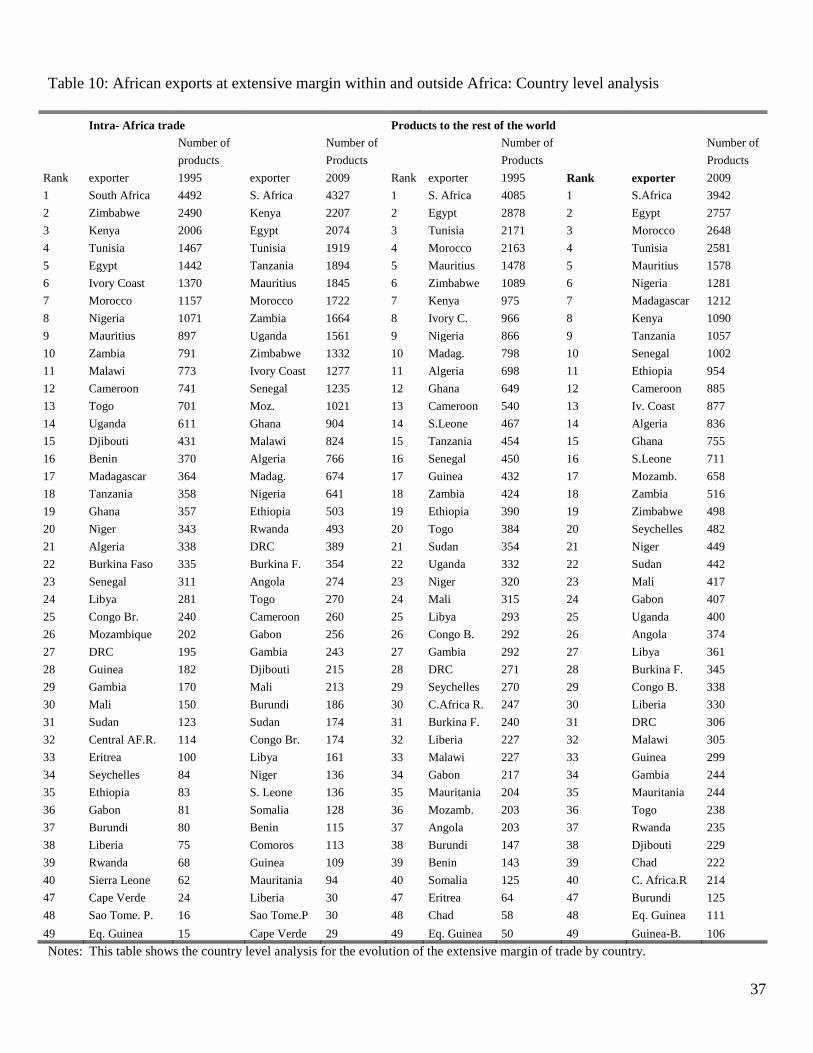
37
Table 10: African exports at extensive margin within and outside Africa: Country level analysis
Intra- Africa trade Products to the rest of the world
Number of
Number of
Number of
Number of
products
Products
Products
Products
Rank exporter 1995 exporter 2009 Rank exporter 1995 Rank exporter 2009
1 South Africa 4492 S. Africa 4327 1 S. Africa 4085 1 S.Africa 3942
2 Zimbabwe 2490 Kenya 2207 2 Egypt 2878 2 Egypt 2757
3 Kenya 2006 Egypt 2074 3 Tunisia 2171 3 Morocco 2648
4 Tunisia 1467 Tunisia 1919 4 Morocco 2163 4 Tunisia 2581
5 Egypt 1442 Tanzania 1894 5 Mauritius 1478 5 Mauritius 1578
6 Ivory Coast 1370 Mauritius 1845 6 Zimbabwe 1089 6 Nigeria 1281
7 Morocco 1157 Morocco 1722 7 Kenya 975 7 Madagascar 1212
8 Nigeria 1071 Zambia 1664 8 Ivory C. 966 8 Kenya 1090
9 Mauritius 897 Uganda 1561 9 Nigeria 866 9 Tanzania 1057
10 Zambia 791 Zimbabwe 1332 10 Madag. 798 10 Senegal 1002
11 Malawi 773 Ivory Coast 1277 11 Algeria 698 11 Ethiopia 954
12 Cameroon 741 Senegal 1235 12 Ghana 649 12 Cameroon 885
13 Togo 701 Moz. 1021 13 Cameroon 540 13 Iv. Coast 877
14 Uganda 611 Ghana 904 14 S.Leone 467 14 Algeria 836
15 Djibouti 431 Malawi 824 15 Tanzania 454 15 Ghana 755
16 Benin 370 Algeria 766 16 Senegal 450 16 S.Leone 711
17 Madagascar 364 Madag. 674 17 Guinea 432 17 Mozamb. 658
18 Tanzania 358 Nigeria 641 18 Zambia 424 18 Zambia 516
19 Ghana 357 Ethiopia 503 19 Ethiopia 390 19 Zimbabwe 498
20 Niger 343 Rwanda 493 20 Togo 384 20 Seychelles 482
21 Algeria 338 DRC 389 21 Sudan 354 21 Niger 449
22 Burkina Faso 335 Burkina F. 354 22 Uganda 332 22 Sudan 442
23 Senegal 311 Angola 274 23 Niger 320 23 Mali 417
24 Libya 281 Togo 270 24 Mali 315 24 Gabon 407
25 Congo Br. 240 Cameroon 260 25 Libya 293 25 Uganda 400
26 Mozambique 202 Gabon 256 26 Congo B. 292 26 Angola 374
27 DRC 195 Gambia 243 27 Gambia 292 27 Libya 361
28 Guinea 182 Djibouti 215 28 DRC 271 28 Burkina F. 345
29 Gambia 170 Mali 213 29 Seychelles 270 29 Congo B. 338
30 Mali 150 Burundi 186 30 C.Africa R. 247 30 Liberia 330
31 Sudan 123 Sudan 174 31 Burkina F. 240 31 DRC 306
32 Central AF.R. 114 Congo Br. 174 32 Liberia 227 32 Malawi 305
33 Eritrea 100 Libya 161 33 Malawi 227 33 Guinea 299
34 Seychelles 84 Niger 136 34 Gabon 217 34 Gambia 244
35 Ethiopia 83 S. Leone 136 35 Mauritania 204 35 Mauritania 244
36 Gabon 81 Somalia 128 36 Mozamb. 203 36 Togo 238
37 Burundi 80 Benin 115 37 Angola 203 37 Rwanda 235
38 Liberia 75 Comoros 113 38 Burundi 147 38 Djibouti 229
39 Rwanda 68 Guinea 109 39 Benin 143 39 Chad 222
40 Sierra Leone 62 Mauritania 94 40 Somalia 125 40 C. Africa.R 214
47 Cape Verde 24 Liberia 30 47 Eritrea 64 47 Burundi 125
48 Sao Tome. P. 16 Sao Tome.P 30 48 Chad 58 48 Eq. Guinea 111
49 Eq. Guinea 15 Cape Verde 29 49 Eq. Guinea 50 49 Guinea-B. 106
Notes: This table shows the country level analysis for the evolution of the extensive margin of trade by country.
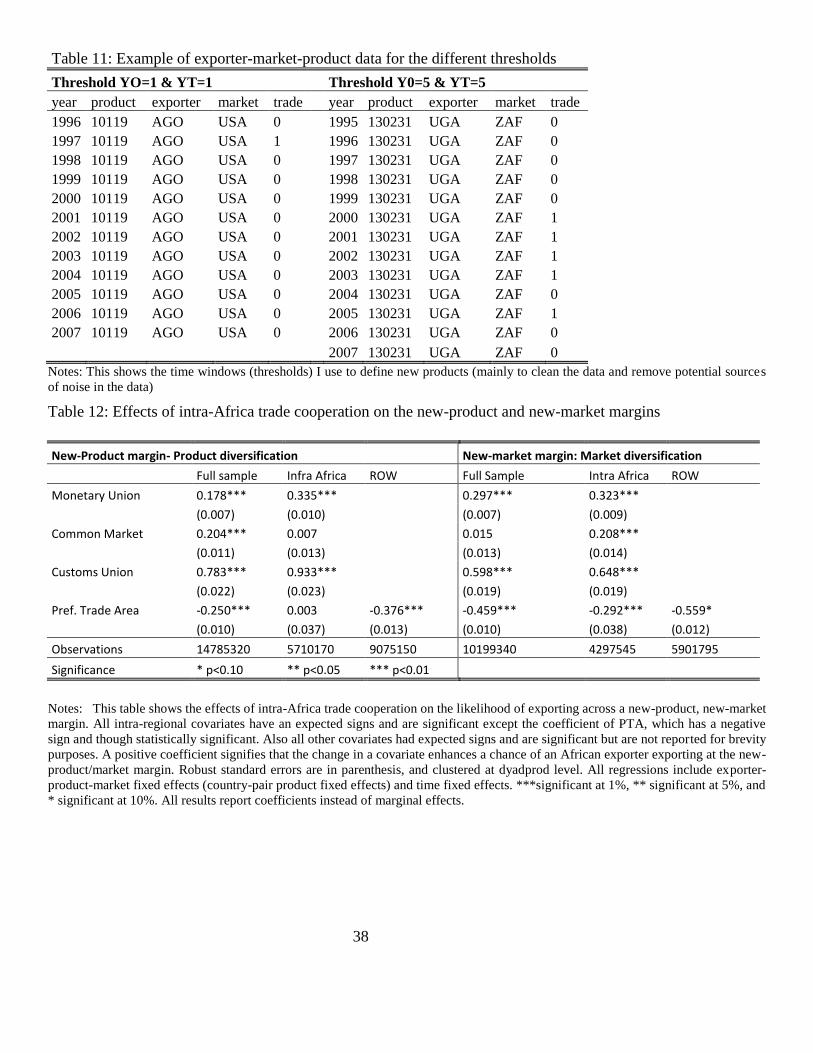
38
Table 11: Example of exporter-market-product data for the different thresholds
Threshold YO=1 & YT=1 Threshold Y0=5 & YT=5
year product exporter market trade year product exporter market trade
1996 10119 AGO USA 0
1995 130231 UGA ZAF 0
1997 10119 AGO USA 1
1996 130231 UGA ZAF 0
1998 10119 AGO USA 0
1997 130231 UGA ZAF 0
1999 10119 AGO USA 0
1998 130231 UGA ZAF 0
2000 10119 AGO USA 0
1999 130231 UGA ZAF 0
2001 10119 AGO USA 0
2000 130231 UGA ZAF 1
2002 10119 AGO USA 0
2001 130231 UGA ZAF 1
2003 10119 AGO USA 0
2002 130231 UGA ZAF 1
2004 10119 AGO USA 0
2003 130231 UGA ZAF 1
2005 10119 AGO USA 0
2004 130231 UGA ZAF 0
2006 10119 AGO USA 0
2005 130231 UGA ZAF 1
2007 10119 AGO USA 0
2006 130231 UGA ZAF 0
2007 130231 UGA ZAF 0
Notes: This shows the time windows (thresholds) I use to define new products (mainly to clean the data and remove potential sources
of noise in the data)
Table 12: Effects of intra-Africa trade cooperation on the new-product and new-market margins
New-Product margin- Product diversification New-market margin: Market diversification
Full sample Infra Africa ROW Full Sample Intra Africa ROW
Monetary Union 0.178*** 0.335*** 0.297*** 0.323***
(0.007) (0.010) (0.007) (0.009)
Common Market 0.204*** 0.007 0.015 0.208***
(0.011) (0.013) (0.013) (0.014)
Customs Union 0.783*** 0.933*** 0.598*** 0.648***
(0.022) (0.023) (0.019) (0.019)
Pref. Trade Area -0.250*** 0.003 -0.376*** -0.459*** -0.292*** -0.559*
(0.010) (0.037) (0.013) (0.010) (0.038) (0.012)
Observations 14785320 5710170 9075150 10199340 4297545 5901795
Significance * p<0.10 ** p<0.05 *** p<0.01
Notes: This table shows the effects of intra-Africa trade cooperation on the likelihood of exporting across a new-product, new-market
margin. All intra-regional covariates have an expected signs and are significant except the coefficient of PTA, which has a negative
sign and though statistically significant. Also all other covariates had expected signs and are significant but are not reported for brevity
purposes. A positive coefficient signifies that the change in a covariate enhances a chance of an African exporter exporting at the new-
product/market margin. Robust standard errors are in parenthesis, and clustered at dyadprod level. All regressions include exporter-
product-market fixed effects (country-pair product fixed effects) and time fixed effects. ***significant at 1%, ** significant at 5%, and
* significant at 10%. All results report coefficients instead of marginal effects.

39
Table 13: Effects of export experience on the new-product or to a new-market margin
New-product margin: Product Diversification New-market margin: Market Diversification
Full Sample Intra Africa ROW Full Sample Intra Africa ROW
Monetary Union 0.129*** 0.068***
0.093*** 0.169***
(0.011) (0.017)
(0.011) (0.015)
Common Market 0.023 0.030
0.193*** 0.067***
(0.012) (0.016) (0.012) (0.015)
customs union 0.529*** 0.604*** 0.287*** 0.372***
(0.044) (0.046) (0.031) (0.032)
Preference Trade Area -0.047*** -0.187*** -0.011 -0.315*** 0.111 -0.200***
(0.013) (0.041) (0.015) (0.012) (0.043) (0.015)
Product experience 1.971*** 1.907*** 2.013*** 0.720*** 0.692*** 0.743***
(0.004) (0.007) (0.005) (0.009) (0.013) (0.012)
Market experience 0.457*** 0.586*** 0.407*** 0.953*** 0.811*** 0.061***
(0.003) (0.005) (0.004) (0.007) (0.010) (0.009)
Trade openness_exporter 0.036** 0.271*** -0.080*** 0.129*** 0.093*** 0.113***
(0.012) (0.021) (0.014) (0.010) (0.016) (0.012)
Trade openness_market 0.479*** 0.381*** 0.506*** 0.451*** 0.351*** 0.424***
(0.011) (0.016) (0.016) (0.011) (0.015) (0.018)
Total bilateral trade 0.040*** 0.038*** 0.043*** 0.014*** 0.024*** -0.005*
(0.001) (0.002) (0.002) (0.001) (0.002) (0.002)
lbilateral abs.GDP difference -0.010** 0.003 -0.020*** 0.046*** 0.050*** 0.042***
(0.004) (0.006) (0.005) (0.004) (0.005) (0.007)
lsum of bilateral GDP 0.169*** 0.342*** 0.349*** 0.851*** 0.944*** 1.058***
(0.022) (0.043) (0.028) (0.024) (0.036) (0.038)
lbilateral abs.GDP per capita 0.010** -0.014** 0.016*** 0.022*** 0.018*** 0.007
(0.003) (0.004) (0.004) (0.003) (0.003) (0.007)
lsum of GDP per capita 0.027 0.039 0.523*** 0.798*** 0.750*** 0.188***
(0.026) (0.055) (0.038) (0.030) (0.051) (0.047)
Observations 8227017 2711698 5515319 5914387 2153502 3760885
Level of significance * p<0.1 ** p<0.05 *** p<0.01
Notes: This table reports results for effects of the export experience (product and market specific export experience) on the likelihood
of exporting across a new product, a new market margin. All results report coefficients not marginal effects. A positive coefficient
signifies that the change in a covariate enhances a chance of an African exporter exporting at the new-product/market margin. Robust
standard errors are in parenthesis, and clustered at dyadprod level. All regressions include exporter-product-market fixed effects
(country-pair product fixed effects) and time fixed effects. ***significant at 1%, ** significant at 5%, and * significant at 10%.
Coefficients of some other control variables are not reported for brevity purposes
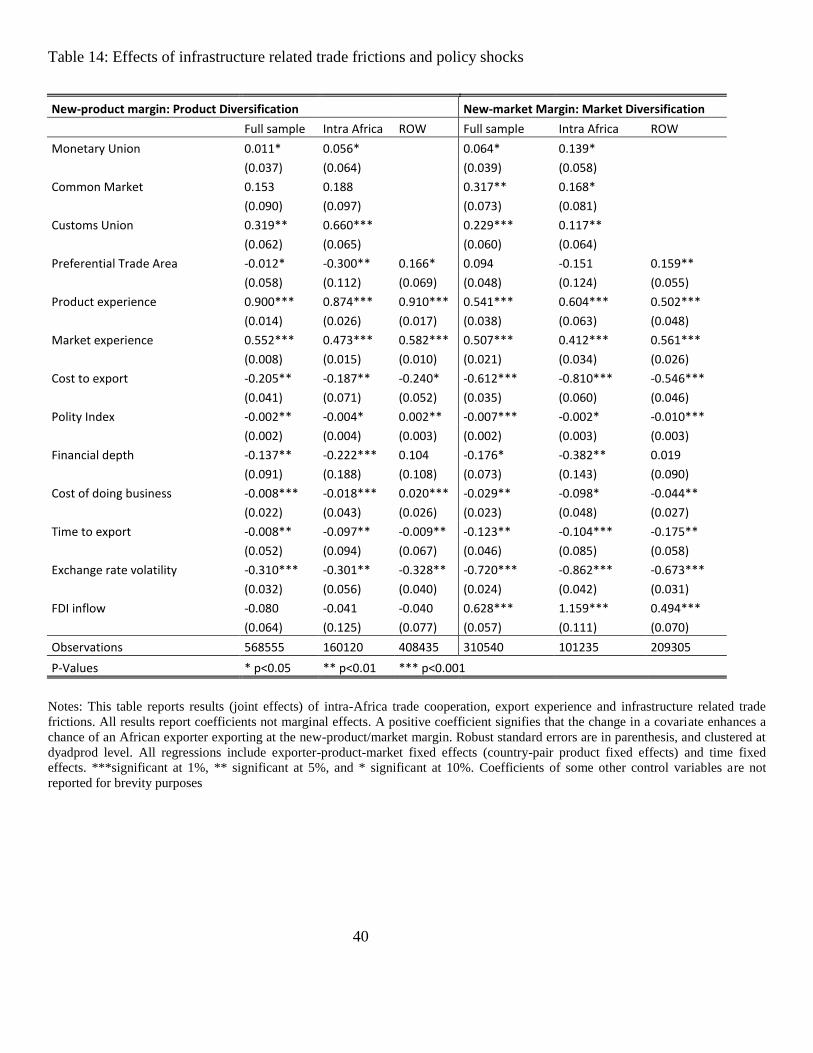
40
Table 14: Effects of infrastructure related trade frictions and policy shocks
New-product margin: Product Diversification New-market Margin: Market Diversification
Full sample Intra Africa ROW Full sample Intra Africa ROW
Monetary Union 0.011* 0.056*
0.064* 0.139*
(0.037) (0.064)
(0.039) (0.058)
Common Market 0.153 0.188 0.317** 0.168*
(0.090) (0.097) (0.073) (0.081)
Customs Union 0.319** 0.660*** 0.229*** 0.117**
(0.062) (0.065) (0.060) (0.064)
Preferential Trade Area -0.012* -0.300** 0.166* 0.094 -0.151 0.159**
(0.058) (0.112) (0.069) (0.048) (0.124) (0.055)
Product experience 0.900*** 0.874*** 0.910*** 0.541*** 0.604*** 0.502***
(0.014) (0.026) (0.017) (0.038) (0.063) (0.048)
Market experience 0.552*** 0.473*** 0.582*** 0.507*** 0.412*** 0.561***
(0.008) (0.015) (0.010) (0.021) (0.034) (0.026)
Cost to export -0.205** -0.187** -0.240* -0.612*** -0.810*** -0.546***
(0.041) (0.071) (0.052) (0.035) (0.060) (0.046)
Polity Index -0.002** -0.004* 0.002** -0.007*** -0.002* -0.010***
(0.002) (0.004) (0.003) (0.002) (0.003) (0.003)
Financial depth -0.137** -0.222*** 0.104 -0.176* -0.382** 0.019
(0.091) (0.188) (0.108) (0.073) (0.143) (0.090)
Cost of doing business -0.008*** -0.018*** 0.020*** -0.029** -0.098* -0.044**
(0.022) (0.043) (0.026) (0.023) (0.048) (0.027)
Time to export -0.008** -0.097** -0.009** -0.123** -0.104*** -0.175**
(0.052) (0.094) (0.067) (0.046) (0.085) (0.058)
Exchange rate volatility -0.310*** -0.301** -0.328** -0.720*** -0.862*** -0.673***
(0.032) (0.056) (0.040) (0.024) (0.042) (0.031)
FDI inflow -0.080 -0.041 -0.040 0.628*** 1.159*** 0.494***
(0.064) (0.125) (0.077) (0.057) (0.111) (0.070)
Observations 568555 160120 408435 310540 101235 209305
P-Values * p<0.05 ** p<0.01 *** p<0.001
Notes: This table reports results (joint effects) of intra-Africa trade cooperation, export experience and infrastructure related trade
frictions. All results report coefficients not marginal effects. A positive coefficient signifies that the change in a covariate enhances a
chance of an African exporter exporting at the new-product/market margin. Robust standard errors are in parenthesis, and clustered at
dyadprod level. All regressions include exporter-product-market fixed effects (country-pair product fixed effects) and time fixed
effects. ***significant at 1%, ** significant at 5%, and * significant at 10%. Coefficients of some other control variables are not
reported for brevity purposes

41
Robustness checks.
Table 15: Determinants of product and market concentration
Full Sample Intra Africa ROW Full Sample Intra Africa ROW
Product concentration index Market concentration index
Monetary Union 0.012*** 0.008***
0.023*** 0.085***
(0.000) (0.000)
(0.001) (0.002)
Common Market 0.002*** 0.000
0.050*** 0.074***
(0.000) (0.000)
(0.001) (0.002)
Customs Union 0.004*** 0.012***
0.476*** 0.518***
(0.000) (0.000) (0.004) (0.004)
Preferential Trade Area -0.003*** -0.003*** -0.007*** -0.029*** -0.055*** -0.019***
(0.000) (0.000) (0.000) (0.001) (0.002) (0.001)
Costs to export -0.000** -0.010*** -0.005*** -0.023*** -0.022*** -0.019***
(0.000) (0.000) (0.000) (0.001) (0.002) (0.001)
Polity index -0.000*** -0.000*** -0.000*** -0.001*** -0.002*** -0.000***
(0.000) (0.000) (0.000) (0.000) (0.000) (0.000)
Exchange rate volatility -0.267*** -0.254*** -0.264*** -0.654*** -0.850*** -0.493***
(0.001) (0.001) (0.001) (0.004) (0.006) (0.007)
Financial Depth -0.052* -0.051** -0.053*** -0.340*** -0.360*** -0.330***
(0.000) (0.000) (0.000) (0.002) (0.004) (0.003)
Cost of doing business -0.007*** -0.009*** -0.007*** -0.170*** -0.161*** -0.170***
(0.000) (0.000) (0.000) (0.001) (0.002) (0.001)
Time to export -0.022*** -0.022*** -0.024*** -0.084*** -0.036*** -0.110***
(0.000) (0.000) (0.000) (0.002) (0.003) (0.002)
FDI inflows 0.007*** -0.015*** -0.063*** -0.082*** -0.056***
(0.001) (0.002)
(0.001) (0.002) (0.001)
Product experience 0.001*** 0.001*** 0.001*** 0.001* 0.001* 0.002***
(0.000) (0.000) (0.000) (0.000) (0.001) (0.000)
Market experience 0.008*** 0.008*** 0.008*** 0.019*** 0.010*** 0.027***
(0.000) (0.000) (0.000) (0.001) (0.001) (0.001)
_cons 0.558*** 0.562*** 0.619*** 0.466*** 0.142*** 0.817***
(0.005) (0.009) (0.007) (0.049) (0.074) (0.069)
r2 0.653 0.665 0.660 0.832 0.811 0.846
Observations 1605356.000 481036.000 1124320.000 1605356.000 481036.000 1124320.000
P-value * p<0.05 ** p<0.01 *** p<0.001 * p<0.05 ** p<0.01 *** p<0.001
Notes: This table reports OLS results in which the dependent variable is the product and market concentration index. I use the same
covariates as before in the analysis. Results are robustly replicated. Robust standard errors are in parenthesis, and clustered at
dyadprod level. ***significant at 1%, ** significant at 5%, and * significant at 10%. Coefficients of some other control variables are
not reported for brevity purposes

42
Table 16: Determinants of number of products and number of markets
Full Sample
Intra Africa ROW Full Sample
Intra Africa ROW
Number of products Number of markets
Monetary Union 0.063*** 0.134***
0.007*** 0.012***
(0.011) (0.021)
(0.001) (0.001)
Common Market 0.376*** 0.316***
0.029*** 0.036***
(0.011) (0.019)
(0.001) (0.001)
Customs Union 0.823*** 1.142*** 0.098*** 0.105***
(0.022) (0.029) (0.002) (0.002)
Preferential Trade Area 0.085*** 0.177*** 0.036*** 0.003*** 0.009*** -0.001***
(0.009) (0.017) (0.004) (0.001) (0.001) (0.000)
Cost to export -0.319*** -0.186*** -0.441*** -0.039*** -0.036*** -0.041***
(0.012) (0.015) (0.021) (0.001) (0.002) (0.002)
Polity index -0.000* -0.001** -0.001*** -0.000*** -0.000*** -0.000***
(0.000) (0.000) (0.000) (0.000) (0.000) (0.000)
Exchange rate volatility -0.024*** -0.263*** -0.571*** -0.114*** -0.138*** -0.042***
(0.035) (0.042) (0.065) (0.003) (0.003) (0.006)
Financial Depth -0.380*** -0.546*** 0.179 -0.083 -0.106*** -0.068
(0.019) (0.032) (0.026) (0.001) (0.002) (0.002)
Cost of doing business -0.122*** -0.159*** -0.085*** -0.058*** -0.060*** -0.053***
(0.009) (0.019) (0.011) (0.001) (0.001) (0.001)
Time to export -0.431*** -0.617*** -0.179*** -0.006*** -0.019*** -0.034***
(0.015) (0.025) (0.021) (0.001) (0.002) (0.002)
Distance to nearest port -0.006*** -0.191*** 0.236*** -0.017*** -0.020*** -0.016***
(0.011) (0.013) (0.019) (0.001) (0.001) (0.001)
Product experience 0.030*** 0.020*** 0.025*** 0.001*** 0.023 0.001***
(0.002) (0.002) (0.002) (0.000) (0.000) (0.000)
Tariff -0.002*** -0.001*** -0.001*** -0.000*** -0.000*** -0.000
(0.000) (0.000) (0.000) (0.000) (0.000) (0.000)
Market experience 0.177*** 0.144*** 0.121*** 0.001* 0.001 0.005***
(0.007) (0.007) (0.012) (0.001) (0.001) (0.001)
_cons 0.770*** 0.517*** 0.570*** 0.818*** 1.219*** 1.026***
(0.373) (0.492) (0.600) (0.027) (0.038) (0.053)
r2 0.927 0.939 0.930 0.912 0.912 0.920
Observations 163011 78348 84663 163011 78348 84663
* p<0.05 ** p<0.01 *** p<0.001 Notes: This table reports OLS results in which the dependent variable is the number of products per exporter and the number of
markets per exporter. I use the same covariates as before in the analysis. Results are robustly and qualitatively replicated. Robust
standard errors are in parenthesis, and clustered at dyadprod level. ***significant at 1%, ** significant at 5%, and * significant at 10%.
Coefficients of some other control variables are not reported for brevity purposes

43
Table 17: Regional trade groups and their membership
Regional
Bloc
Monetary Unions
Number of Members
No. Of Overlapping members pairings Sources
UEMOA 8
56 http://www.uemoa.int
CMA 4
12 http://www.imf.org CEMAC
[UDEAC 6 30 http://www.cemac.int/ Common
Markets
EAC 5
20 http://www.eac.int Customs
Unions
COMESA 19
342 http://www.comesa.int/
ECOWAS 15
210 http://www.ecowas.int/
PTAs
SADC 15
210 http://www.sadc.int IGAD 6
30 http://igad.int/
ECCAS 10
90 http://www.ceeac-eccas.org
WAMZ 6
30 http://www.wami-imao.org
AMU 5
20 http://www.maghrebarabe.org
CEN-SAD 23
506 http://www.africa-union.org
IOC 4
12 http://www.ioconline.org
CILSS 13
156 http://www.cilss.bf/ Other
sources npr http://www.africaecon.org

44
a. Monetary Union & Pseudo Monetary Union Blocs
Member`s Member`s Member`s Member`s
Regional Block Year of Year of Year of entry Year of entry
Block Membership Entry
[FTA] Entry [Customs
Union] [Common
Market] [Monetary
Union]
UEMOA Benin
1994
Burkina Faso
1994
Ivory Coast
1994
Guinea-Bissau
1997
Mali
1994
Niger
1994
Senegal
1994
Togo 1994
CMA Lesotho
1993
South Africa
1993
Swaziland
1993
Namibia 1993 CEMAC
(UDEAC) Cameroon
1999
Central African
Rep.
1999
Chad
1999
Congo
1999
Equatorial Guinea
1999
Gabon
1999
Sao Tome &
Principe 1999
Notes: UEMOA: West African Economic and Monetary Union; CMA: The Common Monetary Area; CEMAC: Economic and
Monetary Community of Central Africa;
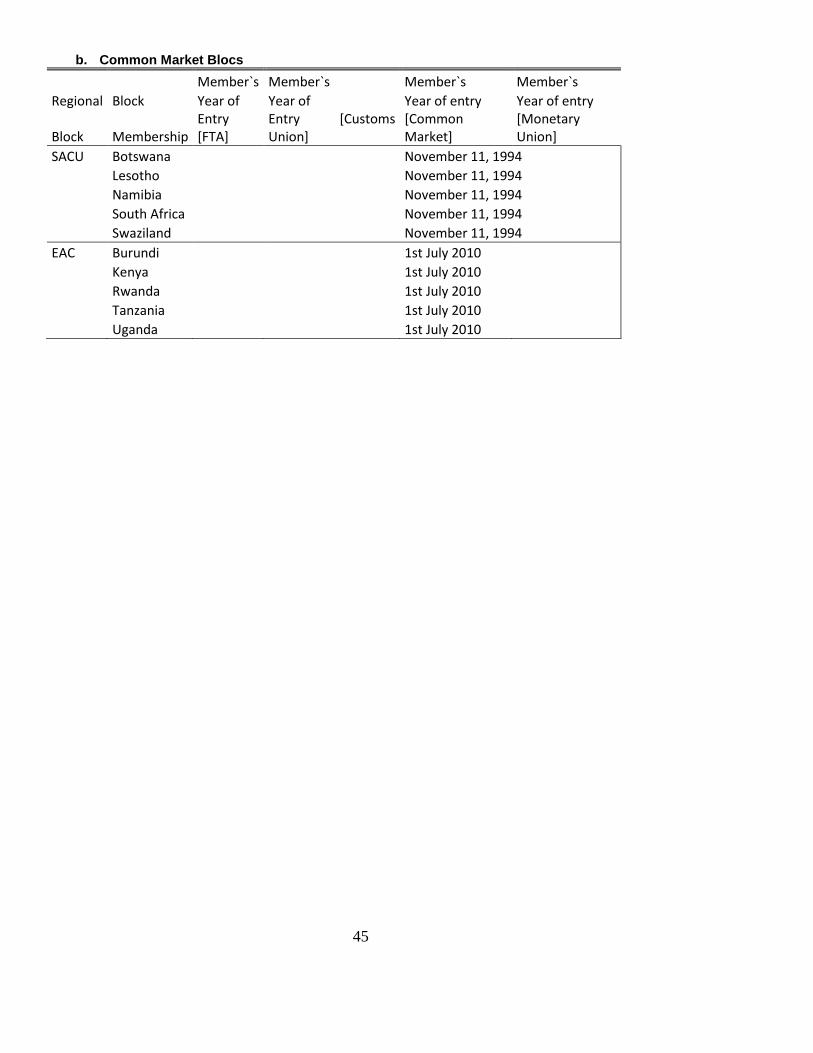
45
b. Common Market Blocs
Member`s Member`s Member`s Member`s
Regional Block Year of Year of Year of entry Year of entry
Block Membership Entry [FTA]
Entry [Customs Union]
[Common Market]
[Monetary Union]
SACU Botswana
November 11, 1994
Lesotho
November 11, 1994
Namibia
November 11, 1994
South Africa
November 11, 1994
Swaziland November 11, 1994 EAC Burundi
1st July 2010
Kenya
1st July 2010
Rwanda
1st July 2010
Tanzania
1st July 2010 Uganda 1st July 2010
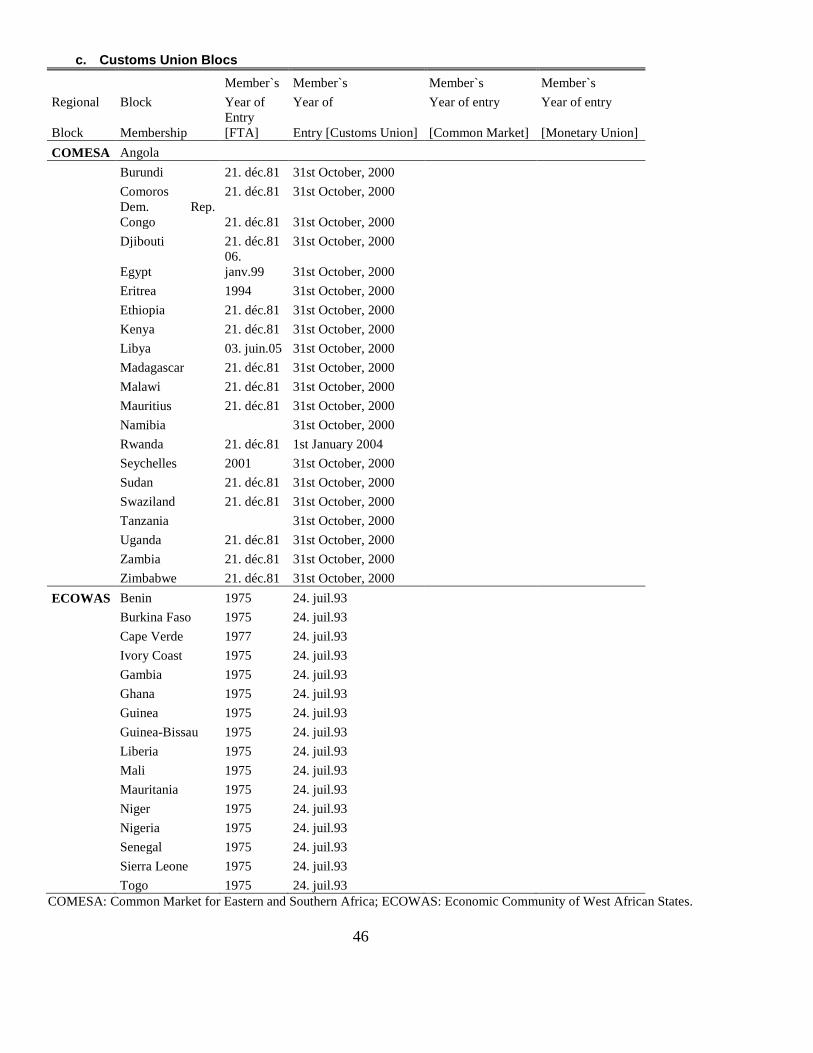
46
c. Customs Union Blocs
Member`s Member`s Member`s Member`s
Regional Block Year of Year of Year of entry Year of entry
Block Membership
Entry
[FTA] Entry [Customs Union] [Common Market] [Monetary Union]
COMESA Angola
Burundi 21. déc.81 31st October, 2000
Comoros 21. déc.81 31st October, 2000
Dem. Rep.
Congo 21. déc.81 31st October, 2000
Djibouti 21. déc.81 31st October, 2000
Egypt
06.
janv.99 31st October, 2000
Eritrea 1994 31st October, 2000
Ethiopia 21. déc.81 31st October, 2000
Kenya 21. déc.81 31st October, 2000
Libya 03. juin.05 31st October, 2000
Madagascar 21. déc.81 31st October, 2000
Malawi 21. déc.81 31st October, 2000
Mauritius 21. déc.81 31st October, 2000
Namibia
31st October, 2000
Rwanda 21. déc.81 1st January 2004
Seychelles 2001 31st October, 2000
Sudan 21. déc.81 31st October, 2000
Swaziland 21. déc.81 31st October, 2000
Tanzania
31st October, 2000
Uganda 21. déc.81 31st October, 2000
Zambia 21. déc.81 31st October, 2000
Zimbabwe 21. déc.81 31st October, 2000
ECOWAS Benin 1975 24. juil.93
Burkina Faso 1975 24. juil.93
Cape Verde 1977 24. juil.93
Ivory Coast 1975 24. juil.93
Gambia 1975 24. juil.93
Ghana 1975 24. juil.93
Guinea 1975 24. juil.93
Guinea-Bissau 1975 24. juil.93
Liberia 1975 24. juil.93
Mali 1975 24. juil.93
Mauritania 1975 24. juil.93
Niger 1975 24. juil.93
Nigeria 1975 24. juil.93
Senegal 1975 24. juil.93
Sierra Leone 1975 24. juil.93
Togo 1975 24. juil.93
COMESA: Common Market for Eastern and Southern Africa; ECOWAS: Economic Community of West African States.

47
d. Preferential Trade Areas
Member`s Member`s Member`s Member`s
Regional Block Year of Year of Year of entry Year of entry
Block Membership
Entry
[FTA] Entry [Customs Union] [Common Market] [Monetary Union]
SADC Angola 1992 01. Sept.00
Botswana 1992 01. Sept.00
Dem. Rep.
Congo 1997 01. Sept.00
Lesotho 1992 01. Sept.00
Malawi 1992 01. Sept.00
Mauritius 1995 01. Sept.00
Madagascar 2005 01. Sept.00
Mozambique 1992 01. Sept.00
Namibia 1992 01. Sept.00
Seychelles 15. Sept.07 01. Sept.00
South Africa 1994 01. Sept.00
Swaziland 1992 01. Sept.00
Tanzania 1992 01. Sept.00
Zambia 1992 01. Sept.00
Zimbabwe 1992 01. Sept.00
SADC : The Southern African Development Community
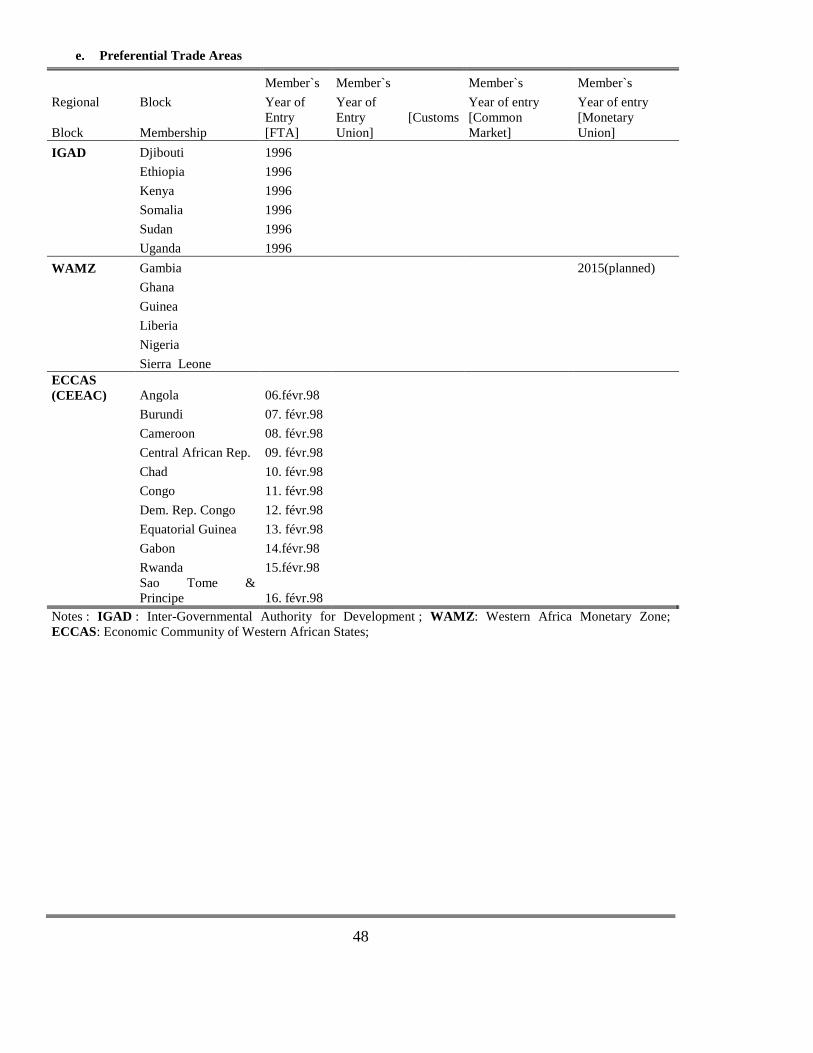
48
e. Preferential Trade Areas
Member`s Member`s Member`s Member`s
Regional Block Year of Year of Year of entry Year of entry
Block Membership
Entry
[FTA]
Entry [Customs
Union]
[Common
Market]
[Monetary
Union]
IGAD Djibouti 1996
Ethiopia 1996
Kenya 1996
Somalia 1996
Sudan 1996
Uganda 1996
WAMZ Gambia
2015(planned)
Ghana
Guinea
Liberia
Nigeria
Sierra Leone
ECCAS
(CEEAC) Angola 06.févr.98
Burundi 07. févr.98
Cameroon 08. févr.98
Central African Rep. 09. févr.98
Chad 10. févr.98
Congo 11. févr.98
Dem. Rep. Congo 12. févr.98
Equatorial Guinea 13. févr.98
Gabon 14.févr.98
Rwanda 15.févr.98
Sao Tome &
Principe 16. févr.98
Notes : IGAD : Inter-Governmental Authority for Development ; WAMZ: Western Africa Monetary Zone;
ECCAS: Economic Community of Western African States;

49
f. Preferential Trade Areas
Member`s Member`s Member`s Member`s
Regional Block Year of Year of Year of entry Year of entry
Block Membership
Entry
[FTA] Entry [Customs Union] [Common Market] [Monetary Union]
CEN-
SAD Benin
Burkina Faso 4th February 1998
Chad
Côte d'Ivoire
Egypt
Ghana
Guinea Bissau
Mali
Niger
Sudan
Central African Rep. avr.99
Eritrea avr.99
Senegal févr.00
Djibouti févr.00
Gambia févr.00
Liberia
Libya
Morocco
Nigeria
Sierra Leone
Somali
Togo
Tunisia
Notes: CEN-SAD: Community of Sahel-Saharan States
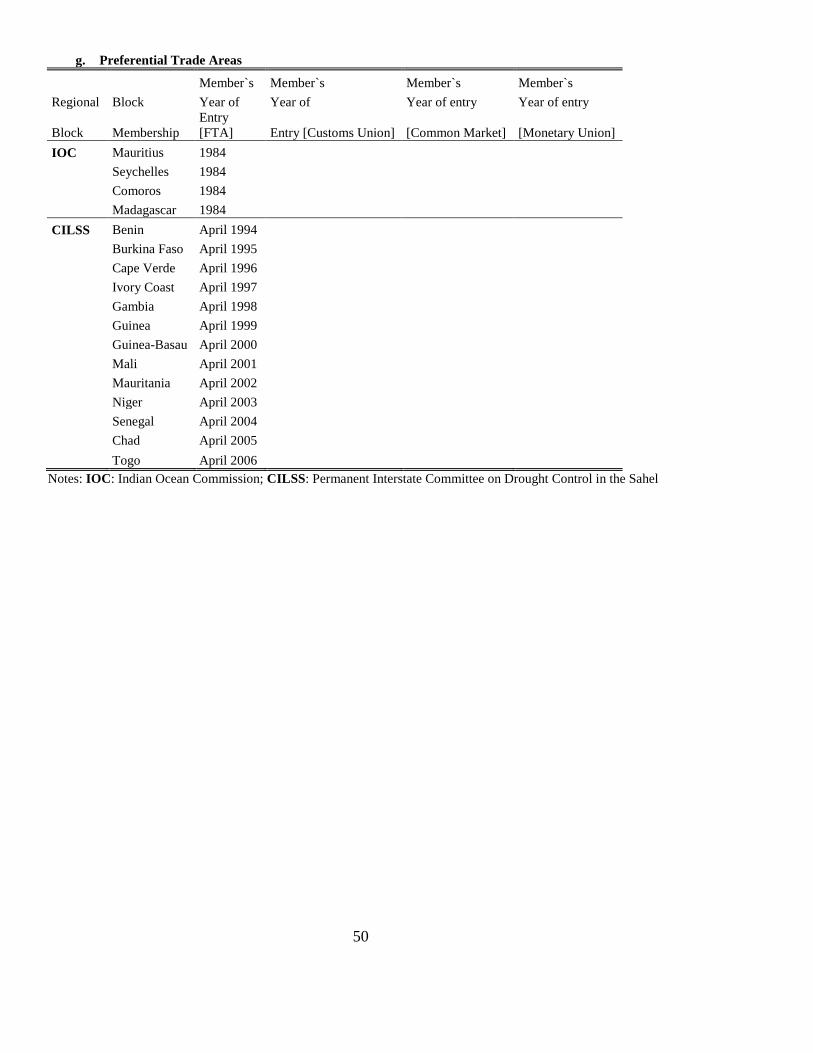
50
g. Preferential Trade Areas
Member`s Member`s Member`s Member`s
Regional Block Year of Year of Year of entry Year of entry
Block Membership
Entry
[FTA] Entry [Customs Union] [Common Market] [Monetary Union]
IOC Mauritius 1984
Seychelles 1984
Comoros 1984
Madagascar 1984
CILSS Benin April 1994
Burkina Faso April 1995
Cape Verde April 1996
Ivory Coast April 1997
Gambia April 1998
Guinea April 1999
Guinea-Basau April 2000
Mali April 2001
Mauritania April 2002
Niger April 2003
Senegal April 2004
Chad April 2005
Togo April 2006
Notes: IOC: Indian Ocean Commission; CILSS: Permanent Interstate Committee on Drought Control in the Sahel

51
Table 18 Variables Description and Data Sources
Variable Description Source
Trade Flows HS 6 digit level for 1995-2009 CEPII-BACI trade dataset (2010)
bilateral trade flows
Tariff data HS 6 digit level UNCTAD TRAINS
GDP Real GDP for partner Nominal GDP is obtained from
countries World Bank Development Indicators (2010)
Distance and other trade resistance variables Standard gravity variables CEPII
Regional Trade Agreements 13 intra-African http://rtais.wto.org/UI/PublicAllRTAList.aspx
regional groupings & several official websites
Monetary Union A binary variable that author`s construction
equals one if the trading
partners share a common
currency, zero otherwise
Common Market A binary variable that author`s construction
equals one if the trading
partners share a common
Market, zero otherwise
Customs Union A binary variable that author`s construction
equals one if the trading
partners share a common
customs union, zero otherwise
Preferential Trade Area A binary variable that author`s construction
equals one if the trading
partners share a common
preferential trade area
Depth of Integration index Takes the value of: 4 for MU author`s construction
3 for CM
2 for CU
1 for PTA
Trade costs Costs to exports30
Cost of doing business31
Time to export32
World Development Indicators (World Bank, 2011)
Customs procedures to export
30
These include distribution costs due to poor road infrastructure (transport costs) poor ware house infrastructure (storage costs and
port costs) inter-border costs and the freight costs to destination of the product. The variable is measured in USD per container. 31
This variable is the number of days taken to export a container. It is recorded in calendar days 32
This includes cost to register a business normalised as a percentage of gross national income (GNI) per capita