54-2005-vol.1_01-e.zukauskas
TRANSCRIPT

8/8/2019 54-2005-Vol.1_01-E.Zukauskas
http://slidepdf.com/reader/full/54-2005-vol101-ezukauskas 1/5
ISSN 1392-2114 ULTRAGARSAS, Nr.1(54). 2005.
7
Application of air – coupled ultrasonic technique for sizing of delaminationtype defect in multilayered materials
E. Žukauskas, V. Cicėnas, R. Kažys
Prof. K. Baršauskas ultrasound institute
Kaunas University of Technology
Introduction
Ultrasonic testing using couplants is most popular technique for non destructive testing of solid materials. Inthe most non – destructive evaluation tasks such asinvestigation of materials whose properties may bechanged by liquid contact this technique can not be used.Use of contact technique can be restricted for complexgeometry structures. Also, liquid couplants cannot be used
when materials under investigation are hot, or when water can fill defects and the detectability of the defects may bereduced. Air – coupled ultrasonic technique is veryattractive for non destructive testing and evaluation, because it avoids the disadvantages caused by liquidcouplants. Many authors present results of air–coupledultrasonic investigation of solid materials [1 – 7], butmostly it is qualitative evaluation. Objective of this work was to check possibility to use air - coupled ultrasonictechnique to measure the dimensions of defects inaluminum and carbon fiber reinforced plastic multilayeredstructures.
Experimental setupThe block diagram of the experimental system is
presented in Fig.1.
Fig.1. Block diagram of the experimental system
The whole system is controlled using personalcomputer. Two channel air–coupled ultrasonic systemconsists of the high voltage generator, the low noiseamplifier and the analog – to – digital converter. Themaximal output voltage of the generator is 750 V. Gain of the amplifier can be changed from 10 dB to 50 dB. Thelow noise 13.4 dB preamplifier is connected directly to thereceiver in order to improve the signal to noise ratio.
Experimental signals are collected and stored in the PC.Also there is possibility to real time presentation of B – scans and amplitude C – scans.
The scanning system is designed in such a way that theultrasonic transducers are at the fixed position and the testsample is moved during the scanning process by a spatialstep 0.1 mm. Scanning was carried out using the 445 kHzair - coupled focused priezocomposite transducers in thethrough – transmission mode. The focal spot of thetransducers is 1 mm.
Experiments were performed using two types of thetest samples: the reference test sample and carbon fiber reinforced plastic (CFRP) test sample. The reference testsample was produced from 0.6 mm aluminum sheet. As thedefect 6×6 mm square hole was made. The CFRP testsample contains inner artificial delamination defects madeof folded and sealed teflon. The size of the defect is6×6mm.
Experiments were carried out using two configurationsof the reference test sample: scanning of the single layer test sample (Fig.2a) and scanning of the double layer test
sample with an additional aluminum sheet of the samethickness which was bonded using grease (Fig.2b).
Fig.2. Test samples: a- scanning of the single layer test sample; b-scanning of the test sample with a bonded additionalaluminum sheet
Artificialdefect (hole)
Test sample
Transmitter
Scanningdirection
Receiver
a)
Artificialdefect
Test sample
ReceiverTransmitter
Scanningdirection
b)
PC
Air – coupledultrasound
system
Preamplifier
yx
z
Axes driver Scanner control
Transmitter
Receiver
Test sample
USB Bus

8/8/2019 54-2005-Vol.1_01-E.Zukauskas
http://slidepdf.com/reader/full/54-2005-vol101-ezukauskas 2/5
ISSN 1392-2114 ULTRAGARSAS, Nr.1(54). 2005.
8
Results of experiments
The amplitude C – scan of the single layer referencetest sample is presented in Fig.3. Due to the high signal tonoise ratio the defect can be easy distinguished withoutaveraging of the signals.
The amplitude C – scan of the test sample with anadditional bonded aluminum sheet is shown in Fig. 4. Due
to low signal to noise ratio the experiment was carried outusing signal averaging. 32 signals were averaged at eachscanning step. Periodical fluctuations of peak to peak amplitude of collected signals were noticed around thedefect. To explain this phenomenon, simulation of thewave propagation through the aluminum test sample was performed. The simulation results are presented in the nextchapter.
The amplitude C – scan of the CFRP test sample withthe artificial delamination defect is shown in Fig. 5.Experiment was carried out using signal averaging due tothe low signal to noise ratio. 32 signals were averaged ateach scanning point. Periodical fluctuations of the peak to
peak amplitude of the signals around defect were noticedas well as in the previous experiments. Some bright spotsare visible in the area of the artificial defect. Origin of these spots can be explained by bonding of the defect tothe carbon fiber reinforced plastic.
Fig.3. Amplitude C – scan of the reference test sample
Fig.4. Amplitude C – scan of the test sample with the bondedadditional aluminum sheet
Fig.5. Amplitude C – scan of the CFRP test sample with an artificialdelamination defect.
Simulation resultsThe finite differences Wave3000 Pro software package
was used to create the 3D model of the bonded aluminum plates in order to simulate wave propagation through these bonded plates. The model consists of two aluminum plates bonded together: the first is the 100x100 mm square shapeand 0.6 mm thickness plate, the second plate is of the samethickness and 40x40 mm dimensions with the 6x6 mmsquare hole at the centre (Fig.6).
Fig.6. The configuration and the dimensions of two bonded aluminumplates
There is no possibility to run simulation with thefocused transducers due to the lack of computer resourceseven using the high – end computer, because of therelatively long distance between transducers (more then100 mm) at the 445 kHz excitation frequency. The realcase was simplified. For excitation and detection of ultrasonic waves two small 1 mm diameter transducerscontacting with the test sample were used in the model.The diameter of the circular transducers matches thediameter of the focal point – 1 mm. They were placed on both sides of bonded plates directly opposite to each other.
The following parameters used in the simulation wereselected: the excitation frequency 445 kHz; the excitation
signal nine periods burst with the Gaussian envelope. Thesimulation was carried out at the plane y=50 mm, scanned
100 2 4 6 8
18
12 14 16 18 x ,mm
16
14
12
10
8
6
4
2
0
y ,mm
0.1
0.3
0.4
0.2
0.5
0.6
0.7
0.8
0.9
U , V
40mm
6mm
6mm40mm
0.6mm
0.6mm
100mm
100mm
1st
aluminumplate
2nd
aluminumplate
00
2 10 12 144 6 8 16 18 20
2
10
12
14
4
6
8
16
18
20
0.1
0.3
0.4
0.2
0.8
0.7
0.6
0.5
x , mm
y , m m
U , V
00
2 10 12 144 6 8 16 18 20
2
10
12
14
4
6
8
16
18
20
0.1
0.3
0.4
0.2
0.8
0.7
0.6
0.5
U , V
0.9
x , mm
, m
m
8/8/2019 54-2005-Vol.1_01-E.Zukauskas
http://slidepdf.com/reader/full/54-2005-vol101-ezukauskas 3/5
ISSN 1392-2114 ULTRAGARSAS, Nr.1(54). 2005.
9
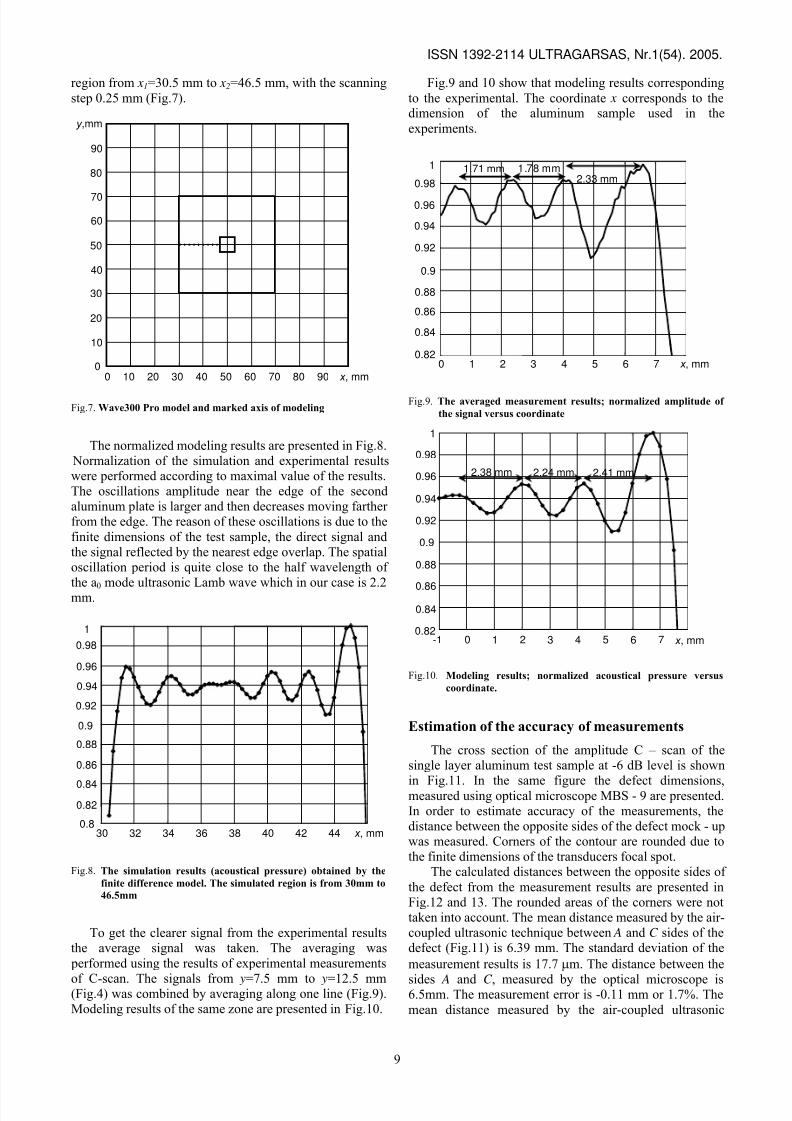
region from x1=30.5 mm to x2=46.5 mm, with the scanningstep 0.25 mm (Fig.7).
Fig.7. Wave300 Pro model and marked axis of modeling
The normalized modeling results are presented in Fig.8. Normalization of the simulation and experimental resultswere performed according to maximal value of the results.The oscillations amplitude near the edge of the secondaluminum plate is larger and then decreases moving farther from the edge. The reason of these oscillations is due to thefinite dimensions of the test sample, the direct signal andthe signal reflected by the nearest edge overlap. The spatialoscillation period is quite close to the half wavelength of
the a0 mode ultrasonic Lamb wave which in our case is 2.2mm.
Fig.8. The simulation results (acoustical pressure) obtained by thefinite difference model. The simulated region is from 30mm to46.5mm
To get the clearer signal from the experimental resultsthe average signal was taken. The averaging was performed using the results of experimental measurements
of C-scan. The signals from y=7.5 mm to y=12.5 mm(Fig.4) was combined by averaging along one line (Fig.9).Modeling results of the same zone are presented in Fig.10.
Fig.9 and 10 show that modeling results correspondingto the experimental. The coordinate x corresponds to thedimension of the aluminum sample used in theexperiments.
Fig.9. The averaged measurement results; normalized amplitude of the signal versus coordinate
Fig.10. Modeling results; normalized acoustical pressure versuscoordinate.
Estimation of the accuracy of measurements
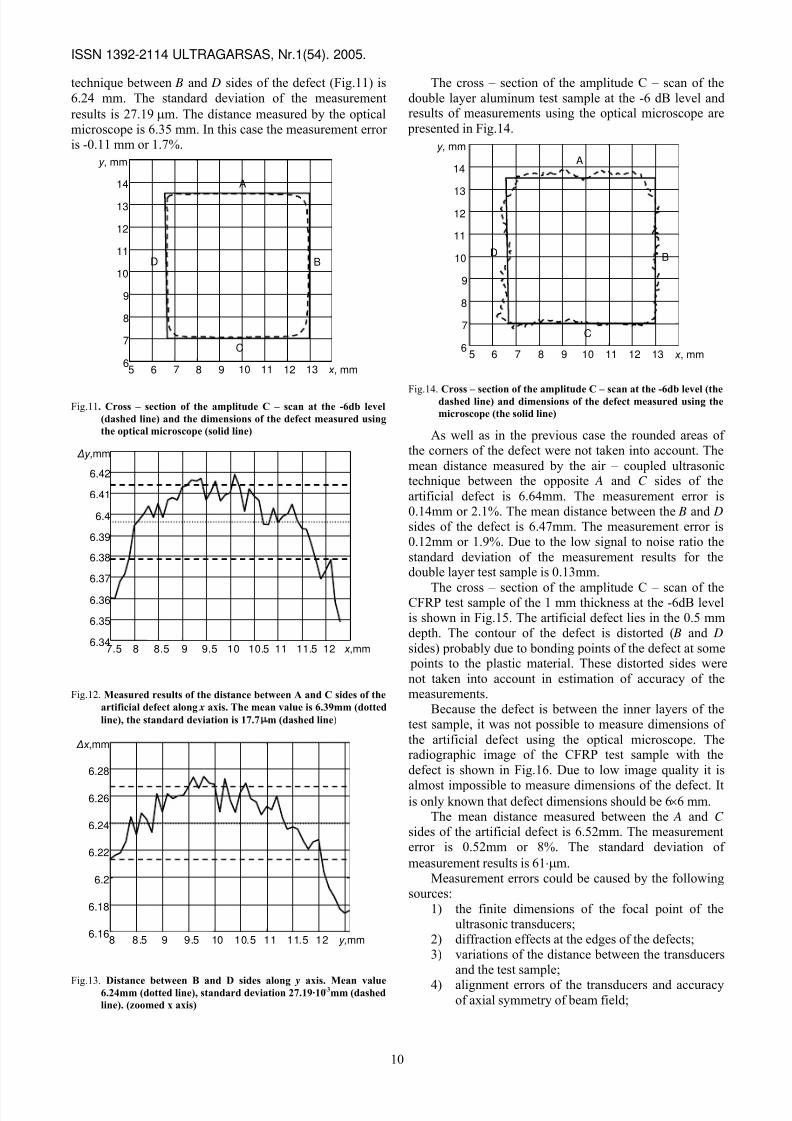
The cross section of the amplitude C – scan of thesingle layer aluminum test sample at -6 dB level is shown
in Fig.11. In the same figure the defect dimensions,measured using optical microscope MBS - 9 are presented.In order to estimate accuracy of the measurements, thedistance between the opposite sides of the defect mock - upwas measured. Corners of the contour are rounded due tothe finite dimensions of the transducers focal spot.
The calculated distances between the opposite sides of the defect from the measurement results are presented inFig.12 and 13. The rounded areas of the corners were nottaken into account. The mean distance measured by the air-coupled ultrasonic technique between A and C sides of thedefect (Fig.11) is 6.39 mm. The standard deviation of themeasurement results is 17.7 µm. The distance between the
sides A and C , measured by the optical microscope is6.5mm. The measurement error is -0.11 mm or 1.7%. Themean distance measured by the air-coupled ultrasonic
-1 0 1 2 3 4 5 6 7 x , mm0.82
0.84
0.86
0.88
0.9
0.92
0.94
0.96
0.98
1
2.38 mm 2.41 mm2.24 mm
0 10 20 30 40 50 60 70 80 90 x , mm0
10
20
30
40
50
60
70
80
90
y ,mm
0 1 2 3 4 5 6 7 x , mm0.82
0.84
0.86
0.88
0.9
0.92
0.94
0.96
0.98
1
2.33 mm1.78 mm1.71 mm
30 32 34 36 38 40 42 44 x , mm0.8
0.82
0.84
0.86
0.88
0.9
0.92
0.94
0.96
0.98
1
8/8/2019 54-2005-Vol.1_01-E.Zukauskas
http://slidepdf.com/reader/full/54-2005-vol101-ezukauskas 4/5
ISSN 1392-2114 ULTRAGARSAS, Nr.1(54). 2005.
10
technique between B and D sides of the defect (Fig.11) is6.24 mm. The standard deviation of the measurementresults is 27.19
µm. The distance measured by the opticalmicroscope is 6.35 mm. In this case the measurement error is -0.11 mm or 1.7%.
Fig.11. Cross – section of the amplitude C – scan at the -6db level(dashed line) and the dimensions of the defect measured usingthe optical microscope (solid line)
Fig.12. Measured results of the distance between A and C sides of theartificial defect along x axis. The mean value is 6.39mm (dottedline), the standard deviation is 17.7 µm (dashed line)
Fig.13. Distance between B and D sides along y axis. Mean value6.24mm (dotted line), standard deviation 27.19·10-3mm (dashedline). (zoomed x axis)
The cross – section of the amplitude C – scan of thedouble layer aluminum test sample at the -6 dB level andresults of measurements using the optical microscope are presented in Fig.14.
Fig.14. Cross – section of the amplitude C – scan at the -6db level (thedashed line) and dimensions of the defect measured using themicroscope (the solid line)
As well as in the previous case the rounded areas of the corners of the defect were not taken into account. Themean distance measured by the air – coupled ultrasonictechnique between the opposite A and C sides of theartificial defect is 6.64mm. The measurement error is0.14mm or 2.1%. The mean distance between the B and D sides of the defect is 6.47mm. The measurement error is0.12mm or 1.9%. Due to the low signal to noise ratio thestandard deviation of the measurement results for thedouble layer test sample is 0.13mm.
The cross – section of the amplitude C – scan of theCFRP test sample of the 1 mm thickness at the -6dB levelis shown in Fig.15. The artificial defect lies in the 0.5 mmdepth. The contour of the defect is distorted ( B and D sides) probably due to bonding points of the defect at some points to the plastic material. These distorted sides werenot taken into account in estimation of accuracy of themeasurements.
Because the defect is between the inner layers of thetest sample, it was not possible to measure dimensions of the artificial defect using the optical microscope. Theradiographic image of the CFRP test sample with thedefect is shown in Fig.16. Due to low image quality it is
almost impossible to measure dimensions of the defect. Itis only known that defect dimensions should be 6×6 mm.
The mean distance measured between the A and C sides of the artificial defect is 6.52mm. The measurementerror is 0.52mm or 8%. The standard deviation of measurement results is 61⋅µm.
Measurement errors could be caused by the followingsources:
1) the finite dimensions of the focal point of theultrasonic transducers;
2) diffraction effects at the edges of the defects;3) variations of the distance between the transducers
and the test sample;
4) alignment errors of the transducers and accuracyof axial symmetry of beam field;
8 8.5 9 9.5 10 10.5 11 11.5 12 y,mm6.16
6.18
6.2
6.22
6.24
6.26
6.28
∆ x ,mm
7.5 8 8.5 9 9.5 10 10.5 11 11.5 12 x ,mm6.34
6.35
6.36
6.37
6.38
6.39
6.4
6.41
6.42
∆y ,mm
5 6 7 8 9 10 11 12 13 x , mm6
7
8
9
10
11
12
13
14
y , mm
A
B
C
D
5 6 7 8 9 10 11 12 13 x , mm6
7
8
9
10
11
12
13
14
y , mm
A
B
C
D

8/8/2019 54-2005-Vol.1_01-E.Zukauskas
http://slidepdf.com/reader/full/54-2005-vol101-ezukauskas 5/5
ISSN 1392-2114 ULTRAGARSAS, Nr.1(54). 2005.
11
5) influence of vibrations of the test sample;6) electrical noise of electronic circuits;The biggest influence on the measurement error has
the finite dimensions of the ultrasonic transducers anddiffraction effects. Variations of the distance between theultrasonic transducers and the test sample, alignmenterrors, influence of the vibrations of the test sample can be
reduced and influence of these sources can be neglected.The influence of an electrical noise can be neglected aswell because it is random and can be eliminated usingsignal averaging.
Fig.15. Cross – section of the amplitude C – scan of CFRP test sampleat the -6db level dashed line and dimensions of the defectmeasured using microscope (solid line)
Fig.16.Radiographic image of the 6×6mm2 artificial defect in CFRPtest sample.
Conclusions
Possibility to use air- coupled ultrasonic technique for sizing of delamination type defects in multilayeredstructures was investigated. The experiments were carriedout using two types of materials: aluminum and CFRP testsamples.
It was discovered that around the rectangular defectsamplitude oscillations of the wave transmitted through thesample exists. The amplitude of oscillations is decreasingmoving farther from the edge of the defect. In order to getexplanation of this phenomenon, numerical simulation of the aluminum plate with a rectangular defect was performed. These oscillations are due to interference of
two waves: the direct wave and the wave reflected fromthe plate edge.For estimation of dimensions of defects, the distance
between opposite sides of the contour of the defects wasmeasured. For the single layer aluminum test sample themeasurement error is -0.11mm. For the double layer aluminum test sample measurement error is 0.13mm. Themeasurement error of dimensions of the defect of CFRPtest sample is 0.52mm. Experimental results show, that themeasurement of the dimensions of defects in multilayeredstructure using air – coupled ultrasonic technique can be performed with a relatively high accuracy.
References
1. Buckley J. Principles and applications of air - coupled ultrasonics.Insight. November 1998. Vol. 40. No.11. P. 755 – 759.
2. Blome E., Bulcaen D., Declerq F. Air – coupled ultrasonic NDEexperiments in the frequency range 750 kHz – 2 MHz. NDT&EInternational. 2002. Vol.35. P. 417 – 426.
3. Rogovsky A. J. Development and application of ultrasonic dry – contact and air – contact C – scan systems for nondestructiveevaluation of aerospace composites. Materials evaluation. December 1991. P. 1491-1496.
4. Schindel D. W. Air coupled ultrasonic measurements of adhesively bonded multi – layer structures. Ultrasonics 37. 1999. P. 185-200.
5. Kelly S. P, Hayward G. Real time through transmission inspectionof aircraft composites using air – coupled ultrasonic arrays. IEEE
ultrasonic symposium. 1995. P. 711 – 714.6. Bhardwaj M. C., Neeson I., Stead G. Introduction to contact – freeultrasonic characterization and analysis of consolidated materials. NDT.net. June 2000. Vol.5. No.6.
7. Hillger W., Meier R., Heinrich R . Inspection of CFRP components by ultrasonic imaging with air coupling. NDT.net. October 2002.Vol.7. No.10.
E. Žukauskas, V. Cicėnas, R. Kažys
Ultragarsinių matavimų per oro tarpą metodo taikymasdelaminacijos defektų matmenims nustatyti daugiasluoksnėsestruktūrose
Reziumė
Bandomas ultragarsinių matavimų per oro tarpą metodas defektų matmenims matuoti. Pateikta ultragarsinės matavimo per oro tarpą sistemos struktūrinė schema, matavimo metodas, aprašyti tiriamiejialiuminio plokštelių ir anglies pluoštu sutvirtintos plastmasės bandiniai, pateikti jų erdvinio skenavimo rezultatai. Amplitudės fliuktuacijų aplink defektą prigimčiai patikrinti atliktas bangos sklidimo per tiriamą ją struktūr ą modeliavimas baigtinių skirtumų metodu. Defektų matmenimsnustatyti išmatuotas atstumas tarp priešingų defektų briaunų .Ultragarsinių matavimų per oro tarpą rezultatai palyginti su optiniumikroskopu nustatytais matmenimis.
Pateikta spaudai 2005 03 25
6 7 8 9 10 11 12 x , mm6
7
8
9
10
11
12
13
y , mm
A
B
C
D