54055tap senegal asra cover 26-08-15
TRANSCRIPT

AGRICULTURE GLOBAL PRACTICE TECHNICAL ASSISTANCE PAPER
SENEGAL
AGRICULTURAL SECTOR RISK ASSESSMENT
Stephen D’Alessandro, Amadou Abdoulaye Fall, George Grey, Simon Simpkin, and Abdrahmane Wane
WORLD BANK GROUP REPORT NUMBER 96296-SN AUGUST 2015
Pub
lic D
iscl
osur
e A
utho
rized
Pub
lic D
iscl
osur
e A
utho
rized
Pub
lic D
iscl
osur
e A
utho
rized
Pub
lic D
iscl
osur
e A
utho
rized


SENEGAL Agricultural Sector Risk Assessment
AGRICULTURE GLOBAL PRACTICE TECHNICAL ASSISTANCE PAPER
Stephen D’Alessandro, Amadou Abdoulaye Fall, George Grey, Simon Simpkin, and Abdrahmane Wane

© 2015 World Bank Group
1818 H Street NWWashington, DC 20433Telephone: 202-473-1000Internet: www.worldbank.orgEmail: [email protected]
All rights reserved
This volume is a product of the staff of the World Bank Group. The fi ndings, interpretations, and conclusions expressed in this paper do not necessarily refl ect the views of the Executive Directors of the World Bank Group or the governments they represent.
The World Bank Group does not guarantee the accuracy of the data included in this work. The boundaries, colors, denominations, and other information shown on any map in this work do not imply any judgment on the part of the World Bank Group concerning the legal status of any territory or the endorsement or acceptance of such boundaries.
Rights and Permissions
The material in this publication is copyrighted. Copying and/or transmitting portions or all of this work without permission may be a violation of applicable law. World Bank Group encourages dissemination of its work and will normally grant permission to reproduce portions of the work promptly.
For permission to photocopy or reprint any part of this work, please send a request with complete information to the Copyright Clearance Center, Inc., 222 Rosewood Drive, Danvers, MA 01923, USA, telephone: 978-750-8400, fax: 978-750-4470, http://www.copyright.com/.
All other queries on rights and licenses, including subsidiary rights, should be addressed to the Offi ce of the Publisher, World Bank Group, 1818 H Street NW, Washington, DC 20433, USA, fax: 202-522-2422, e-mail: [email protected].
Cover photos from left to right: 1. A young Senegalese herder. IFPRI/Milo Mitchell2. Climate smart farming practices in Senegal. M. Tall/CCAFS3. Irrigation pipe. S. Kilungu (CCAFS)

iiiAgricultural Sector Risk Assessment
Acronyms and Abbreviations vii
Acknowledgments ix
Executive Summary xi
Chapter One: Introduction 1
Methodology 2
Rationale 3
Chapter Two: Agricultural Systems in Senegal 5
Agriculture Sector in Senegal 5
Agro-Climatic Conditions 6
Land and Water Resources 6
Agro-Ecological Zones 8
Crop Production Systems 8
Livestock Production Systems 12
Agricultural Markets and Trade 13
National Agricultural Policy 14
Food Security 15
Key Growth Constraints and Trends 16
Chapter Three: Agriculture Sector Risks 17
Production Risks 17
Market Risks 25
Enabling Environment Risks 31
Chapter Four: Adverse Impacts of Agricultural Risks 35
Conceptual and Methodological Basis for Analysis 35
Production Risks 36
Impacts of Production Risks 39
Summary of Impacts 40
Chapter Five: Vulnerability Analysis 41
Stakeholder and Livelihood Risk Profi les 42
Income Levels 44
Chapter Six: Risk Prioritization and Management 45
Risk Prioritization 45
Agricultural Risk Management 46
Risk Management Solutions 49
Prioritization of Risk Management Measures 54
Conclusion 56
References 57
CONTENTS
iv Senegal
Appendix A: Climate Change Impacts Analysis 61
Appendix B: Senegal Vulnerability Analysis 67
Appendix C: Agricultural Insurance in Senegal 71
Appendix D: Crop Yield Loss Analyses 77
Appendix E: Crop Pest Analysis 81
Appendix F: Rationale for Risk Assessment Methodology 85
Appendix G: Analysis of Weather Risk Events 89
Appendix H: Crop Production and Yields 91
BOX
BOX 3.1: Case Study: Contagious Bovine Pleuropneumonia (CBPP/PPCB) in Senegal 24
FIGURES
Figure ES.1: Timeline of Major Shocks to Agricultural Production in Senegal (2004–06 = 100), 1980–2012 xii
Figure ES.2: Impact and Frequency of Major Agricultural Risks in Senegal, 1980–2012 xii
Figure 1.1: Agricultural, Value Added (annual % growth), 1980–2013 2
Figure 1.2: Agricultural Sector Risk Management Process Flow 3
Figure 2.1: Climatic Zones of Senegal 7
Figure 2.2: Average Annual Rainfall by Region, 1980–2013 7
Figure 2.3: Agro-Ecological Zones in Senegal 8
Figure 2.4: Trends in Crop Production Area Harvested (thousand ha), 1980–2012 9
Figure 2.5: Share of Livestock Units in Senegal, 1961–2012 12
Figure 2.6: Growth in Poultry Production (thousands), 1997–2011 13
Figure 2.7: Trade in Cash Crops (in MT), 2002–11 14
Figure 2.8: Trade in Staple Crops (in MT), 2002–11 15
Figure 2.9: Retail Prices for Key Staple Crops (CFA/kg), 2001–13 16
Figure 3.1: Variations in Temperature and Rainfall, 1900–2009 18
Figure 3.2: Precipitation Patterns of Major Regions, 1978/79–2008/09 18
Figure 3.3: Climate Variability Map for Senegal 20
Figure 3.4: Nominal Producer Prices for Key Staple Crops (CFA/kg), 2000–13 26
Figure 3.5: International vs. Domestic Groundnut Oil Prices, 1984–2013 27
Figure 3.6: International vs. Domestic Cotton Prices, 1984–2013 27
Figure 3.7: International vs. Domestic Maize Prices, 1984–2013 28
Figure 3.8: Dahra Market Livestock Prices (CFA/head), 2005–10 29
Figure 3.9: Goats vs. Cereals Terms of Trade, 2005–12 30
Figure 3.10: Historical Exchange Rates, 2001–12 30
Figure 4.1: Timeline of Major Shocks to Agricultural Production in Senegal (2004–06 = 100), 1980–2012 36
Figure 4.2: Indicative Losses from Risk Events to Groundnut Production, 1980–2012 38

vAgricultural Sector Risk Assessment
Figure 4.3: Proportional Impact of Various Adverse Risk Events by Crop, 1980–2012 39
Figure 4.4: Frequency and Cumulative Impact of Various Adverse Risk Events, 1980–2012 40
Figure 6.1: Integrated Risk-Layering Solutions 47
Figure A.1: Rain-Fed Maize Yield Change under Four Climate Models, 2010–50 (IPCC A1B Scenario) 63
Figure A.2: Rain-Fed Groundnuts Yield Change under Four Climate Models, 2010–50 (IPCC A1B Scenario) 64
Figure A.3: Rain-Fed Rice Yield Change under Four Climate Models, 2010–50 (IPCC A1B Scenario) 65
Figure B.1: Senegal Livelihood Zone Map 69
Figure B.2: Food Price Shocks by District 70
Figure D.1: Groundnuts, 1980–2012 77
Figure D.2: Cotton, 1980–2012 77
Figure D.3: Maize, 1980–2012 78
Figure D.4: Rice, 1980–2012 78
Figure D.5: Cowpea, 1980–2012 78
Figure D.6: Potato, 1980–2012 79
Figure D.7: Tomato, 1980–2012 79
Figure D.8: Onion, 1980–2012 79
Figure D.9: Green Bean, 1989–2012 80
Figure D.10: Mango, 1989–2012 80
Figure H.1: Millet Production, 2003–12 91
Figure H.2: Sorghum Production, 2003–12 91
Figure H.3: Cowpea Production, 2003–12 92
Figure H.4: Rice Production, 2003–12 92
Figure H.5: Maize Production, 2003–12 92
Figure H.6: Groundnut Production, 2003–12 92
Figure H.7: Cotton Production, 2003–12 93
Figure H.8: Onion Production, 2002–11 93
Figure H.9: Tomato Production, 2002–11 93
Figure H.10: Potato Production, 2003–12 93
Figure H.11: Mango Production, 2002–11 94
Figure H.12: Green Bean Production, 2002–11 94
TABLES
Table 2.1: Senegal National and Agricultural Statistics, 2012 6
Table 2.2: Trends in Crop Production, 1980–2012 9
Table 3.1: Variability of Rainfall by Region 18
Table 3.2: Frequency and Impact of Rainfall Events by Region, 1980–2013 21
Table 3.3: Major Livestock Diseases 24
vi Senegal
Table 3.4: Inter-Annual Crop Price Variability, 1991–2011 25
Table 3.5: Vaccination Coverage in Senegal, 2009 33
Table 4.1: Cost of Adverse Events for Crop Production, 1980–2012 37
Table 4.2: Coeffi cients of Variation for Crop Production, 1980–2012 37
Table 4.3: Indicative Losses for Major Crops, 1980–2012 38
Table 4.4: Dates and Frequencies of Agricultural Risk Events 39
Table 5.1: Frequency of Risk Events and Percentage Aff ected 42
Table 6.1: Risk Prioritization Matrix 46
Table 6.2: Listing of Priority Risks by Commodity 47
Table 6.3: Proposed Risk Management Mechanisms 48
Table 6.4: Filtering Criteria for Risk Management Solutions 55
Table B.1: Prevalence of Food Insecurity by District 68
Table B.2: Vulnerable Groups 70
Table C.1: Insurance Premium Components 74
Table E.1: Rice: Preharvest 81
Table E.2: Rice: Postharvest 82
Table E.3: Sorghum: Preharvest 82
Table E.4: Sorghum: Postharvest 83
Table E.5: Millet: Preharvest 83
Table E.6: Millet: Postharvest 83
Table E.7: Cowpea: Preharvest 84
Table E.8: Cowpea: Postharvest 84
Table G.1: Frequency of Low Rainfall Events by Region, 1981–2010 89
Table G.2: Frequency of High Rainfall Events by Region, 1981–2010 90

viiAgricultural Sector Risk Assessment
Acronym Defi nition
ARMT Agricultural Risk Management TeamCAADP Comprehensive Africa Agriculture
Development ProgrammeCBPP Contagious Bovine PleuropneumoniaCA Conservation AgricultureCFA CFA francCSE Centre de Suivi EcologiqueCNASS Compagnie Nationale d’Assurances Agricole
du SénégalDAPS Direction de l’Analyse de la Prévision et des
StatistiquesDNCB Dermatose Nodulaire Contagieuse BovineDPC Directorate of civil protectionDRR Disaster risk reductionFAO Food and Agriculture Organization of the UNFAOSTAT FAO StatisticsFMD Foot and Mouth DiseaseGCM General Circulation ModelGDP Gross Domestic ProductG-8 Group of EightGOS Government of Senegal
ACRONYMS AND ABBREVIATIONS
Acronym Defi nition
Ha Hectare IFPRI International Food Policy Research InstituteIPM Integrated Pest ManagementISRA Institute Sénégalais de Recherches AgricolesLSD Lumpy Skin DiseaseLGP Length of Growing PeriodMEF Ministry of Economy and FinanceMT Metric tonsNAPA National adaptation programme of actionNCD Newcastle DiseaseNDVI Normalized Diff erence Vegetation Index OIE Organisation International des Epizooties.PPCB Pleuropneumonie Contagieuse BovinePPP Public-private PartnershipPPR Peste de Petits RuminantsSODEFITEX Société de Développement et des Fibres
Textiles TLU Tropical Livestock UnitsUSAID U.S. Agency for International DevelopmentWFP World Food ProgrammeXAF CFA franc
ACRONYMS AND ABBREVIATIONS


ixAgricultural Sector Risk Assessment
To better understand dynamics of agricultural risks and identify appropriate responses, incorporate agricultural risk perspective into decision making, and build capacity of local stakeholders in risk assessment and management, the Agricultural Risk Manage-ment Team (ARMT) of the Agriculture and Environment Services Department of the World Bank is conducting an agricultural sector risk assessment in Senegal. The cur-rent report was developed by a team led by Stephen D’Alessandro and comprising Amadou Abdoulaye Fall, George Grey, Kersten Hell, Traci Johnson, Simon Simpkin, Kilara Suit, and Abdrahmane Wane.
The team is especially grateful to Aifa Fatimata Ndoye Niane and Vikas Choudhary of the World Bank for their support and inputs throughout the activity’s planning, fieldwork mission, and report preparation. The team would also like to extend its appreciation to Maguette Diop Ndiaye of the Ministry of Economics and Finance, the Ministry of Agriculture and Rural Equipment, other government representatives, farmers, market traders, and all those who shared their perspective and insights, which provided the basis for this study and its findings.
This activity would not have been possible without the generous contributions from USAID, Ministry of Foreign Affairs of the Government of the Netherlands and State Secretariat for Economic Affairs (SECO) of the Government of Switzerland.
ACKNOWLEDGMENTS


xiAgricultural Sector Risk Assessment
Senegal’s agricultural economy today accounts for roughly one-sixth of national gross domestic product (GDP), down from nearly one-quarter in the mid-1980s. Although sector output has expanded by 70 percent over the past 30 years, population growth has quadrupled. During this period, successive government policies have promoted intensifi cation of crop and livestock production via supportive policies and public investments.1 And yet, growth has been lackluster amid limited take-up of improved seeds and fertilizer consumption that remains among the lowest in the region. A major limiting factor has been widespread reluctance among the millions of smallholder farmers in Senegal who dominate production to assume the risks associated with increased productivity. With only limited capacity to manage these risks, highly vulner-able farmers choose to limit their exposure by limiting their outlays. Moreover, unman-aged risks have a profound impact on sector performance. A sound understanding of the risks faced by farmers and other agricultural sector stakeholders enables develop-ment of risk management systems that can at once support new productivity invest-ments, strengthen resilience, reduce losses, and drive sector growth.
This agricultural risk assessment study was undertaken to provide a review of produc-tion, market, and enabling environment risks facing farmers and other stakeholders across Senegal’s agriculture sector. The report has been compiled with extensive anal-ysis of crop and livestock production, price, and meteorological data records over the period 1980–2012. It includes a review of key documentary evidence of yield and risk events together with input from interviews held with farmers, traders, processors and others in rural Senegal as well as with government and agricultural research staff between March and May 2014. The results of the analysis are considered in the light of the vulnerability of the diff erent stakeholders to the eff ects of ex post shock events and the resulting ex ante impact upon investment. The most salient issues and results of this analysis are outlined in the text of the report. A considerable volume of sup-porting data is supplied in the appendixes, including (1) an analysis of cumulative rainfall during 1980–2013; (2) an assessment of levels of vulnerability among key
1 GOS expenditures on agriculture (as a percentage of total expenditure) have exceeded 12 percent on average during the 10-year period 2000–10, well above the 10 percent commitment under NEPAD’s CAADP framework.
EXECUTIVE SUMMARY

xii Senegal
livelihood groups; (3) a review of current agricultural insurance initiatives and market development options; and (4) an analysis of probable climate change impacts on crop production systems. The report’s principal fi ndings, conclusions, and recommendations are summarized below.
Figure ES.1 depicts a historical timeline of the most nota-ble risk events that adversely aff ected sector performance during the period under review. At the national level, the analysis highlights agricultural production and livelihood systems that are highly vulnerable to downside risks. These most notably include erratic rainfall and drought as a more extreme but less frequent expression of the same phenomenon. Severe drought, especially in northern regions, emerges as the biggest risk in terms of estimated aggregate losses to crop and livestock—a one in every four years event on average over the review period. The analy-sis also suggests a corresponding increase in the frequency of fl oods over the same period, but with limited aggregate impact on agricultural supply chains. After drought, locust outbreaks are the second most common and costly risk aff ecting agricultural production. Other notable risks include price volatility and other crop pests.
Since 1980, the agricultural sector has been subject to at least 11 major production shocks, with a frequency of every three to four years on average across the 33-year
review period. The results of trend analyses indicate that for the 12 crops analyzed, the loss of production over the period was approximately 4.82 million metric tons (MT), with an estimated value of US$1.40 billion, or 3.9 percent of agricultural GDP on an average annual basis (fi gure ES.2). It is worth noting that this refl ects only the ex post impact. The ex ante impact may be of equal magnitude or even larger. Although the average annual impact of shocks on GDP is relatively modest (less than 4 percent), actual impacts when they occur can result in losses of the order of 10 to 20 percent of sector GDP. According to the analysis, Senegalese agriculture is subject to losses exceed-ing 10 percent of gross production value in one out of
FIGURE ES.1. TIMELINE OF MAJOR SHOCKS TO AGRICULTURAL PRODUCTION
IN SENEGAL (2004–06 = 100), 1980–2012
Source: World Development Indicators
0
20
40
60
80
100
120
140
160
180
1980 1982 1984 1986 1988 1990 1992 1994 1996 1998 2000 2002 2004 2006 2008 2010 2012
Crop production index Food production index Livestock production index
Severe drought,
1980
Severedrought;locusts,1983-84
Locusts, 1988
Locusts, 1992
Late rains,regional
droughts,1996-98
Severedrought;
cold rains;locusts,
2002
Locusts,2004 Erratic
rainfall;birds,2007
Late/erraticrainfall;locusts,
2011
FIGURE ES.2. IMPACT AND FREQUENCY OF
MAJOR AGRICULTURAL RISKS
IN SENEGAL, 1980–2012
–200
0
200
400
600
800
1000
0 0.05 0.1 0.15 0.2 0.25 0.3 0.35
in U
S$
mill
ions
Frequency
Locusts Birds Erratic rainfall/drought Flooding Armyworm

xiiiAgricultural Sector Risk Assessment
every fi ve or six years on average due to unmanaged risks. Erratic rainfall and/or drought account for approximately 50 percent of crop yield reductions. Pests and diseases, especially locusts, account for a further 25 percent.
PRODUCTION RISKSThe most important factor contributing to crop and livestock production risk in Senegal is weather (fi gure ES.2). The key aspect of weather risk is that due to moisture stress caused either by erratic rainfall, early cessation of rains, delayed onset of rains, or extended drought. Even in the absence of these specifi c condi-tions, it has been shown that more than 40 percent of the variation in national crop yields can be ascribed sim-ply to the variation in annual rainfall amounts. From an agricultural perspective, the geographic extent of other aspects of weather (wind, fl oods, and hail) is so limited that they have no discernible impact on aggregate, national-level yields.
The impact of historical and future climate change on rainfall amounts and intensities in Senegal is uncertain. Historically, national rainfall data suggest that rainfall amounts were decreasing until 1990, but since then, annual cumulative levels show an increasing trend. Although aspects of climate contribute substantially to the risk faced by producers, the anticipated impact of cli-mate change upon that risk appears to be uncertain, the most consistently predicted trend being an increase in the variability and intensity of rainfall amounts.
The three most signifi cant crop pests are the Senegalese grasshopper or “sauteuriaux” (Oedaleus senegalensis), locusts (Locusta migratoria), and birds (mainly quelea fi nch). The fi rst two are non–crop specifi c whereas the third is con-fi ned mainly to sorghum and millet (although maize can also be aff ected). During the 33-year review period, there have been recurrent locust invasions in Senegal, with sig-nifi cant impact on both cash and food crops, and also aff ecting livestock production through loss of grazing. Damage can be highly localized, but large swarms can aff ect vast tracts of land. Damages due to locusts in 2004 were estimated at 2 million tons of crops, equivalent to 20 percent of the population’s food needs in the Sahel region. Although all of the stakeholders confi rmed that pests and
diseases are one of the main risks to agricultural produc-tion, most farmers do not have the knowledge or the fi nancial means to adequately tackle crop pests.
For livestock production, the increasing unpredictability of rainfall is a notable risk. However, erratic rainfall or even geographically limited drought is a risk among pas-toralists only in the event that they are unable to migrate to more favorable pastureland. It is widespread drought, severely limiting the carrying capacity of the entire regional grazing area, which constitutes the biggest risk faced by livestock producers. Cold rainfall can have an equally devastating impact, although both occur relatively infrequently. Another noteworthy risk for livestock pro-ducers are bushfi res, which according to some estimates damage as much as 6 percent of the potential dry season grazing area and destroy on average 3.8 million MT of biomass each year.
Livestock disease in general was highlighted as a risk in fewer than one of fi ve meetings conducted, but individual diseases were mentioned more frequently. In particular, producers noted losses due to Rift Valley fever, highly pathogenic avian infl uenza, and Newcastle disease. These three diseases are considered to be among the three most important livestock production risks. Avian infl uenza and Rift Valley fever are also considered as market risks as they both can have a large impact and infl uence on both local and international trade.
Notably, other diseases such as foot and mouth disease (FMD) and contagious bovine pleuropneumonia (CBPP) could be considered as major risks if the response mecha-nisms required for control and eradication were actually put in place. This would require the quarantining and slaughter of whole herds, which would have a major impact on the whole livestock industry. Currently, how-ever, the government implements less extreme control measures and although there are some losses in productiv-ity, the impact is relatively limited.
MARKET RISKSAmong market risks, price volatility for both food and cash crops and livestock was assessed through the statisti-cal analysis of both domestic and international time-series

xiv Senegal
data. The analysis found considerable variability of domestic food crop prices together with limited variability of domestic cash crop prices. International prices of rice, maize, groundnut oil, and cotton were more variable, with coeffi cients of variation exceeding 40 percent in some cases. The analysis suggested that companies that process locally purchased commodities for export (that is, cotton, groundnuts) face a signifi cant price risk because the domestic purchasing price may vary independently of the export price, as a result of both the local price setting mechanism. Although exchange rate fl uctuations can also contribute to price risk for exporters of locally purchased products, the exchange rate of the CFA franc (XAF) to the U.S. dollar has shown only modest variability over the past 12 years.
The impact of price risk varies substantially according to the crop and its importance to the rural economy. The price of staple crops at this time is critical to household food security and the risk that increased food prices might reduce the accessibility of food has a substantial impact on household resource management. It is the profoundly negative ex post impacts of these fl uctuations upon nutrition, health, and survival that result in staple food price shocks as being listed as the highest priority risk faced by rural households. Because few producers grow cash crops without fi rst securing their own supply through staple crop production, the ex post risks to nutri-tion, health, and survival caused by fl uctuations in cash crop prices tend to be less pronounced. As a result, ex ante risk impacts are also reduced. This may be less the case for producers of horticultural crops who are exclu-sively oriented toward the market and who are often exposed to higher levels of price volatility. More gener-ally, price risk for cash crops is visited mainly upon the buyers of commodities, although price fl uctuations can contribute signifi cantly to the risks faced by all stakehold-ers in cash crop subsectors.
Traditionally, the limited reliance of pastoralists upon markets implied a limited impact of price risk upon pas-toral livestock production, but this situation is changing. Livestock prices often plummet while food prices increase; this is now a common shock-induced pattern in dry lands and a major risk for livestock owners. Within the poultry sector, volatility in price of imported feed
components, notably corn and soya, which contribute 80 percent of poultry feed, is considered a major source of risk.
ENABLING ENVIRONMENT RISKSWhen ranked in terms of impact and frequency, a key risk noted within the livestock sector is derived from uncer-tainty over land tenure and access. As noted above, access and mobility are critical to pastoral livelihoods. The anal-ysis indicates that inconsistent policy making and imple-mentation of regulations can weaken traditional coping mechanisms and increase vulnerability levels among extensive pastoralist communities, particularly in the north where land use pressures are increasing. Similar uncertainty is derived from the inconsistent delivery of animal health services, including the enforcement of poli-cies on vaccination, quarantine, and movement.
Where confl ict occurs, unrestrained by the rule of law, then the impact of risk, both ex post and ex ante, is considerable. Such risk has been widespread in Casamance, where grow-ers limit both the area and the level of investment applied to crop production. Impacts on wealthier livestock owners who own larger herds can be substantial, with more than 60 percent losses being reported in some cases. Confl ict and tensions between herders and crop growers, particularly in the north, were highlighted as risks by several interlocutors during the course of the study. In addition, anecdotal evi-dence would suggest that the confl ict in northern Mali has destabilized Senegalese livestock markets in recent years and contributed to higher levels of price volatility.
VULNERABILITYUnderstanding levels of exposure to diff erent risks and of mitigation and coping capacity among the various liveli-hood groups can help decision makers better target inter-ventions. Among livelihood groups, nomadic pastoralists manage weather risks by continually moving to fresh graz-ing grounds. However, growing land pressures place strains on their mobility and their access to suffi cient graz-ing and water, and thus their capacity to cope. Agro- pastoralists tend to be among the poorest households, which typically lack the resources needed to absorb shocks,

xvAgricultural Sector Risk Assessment
and exhibit the highest levels of vulnerability. The risk of inadequate moisture renders dry land smallholders more vulnerable to production risk than their irrigated counter-parts and this is refl ected in the lower levels of inputs applied to dry land crops. The extent to which intensive livestock producers are more or less vulnerable to risk than their extensive counterparts is debatable. On bal-ance, it would appear that although the impacts of risk events upon intensive livestock production may be greater than those experienced by extensive producers, most intensive producers have a greater capacity both to pre-vent such events and to withstand their impacts.
Commercial farmers face many of the same risks as do smallholders, but their levels of vulnerability diff er. Com-mercial producers may be able to absorb more production risk, but face greater price risk. Processors are vulnerable to market risk because of increased local prices and/or reduced costs of competing imports. Cotton and ground-nut processors are also vulnerable to the risk of afl atoxin contamination, which cannot be detected in the unpro-cessed materials but which can render the fi nal products unmarketable if subsequently detected. Processors also face the risk of inadequate supplies as a result either of poor production, or of a redirection of inputs toward food crops for own consumption, especially after a poor har-vest. Traders are primarily vulnerable to risks caused by market uncertainty. In particular, they can have poor knowledge of market volumes or of the extent of produc-tion. As a result of this vulnerability, few traders are will-ing to accumulate large positions with the intention of selling at higher prices.
RISK MANAGEMENTThe government of Senegal (GOS) understands the importance of putting in place eff ective agricultural risk mitigation systems. It has adopted in recent years a range of capacity-building measures toward reducing Senegal’s exposure to natural disasters and impacts from a changing climate. These measures include the creation of the Directorate of Civil Protection (DPC), the development of a National Platform for Disaster Risk Reduction (DRR), and the elaboration of a National Action Plan on DRR (2010–15). Senegal also participates in the recently launched, EU-led Global Alliance for Resilience Initiative
(AGIR), a regional response to chronic food and nutri-tional insecurity across the Sahel, and is an active member of the Comité Permanent Inter Etats de lutte contre la Sécheresse dans le Sahel (CILSS). In 2006, Senegal fi nal-ized its National Adaptation Programme of Action (NAPA) for climate change adaption. Following 2011’s severe drought aff ecting northern pastoralists zones, GOS set up emergency feed stocks under its Operation sauveguard du betail. Such GOS initiatives are already helping to safe-guard livelihoods, promote climate adaptation, and strengthen household resilience. And yet, as highlighted by this report, agricultural supply chains in Senegal remain highly vulnerable to a wide range of risks that jeopardize rural livelihoods. The current study highlights the need for a more targeted and systematic approach to agricultural risk management in Senegal.
Based on an analysis of key agricultural risks, an evalua-tion of levels of vulnerability among various stakeholders, and the fi ltering of potential risk management measures, this assessment makes the following recommendations for GOS’s consideration. The proposed focus areas of inter-vention encompass a broad range of interrelated invest-ments, which together hold strong scope to improve agricultural risk management and strengthen the resil-ience of agricultural systems in Senegal.
1. Strengthening extension delivery systems (for example, face-to-face, farmer-driven, ICT-based [Information and Communication Technology]) for improved farmer access to technology and agronomic advice on improved soil, water, and pest management practices (for example, conser-vation agriculture, integrated pest management [IPM]).
2. Promoting improved water management mea-sures (for example, water pans, roof and rock catchment systems, subsurface dams) and microir-rigation technology (for example, drip irrigation) via community-led initiatives (for example, cash/food for work programs).
3. To further reduce rainfall dependency and better exploit existing water and land resources, promot-ing expansion of irrigation infrastructure.
4. Promoting use of contour erosion and fi re barriers, cisterns for storing rainfall and runoff water, controlled/rotational grazing, grazing banks,

xvi Senegal
homestead enclosures, residue/forage conserva-tion, and other Sustainable Land Management (SLM) practices to reverse degradation of water, soil and vegetation cover ensure sustainable access to grazing land.
5. Establishing and improving regional and national normalized diff erence vegetation index (NDVI) and early warning systems and farmer training linked to an eff ective and early emer-gency response system for drought and locust outbreaks.
6. To improve decision making among farmers and pastoralists and attenuate price volatility, strength-ening the quality and access to needed agro information, including weather forecasting, exten-sion advice and innovations (that is, seeds, water management), input/output prices, and so on for improved decision making.
7. Strengthening seed distribution systems, vaccina-tion programs, and animal health services through improved monitoring and enforcement of existing quality control regulations governing product and service delivery, institutional capacity-building, reform measures, and so on.
8. Building resiliency in northern pastoralist zones via more broadly inclusive policy making around land administration for improved mobility and access, and development of community-driven feed/fodder production and storage centers.
CONCLUSIONThis Phase I assessment assesses agricultural risks and impacts during the period 1980–2012. By documenting and analyzing how Senegal’s agricultural economy has been aff ected in the past by risk events, the study has
generated insight into which sources of risks are most likely to aff ect the sector and dependent livelihoods in the future. By prioritizing risks, the study can help GOS focus attention and resources on a smaller set of key risks that are having the most adverse impacts on production yields, incomes, and livelihoods. The study suggests a framework for the development of a more comprehensive, integrated risk management strategy to strengthen and broaden existing mitigation, transfer, and coping measures in Senegal. Finally, it provides a fi ltering mechanism to aid in the selection of a set of strategic interventions for improved agricultural risk management.
The assessment recognizes that many of the proposed strategies may already be covered to varying degrees under existing risk management programs. Others may currently be in the process of implementation, either by government agencies or by donors. Moving forward, the Phase II Solutions Assessment will analyze the eff ective-ness of existing programs, identify and assess challenges impeding their eff ectiveness, and outline strategies for scaling up eff ective interventions to reach a larger number of benefi ciaries. This follow-up activity will place strong emphasis on ensuring a more coordinated, integrated approach to risk management in Senegal to ensure more eff ective and meaningful risk reduction and resilience building across the sector.
It is hoped that the fi ndings and conclusions of this assess-ment will help to contribute to the existing knowledge base regarding the agricultural risk landscape in Senegal. It is also hoped that the study will help to inform a dia-logue moving forward between the GOS, the World Bank, and GOS’s other development partners that will lead to concrete interventions toward improved agricultural risk management and stronger resilience among stakeholders in the years ahead.
1Agricultural Sector Risk Assessment
Risks are a pervasive and permanent fi xture of the agricultural landscape. They are also costly. Unchecked, they breed uncertainty and stifl e investments. For a given rate of return, the higher the risk associated with an agricultural enterprise, the lower the level of investment that it can attract. On the aggregate, this can have a debilitating impact on sector growth. This is especially true when risk is amplifi ed by a limited capacity to absorb shocks. When risks do manifest, they can cause substantial losses to income and assets—especially among the most vulnerable communities—placing livelihoods, and in extreme cases, sector growth, in jeopardy. Failing to address agricultural risk can severely hamper long-term economic growth and poverty reduction eff orts.
The performance of Senegal’s agricultural performance exemplifi es the impact of unmanaged risk on productivity among vulnerable smallholder crop producers and pastoralists. Despite the fact that well over half (57.1 percent in 2012) of the popula-tion lives in rural areas and derives some portion of its livelihood from agriculture, the sector itself contributes less than one-fi fth (16.7 percent in 2012) to GDP, according to the World Bank. Despite several years of strong performance, sector growth has averaged 2.3 percent since 1980, amid notable volatility in year-on-year performance (fi gure 1.1).
A succession of agricultural strategies designed to increase productivity has largely failed to intensify production beyond a subsistence level, and much of the country, although suitable for agriculture, remains underdeveloped. Keeping risks in check, shielding the most vulnerable, and building resilience among all agricultural stake-holders to better withstand and recover from inevitable shocks requires moving from ad hoc interventions to proactive, systematic and sustained risk management.
The government of Senegal has historically responded to drought and other shocks with direct fi nancial support to farmers as well as general assistance to the rural popu-lation. More recently, GOS put in place a series of emergency response and fi nancial mechanisms to help aff ected communities better cope with shocks and enhance fl ows of rural credit. These include the Fonds de Bonifi cation, Fonds de Garantie, and the
CHAPTER ONE
INTRODUCTION

2 Senegal
Fonds de Calamité. The newly launched Operation de Sauvegarde du Betail organizes distribution of feed sup-plements to protect at-risk, breeding livestock (for exam-ple, lactating females, calves) when access to suffi cient grazing is constrained. In 2014, Senegal was one of fi ve countries to subscribe to a new pan-African drought index insurance facility under the Agricultural Risk Capacity (ARC) initiative. Important as these and other initiatives are, GOS recognizes that these eff orts alone are insuffi -cient to insulate agricultural supply chains and the liveli-hoods they support from adverse shocks.
It is within this context that the World Bank, with support from the G-8 and the USAID and in collaboration with the Ministry of Agriculture and Rural Equipment (MARE), commissioned the present study. The objective of this assessment was to assist the government of Senegal to (1) identify, analyze, quantify, and prioritize principal risks (that is, production, market, and enabling environ-ment risks) facing the agricultural sector; (2) analyze the impact of these risks; and (3) identify and prioritize appro-priate risk management (that is, mitigation, transfer, cop-ing) interventions that might contribute to improved stability, reduced vulnerability, and increased resilience of agricultural supply chains in Senegal. This report presents a summary of the assessment’s key fi ndings.
METHODOLOGYThe analysis presented in this report is based on a methodology for assessing risks in agricultural supply
chains. The methodology was designed by the Agricul-tural Risk Management Team of the World Bank. It off ers a conceptual framework and set of detailed guidelines for conducting a more systemwide assess-ment of risk, risk management, and vulnerability within agricultural supply chains. The methodology contains logical steps within four consecutive phases (fi gure 1.2). Phase I, for which this study is the primary deliverable, focuses on identifying, quantifying, and prioritizing the major risks that cause adverse shocks to the sector.
Following in-depth analysis of historical, time series rain-fall, crop and livestock production, pricing, and other baseline data, the Assessment Team conducted broad-based, in-country consultations with stakeholders during March 2014. These included individual farmers, farmer groupings, input suppliers, market traders, food proces-sors, and representatives of the government and research and academic institutes in and around Dakar and in key agricultural production zones across Thies, Fatick, Diourbel, Kaolack, Kaff rine, Louga, and St. Louis. The mission team organized a wrap-up roundtable consulta-tion hosted by the Ministry of the Economy and Finance (MEF) on March 21 to share preliminary results and solicit feedback. Participants were asked to prioritize pos-sible future interventions by ranking a long list of risk mitigation, transfer, and coping interventions. Their input provided valuable insights into GOS priorities and all feedback has been incorporated into the study’s analy-sis and fi ndings.
–30
–25
–20
–15
–10
–5
0
5
10
15
20
25
1980 1982 1984 1986 1988 1990 1992 1994 1996 1998 2000 2002 2004 2006 2008 2010 2012
Source: World Development Indicators.
FIGURE 1.1. AGRICULTURAL, VALUE ADDED (ANNUAL % GROWTH), 1980–2013

3Agricultural Sector Risk Assessment
The results of this assessment will provide the concep-tual basis for Phase II, which will focus on identifying priority solution areas and related risk management interventions best suited to managing the priority risks identifi ed. By the end of this activity, the World Bank—in close collaboration with GOS, its donor partners, and other sector stakeholders—will develop and validate a matrix of priority interventions related to risk mitiga-tion, transfer, and coping within a comprehensive and systematic risk management framework. It is hoped that the outcome of this assessment will serve to inform ongoing and future GOS sector policy and planning, which will secure improved sustainability of agricultural investments and enhance long-term agricultural resil-ience and growth.
RATIONALEThe rationale behind the risk prioritization exercise is based upon the nature of risk in agriculture. There is no standardized procedure for the quantifi cation and mea-surement of agricultural risk. Although it is possible to measure the ex post impacts of events that contribute to risk in terms of the loss of yield or income resulting from those events, it is far more diffi cult to estimate income foregone by producers, traders, and others who limit their
investments because perceived risks associated with the production and marketing of a specifi c crop or animal. Such ex ante impacts of risk might be quantifi ed as poten-tial losses, but their attribution and measurement are extremely complex.
This analysis focuses mainly upon the ex post impacts of adverse events associated with risk. Ex ante impacts of risk upon investment decisions are largely ignored. The measurement of perceived risk and associated impacts upon investment decision making is a complicated task that goes beyond the resources available in this prelimi-nary assessment. Elbers, Gunning, and Kinsey (2007) pro-posed that ex ante impacts of risk upon agricultural GDP (in terms of foregone production) are potentially as great if not greater than ex post impacts from risk events. This assessment is based on the premise that ex ante impacts can reasonably be expected to be roughly proportional to ex post losses. Thus, after taking into account the qualita-tive input from interviews and focus groups, the priority components of risk can be readily identifi ed and responses recommended. A more detailed justifi cation of the methodology is given in appendix F.
Chapter 2 of the report provides an overview of the agri-cultural sector in Senegal and a discussion of key growth constraints. This is followed by an assessment of the main
Source: World Bank.
FIGURE 1.2. AGRICULTURAL SECTOR RISK MANAGEMENT PROCESS FLOW
PHASE I PHASE 2 PHASE 3 PHASE 4
Client demand
Riskassessment
Desk review Desk review Implementation
Monitoring risks
Refining RM strategy
Solutionsassessment
Stakeholderconsultations
Finalize analysisStakeholderworkshop
In-countryassessment mission
Development of riskmanagement plan
RM plan developmentby stakeholders
Incorporation intoexisting govt.programs and
development plans
Implementation andrisk monitoring
4 Senegal
agricultural risks (that is, production, market, enabling environment) in chapter 3. Chapter 4 analyzes the fre-quency and severity of highlighted risks and assesses their impact. Chapter 5 presents some stakeholder perceptions of risks and evaluates levels of vulnerability among various
livelihood groups. The study concludes in chapter 6 with an assessment of priorities for risk management and a broad discussion of possible risk management measures that could help to strengthen the resiliency of agricultural supply chains and the livelihoods they support.

5Agricultural Sector Risk Assessment
To inform the analysis and discussion of agricultural risk in Senegal, this chapter presents an overview of the country’s agriculture sector. The most pertinent sector characteristics related to risk are given particular attention. The analysis primarily covers the 33-year period from 1980 to 2012 to assess the frequency and severity of the most important risks.
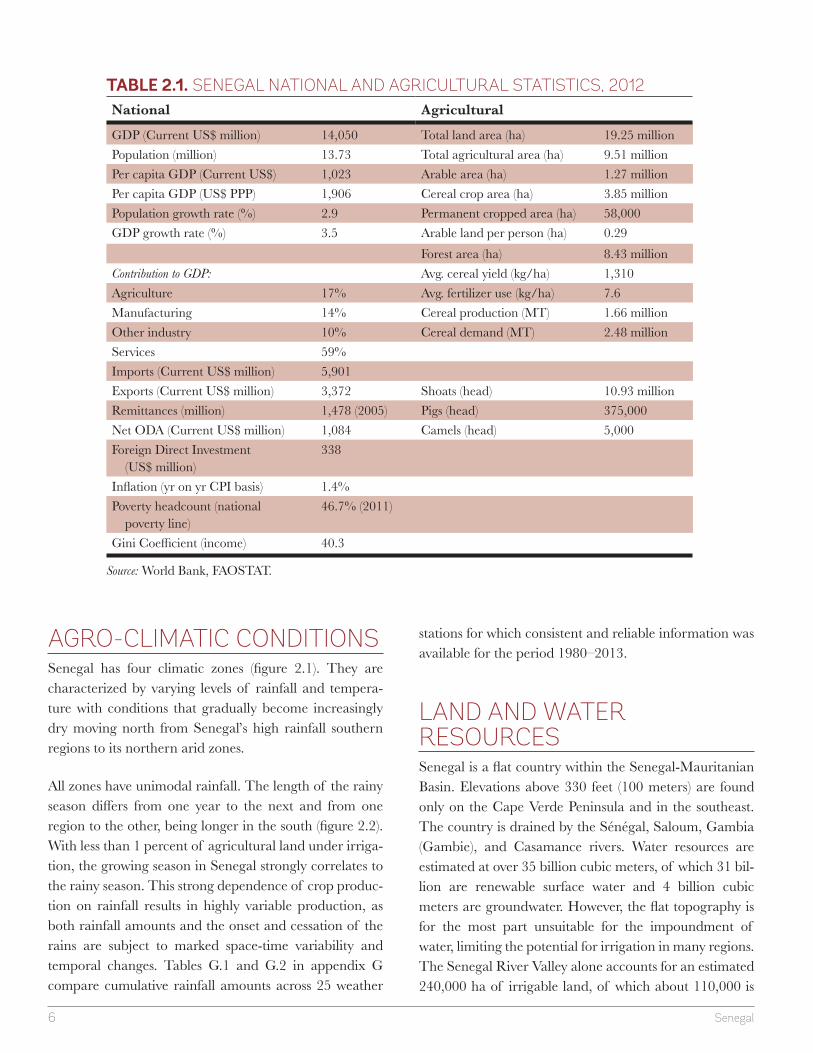
AGRICULTURE SECTOR IN SENEGALTable 2.1 shows the key economic indicators for Senegal with notable import to agri-culture. Of particular relevance is the fact that while approximately 57.1 percent2 of the population lives in rural areas and is largely dependent upon agriculture, over the fi ve years up to 2012, agriculture and associated activities generated only 16.7 per-cent of national GDP, according to the World Bank’s World Development Indicators. Considering the current GDP of US$14.05 billion and a population of 13.73 mil-lion, it is evident that there is considerable discrepancy in rural vs. urban incomes. Whereas per capita GDP may be US$1,023, the average per capita value added for the population dependent upon agriculture is US$300; the rest of the largely urban population is 6.7 times higher (US$2,000). This is due largely to the relatively low output of the country’s agricultural production systems, which generate less than US$1.00 per capita per day. This suggests that the bulk of agricultural activity is of a subsistence nature.
In fact, the level of production is inadequate to meet national demand and Senegal imports signifi cant volumes of food. Food imports in 2012 were worth US$1,546 mil-lion, or 11 percent of GDP and up to 26 percent of total imports by value, according to the World Bank. Senegal’s exports are valued at slightly over 50 percent of total imports and the current account is balanced largely through a combination of remit-tances and development assistance.
2 According to the World Bank, Senegal has one of the highest levels of urbanization in Africa, estimated at 42.9 percent in 2012 and growing at a rate of 3.6 percent per year.
CHAPTER TWO
AGRICULTURAL SYSTEMS IN SENEGAL
6 Senegal
AGRO-CLIMATIC CONDITIONSSenegal has four climatic zones (fi gure 2.1). They are characterized by varying levels of rainfall and tempera-ture with conditions that gradually become increasingly dry moving north from Senegal’s high rainfall southern regions to its northern arid zones.
All zones have unimodal rainfall. The length of the rainy season diff ers from one year to the next and from one region to the other, being longer in the south (fi gure 2.2). With less than 1 percent of agricultural land under irriga-tion, the growing season in Senegal strongly correlates to the rainy season. This strong dependence of crop produc-tion on rainfall results in highly variable production, as both rainfall amounts and the onset and cessation of the rains are subject to marked space-time variability and temporal changes. Tables G.1 and G.2 in appendix G compare cumulative rainfall amounts across 25 weather
stations for which consistent and reliable information was available for the period 1980–2013.
LAND AND WATER RESOURCESSenegal is a fl at country within the Senegal-Mauritanian Basin. Elevations above 330 feet (100 meters) are found only on the Cape Verde Peninsula and in the southeast. The country is drained by the Sénégal, Saloum, Gambia (Gambie), and Casamance rivers. Water resources are estimated at over 35 billion cubic meters, of which 31 bil-lion are renewable surface water and 4 billion cubic meters are groundwater. However, the fl at topography is for the most part unsuitable for the impoundment of water, limiting the potential for irrigation in many regions. The Senegal River Valley alone accounts for an estimated 240,000 ha of irrigable land, of which about 110,000 is
TABLE 2.1. SENEGAL NATIONAL AND AGRICULTURAL STATISTICS, 2012
National Agricultural
GDP (Current US$ million) 14,050 Total land area (ha) 19.25 millionPopulation (million) 13.73 Total agricultural area (ha) 9.51 millionPer capita GDP (Current US$) 1,023 Arable area (ha) 1.27 millionPer capita GDP (US$ PPP) 1,906 Cereal crop area (ha) 3.85 millionPopulation growth rate (%) 2.9 Permanent cropped area (ha) 58,000GDP growth rate (%) 3.5 Arable land per person (ha) 0.29
Forest area (ha) 8.43 millionContribution to GDP: Avg. cereal yield (kg/ha) 1,310Agriculture 17% Avg. fertilizer use (kg/ha) 7.6Manufacturing 14% Cereal production (MT) 1.66 millionOther industry 10% Cereal demand (MT) 2.48 millionServices 59%Imports (Current US$ million) 5,901Exports (Current US$ million) 3,372 Shoats (head) 10.93 millionRemittances (million) 1,478 (2005) Pigs (head) 375,000Net ODA (Current US$ million) 1,084 Camels (head) 5,000Foreign Direct Investment
(US$ million)338
Infl ation (yr on yr CPI basis) 1.4%Poverty headcount (national
poverty line) 46.7% (2011)
Gini Coeffi cient (income) 40.3
Source: World Bank, FAOSTAT.

7Agricultural Sector Risk Assessment
either currently under irrigation or is in development. Some irrigation has also been developed in Casamance in the south.
Although Senegal has over 19 million ha of land, over half of this is undeveloped bush and arid land used for livestock grazing; the total agricultural area is 9.5 million ha of which 3.9 million hectares is suitable for arable crops. Of this, 40 percent is regularly cultivated (that is, 20 percent of the total agricultural land area is used for seasonal crop production). Though much of the arable area receives rainfall that is suffi cient to produce average yields, roughly
one-tenth of this area receives average annual rainfall val-ues below 500 mm, eff ectively limiting production.
The soils of Senegal are highly diversifi ed. They include fertile valley soils near the Senegal and Saloum rivers, sands suitable for groundnuts, and sandy clays that can support other crops in the western and eastern areas. In the south and center of the country, poor lateritic soils pre-dominate, whereas in the Casamance region, crops can be grown on the more fertile clay soils. In almost all cases, however, the soils are vulnerable to degradation and fertil-ity levels are declining as cultivation pressure increases.
FIGURE 2.1. CLIMATIC ZONES OF SENEGAL
Podor
Saint-LouisLouga
Diourbel
FatickKaolack
Nioro
Ziguinchor
Kolda
Tambacounda
Kédougou
LEGEND
Sahelian zone (250–500 mm)
Sudan-Sahelian (500–900 mm)
Sudan zone (900–1100 mm)
Guinee zone (>1100 mm)
ThièsDakar
Source: ISRA, adapted.
235
273
295 40
8
380
390
452 52
2
485
500 56
9
603 74
1
628 70
7
708
532 60
2
1,16
3
984
853 1,
042
1,26
7
1,19
9
1,20
3
0
200
400
600
800
1,000
1,200
1,400
Pod
or
Sai
nt-L
ouis
Loug
a
Ling
uere
Mat
am
Dak
ar
Thi
es
Mbo
ur
Dio
urbe
l
Bam
bey
Fat
ick
Kao
lack
Nio
ro
Kaf
frin
e
Kou
nghe
ul
Tam
baco
unda
Bak
el
Gou
diry
Kéd
ougo
u
Kol
da
Vel
inga
ra
Sed
hiou
Zig
uinc
hor
Ous
souy
e
Cap
Saint-Louis Louga Mat. Dakar Thies Diourbel Fatick Kaolack Kaffrine Tamba Kéd. Kolda Sed. Ziguinchor
North North Central South Central SE South West
FIGURE 2.2. AVERAGE ANNUAL RAINFALL BY REGION, 1980–2013
Source: ANACIM.

8 Senegal
AGRO-ECOLOGICAL ZONESSenegal has six agro-ecological zones, based on biophysical and socioeconomic criteria: (1) the Niayes; (2) the Senegal River Valley; (3) the Sylvo-pastoral Zone; (4) Groundnut Basin; (5) Eastern Senegal; and (6) Casamance (fi gure 2.3). Each zone is a natural region, with its own potential and vulnerability to ecological and weather-related hazards:
» Niayes is a 5 to 10 km strip covering 2,759 km2. It is the major commercial vegetable-producing area in Senegal. It is a densely populated area and faces chal-lenges of soil and water salinity and coastal erosion.
» The Senegal River Valley covers a surface area of 9,658 km2 in the north of the country border-ing Mauritania. This zone is characterized by allu-vial plains and sandy uplands. Rain-fed farming is almost nonexistent in the delta, and most agricul-tural production is derived from irrigation. Some areas are subject to salinity, but much of the mid-river area has a high level of fertility due to regular fl ooding.
» The Sylvo-pastoral zone covering 55,561 km2 is Senegal’s major cattle-breeding area and is mainly populated by nomadic Fulani ethnic groups.
» The Groundnut Basin of 46,367 km2 is highly populated and subject to ecosystem degradation and depletion of land resources (soil fertility and timber resources). In addition, soil regeneration has slowed as a result of upland soil acidifi cation and lowland salinity.
» The Eastern Senegal zone of 51,958 km2, is subject to rampant rural poverty due to heavy population pressure on natural resources, despite its strong agro-pastoral potential.
» The Casamance can be divided into three zones—the lower, middle, and upper. With a total surface area of 28,324 km2, the region is charac-terized by lowland soil acidifi cation, water erosion, loss of forest diversity, increased salinity, acidity, iron toxicity, and acute mangrove degradation within the Casamance estuary.
CROP PRODUCTION SYSTEMSAlthough Senegal encompasses more than 19 million ha, the area available for agriculture is limited by poor soils and climate to less than 10 million ha (table 2.1). Forty-three percent of the land area remains as undeveloped bush available for grazing, whereas a signifi cant propor-tion of the remainder receives less than 500 mm of rain-fall so that yields are severely constrained and much of the agriculture that is undertaken is inadequate even for sub-sistence. Shifting cultivation is commonly practiced and substantially less than 50 percent of the arable area is cropped at any one time. Crop composition has varied little over the past 30 years (fi gure 2.4). Where there is adequate moisture, the main crops cultivated are ground-nuts and millet, which together account for almost 75 per-cent of the planted area. Maize, rice sorghum, cowpeas,
FIGURE 2.3. AGRO-ECOLOGICAL ZONES IN SENEGAL
Niayes
River valley
Sylvo-pastoral zones
Groundnut basin
Eastern senegal
Casamance
Source: Adapted from Directorate of Water, Forests and Hunting Conservation.

9Agricultural Sector Risk Assessment
and cotton make up about 25 percent and less than 1 percent is sown to other crops, including vegetables.
Senegal experiences a variable climate with low levels of rainfall (< 600 mm per year) over much of the northern part of the country. Its soils are for the most part sandy and acid so that levels of agricultural pro-duction are generally low. The agricultural sector has been traditionally dominated by two cash crops (groundnuts and cotton) produced for the export mar-ket, although many producers also focus on the pro-duction of staple crops for their own subsistence. Nevertheless, food crop production does not meet national demand, and the country is regularly obliged to import substantial volumes of rice (1–1.2 million MT in recent years) and wheat.
Crop production in Senegal essentially comprises three categories of producers, though there is increasing diver-sity across both food and cash cropping systems:
» Subsistence smallholders who produce occasional commercial surpluses for sale, but undertake other income-generating activities to sustain their liveli-hoods.
» Commercial smallholders whose livelihood depends upon the sale of cash crops, but who often produce some crops for their own consumption.
» Pure commercial producers whose livelihood is based upon the sale of cash crops and horticulture.
Table 2.2 shows levels of variation in cropping area, yield, and total output for each of the main food and cash crops during the period 1980–2012. In terms of output, tomato and onion production have grown the most during the review period, followed by cowpeas, maize, and rice. Much of this growth has come from the expansion of cropping area, with the exception of rice production, which has benefi ted from a near quadrupling of yields (359.9 percent) during the 33-year period. Production of
0
200
400
600
800
1000
1200
1980 1982 1984 1986 1988 1990 1992 1994 1996 1998 2000 2002 2004 2006 2008 2010 2012
Millet
Groundnut
MaizeSorghumRice
CowpeaMango
Cassava
FIGURE 2.4. TRENDS IN CROP PRODUCTION AREA HARVESTED
(thousand ha), 1980–2012
Source: FAOSTAT.
TABLE 2.2. TRENDS IN CROP PRODUCTION,
1980–2012*
AreaChange (%)
Production Change (%)
YieldChange (%)
Food CropsMaize 108.9 230.2 54.2Rice 39.6 99.9 359.9Millet 2.6 44.3 42.8Sorghum 65.6 52.4 8.3Cowpeas 227.4 271.1 7.7Cash CropsTomatoes 486.6 647.5 23.9Potatoes –7.5 38.9 43.1Cotton –14.7 7.5 26.3Groundnuts –10.0 23.1 36.2Onions 235.7 438.3 66.2
Source: FAOSTAT. *Five-year average, 1980–84 vs. 2008–12; for onions and tomatoes, 2012 was not available, so 2007–11 averages were used.

10 Senegal
tomatoes and onion, and to a lesser extent, cowpeas and maize, has seen the most marked growth.
FOOD CROPSMillet and SorghumMillet and sorghum are the traditional cereal crops of Senegal. Millet (chiefl y pearl millet) is the most widely cul-tivated of the two and a large number of landraces adapted to diff erent conditions are grown throughout the country. The crop is grown almost exclusively in mono-culture in rotation with groundnuts or cowpeas. Produc-tion covered over 800,000 ha in 2012, or roughly 36.1 percent of total harvested area. The coarse grain is well adapted to moisture stress and is grown on a low input basis that is well suited to meeting smallholders’ subsistence needs, for which the bulk of the crop is pro-duced. Higher yielding varieties have been produced by Institute Sénégalais de Recherches Agricoles (ISRA) and are being increasingly used by farmers, but production is still inadequate to meet demand.
Sorghum is also drought tolerant, and although it yields more heavily than millet (960 kg/ha in 2012), the crop requires higher levels of fertility and deeper soils than mil-let, and it is indicative of the conditions in much of Sen-egal, that the area and production of sorghum at 143,000 ha and 137,000 MT respectively are less than 20 percent of millet. Sorghum tends to be grown in wetter areas of the country to the south where it tends to replace millet in the rotation. Traditional landraces adapted to a range of conditions exist, but improved varieties are available and are used by approximately 45 percent of smallholders. Sorghum is also grown on a low input basis as a subsist-ence crop, most of which will be consumed by the house-holds producing it. Although millet and sorghum are well adapted to the edaphic and climatic conditions of Sene-gal, both are regularly subject to depredation by birds (quelea fi nch) and parasitism by Striga.
CowpeasCowpeas exhibit more drought tolerance than do ground-nuts. The crop also has a particular advantage in Senegal; it can be eaten early as near-mature green pods as well as harvested dry. Cowpeas can thus provide food during the traditional “hungry gap period.” The crop is grown in
monoculture throughout most of the country, with the exception of the Groundnut Basin, where it is often replaced in the rotation by groundnut. Cowpeas require few inputs, and as a legume fi xes nitrogen, enhancing the fertility of the soil for subsequent crops of millet or sor-ghum. The short growing period of most cowpea varieties is a key factor in their capacity to avoid moisture stress, but it also results in lower yield. Senegal contains many local landraces of cowpeas and modern, higher-yielding varieties are also available. Nevertheless, yields in 2012 were only 425 kg/ha and production at 55,000 MT remained substantially below demand.
RiceRice was not traditionally a staple in Senegal. However, inadequate production of millet and sorghum has led to increased consumption of imported rice and a substantial increase in domestic production to meet the growing demand. Rice is produced under both irrigated and rain-fed conditions. Irrigated production, primarily in the northern River Valley, occurs twice a year and accounts for roughly 45 percent of harvested area. Rain-fed rice is produced either in small lowland basins or as upland rice, which constitute 42 percent and 7 percent of area har-vested, respectively (the balance being mangrove produc-tion). The crop is produced mainly in the Senegal River Valley and Casamance regions. Rain-fed rice is produced almost exclusively by smallholders, whereas dry land rice in particular is produced mainly under slash-and-burn conditions with minimal inputs. Lowland rice is produced more intensively. A signifi cant proportion of the irrigated rice is produced under commercial conditions. A number of improved varieties are available for irrigated, basin, and upland cultivation and have contributed to the 360 per-cent increase in yield observed over the past few decades.
CASH CROPSMaizeLike rice, maize is not a traditional Senegalese staple. Today, it is produced as much as a cash crop as it is for household consumption. Production occurs in most agro-ecological zones, with the exception of the Silvipastoral zone. It is especially grown in the Groundnut Basin (where it is rotated with groundnuts), Casamance, and increasingly in Eastern Senegal. Both smallholders (1 to 2 ha, 90 percent) and larger

11Agricultural Sector Risk Assessment
commercial growers (20 to 50 ha, 10 percent) cultivate maize. The crop is entirely rain fed. As much as 97 percent of production involves improved varieties (ASTI 2009) and most are short-season varieties (90 days to maturity).
Although the area planted has varied moderately between 100,000 ha and 200,000 ha over the past 10 years, yields have fl uctuated considerably and total production has thus varied between 400,000 MT in 2005 and 110,000 MT in 2011 (see fi gure D.3 in appendix D). There is a growing demand for maize for both livestock feed (65 per-cent of production) and as maize fl our (approximately 100,000 MT). The shortfall is currently met by imports that have averaged 100,000 MT in recent years. To reduce reliance on imports, the government has subsi-dized the costs of maize crop inputs and promoted the provision of fi nance for their purchase. Average maize yields in 2010–12 are somewhat lower than those in 2003–05, suggesting that although producers have increased the area planted to maize, they have not increased the intensity of production.
GroundnutsGroundnuts are grown throughout Senegal, except in the Silvipastoral zone, and especially in the Groundnut Basin. They are grown both as a staple for household consump-tion and, more important, as a cash crop that can be sold on the domestic market, mostly for processing into oil for export. The crop is grown almost exclusively by small-holders. The high cost of seed is off set by a government subsidy and by input credit available through local coop-eratives. However, the availability of good-quality seed is still inadequate. Yield are variable and range from 550 to 1,200 kg/ha. Production reached a peak in 2010 of over 1.2 million MT, but has declined by about 40 percent since that time. The processed groundnut oil is Senegal’s main agricultural export. Groundnuts are potentially sus-ceptible to afl atoxin contamination, but the frequency of this in Senegal is low. The production of groundnuts is considered politically sensitive and the crop is well sup-ported by ISRA plant breeding programs and public extension. Nevertheless, groundnut production remains particularly susceptible to erratic rainfall.
CottonCotton is produced mainly in Eastern Senegal. The crop has been in decline since the collapse of the country’s
textile production subsector at the end of the last century. Nevertheless, production expanded in 2012 as a result of a substantial increase in the price of cotton lint on the world market in 2011, although prices have since reverted to normal levels. The crop requires little fertil-izer, but is nevertheless expensive to grow, because as many as fi ve applications of insecticide may be required. Although cotton is less sensitive to moisture stress than many crops, yields have trended downward over the past 10 years.
OnionsOnions are produced as a cash crop mainly by smallhold-ers in the Niayes agro-ecological zone. The crop is grown with supplementary irrigation and average yields are among the highest in the region. The crop requires fertil-izer but few chemical inputs, and given adequate irriga-tion, is subject to little production risk. The crop is produced between March and July, with the majority of the crop being harvested in May and June. Because of a lack of drying and storage capacity, the market is typically saturated with onions during these months.
TomatoesThe country has a good climate for horticultural produc-tion throughout the year. About 70 percent of Senegal’s exports to the EU are green beans, cherry tomatoes, man-goes, and melons. The labor-intensive vegetable and fruit industry employs more than 17,000 families in rural Sen-egal. Mangoes, green beans, and industrial tomatoes are among Senegal’s major horticultural crops. Tomatoes are produced under irrigation in peri-urban areas within the Niayes zone. The crop is predominantly cherry tomatoes, grown in greenhouses or under shade netting for the Euro-pean market, a requirement that places it beyond the capacity of most smallholders. Production primarily takes place during the months March–May. The crop is highly perishable and the domestic market can be saturated with second grade produce during these months. Average yields fl uctuate considerably from one year to the next, ranging from 52 MT/ha in 2003 to 18 MT/ha the following year, largely the result of insect pests and market demand.
PotatoesPotatoes are also predominantly grown in the Niayes zone by smallholders. The crop is grown between March and

12 Senegal
July and may be provided with supplementary irrigation when necessary. Yields generally vary about 15–25 MT/ha, depending mainly upon the incidence of disease (blight and virus) and, to a lesser extent insect pests. Production is grossly insuffi cient to meet demand and prices are consis-tently close to import parity.
MangoesSenegal produces 0.4 percent of global mango exports, which are destined almost exclusively for European supermarkets. Production is mainly from the Niayes region, although some portion is now being exported from Casamance. Almost all production is rain fed and organic. Fruit is produced by smallholders from indi-vidual trees and small orchards and marketed either through associations or directly to end buyers who export by air to Europe. Although Senegal has always produced mangoes for the local market, the export seg-ment has rapidly increased (by 15-fold in fi ve years). In 2005, Senegal experienced a glut of mangoes and prices fell considerably. Improved and expanded mar-keting arrangements have now reduced the probability of this recurring.
Green BeansGreen beans (also called bobby beans) are primarily grown in Senegal by smallholders and medium-size farm-ers on contract to wholesale companies who airfreight the produce to Europe. Ninety percent of Senegal’s green bean exports are produced in the Niayes region through vertically integrated supply chains. The Senegalese indus-try is able to fi ll the out-of-season niche that exists from December through to March before European producers begin production.
LIVESTOCK PRODUCTION SYSTEMSMuch of Senegal’s livestock sector, especially ruminants, remains under a traditional extensive or mixed farming system. Pastoralists produce animal products that are sup-plemented, in the case of agro-pastoralists, by crops. The annual production is primarily self-consumed but some portion is marketed. Although Senegal’s livestock sector is substantial, the country is dependent upon imports to meet its growing demand for meat.
According to FAO data, the main species are cattle, sheep, goats, pigs, poultry, equines, and camels. Livestock are kept largely for meat, and to a lesser extent, for dairy and other products. They are also important for draft power. Small ruminants dominate the livestock sector, as shown in fi gure 2.5. Sheep are particularly important during the annual reli-gious feasts of Tabaski and at baptisms of newborns. Pigs are of limited signifi cance, being consumed only by the small non-Muslim population. According to FAOSTAT, pork meat represents roughly 6 percent of the total meat consumed [data taken from FAO’s online database at faostat.org].
The poultry population in 2012 was 44 million birds. Modern or intensive systems are usually practiced in urban and suburban areas and associated enterprises vary in terms of levels of technical sophistication. These range from highly developed and bio-secure enterprises to backyard, village production. Today, poultry production is split roughly equally between intensive commercial farms and backyard or village production, with growth in the former segment eclipsing noncommercial production (FAO 2014). The intensive sector is dependent upon six
0%
25%
50%
75%
100%
1961 1971 1981 1991 2010 2011 2012
Cattle Goats Sheep Asses Horses
FIGURE 2.5. SHARE OF LIVESTOCK UNITS IN SENEGAL, 1961–2012
Source: FAOSTAT.
13Agricultural Sector Risk Assessment
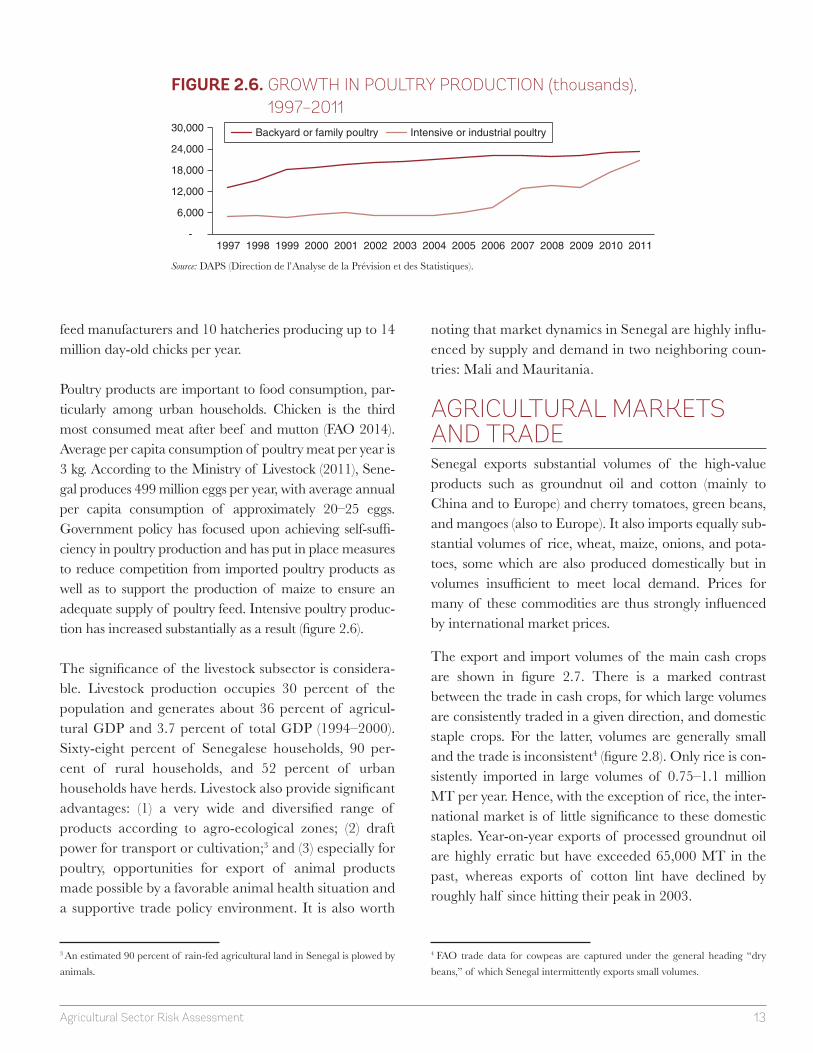
feed manufacturers and 10 hatcheries producing up to 14 million day-old chicks per year.
Poultry products are important to food consumption, par-ticularly among urban households. Chicken is the third most consumed meat after beef and mutton (FAO 2014). Average per capita consumption of poultry meat per year is 3 kg. According to the Ministry of Livestock (2011), Sene-gal produces 499 million eggs per year, with average annual per capita consumption of approximately 20–25 eggs. Government policy has focused upon achieving self-suffi -ciency in poultry production and has put in place measures to reduce competition from imported poultry products as well as to support the production of maize to ensure an adequate supply of poultry feed. Intensive poultry produc-tion has increased substantially as a result (fi gure 2.6).
The signifi cance of the livestock subsector is considera-ble. Livestock production occupies 30 percent of the population and generates about 36 percent of agricul-tural GDP and 3.7 percent of total GDP (1994–2000). Sixty-eight percent of Senegalese households, 90 per-cent of rural households, and 52 percent of urban households have herds. Livestock also provide signifi cant advantages: (1) a very wide and diversifi ed range of products according to agro-ecological zones; (2) draft power for transport or cultivation;3 and (3) especially for poultry, opportunities for export of animal products made possible by a favorable animal health situation and a supportive trade policy environment. It is also worth
3 An estimated 90 percent of rain-fed agricultural land in Senegal is plowed by animals.
noting that market dynamics in Senegal are highly infl u-enced by supply and demand in two neighboring coun-tries: Mali and Mauritania.
AGRICULTURAL MARKETS AND TRADESenegal exports substantial volumes of the high-value products such as groundnut oil and cotton (mainly to China and to Europe) and cherry tomatoes, green beans, and mangoes (also to Europe). It also imports equally sub-stantial volumes of rice, wheat, maize, onions, and pota-toes, some which are also produced domestically but in volumes insuffi cient to meet local demand. Prices for many of these commodities are thus strongly infl uenced by international market prices.
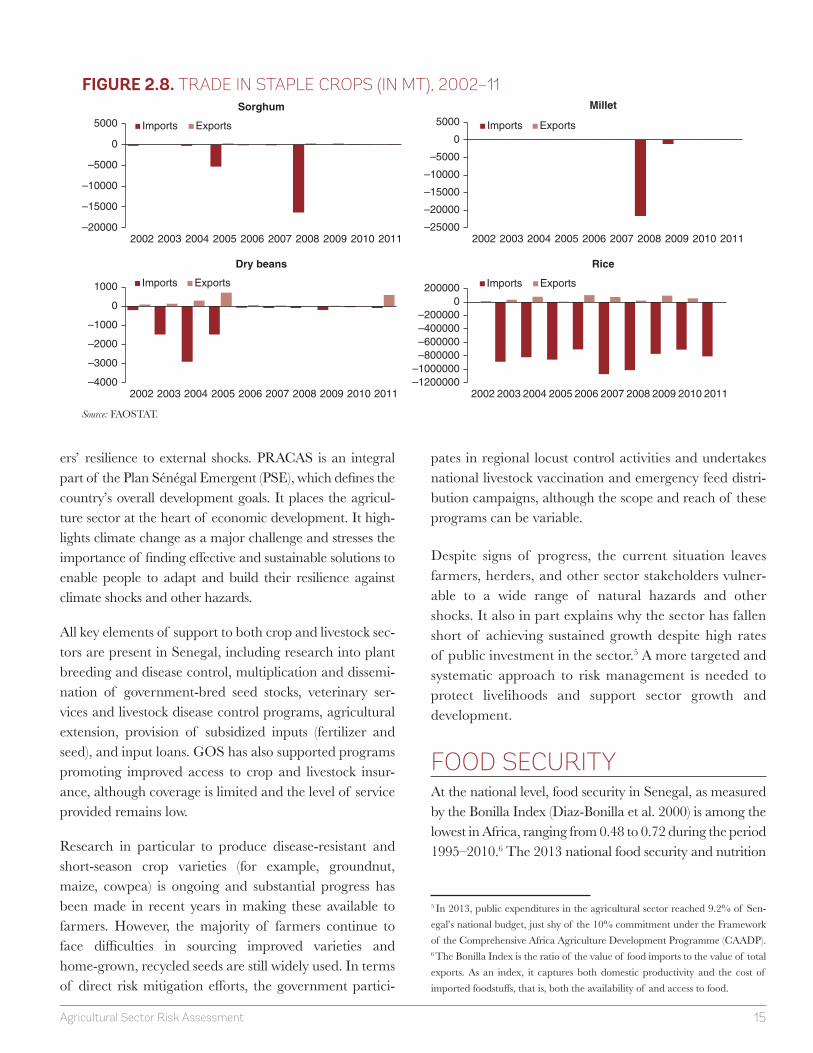
The export and import volumes of the main cash crops are shown in fi gure 2.7. There is a marked contrast between the trade in cash crops, for which large volumes are consistently traded in a given direction, and domestic staple crops. For the latter, volumes are generally small and the trade is inconsistent4 (fi gure 2.8). Only rice is con-sistently imported in large volumes of 0.75–1.1 million MT per year. Hence, with the exception of rice, the inter-national market is of little signifi cance to these domestic staples. Year-on-year exports of processed groundnut oil are highly erratic but have exceeded 65,000 MT in the past, whereas exports of cotton lint have declined by roughly half since hitting their peak in 2003.
4 FAO trade data for cowpeas are captured under the general heading “dry beans,” of which Senegal intermittently exports small volumes.
-
6,000
12,000
18,000
24,000
30,000
1997 1998 1999 2000 2001 2002 2003 2004 2005 2006 2007 2008 2009 2010 2011
Backyard or family poultry Intensive or industrial poultry
FIGURE 2.6. GROWTH IN POULTRY PRODUCTION (thousands),
1997–2011
Source: DAPS (Direction de l’Analyse de la Prévision et des Statistiques).

14 Senegal
NATIONAL AGRICULTURAL POLICY Successive programs have all stressed the importance of stimulating productivity, achieving food self-suffi ciency, and attracting new investments into the sector. Institutional reforms implemented since 1980 have generally facilitated the withdrawal of the state from agricultural production and marketing, the restructuring and reorientation of public enterprises, and support favoring increased private and cooperative sector participation. Adopted in 2004, the Loi d’Orientation agro-sylvo-pastorale (LOASP) provides the overall, long-term policy framework for public sector
administration and investments in the agriculture, forestry, and pastoral sectors. However, implementation of the law since adoption has generally been slow.
Building on Senegal’s Poverty Reduction Strategy Papers I (2003–05) and II (2006–10), the current Stratégie de Crois-sance Accélérée (SCA) adopted in January 2008 targets an economic growth rate of 7 to 8 percent via the expansion of fi ve key sectors including agriculture and agro-industries. The Programme d’Accélération de la Cadence de l’Agriculture au Sénégal (PRACAs) provides the organiza-tional and operational framework for GOS interventions in promoting sustainable agriculture, productivity, and farm-
Maize Groundnut Oil
Cotton Lint Onions
Tomatoes Potatoes
Mangoes Green Beans
–100000
–75000
–50000
–25000
0
25000
2002 2003 2004 2005 2006 2007 2008 2009 2010 2011
Imports Exports
–120000
–100000
–80000
–60000
–40000
–20000
0
20000
2002 2003 2004 2005 2006 2007 2008 2009 2010 2011
Imports Exports
–5000
0
5000
10000
15000
20000
25000
30000
2002 2003 2004 2005 2006 2007 2008 2009 2010 2011
Imports Exports
–10000
0
10000
20000
30000
40000
50000
60000
70000
2002 2003 2004 2005 2006 2007 2008 2009 2010 2011
Imports Exports
–20000
2000400060008000
1000012000
2002 2003 2004 2005 2006 2007 2008 2009 2010 2011
Imports Exports
–140000–120000–100000
–80000–60000–40000–20000
020000
2002 2003 2004 2005 2006 2007 2008 2009 2010 2011
Imports Exports
–2000
0
2000
4000
6000
8000
10000
2002 2003 2004 2005 2006 2007 2008 2009 2010 2011
Imports Exports
–2000
0
2000
4000
6000
8000
10000
2002 2003 2004 2005 2006 2007 2008 2009 2010 2011
Imports Exports
FIGURE 2.7. TRADE IN CASH CROPS (IN MT), 2002–11
Source: FAOSTAT.
15Agricultural Sector Risk Assessment
ers’ resilience to external shocks. PRACAS is an integral part of the Plan Sénégal Emergent (PSE), which defi nes the country’s overall development goals. It places the agricul-ture sector at the heart of economic development. It high-lights climate change as a major challenge and stresses the importance of fi nding eff ective and sustainable solutions to enable people to adapt and build their resilience against climate shocks and other hazards.
All key elements of support to both crop and livestock sec-tors are present in Senegal, including research into plant breeding and disease control, multiplication and dissemi-nation of government-bred seed stocks, veterinary ser-vices and livestock disease control programs, agricultural extension, provision of subsidized inputs (fertilizer and seed), and input loans. GOS has also supported programs promoting improved access to crop and livestock insur-ance, although coverage is limited and the level of service provided remains low.
Research in particular to produce disease-resistant and short-season crop varieties (for example, groundnut, maize, cowpea) is ongoing and substantial progress has been made in recent years in making these available to farmers. However, the majority of farmers continue to face diffi culties in sourcing improved varieties and home-grown, recycled seeds are still widely used. In terms of direct risk mitigation eff orts, the government partici-
pates in regional locust control activities and undertakes national livestock vaccination and emergency feed distri-bution campaigns, although the scope and reach of these programs can be variable.
Despite signs of progress, the current situation leaves farmers, herders, and other sector stakeholders vulner-able to a wide range of natural hazards and other shocks. It also in part explains why the sector has fallen short of achieving sustained growth despite high rates of public investment in the sector.5 A more targeted and systematic approach to risk management is needed to protect livelihoods and support sector growth and development.
FOOD SECURITY At the national level, food security in Senegal, as measured by the Bonilla Index (Diaz-Bonilla et al. 2000) is among the lowest in Africa, ranging from 0.48 to 0.72 during the period 1995–2010.6 The 2013 national food security and nutrition
5 In 2013, public expenditures in the agricultural sector reached 9.2% of Sen-egal’s national budget, just shy of the 10% commitment under the Framework of the Comprehensive Africa Agriculture Development Programme (CAADP).6 The Bonilla Index is the ratio of the value of food imports to the value of total exports. As an index, it captures both domestic productivity and the cost of imported foodstuff s, that is, both the availability of and access to food.
FIGURE 2.8. TRADE IN STAPLE CROPS (IN MT), 2002–11Sorghum Millet
Dry beans Rice
–20000
–15000
–10000
–5000
0
5000
2002 2003 2004 2005 2006 2007 2008 2009 2010 2011
Imports Exports
–25000
–20000
–15000
–10000
–5000
0
5000
2002 2003 2004 2005 2006 2007 2008 2009 2010 2011
Imports Exports
–4000
–3000
–2000
–1000
0
1000
2002 2003 2004 2005 2006 2007 2008 2009 2010 2011
Imports Exports
–1200000–1000000–800000–600000–400000–200000
0200000
2002 2003 2004 2005 2006 2007 2008 2009 2010 2011
Imports Exports
Source: FAOSTAT.

16 Senegal
survey found that 18.8 percent of households, correspond-ing to some 245,000 households or 2.2 million people, are food insecure. The situation is especially accentuated in rural areas, where 25.1 percent of households are food inse-cure versus 15.1 percent reported in 2010. In recent years, food insecurity has dramatically worsened in the confl ict-aff ected Casamance (Kolda, Sedhiou, and Ziguinchor regions), as well as in the Kedougou and Matam regions (WFP 2013) (see Senegal Comprehensive Food Security and Vulnerability Assessment 2013, SE/CNSA, SAP, WFP). National levels of stunting at age 5 are 26.5 percent (this statistic comes from the UNICEF database at http://www.unicef.org/infobycountry/senegal_statistics.html).
Although demand exceeds local supply, imported food-stuff s are available in markets throughout the country and it is only in the most isolated areas that food insecurity could be described as an issue of food availability. House-hold economic analysis has shown that the majority of the rural poor are dependent upon markets to meet their food needs. Markets for staple crops are not strongly devel-oped, though they are both extensive and reasonably well integrated. Nevertheless, there is a high degree of uncer-tainty in terms of domestic cereal prices which can fl uctu-ate substantially both within and between seasons.
Figure 2.9 highlights the high degree of uncertainty that many households face as domestic cereal prices fl uctuate substantially both within and between seasons. It is this fl uctuation in domestic market prices (together with global price variations) that is the fundamental cause of food
insecurity in Senegal. Local production levels are always inadequate to meet demand. Thus, it is the price of food and a household’s capacity to pay that price that largely determines food security in Senegal.
KEY GROWTH CONSTRAINTS AND TRENDSIn Senegal, low levels of soil fertility and limited farmer use of improved seeds, fertilizers, and agro-chemicals (for exam-ple, insecticides) limit productivity. In the absence of mecha-nized equipment and services, there is a high reliance on family labor. Poor access to inputs and fi nancial services fur-ther contributes to low adoption of productivity- enhancing technologies. Inadequate storage, roads, and other market-ing infrastructure discourage farmers from investing in upgrades. For the livestock subsector, low-performing breeds, poor husbandry management, insuffi cient feed/fod-der supply, high cost of poultry feed, and strong competition from imports are among key growth constraints. These con-straints hinder sector growth by limiting many producers’ ability to raise productivity and move beyond subsistence. These same constraints can also amplify the impacts of adverse shocks by increasing the scope of losses and weak-ening the coping capacity of agricultural stakeholders.
In addition to constraints, trends such as climate change, soil erosion, and decreasing groundwater availability as a result of salinization and declining water tables are increasing the vulnerability of producers to climate risks and other threats.
80
160
240
320
400
2001 2002 2003 2004 2005 2006 2007 2008 2009 2010 2011 2012 2013
Millet Sorghum Maize Rice
FIGURE 2.9. RETAIL PRICES FOR KEY STAPLE CROPS
(CFA/KG), 2001–13
Source: DAPS.

17Agricultural Sector Risk Assessment
The main sources of risk in Senegal’s agricultural sector are reviewed in this chapter. These include production risks, market risks, and a general set of risks associated with the enabling environment for agriculture. The incidence and implications of multiple or successive shocks are also considered.
PRODUCTION RISKS In terms of production, the most important factor contributing to agricultural risk is weather. Other factors include crop pests and diseases (both before and after harvest), windstorms, bush fi res, and livestock diseases having weak response mechanisms. Each of these factors is considered in more detail below.
WEATHER RISKSWeather-related risks manifest mainly through extremes of temperature and precipita-tion. In the former case, the actual impact of extreme temperatures upon crop yields in Senegal is uncertain. Over the past 40 years, mean annual temperatures across Senegal have increased rapidly (averaging 0.19°C per decade), but prior to that period, mean annual temperatures had decreased substantially, so that current mean annual temperatures have only recently regained the levels experienced at the beginning of the last century (fi gure 3.1).
Extreme Temperatures Although it is evident that high temperatures that inhibit plant production (generally in excess of 35°C) will occasionally occur during the growing season, their impact is not easily determined, because it will often have been confounded by moisture stress. Similarly, the impact of extreme cold is not easily measured because it occurs so rarely in Senegal (although an important exception is the impact of cold rain upon weakened livestock, as happened in 2002). Extreme temperatures may well constrain production, but although changes in the frequency and impact of extreme temperature anomalies can be modeled (see appendix A), they are not empirically evident. Temperature per se is rarely considered by stakeholders as a contributory factor to crop production risk, and does not feature as an observed cause of ex post impacts.
CHAPTER THREE
AGRICULTURE SECTOR RISKS

18 Senegal
Erratic RainfallThe single most important factor aff ecting crop produc-tion is the availability of moisture. Moisture stress can manifest itself through the delayed onset of rains, through erratic rain, through the early cessation of rain, or through extended drought, all of which can result in reduced yield. Nevertheless, even in the absence of these specifi c condi-tions it has been shown that more than 40 percent of the
–2
19001955
2009
–1Rainfall-southcentral
Rainfall-northcentral
Temperature-southcentral
Temperature-northcentral
+0.9 degreescelsius
–14 percentrainfall
0
Sta
ndar
d de
viat
ions
1
2
FIGURE 3.1. VARIATIONS IN TEMPERATURE AND RAINFALL,
1900–2009
Source: Funk et al. 2012.
FIGURE 3.2. PRECIPITATION PATTERNS OF MAJOR REGIONS, 1978/79–2008/09
0
400
800
1200
1600
1978/79 1980/81 1982/83 1984/85 1986/87 1988/89 1990/91 1992/93 1994/95 1996/97 1998/99 2000/01 2002/03 2004/05 2006/07 2008/09
Ave
rage
ann
ual r
ainf
all (
mm
)
Casamance Sénégal Oriental Sine Saloum Diourbel-Dakar Louga-Saint-Louis
Source: ANACIM.
TABLE 3.1. VARIABILITY OF RAINFALL BY REGION
CasamanceSénégal Oriental
Sine Saloum
Diourbel-Dakar
Louga-Saint-Louis
Mean 1125 735 611 437 308Standard deviation 189 149 149 123 80
Coeffi cient of variation 17% 20% 24% 28% 26%
Source: ANACIM.
variation in national crop yields can be ascribed simply to the variation in annual rainfall amounts. (Kandji, Ver-chot, and Mackensen 2005). Annual rainfall tends to decrease with latitude, being highest in the south of the country and decreasing to the north (fi gure 3.2).
In general, the variability of rainfall tends to increase as the absolute amount decreases (table 3.1), although the
19Agricultural Sector Risk Assessment
high variability of rainfall in Louga-Saint-Louis appears to be an exception to this pattern. More detailed rainfall analysis supports the general thesis that not only do yields decrease moving from south to north, but the probability of an abnormally low yield due simply to reduced rainfall is also increased.
The various detrimental aspects of rainfall tend to act in specifi c ways. The impact of erratic rainfall is modifi ed to a considerable extent by the growth stage of the crop under consideration. Thus, maize may experience erratic rainfall during early growth yet still yield well, whereas the impact of the same rainfall regime during tasseling and silting, when evapotranspiration demand is much higher, can result in substantial loss of yield. Similarly, sorghum and millet are prone to notable yield reduction if rainfall amounts are reduced during infl orescence. By contrast, cotton has an indeterminate growth form that allows it to recover from a period of moisture defi cit, although germi-nation and early seedling growth can be much reduced by moisture stress (FAO 1971). Cowpeas and groundnuts are particularly aff ected by dry conditions during pod development.
DroughtThe early cessation of rain can cause loss of yield through reduced grain fi lling, especially in groundnuts and, to a lesser extent, maize and cowpeas. Its impact is less pro-nounced for sorghum or millet, or an indeterminate crop such as cotton but can have a major eff ect on horticultural crops such as potatoes or tomatoes. Detrimental impacts can be reduced through the planting of short-season vari-eties, although these may be lower yielding than their longer-season counterparts.
The risks to production posed by erratic rainfall or drought are particularly signifi cant because they occur once the farmer has invested the bulk of the required resources into the crop and there is eff ectively “no going back.” By contrast, the risk of the delayed onset of rains, which can result in poor germination and death of young seedlings, can be avoided by late planting. If planting is delayed beyond a certain extent, then yields will invariably suff er. However, it may be possible to delay planting and benefi t from abnormally late rains to achieve normal yield levels. This response to the possibility of delayed onset of rains is widespread across Senegal.
Today, the majority of growers do not plant at the statisti-cally optimal period, but wait until they are convinced that the rains have set in properly. This has the result of limiting potential production, because limited mechaniza-tion capacity causes the period of soil preparation and sowing to be extended well past the optimal sowing date. Indeed, in the case of millet, research showed that there was little to no impact of delayed rains upon yield. This occurred because growers generally waited for a tradi-tional date before sowing, a date at which the rains would have almost certainly set in. This date may not have been optimal for production, but had become accepted as part of an eff ective risk mitigation strategy.
When the probabilities of late onset and early cessation of rains are mapped, it is evident that the highest proba-bility of both occurs in the middle latitudes of Senegal (fi gure 3.3). This area is very similar to that where the probability of erratic rainfall is also highest. Conse-quently, even though the area may not experience the lowest levels of rainfall, it is the area in which the contri-bution of uncertain precipitation to risk is the highest. It is notable that this area includes the Groundnut Basin as well as part of the maize and cotton production areas. The production of these crops is thus particularly exposed to risk due to uncertain rainfall.
An analysis of standardized cumulative rainfall data col-lected from 25 weather stations over the period 1980–2013 is summarized in table 3.2. The analysis provides insights into the frequency and severity of rainfall events during the 34-year period. For the purpose of this analy-sis, drought is defi ned as rainfall less than one standard deviation (>–1) from the mean and extreme drought as rainfall less than two standard deviations (>–2) from the mean, whereas excess rainfall and severe fl ooding are defi ned as rainfall more than one (>1) and more than two (>2) standard deviations from the mean, respectively.
During the review period, the country experienced 10 years of drought, three of which were categorized as severe drought (1980, 1983, 2002). This equates to a fre-quency of drought of roughly one out of every three to four years, on average. A subsequent analysis of crop yield losses showed that these severe drought years coin-cided with the largest losses in terms of annual crop pro-duction value. The probability of drought was highest in

20 Senegal
Tambacounda and Kolda. Regional droughts affected production in on or more province during other years (for example, 1986, 2003), but these events were not classified as drought due to their localized nature. It is worth noting that the analysis of cumulative rainfall fails to capture the poor rainfall events in 2007 and 2011 that severely affected crop and livestock production during those years. A more detailed table summarizing the analysis can be found in appendix G.
floodsThe rainfall analysis also highlights an observed wetting trend, with a higher frequency of excess rainfall years in the most recent decade. It is worth noting that since the droughts of 1996–97, there has been only one episode of drought (2002), an extreme event that affected half of Senegal’s 14 provinces. According to the analysis, Senegal has experi-enced nine excess rainfall years since 1980; all but one (1989) of these events occurred during the past 15 years. During the most recent decade, Senegal experienced excess rainfall more than half the time, or six out of 10 years (see
appendix G, table G.2). In 2010, abnormally high rainfall was recorded in as many as 13 of Senegal’s 14 provinces, when floods devastated many parts of the country.
It is worth noting that despite the observed increasing fre-quency of flood events in Senegal, the analysis suggests that associated impacts relative to losses to crops and rural livelihoods are limited. Although individual farms may be prone to flooding (especially some of the lowland rice areas), the majority of agricultural production is not at risk from flooding and few respondents reported this as a risk to crops. Notwithstanding, impacts to urban house-holds and infrastructure can be substantial. To illustrate, flooding in 2009 in Dakar cost over US$100 million and affected over 400,000 people (GFDRR 2012). Although direct losses to crops and livestock from flooding may be limited at the aggregate level, extreme rainfall events do contribute to leaching and soil erosion, when organic mat-ter and other soluble plant nutrients in the topsoil are car-ried away. This impedes the future capacity of soils to retain nutrients and moisture. Researchers have identified
FIGURE 3.3. CLIMATE VARIABILITY MAP fOR SENEGAL
Source: ANACIM, WFP, IRI 2013.

21Agricultural Sector Risk Assessment
TABLE 3.2. FREQUENCY AND IMPACT OF RAINFALL EVENTS BY REGION, 1980–2013
Year Event Provinces Aff ected
Inidicative Loss Value
In US$
% of Agr Production
Value*1980 xx Matam, Diourbel, Fatick, Kaolack, Tambacounda,
Kolda, Sedhiou, Ziguinchor –128.2 –19
1983 xx 12 of 14 provinces (exluding St. Louis and Matam) –128.5 –9.31984 x Saint-Louis, Matam, Dakar, Tambacounda –91.7 –13.81989 + Louga, Dakar, Thies, Diourbel, Zuiquinchor – –1990 x Saint-Louis, Fatick, Kaolack, Kaff rine, Kedougu,
Kolda– –
1991 x Matam, Kaolack, Kaff rine, Tambacounda, Kolda, Sedhiou
–9.6 –1.4
1992 x Saint-Louis, Louga, Matam, Dakar, Kedougou, Ziguinchor
–69.8 –10.5
1996 x Saint-Louis, Diourbel, Kaolack, Kolda –50.3 –7.51997 x Louga, Matam, Fatick, Kaff rine –68.0 –0.21999 ++ Matam, Kaolack, Kaff rine, Tambacounda,
Koudougou, Kolda, Ziguinchor –33.5 –5.0
2000 + Matam, Thies, Fatick, Kaolack, Kedougou –28.1 –4.22002 x Saint-Louis, Louga, Thies, Tambacounda, Kolda,
Sedhiou, Ziguinchor –217.3 –32.6
2003 + Saint-Louis, Matam, Tambacounda, Kedougou, Kolda, Sedhiou
–15.3 –2.3
2005 + Dakar Diourbel, Kaff rine, Kolda – –2008 + Thies, Diourbel, Fatick, Tambacounda, Ziguinchor –9.5 –1.42009 ++ Saint-Louis, Louga, Dakar, Diourbel, Fatick, Thies,
Tambacounda –10.7 –1.6
2010 ++ 13 of 14 provinces (except Diourbel) –19.1 –2.92012 ++ 11 of 14 provinces (except Louga, Kedougou, Kolda) — —
Key: x Drought xx Severe drought + Excess rainfall ++ Severe fl ooding
Source: ANACIM 2014; FAOSTAT; Authors’ calculations and notes.*Average 2005–07
resulting low rates of fertilizer-use effi ciency as a key rea-son why more farmers choose not to invest in fertilizer.
Hail and Windstorms Other weather-related risks to agriculture in Senegal include hail and windstorms. Hail is a common compo-nent of Intertropical Convergence Zone (ITCZ) precipi-tation and there is a high probability that in a given year some crops will be damaged by hail. Nevertheless, although the impact of a hailstorm can be devastating at an individual smallholder level (resulting in 100 percent loss of crop under the worst circumstances), the geographic
extent of such impact is so limited that hail has no dis-cernible impact on yield from a national perspective.
The impact of windstorms appears to be similar to that of hail, albeit to a lesser extent, perhaps with once critical dis-tinction. Sustained windstorms contribute to soil erosion, particularly in fl at areas with dry, sandy, and/or fi nely gran-ulated soils, which can be found in key production zones across Senegal. Resulting wind erosion damages land and natural vegetation by removing soil from one place and depositing it in another. It contributes to the deterioration of soil structure and causes nutrient and productivity losses.

22 Senegal
BUSHFIRESThe risk to production posed by bushfi res can be signifi -cant at an individual smallholder level toward the end of crop production when crops are mature and combustible, but at the aggregate level the impact of bushfi res on national crop production is negligible. By contrast, bush-fi res can have a signifi cant impact on livestock production, both positive and negative. Early burning can result in regrowth from soil moisture reserves, which can help to extend the grazing season. Late burning tends to result in fi ercer fi res that damage the bush upon which cattle and goats graze in the dry season. Estimates suggest that as much as 6 percent of the potential dry season grazing area suff ers from bushfi re each year (Oceanium 2014). Data shared by the Centre de Suivi Ecologique (CSE) suggest that on average 3.8 million MT of biomass are lost annu-ally through bushfi res. This is equivalent to 100,000 MT of meat and can have a major impact upon production levels in those areas in which such burning has occurred. According to CSE, 762,921 hectares of land were ravaged by bushfi res during the period October 2012 through May 2013, representing roughly 3.9 percent of national territory (CSE 2013). The vast majority of this occurred in the southern half of the country. The region of Tamba-counda was the most aff ected, accounting for a third of the national total. Large swaths of pastureland in Sédhiou and Kédougou were also damaged by bushfi res, accounting for 11 percent and 10.16 percent, respectively, of total land.
CLIMATE CHANGEThe impact of historical and future climate change on rainfall amounts and intensities in Senegal is uncertain. Historically, national rainfall data suggest that cumulative rainfall amounts were decreasing until 1990, but since then annual levels show an increasing trend. It is possible that this is due more to decadal and/or multidecadal cli-matic cycles than to a longer-term trend (Kandji, Verchot, and Mackensen 2005). It is worth noting that anecdotal evidence collected for this study has indicated that the fre-quency and intensity of dry spells has increased over the past 10–15 years. However, these results are based upon personal recollection, which has been shown to be biased toward a more favorable past (de Nicola and Gine 2011) and should consequently be treated with caution.
Overall, although aspects of climate contribute substan-tially to the risk faced by producers, the anticipated impact
of climate change upon that risk appears to be uncertain, the most consistently predicted trend being an increase in the variability of rainfall amounts (see appendix B). This may be expected to increase the level of risk faced by farm-ers, but parallel trends in farmers’ perception of that ele-ment of risk, or in the frequency of weather-related risk events that have aff ected yield, have not yet been recorded.
CROP PESTS AND DISEASESCrops in Senegal are subject to depredation by a range of pests. By far the most signifi cant are the Senegalese grass-hopper, or “sauteuriaux” (Oedaleus senegalensis), locusts (Locusta migratoria), and birds. The fi rst two are non–crop specifi c whereas the third is confi ned mainly to sorghum and millet (although maize can also be aff ected).
Most farmers do not have the knowledge and much less the fi nancial means to adequately tackle crop pests; how-ever, all of the stakeholders confi rmed that pests and dis-eases are one of the main risks to agricultural production. There are diff erent ways of dealing with pests and dis-eases in cash and food crops; although in cash crops inputs are mostly distributed on a credit basis, for food crops fer-tilizers and pesticides are procured on a cash-and-carry basis or diverted from cash to food crops. There is vast number of pests that damage food crops in Senegal. A more detailed listing of pre- and postharvest pests that damage crops can be found in appendix F.
Since 1980, there have been six major locust invasions in Senegal, with signifi cant impacts on both cash and food crops and livestock. For the period of analysis, the two worst infestations occurred in 1987–88 and 2004–05. Locusts eat crops and other vegetation that is in their area of infestation, often leading to total crop losses. They can also adversely aff ect livestock production through loss of grazing. Damage is highly localized, but big swarms can cumulatively aff ect vast tracts of land. During the 1997–98 outbreak, GOS estimates at the time reported that locusts had infested almost 5 million acres of land and destroyed 10 percent of the year’s harvest.7 More than 2 million acres were treated with pesticides to combat the invasion. Control of the locusts and grasshoppers is
7 See “Senegal Fights Worst Locust Infestation in 30 Years” by Susan Katz Miller, 25 November 1988.
23Agricultural Sector Risk Assessment
usually through chemical pesticides, which can harm a wide range of organisms. Since 2000, a more ecological solution has been available with the entomopathogenic fungus Metarhizium anisopliae var. acridum, registered as Green Muscle.
In addition to crop and livestock losses, response measures can also be costly. To control 2004’s invasion, GOS had initially budgeted for 1.8 billion CFA francs. The state fi nally had to approve 4 billion CFA francs to bring the menace under control. This does not include outlays in cash and in kind by private citizens, nor bilateral and multilateral inputs. Damages due to locusts for the same outbreak were estimated at 2 million tons of crops, equivalent to 20 percent of the population’s food needs in the Sahel region.
Granivorous birds, mainly the red-billed quelea, have sub-sisted on cereal crops in Africa for centuries and regularly cause substantial damage to crops. A study in Senegal’s River Valley estimated that annual bird damage averaged approximately 13.2 percent of the potential rice produc-tion during the wet seasons of 2003–07. This translates into an average annual economic loss of 4.7 billion CFA francs (US$9.7 million). These results were consistent with farmers’ perceived bird-infl icted crop losses, averag-ing 15.2 percent.
There are more than a dozen fruit fl y species that attack mangoes. Across West Africa, losses from damage caused by mango fruit fl ies (Tephritidae diptera) have been growing. This is especially true since the arrival of Bactrocera invadens, a fl y species from Sri Lanka, fi rst discovered in West Africa in 2004 by the International Institute of Tropical Agricul-ture (IITA) in Benin. The insect pest has the potential to jeopardize the recent commercial success of the region’s mango export sector. Fruits showing the slightest trace of a fl y bite must be identifi ed, removed, and destroyed dur-ing harvesting and in-station sorting. Because fruit fl ies are classifi ed as “quarantine insects,” if a single fruit is detected that is infested with larvae, the whole batch can be rejected by European phytosanitary services. According to the ACP-EU Technical Centre for Agricultural and Rural Cooperation (CPA), whole containers of fruit from Africa are regularly intercepted and destroyed each year in incin-erators in European harbors and airports because of infestation. This results in substantial economic losses for
exporters. More important, due to reputational risks, the confi scation of a single batch can ruin the eff orts of a whole campaign.
LIVESTOCK DISEASESThere is a wide range of diseases that threaten and adversely aff ect livestock production in Senegal. How-ever, many diseases can be considered as constraints rather than risks, as they rarely lead directly to animal mortality and the majority of owners know how to manage them. However, growing animal populations, declining vaccination coverage, and erratic availability of quality vaccinations and medicines are among fac-tors that can weaken existing risk management capac-ity. This report concentrates on diseases that are either of a trans-boundary nature or of major zoonotic con-cern, and considers them in terms of the risk to local and international trade or potential risk to the human population.
The World Organization for Animal Health (OIE) con-ducted an in-depth review in 2010 of livestock diseases in Senegal. Table 3.3 provides a list of the most important diseases threatening cattle, small ruminants, and poultry. During the present mission, interviews with senior gov-ernment and private vets revealed that many of the con-straints and recommendations made in the OIE report still refl ect the situation today.
Although some diseases constitute a risk themselves, the major risk to the livestock sector remains the inability of the veterinary services to respond to needs. Whereas dis-ease control policies and strategies exist on paper, it is widely recognized that because of chronic underresourc-ing and resulting scarcities of material resources and qual-ifi ed personnel, the ministry is often unable to implement them or respond as required. Recognizing this challenge, the veterinary department has recently reprioritized and now covers fewer diseases in their vaccination campaigns, concentrating on PPR, Newcastle disease, African horse sickness (AHS) and lumpy skin disease, with episodic cam-paigns against other diseases as they occur (for example, CBPP, pox). Of particular note: the OIE report empha-sizes the involvement of the communities in policy design and implementation; a recommendation that this study strongly supports.

24 Senegal
ter of whole herds, which would have a major impact on the whole livestock industry not to mention the livelihoods of hundreds of thousands of households who depend on it. However, in Senegal, export of locally produced ani-mal products (with the exception of day-old chicks and eggs) is virtually nonexistent, and most animals are of the local indigenous breeds and quite tolerant of the above diseases. The government implements less extreme con-trol measures and although there are some losses in pro-ductivity, the impact is relatively insignifi cant.
Other diseases that occur in Senegal are largely known and to some extent predictable. Thus, these are consid-ered more as production constraints (for example, trypanosomiasis,, helminthiasis). Most well-maintained animals recover naturally from disease even if left untreated; however, productivity is obviously aff ected and most owners will opt to treat the diseases. The risk is that without proper prevention, when a large outbreak occurs, the losses can be considerable, as very few animals have been vaccinated. According to offi cials at the Ministry of Livestock and Animal Production, approximately 5 per-cent of poultry is vaccinated against Newcastle disease each year; 20 percent of smallstock; 63 percent of cattle; and 38 percent of horses. In addition, the quality and effi cacy of available vaccines is questionable; it is esti-mated that as many as 50 percent of veterinary products used could be counterfeit or of poor quality. Thus, it is the lack of adequate vaccination services and mostly the new, emerging diseases that this study highlights as the major risks.
TABLE 3.3. MAJOR LIVESTOCK DISEASES
Species Diseases Vaccinated Against Diseases under Surveillance
Cattle Lumpy skin disease (LSD/DNCB)Foot and mouth disease Hemorrhagic septicemia/ Pasteurellosis (HS)BlacklegAnthraxBotulism
Rinderpest (RP);Contagious bovine pleuropneumoniaRift Valley fever
Small ruminants Peste des petits ruminants (PPR)Pasteurellosis
Rift Valley fever
Poultry Newcastle disease (NCD) Highly pathogenic avian infl uenza (HPAI)
Source: Gary et al. 2010.
Among livestock diseases, this assessment considers Rift Valley fever, highly pathogenic avian infl uenza, and New-castle disease to be among priority livestock production risks. Avian infl uenza and Rift Valley fever can also have a signifi cant impact and infl uence on both local and inter-national trade. As notifi able diseases, they can also aff ect policy decisions, which have the potential to cause dam-age to livestock systems if they are inappropriate or are implemented quixotically.
Paradoxically, other diseases such as foot and mouth dis-ease and contagious bovine pleuropneumonia, could potentially cause even greater harm if the response mech-anisms required for control and eradication were actually put in place. Such measures would necessitate the slaugh-
CBPP (PPCB) was eradicated in Senegal in 1978 and vac-cinations ended in 2005. But in November 2012, there was an outbreak in the south after animals crossed into the country. Additional outbreaks have been reported in 2013.
Impact:
• Losses in production, including some mortality.• Restrictions on movement.• Higher veterinary (and vaccination) costs.• Need for up to a further 10 years of vaccination and
surveillance.
BOX 3.1. CASE STUDY: CONTAGIOUS
BOVINE PLEUROPNEUMONIA
(CBPP/PPCB) IN SENEGAL

25Agricultural Sector Risk Assessment
MARKET RISKSAmong the most common market risks presented in this section are price variability for crops and livestock, exchange rate and interest rate volatility, and counter-party risk.
CROP PRICE VOLATILITYPrice fl uctuations are to be expected in agricultural mar-kets. This is partly due the unpredictable nature of supply and demand, weather patterns, and related yields. How-ever, extreme price volatility deters producers from mak-ing productivity-enhancing investments and can jeopardize household access to food among poorer seg-ments of the population.
The impacts of the global price increases in food and fuel experienced in 2007-2009 were substantial. The 30 per-cent increase in the price of household foodstuff s (for example, rice, cooking oil, sugar, wheat, millet, milk prod-ucts) increased poverty levels by six percentage points, from 51 percent in 2005/06 to 57 percent in 2008 (Del Ninno and Mills 2015). In 2007 and 2008, the price of rice in local markets tripled, whereas grain prices increased by 50 percent. People took to the streets to protest these price increases, with riots destabilizing the political envi-ronment. Domestic food prices were 74 percent higher at the end of 2012 than they were in early 2006, according to FAO’s food price index. As a result, living conditions of the poorest households continue to deteriorate, with reductions in the quality and frequency of meals and higher incidences of food insecurity and malnutrition.
Although the risks associated with price can be important for household well-being, they are of only marginal sig-nifi cance to crop producers. This is especially true of sta-ple crops such as millet, sorghum, and cowpeas. Although high prices of these commodities can have a drastic impact on food security, they do not have a major impact on the fi nances of producers, most of whom will consume almost all that they produce. This is less true of maize and rice, which are produced more as cash crops that must compete with imported commodities so that low interna-tional prices can result in reduced profi tability. The same is true for export fruit and vegetables, including mangoes, tomatoes, and beans, all of which must compete on world
markets so that producers are directly aff ected by interna-tional prices and by exchange rate fl uctuations.
An analysis of producer price variability is based on inter-annual price variability for the period 1991–2011, meas-ured by coeffi cients of variation (CV). Nominal prices in US$/ton taken from FAOSTAT are used for the analysis of domestic producer prices. Table 3.4 compares levels of inter-annual price volatility across Senegal’s principal cereal and cash crops. During consultations in the fi eld, stakeholders repeatedly emphasized the volatility of domestic food crop prices. Indeed, the analysis highlights the extent to which price variation among domestic food crops is considerably greater than that of domestic cash crop prices.
Food CropsStaple crops are grown throughout Senegal, but the level of production achieved by the majority of households is inadequate to provide 100 percent food security. Thus, most households are dependent upon purchased food for at least some months of each year. The dependence upon markets is greatest in August when prices tend to be high-est. The price of staple crops at this time is therefore criti-cal to household food security and the risk that increased food prices might reduce the accessibility of food has a substantial impact upon household resource manage-ment. It is diffi cult to quantify the impacts of risks because of price volatility, but respondents frequently reported the diversion of crop inputs intended for cash crops such as groundnuts or cotton to crops such as sorghum and millet to maximize food availability. They also cited retention of grain at the household level, this despite inadequate stor-age conditions and consequent high levels of loss due to storage pests and other risks.
TABLE 3.4. I NTER-ANNUAL CROP PRICE
VARIABILITY, 1991–2011
Coeffi cients of Variation Cereal Crops Cash Crops
Maize 0.29 Cotton* 0.15Sorghum 0.31 Groundnuts 0.21Millet 0.34Rice (paddy) 0.34
Source: FAOSTAT.*Price for cotton lint.
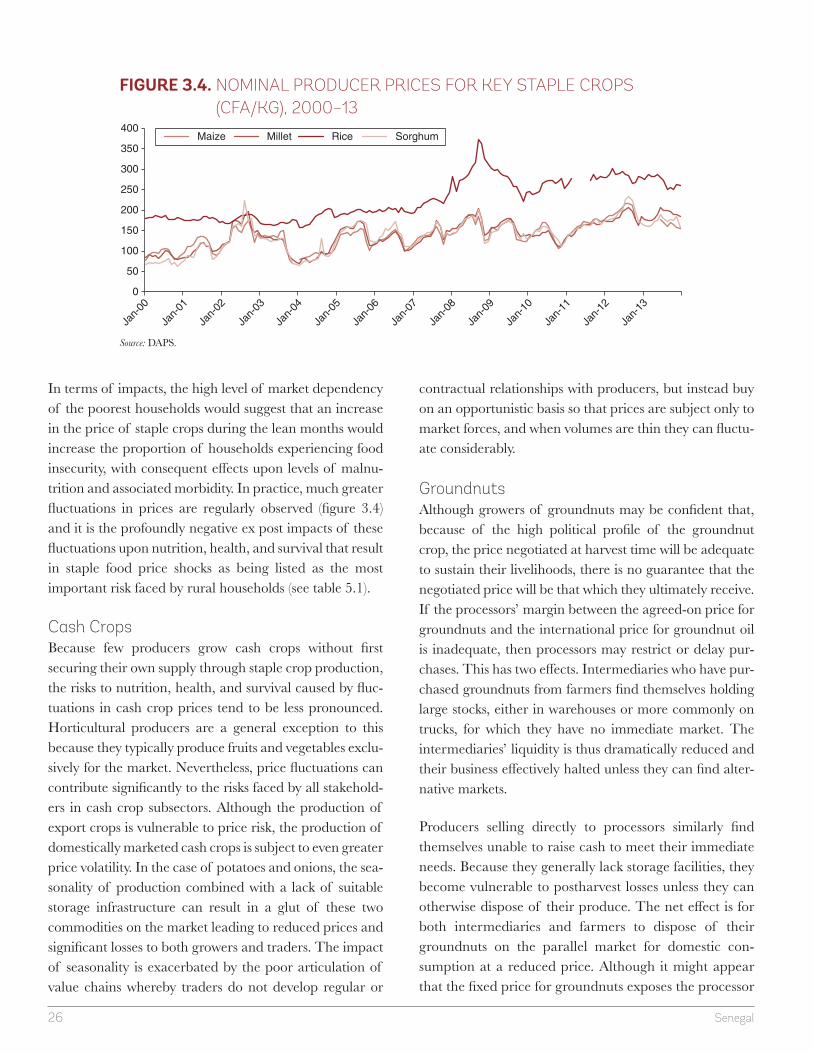
26 Senegal
In terms of impacts, the high level of market dependency of the poorest households would suggest that an increase in the price of staple crops during the lean months would increase the proportion of households experiencing food insecurity, with consequent eff ects upon levels of malnu-trition and associated morbidity. In practice, much greater fl uctuations in prices are regularly observed (fi gure 3.4) and it is the profoundly negative ex post impacts of these fl uctuations upon nutrition, health, and survival that result in staple food price shocks as being listed as the most important risk faced by rural households (see table 5.1).
Cash CropsBecause few producers grow cash crops without fi rst securing their own supply through staple crop production, the risks to nutrition, health, and survival caused by fl uc-tuations in cash crop prices tend to be less pronounced. Horticultural producers are a general exception to this because they typically produce fruits and vegetables exclu-sively for the market. Nevertheless, price fl uctuations can contribute signifi cantly to the risks faced by all stakehold-ers in cash crop subsectors. Although the production of export crops is vulnerable to price risk, the production of domestically marketed cash crops is subject to even greater price volatility. In the case of potatoes and onions, the sea-sonality of production combined with a lack of suitable storage infrastructure can result in a glut of these two commodities on the market leading to reduced prices and signifi cant losses to both growers and traders. The impact of seasonality is exacerbated by the poor articulation of value chains whereby traders do not develop regular or
contractual relationships with producers, but instead buy on an opportunistic basis so that prices are subject only to market forces, and when volumes are thin they can fl uctu-ate considerably.
GroundnutsAlthough growers of groundnuts may be confi dent that, because of the high political profi le of the groundnut crop, the price negotiated at harvest time will be adequate to sustain their livelihoods, there is no guarantee that the negotiated price will be that which they ultimately receive. If the processors’ margin between the agreed-on price for groundnuts and the international price for groundnut oil is inadequate, then processors may restrict or delay pur-chases. This has two eff ects. Intermediaries who have pur-chased groundnuts from farmers fi nd themselves holding large stocks, either in warehouses or more commonly on trucks, for which they have no immediate market. The intermediaries’ liquidity is thus dramatically reduced and their business eff ectively halted unless they can fi nd alter-native markets.
Producers selling directly to processors similarly fi nd themselves unable to raise cash to meet their immediate needs. Because they generally lack storage facilities, they become vulnerable to postharvest losses unless they can otherwise dispose of their produce. The net eff ect is for both intermediaries and farmers to dispose of their groundnuts on the parallel market for domestic con-sumption at a reduced price. Although it might appear that the fi xed price for groundnuts exposes the processor
FIGURE 3.4. NOMINAL PRODUCER PRICES FOR KEY STAPLE CROPS
(CFA/KG), 2000–13
0
50
100
150
200
250
300
350
400
Jan-
00
Jan-
01
Jan-
02
Jan-
03
Jan-
04
Jan-
05
Jan-
06
Jan-
07
Jan-
08
Jan-
09
Jan-
10
Jan-
11
Jan-
12
Jan-
13
Maize Millet Rice Sorghum
Source: DAPS.

27Agricultural Sector Risk Assessment
FIGURE 3.5. INTERNATIONAL VS. DOMESTIC GROUNDNUT OIL PRICES,
1984–2013
0
50
100
150
200
0
600
1200
1800
2400
3000
1984 1987 1990 1993 1996 1999 2002 2005 2008 2011
Dom
estic
pric
e (X
AF
/Kg)
Inte
rnat
iona
l pric
e (U
SD
/MT
)Groundnut oil price Delivered groundnut price
Source: DAPS; FAOSTAT.
FIGURE 3.6. INTERNATIONAL VS. DOMESTIC COTTON PRICES, 1984–2013
0
65
130
195
260
325
0.0
40.0
80.0
120.0
160.0
200.0
1984 1986 1988 1990 1992 1994 1996 1998 2000 2002 2004 2006 2008 2010 2012
Dom
estic
pric
e (X
AF
/Kg)
Inte
rnat
iona
l pric
e (U
S c
ents
/lb)
Lint price Seed cotton price
Source: DAPS; Cotton Outlook Index A.
to price risk, the existence of a parallel domestic market and the eff ective oligopsony of three large groundnut processors, allows much of that risk to be passed back to the producers.
CottonThe price for seed cotton is fi xed at the beginning of the growing season by Société de Développement et des Fibres Textiles (SODEFITEX), which is the only buyer of the crop. Consequently, it is exposed to the risk of interna-tional price fl uctuations for cotton lint until the ginned cotton has been sold. Moreover, to guarantee a minimum level of throughput, SODEFITEX is obliged to off er a price that is competitive with that for groundnuts. The company is thus limited in the extent to which it can fac-tor the price risk into its buying price. Thus, for cotton,
price risk is visited mainly upon the processing company. In practice, SODEFITEX is mandated by GOS to pur-chase all the cotton that is produced. Thus, it is unable to respond to anticipated price risk, and therefore bears the full brunt of unfavorable price fl uctuations. The recent decline in the international price for cotton has led to the erosion of liquidity accumulated in the past when prices of cotton lint were signifi cantly higher (fi gure 3.6). It is worth noting that unless prices rebound or fi nancial sup-port can be obtained, current dynamics may well render the company insolvent.
Since the mid-1980s, the international price index for cot-ton lint has generally varied between US$0.50–US$0.90 per pound (fi gure 3.4), although a major spike occurred in prices throughout 2011. The variability of international

28 Senegal
cotton prices over the past 30 years has been relatively high, with a coeffi cient of variation of 33 percent. By contrast, the international prices for both groundnut oil and for maize have been more variable with coeffi cients of variation of 44 percent and 45 percent, respectively (fi gures 3.5 and 3.7).
MaizeMaize prices in Senegal are determined primarily by domes-tic supply and demand. Although the country is not self-suffi cient in maize (signifi cant volumes are imported each year, mainly for poultry feed), domestic prices to farmers are generally lower than import parity, attributable mainly to the cost and diffi culty of aggregating substantial volumes of consistent quality with which to manufacture animal feed. These same factors prevent the competitive export of maize. Producers of maize face only limited price risk (fi gure 3.7). The most common experience over the past 30 years has been for maize prices to spike upward rather than down-ward. The main risk due to maize price fl uctuations is thus visited on livestock rather than maize producers.
The price risk faced by the companies that process locally purchased commodities for subsequent export (that is, cotton and groundnuts) is increased by the fact that the domestic purchasing price may vary independently of the export price, as a result of both the local price setting mechanism and of fl uctuations in the exchange rate. By contrast, the export market for maize is negligible.
Both local production and imported maize are sold within Senegal and although domestic prices may not track international prices completely, the discrepancies between the domestic and international prices are much less
marked than those of either cotton or groundnuts. Never-theless, buyers of maize face only the risks of normal price fl uctuations in either market.
LIVESTOCK PRICE VOLATILITYThe limited reliance of pastoralists upon markets implies a limited impact of price risk upon pastoral livestock pro-duction. However, this situation is changing. In very tradi-tional low-input, low-output pastoral systems, market dynamics were not a major concern and market risks were mostly of concern in commercial, intensive livestock pro-duction systems. However, the majority of livestock own-ers even in remote extensive systems are dependent on markets to some extent.
The relatively recent trend of growing involvement and dependence of pastoralists on markets is not without risks. These include market quarantines on animal sales because of disease outbreaks and food and feed animal price insta-bility. During market shocks, livestock prices often plum-met while food prices increase, which has now become a common shock-induced pattern in dry lands. The major reason that pastoralists of the Senegalese Sahel use live-stock markets is to satisfy their own consumption needs, which usually are aggravated and increased during dry seasons and droughts (Wane et al. 2010).
Figure 3.8 shows seasonally adjusted prices for animals in Dahra, Senegal’s primary livestock market. The cattle prices are stable in comparison with those of female goats and sheep, which tend to decrease while those from rams and billy goats are increasing. The trends in smallstock are
0
60
120
180
240
0.0
75.0
150.0
225.0
300.0
375.0
1984 1987 1990 1993 1996 1999 2002 2005 2008 2011
Dom
estic
pric
e (X
AF
/kg)
Inte
rnat
iona
l pric
e (U
SD
/MT
)Imported maize FarmGate maize price
FIGURE 3.7. INTERNATIONAL VS. DOMESTIC MAIZE PRICES, 1984–2013
Source: DAPS; FAOSTAT.

29Agricultural Sector Risk Assessment
signifi cant because of the number of animals being sold and their importance at the level of household income. Anecdotal evidence collected during this study would sug-gest that market parameters in Dahra depend to some extent on the dynamics of neighboring Malian and Mauritanian markets. Anecdotal evidence would suggest that the ongoing confl ict in northern Mali has disrupted
long-standing livestock fl ows and trade dynamics between the two countries, with observed decreases in the availa-bility of animals for sale in Dahra in recent years.
The most striking characteristic of the graphs in fi gure 3.8 is the notably high intra-annual variation in price. This is likely due to seasonality in demand (religious
FIGURE 3.8. DAHRA MARKET LIVESTOCK PRICES (CFA/HEAD), 2005–10Male cattle gross prices Male seasonally adjusted prices
Female cattle gross prices Female cattle seasonally adjusted prices
Sheep gross prices Sheep seasonally adjusted prices
Goat gross prices Goat seasonally adjusted prices
050000
100000150000200000250000300000
Jan-
05
May
-05
Sep
-05
Jan-
06
May
-06
Sep
-06
Jan-
07
May
-07
Sep
-07
Jan-
08
May
-08
Sep
-08
Jan-
09
May
-09
Sep
-09
Jan-
10
0
50000
100000
150000
200000
250000
Jan-
05
May
-05
Sep
-05
Jan-
06
May
-06
Sep
-06
Jan-
07
May
-07
Sep
-07
Jan-
08
May
-08
Sep
-08
Jan-
09
May
-09
Sep
-09
0
50000
100000
150000
200000
Jan-
05
May
-05
Sep
-05
Jan-
06
May
-06
Sep
-06
Jan-
07
May
-07
Sep
-07
Jan-
08
May
-08
Sep
-08
Jan-
09
May
-09
Sep
-09
0
50000
100000
150000
200000
Jan-
05
May
-05
Sep
-05
Jan-
06
May
-06
Sep
-06
Jan-
07
May
-07
Sep
-07
Jan-
08
May
-08
Sep
-08
Jan-
09
May
-09
Sep
-09
01000020000300004000050000600007000080000
Jan-
05
May
-05
Sep
-05
Jan-
06
May
-06
Sep
-06
Jan-
07
May
-07
Sep
-07
Jan-
08
May
-08
Sep
-08
Jan-
09
May
-09
Sep
-09
0
10000
20000
30000
40000
Jan-
05
May
-05
Sep
-05
Jan-
06
May
-06
Sep
-06
Jan-
07
May
-07
Sep
-07
Jan-
08
May
-08
Sep
-08
Jan-
09
May
-09
Sep
-09
0
20000
40000
60000
80000
100000
Jan-
05
May
-05
Sep
-05
Jan-
06
May
-06
Sep
-06
Jan-
07
May
-07
Sep
-07
Jan-
08
May
-08
Sep
-08
Jan-
09
May
-09
Sep
-09
05000
10000150002000025000
Jan-
05
May
-05
Sep
-05
Jan-
06
May
-06
Sep
-06
Jan-
07
May
-07
Sep
-07
Jan-
08
May
-08
Sep
-08
Jan-
09
May
-09
Sep
-09
goat female goat goat female goat
ram sheep ram sheep
veal heifer cow
calf young bull bullcalf young bull bull
veal heifer cow
Source: Ministry of Livestock.

30 Senegal
celebrations; buying male animals to plow land) and sup-ply (willingness to sell to cover needs in dry seasons, and unwillingness to sell when conditions are good and herd rebuilding is taking place). It could also be due to disease outbreaks.
No national price data series for livestock is available. Nevertheless, fi gure 3.9 compares the annual average price for goats in the Saint-Louis region to average cereal prices for rice, millet, and sorghum. It illustrates that a goat bought more units of cereal in 2006 and 2010, but less substantially less in 2008 and 2012. Although 2006 was a drought year in Louga and Matam, 2008 and 2010 saw food and oil price shocks and the global fi nancial cri-sis. Despite these observations, there are insuffi cient data to draw any fi rm conclusions.
Price volatility aff ecting imported feed components, nota-bly corn and soya, which together make up 80 percent of poultry feed ingredients, can be considered the major risk facing Senegal’s poultry industry. In the longer term, changes in international trade policies and trade embar-
gos imposed in response to avian infl uenza constitute a major threat, with the possibility of cheaper imported poultry products from Brazil and the United States, in particular, undermining the economic sustainability of Senegal’s emerging poultry industry.
EXCHANGE RATE VOLATILITYExchange rate fl uctuations can also contribute to price risk for exporters of locally purchased products. The exchange rate of the XAF to the U.S. dollar has shown little erratic variation over the past 12 years, declining from XAF 750 in 2001 to XAF 425 in 2008 and remain-ing relatively stable thereafter (fi gure 3.10). Comparing the variation in international prices over the same period, it is evident that the risk due to unexpected variations in exchange rate has been relatively limited.
INTEREST RATE VOLATILITYAs elsewhere, poor access to credit is one of the principal constraints to agricultural growth in Senegal. This is espe-cially true among the country’s smallholder farmers.
FIGURE 3.9. GOATS VS. CEREALS TERMS OF TRADE, 2005–12
0
20
40
60
80
100
120
140
160
2005 2006 2007 2008 2009 2010 2011 2012Uni
ts o
f goa
t to
units
of c
erea
l
Local rice : Goat Local millet : Goat Local sorghum: Goat
Source: Ministry of Livestock; DAPS.
FIGURE 3.10. HISTORICAL EXCHANGE RATES, 2001–12
0
200
400
600
800
2001 2002 2003 2004 2005 2006 2007 2008 2009 2010 2011 2012
XA
F /
US
$ 1
Source: World Bank.

31Agricultural Sector Risk Assessment
Agricultural credit as a share of total bank credit (3 percent) in Senegal is among the lowest in the region. Much of this is used for purposes other than farm production, such as agro-food processing or storage. For example, a number of commercial banks fi nance the cotton and groundnut sec-tors in consortium with the agricultural bank Caisse Natio-nale de Crédit Agricole du Sénégal. For groundnuts, the bank’s direct partners are processors, warehouses, and seed suppliers. For cotton, it is the processors and the national cotton producers’ federation, the Federation Nationale des Producteurs de Coton. A relatively small number of small-holder farmers, mostly involved in commercial tomato and sesame production, are able to access seasonal credit via contract-fi nancing arrangements.
For borrowers, high variability of interest rates can pose a risk to their enterprise when sudden spikes in lending rates can adversely aff ect resources and operations, and in extreme cases, cause them to default on their loans. How-ever, in Senegal, such risks are minimal as the number of borrowers is small and interest rates have been relatively stable during the review period.
COUNTERPARTY RISKIn addition to price risk, producers, traders, processors, and others all face the risk of nonperformance by the other party in the course of a trade. Nonperformance in trade includes such occurrences as goods supplied under-weight or below specifi cations, partial or delayed pay-ment, or even complete failure to supply or make payment. The risk of nonperformance is generally higher when markets are poorly regulated. Although the level of mar-ket regulation in rural Senegal appears minimal, traders indicated that the frequency of nonperformance was low. They ascribed this to their own behavior in trading only with those whom they knew and trusted. Such a limitation of trading partners can reduce the effi ciency of markets and increase transaction costs.
ENABLING ENVIRONMENT RISKSOther sector risks arise from changes in the broader polit-ical and economic environment in which agriculture operates. These changes can be both internal and exter-nal. Agriculture sector policy and regulation are a source
of risk when public involvement in sector activities has unexpected, adverse consequences. Other risks include general insecurity as a result of domestic unrest or regional confl ict that can also disrupt agricultural production sys-tems and livelihoods.
POLICY UNCERTAINTYWithin the context of an enabling environment, including the promulgation of policy and development and imple-mentation of regulations, it is not the development of that environment per se, but the nature of stakeholders’ per-ception of risk within it that is most critical to production. To that extent, any inconsistencies in policy or process can enhance uncertainty. Overall, the challenge to decision makers is that agricultural policy is obliged to reconcile the dilemma that although the development of the sector would benefi t from higher commodity prices, the majority of rural households depend upon access to cheap food. This has led to inconsistencies in program implementa-tion, which have been a consistent criticism of agricul-tural policy in Senegal (Resnick 2013). Indeed, the analysis highlighted a widespread perception among smallholders, pastoralists, and others that government interventions can increase the level of uncertainty associated with both crop and livestock production and marketing.
Over the past 20 years, GOS has consistently reduced its involvement in the agricultural sector. Exceptions to this have generally been positive for agriculture. Rice, maize, and cassava, in particular, have been the subject of special value chain development programs aiming to streamline interventions in these sectors and to intensify production.
For groundnuts, GOS policy has consistently been to set a processing price that will allow smallholders to make a profi t. However, the single cotton ginning company SODEFITEX is also obliged to off er prices that are com-parable in terms of ultimate earnings to discourage farm-ers from switching crops. As noted elsewhere, this policy exposes SODEFITEX to price risk when international cotton prices fall. For onions and tomatoes, GOS has introduced occasional import bans to support domestic prices during times of surplus. Nevertheless, the timing of the imposition and removal of such bans does not appear to be understood by stakeholders. There are no clear cri-teria for the changes in access, and the delay between the
32 Senegal
announcement and implementation of such bans or their removal, which should be at least 120 days to allow grow-ers to react, is often much less than this.
The analysis also highlights major concerns about land access, land tenure, and user rights of livestock owners. As in many arid countries where nomadic pastoralism and transhumance is important, the land tenure systems are pluralistic and complicated, and with increasing glo-balization and settlement often livestock owners’ rights are not only not recognized but often not even under-stood. As such, large-scale land acquisitions, expanding agriculture and irrigation often take place without suffi -cient consideration of risks posed to livestock owners. There are very few cases in which such developments adequately address the pastoralists’ needs. Such develop-ments should not be outlawed, as they often increase pri-mary production and can provide multiple opportunities for livestock owners; however, their design and implemen-tation must be done in conjunction with all the stakehold-ers including pastoralists.
Livestock producers who provided input for this study noted, in particular, their concerns over access to land alienated under the Grande Off ensive Agricole pour la Nourriture et l’Abondance for large agricultural projects, which had previously supplied dry season grazing and access to riverine pastures. The speed and lack of consul-tation associated with the process have engendered a per-ceived risk among pastoralists that their livelihood may be less sustainable than was originally understood. The lack of consistency in the application of regulations regarding animal movement in the event of disease, or even in the extent to which vaccination might be eff ectively carried out, also contributes to uncertainty that will constrain the extent to which livestock producers are willing to invest in production.
Senegal’s existing trade embargo on imported poultry products protects the country’s emerging poultry industry from the threat of avian infl uenza while keeping competi-tion from lower-price imports at bay. However, there is strong international pressure from major exporters such as Brazil and the United States who charge the ban is unlaw-ful and unnecessary. Although the legal procedures may take a long time to play out, there is a major risk to the whole viability of the Senegalese commercial poultry
sector if GOS were to be compelled to lift the ban. In addi-tion, uncertainty over how the issue will be resolved can adversely aff ect decision making and dampen investments.
Similarly, the analysis highlights weaknesses within the animal health service delivery system that merit added attention. Following structural reforms in the 1980s, live-stock vaccination has largely been handed over to the pri-vate sector. Overall, livestock vaccination coverage has dropped to approximately 20 percent of smallstock and 63 percent of cattle, signifi cantly short of the 80 percent coverage required. This gap substantially increases the risk of heavy losses when disease outbreaks occur. Quality control on the import, sale, and use of veterinary drugs is poorly monitored, contributing to added uncertainty over the effi cacy of treatment and prevention programs at the farmer level.
Although private sector involvement is common in almost African countries, there remain questions about the eco-nomic viability of veterinarians operating in remote extensive pastoralist systems. Indeed, many of these pri-vate sector operators may not be operating within the nationally and internationally required norms. One pri-vate vet interviewed estimated more than 50 percent of drugs sold are counterfeit and 40 percent of chickens eaten by humans in Ndiaye show signs of antibiotic resi-dues in meat. Table 3.5 illustrates the challenges of ani-mal health service provision in Senegal, bearing in mind that to achieve eff ective disease control requires 80 per-cent vaccination coverage. There is a general recognition that implementation of the law is weak and chronically underfunded. The Ministry of Livestock requires a budget of CFA 3 billion (US$600 million) per year. It receives one-third of this amount, of which 60 percent is spent on vaccination. The Ministry also recognizes the noncom-petitiveness of local vaccine production.
CONFLICTS, THEFT, AND INSECURITYWhere confl icts occur, unrestrained by the rule of law, then the impact of risk is considerable. Since 1982, the region of Casamance has been aff ected by internal confl ict and tensions. An estimated 30,000–60,000 people have been displaced and agricultural production in Casamance reduced by 50 percent since 1985 (World Bank 2013). Sen-egal’s richest agricultural region, Casamance is plagued

33Agricultural Sector Risk Assessment
with chronic food insecurity. In 2014, the region had the highest levels of hunger, with 37 percent of households, representing some 1.8 million people or 14 percent of Sen-egal’s population, facing food shortages. Ten percent of households faced severe food insecurity. Food shortages in Casamance are often aggravated by the low-intensity rebellion by the Casamance Democratic Forces Movement (MFDC) that began in 1982 and, albeit infrequently, ham-pers agricultural transport, trade, and other socioeconomic activities. It has also restricted access to farms because of the proliferation of landmines. The most aff ected areas are in Sindian in northern Casamance and in the south near the border with Guinea-Bissau.
Confl ict and tensions between herders and crop growers were highlighted as risks by several interlocutors during the fi eld mission and are commonly stated in the literature as an increasing problem in the extensive Sahel pastoralist systems. Indeed, much of the confl ict in the region (Cen-tral African Republic, Niger, Mali, and Darfur) can be traced back to divisions between farmers and herders and
clashes over natural resources. Their frequent mention in Senegal is a notable concern.
The eff ects of confl ict include reduced mobility by trad-ers, veterinary auxiliaries, and private vets who are unable to reach livestock owners in time; seasonal labor move-ment and some agricultural activities are curtailed (for example, transplanting of rice, harvesting); access to mar-kets is reduced and markets become less effi cient. More-over, government offi cials, vehicles and services are unable to reach these insecure areas, and vaccination and veteri-nary services are discontinued. For example, despite a major outbreak of LSD in 2008, few animals were vacci-nated, leading to higher mortality rates. In addition, con-fl ict leads to increased larceny and cattle rustling and a sense of impunity among criminals, increased violence and even death of livestock owners, as well as increased “unoffi cial” taxation by armed forces and others. It is worth noting that theft is not restricted to the Casamance region alone. Throughout the survey, the problem of theft was repeatedly cited by producers and traders.
TABLE 3.5. VACCINATION COVERAGE IN SENEGAL, 2009
Aim/Objective
Population of Animals
Targeted
Number Animals Vaccinated
2008–09
Animal Population
Vaccinated (%)
Lumpy skin disease/dermatose nodulaire contagieuse bovine (DNCB), nationwide
3,136,500 934,057 29.8
Foot and mouth diseases/fi èvre aphteuse 3,136,500 35,863 1.1Specifi cally targeted exotic breeds Pasteurellosis bovine 3,136,500 70,456 2.2Not nationwide, but many regions aff ectedHorse sickness—nationwide 517,634 134,362 26.0Peste des petits ruminants—nationwide 9,259,450 1,644,254 17.8Newcastle disease (backyard and village level) 22,077,800 166,319 0.8Botulisme—East and North Sénégal 465,600 48,531 10.4Pasteurellosis in smallstock—paid for by livestock owners 9,259,450 43,454 0.5
Clavelée—paid for by livestock owners 9,259,450 35,708 0.4
Source: Gary et al. 2010.


35Agricultural Sector Risk Assessment
The frequency, severity, and costs of adverse events are analyzed in this chapter as the basis for prioritizing the various sources of risk. The conceptual and methodological basis described below is then applied to production, market, and enabling environ-ment risks. The various sources of risk are then reviewed to discern the most critical.
CONCEPTUAL AND METHODOLOGICAL BASIS FOR ANALYSISFor the purposes of this study, risk is defi ned as an exposure to a signifi cant fi nancial loss or other adverse outcome whose occurrence and severity is unpredictable. Risk thus implies exposure to substantive losses, over and above the normal costs of doing business. In agriculture, farmers incur moderate losses each year as the result of unex-pected events such as suboptimal climatic conditions at diff erent times in the produc-tion cycle and/or modest departures from expected output or input prices. Risk refers to the more severe and unpredictable adverse events that occur beyond these smaller events.
This concept diff ers from the common perception of “risk” by farmers and traders, based on the year-to-year variability of production and prices. It should also be distin-guished from constraints, which are predictable and constant limitations to productiv-ity and growth and which contribute to ineffi ciencies in production and marketing systems.
LOSS THRESHOLDSAs agricultural production is inherently variable, the immediate step for analysis is to defi ne loss thresholds, which distinguish adverse events from smaller, inter-annual varia-tions in output. This is achieved by fi rst estimating a time trend of “expected” produc-tion in any given year, based on actual production, and treating the downside diff erence between actual and expected production as a measure of loss. A loss threshold of 0.33 standard deviation from trend is then set to distinguish between losses resulting from
CHAPTER FOUR
ADVERSE IMPACTS OF AGRICULTURAL RISKS

36 Senegal
adverse events and those that refl ect the normal costs of doing business. Those below threshold deviations from trend allow estimation of the frequency, severity, and cost of loss for a given time period (see appendix D for illustra-tions of indicative crop loss estimates). The frequency and severity of losses derived in this manner were also checked against historical records to ensure consistency with actual adverse events.
THE INDICATIVE VALUE OF LOSSESAvailable data on actual losses resulting from adverse events are not always accurate or consistent enough to facilitate comparison and ranking of the costs of adverse events. Analysis was thus based on estimates of the “indic-ative” value of losses, which provide a more eff ective basis for comparison. Indicative loss values are also compared with the value of agricultural GDP in the relevant year to provide a relative measure of the magnitude of loss. Although these estimates draw on actual data as much as possible, it is emphasized that they represent indicative, not actual losses.
DATA SOURCESAnalysis of this nature requires a consistent set of data on both production and prices for an extended time period. Of the various sources of data available, FAOSTAT’s data series on the value of gross agricultural production (1980–2012) and crop production (1980–2012) was
considered the most suitable. These data allow the analy-sis of risk over a 33-year period.
PRODUCTION RISKSBased on analysis of available quantitative and qualitative data, the most common risks to agricultural production in Senegal are drought, locust outbreaks, and fl ooding. The incidence of these and other adverse events is indicated in fi gure 4.1, largely based on reports of adverse events for the period 1980–2012. During the 33-year period 1980–2012, Senegal’s agricultural sector has been subjected to at least 10 major shocks. Erratic rainfall and drought emerge as the most common sources of production shocks, followed by locusts. Related risk events may occur in isolation, but can also present as multiple, overlapping shocks—as was the case in 1984, 2002, 2007, and 2011—with far greater impacts and higher associated losses.
Measured in terms of gross agricultural value,8 crop pro-duction in Senegal was signifi cantly reduced 11 times by adverse events during the period 1980–2012, for an over-all frequency of one in three to four years on average (table 4.1). All but three of these events resulted in a drop in aggregate production value of 10 to 30 percent. It is worth noting that three (1980, 1983, 2002) of the four
8 Gross aggregate value is the total value of volume of production for each crop multiplied by the producer price.
0
20
40
60
80
100
120
140
160
180
1980 1982 1984 1986 1988 1990 1992 1994 1996 1998 2000 2002 2004 2006 2008 2010 2012
Severedrought,
1980
Severedrought;locusts,1983–84
Locusts,1988
Locusts,1992
Late rains,regional
droughts,1996–98
Severedrought;
cold rains;locusts,
2002
Locusts,2004 Erratic
rainfall;birds,2007
Late/erraticrainfall;locusts,
2011
Crop production index Food production index Livestock production index
FIGURE 4.1. TIMELINE OF MAJOR SHOCKS TO AGRICULTURAL
PRODUCTION IN SENEGAL (2004–06 = 100), 1980–2012
Source: World Development Indicators; Authors’ notes.

37Agricultural Sector Risk Assessment
years with the highest crop losses coincided with extreme drought events, whereas poor rainfall aff ecting key crop production areas coupled with locust and bird infestation contributed to high crop losses in 2007 and 2011.
Although figure 4.1 highlights the frequency of major risk events, it does not show the extent of the risk asso-ciated with individual crops in different provinces, nor the severity of the losses that have occurred. The degree of risk can be partially estimated from the vari-ability of yield, as indicated by the coefficient of varia-tion (table 4.2). This shows that maize yields are the most variable, closely followed by tomatoes, rice, and cowpeas. The variability of tomato yields is unexpected given the widespread use of drip irrigation to grow the crop and most probably refl ects the impact of pests and diseases. Yield variation for millet and sorghum are the lowest among the crops assessed, as might be expected for crops that show a high degree of tolerance to mois-ture stress, whereas cotton, groundnuts, potatoes, and onions exhibit moderate levels of variability.
Because it is based upon deviations from a trend observed at a national level, a national-level analysis may well underestimate the impact of risk events at the departmen-tal level wherein the observed extent of variation can be
TABLE 4.1. COST OF ADVERSE EVENTS FOR CROP PRODUCTION,* 1980–2012
Year Description
Indicative Loss Value
US$ (in millions)
% of Gross Prod. Value*
1980 Severe drought aff ecting 8 of 14 regions, incl. Kaolack, Kaff rine, Fatick; –333 K MT of gnuts
–128.2 –19
1983 12 of 14 provinces aff ected by severe drought; locusts; 340 K MT of groundnuts lost
–128.5 –19.3
1984 Regional droughts in Matam, Tambacounda, –91.7 –13.81992 Regional droughts; locusts infestation; estimated 205 K MT groundnuts lost –69.8 –10.51996 Regional droughts in Diourbel, Kaolack, Kolda –50.3 –7.51998 Late, erratic rains; more than 172 K MT of losses in maize, millet,
sorghum, cotton –47.9 –7.2
1999 Delayed start to the season; erratic rainfall –33.5 –5.02002 Severe drought aff ecting 50% of country; locust infestation; 420 K MT of
groundnuts lost –217.3 –32.6
2004 Locust infestation; over 133 K and 49 K MT of millet and cowpea lost –68.6 –10.32007 Erratic rainfall; birds; substantial losses in millet, sorghum, maize, and
groundnuts –110.8 –16.6
2011 Erratic rainfall and locust outbreak aff ects maize, millet, and groundnut production
–97.7 –14.7
Sources: FAOSTAT.Note: Cowpea losses were included from 1989 forward because of data availability. Potato losses were calculated from 1980 to 2004 because of inconsistencies in data thereafter.*Average 2005–07.
TABLE 4.2. COEFFICIENTS OF VARIATION FOR
CROP PRODUCTION, 1980–2012
Production Area Yield
Maize 0.70 0.36 0.38Groundnuts 0.32 0.20 0.24Onions 0.72 0.54 0.25Rice 0.62 0.27 0.30Millet 0.25 0.12 0.18Sorghum 0.30 0.25 0.17Cowpeas 0.68 0.51 0.30Tomatoes 0.88 0.75 0.35Cotton 0.36 0.25 0.24Potatoes 0.33 0.32 0.26
Source: FAOSTAT.Note: For onions and tomatoes, 2012 was not available. Instead, data through 2011 were used.
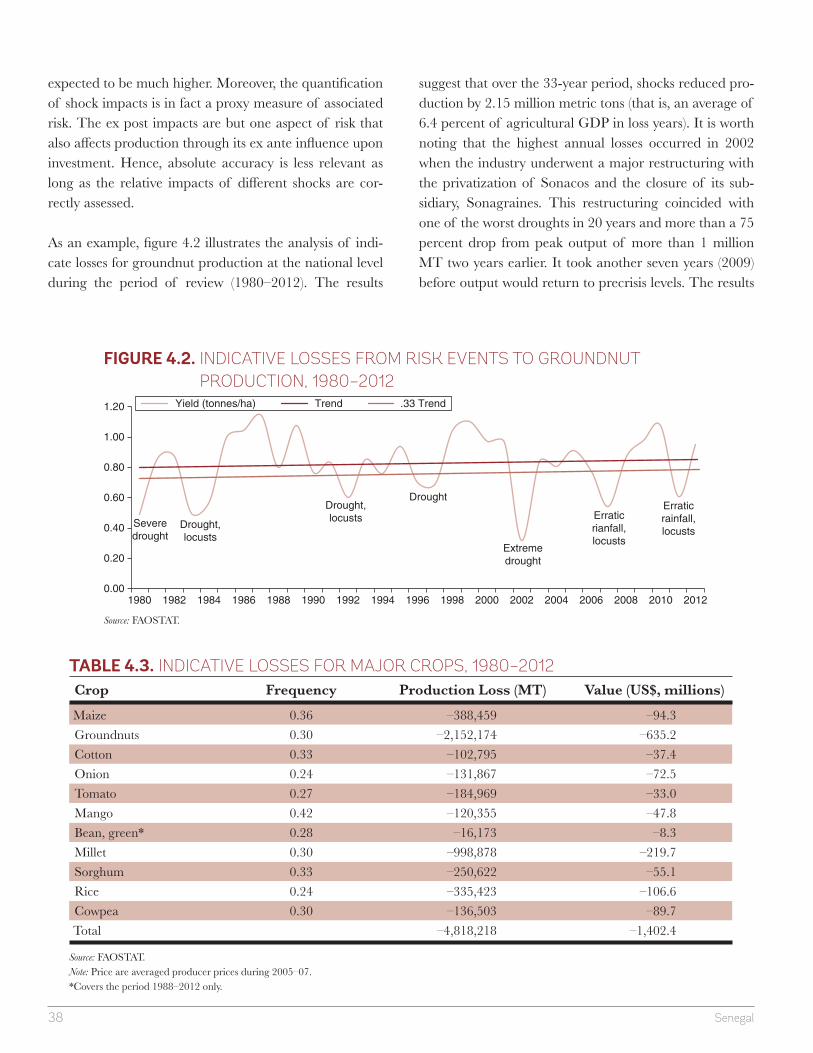
38 Senegal
expected to be much higher. Moreover, the quantifi cation of shock impacts is in fact a proxy measure of associated risk. The ex post impacts are but one aspect of risk that also aff ects production through its ex ante infl uence upon investment. Hence, absolute accuracy is less relevant as long as the relative impacts of diff erent shocks are cor-rectly assessed.
As an example, fi gure 4.2 illustrates the analysis of indi-cate losses for groundnut production at the national level during the period of review (1980–2012). The results
suggest that over the 33-year period, shocks reduced pro-duction by 2.15 million metric tons (that is, an average of 6.4 percent of agricultural GDP in loss years). It is worth noting that the highest annual losses occurred in 2002 when the industry underwent a major restructuring with the privatization of Sonacos and the closure of its sub-sidiary, Sonagraines. This restructuring coincided with one of the worst droughts in 20 years and more than a 75 percent drop from peak output of more than 1 million MT two years earlier. It took another seven years (2009) before output would return to precrisis levels. The results
0.00
0.20
0.40
0.60
0.80
1.00
1.20
1980 1982 1984 1986 1988 1990 1992 1994 1996 1998 2000 2002 2004 2006 2008 2010 2012
Severedrought
Drought,locusts
Drought,locusts
Drought
Extremedrought
Erraticrianfall,locusts
Erraticrainfall,locusts
Yield (tonnes/ha) Trend .33 Trend
FIGURE 4.2. INDICATIVE LOSSES FROM RISK EVENTS TO GROUNDNUT
PRODUCTION, 1980–2012
Source: FAOSTAT.
TABLE 4.3. INDICATIVE LOSSES FOR MAJOR CROPS, 1980–2012
Crop Frequency Production Loss (MT) Value (US$, millions)
Maize 0.36 –388,459 –94.3Groundnuts 0.30 –2,152,174 –635.2Cotton 0.33 –102,795 –37.4Onion 0.24 –131,867 –72.5Tomato 0.27 –184,969 –33.0Mango 0.42 –120,355 –47.8Bean, green* 0.28 –16,173 –8.3Millet 0.30 –998,878 –219.7Sorghum 0.33 –250,622 –55.1Rice 0.24 –335,423 –106.6Cowpea 0.30 –136,503 –89.7Total –4,818,218 –1,402.4
Source: FAOSTAT.Note: Price are averaged producer prices during 2005–07.*Covers the period 1988–2012 only.
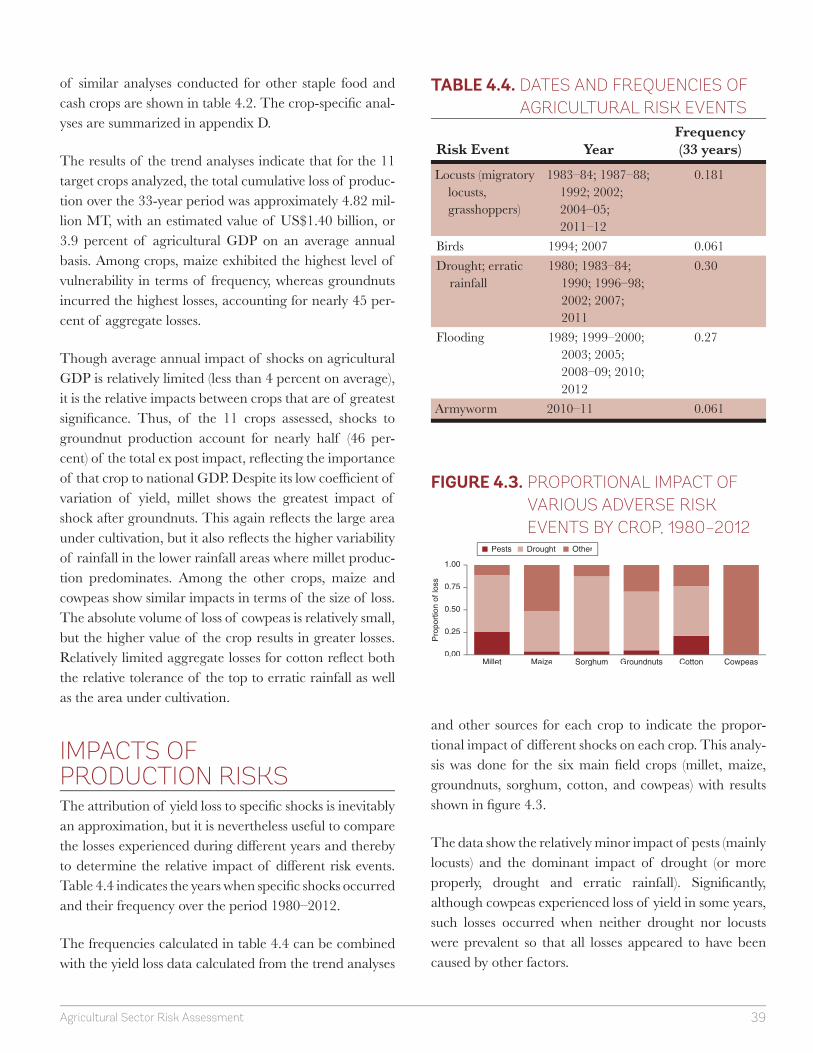
39Agricultural Sector Risk Assessment
of similar analyses conducted for other staple food and cash crops are shown in table 4.2. The crop-specifi c anal-yses are summarized in appendix D.
The results of the trend analyses indicate that for the 11 target crops analyzed, the total cumulative loss of produc-tion over the 33-year period was approximately 4.82 mil-lion MT, with an estimated value of US$1.40 billion, or 3.9 percent of agricultural GDP on an average annual basis. Among crops, maize exhibited the highest level of vulnerability in terms of frequency, whereas groundnuts incurred the highest losses, accounting for nearly 45 per-cent of aggregate losses.
Though average annual impact of shocks on agricultural GDP is relatively limited (less than 4 percent on average), it is the relative impacts between crops that are of greatest signifi cance. Thus, of the 11 crops assessed, shocks to groundnut production account for nearly half (46 per-cent) of the total ex post impact, refl ecting the importance of that crop to national GDP. Despite its low coeffi cient of variation of yield, millet shows the greatest impact of shock after groundnuts. This again refl ects the large area under cultivation, but it also refl ects the higher variability of rainfall in the lower rainfall areas where millet produc-tion predominates. Among the other crops, maize and cowpeas show similar impacts in terms of the size of loss. The absolute volume of loss of cowpeas is relatively small, but the higher value of the crop results in greater losses. Relatively limited aggregate losses for cotton refl ect both the relative tolerance of the top to erratic rainfall as well as the area under cultivation.
IMPACTS OF PRODUCTION RISKSThe attribution of yield loss to specifi c shocks is inevitably an approximation, but it is nevertheless useful to compare the losses experienced during diff erent years and thereby to determine the relative impact of diff erent risk events. Table 4.4 indicates the years when specifi c shocks occurred and their frequency over the period 1980–2012.
The frequencies calculated in table 4.4 can be combined with the yield loss data calculated from the trend analyses
and other sources for each crop to indicate the propor-tional impact of diff erent shocks on each crop. This analy-sis was done for the six main fi eld crops (millet, maize, groundnuts, sorghum, cotton, and cowpeas) with results shown in fi gure 4.3.
The data show the relatively minor impact of pests (mainly locusts) and the dominant impact of drought (or more properly, drought and erratic rainfall). Signifi cantly, although cowpeas experienced loss of yield in some years, such losses occurred when neither drought nor locusts were prevalent so that all losses appeared to have been caused by other factors.
TABLE 4.4. DATES AND FREQUENCIES OF
AGRICULTURAL RISK EVENTS
Risk Event YearFrequency(33 years)
Locusts (migratory locusts, grasshoppers)
1983–84; 1987–88; 1992; 2002; 2004–05; 2011–12
0.181
Birds 1994; 2007 0.061Drought; erratic
rainfall1980; 1983–84;
1990; 1996–98; 2002; 2007; 2011
0.30
Flooding 1989; 1999–2000; 2003; 2005; 2008–09; 2010; 2012
0.27
Armyworm 2010–11 0.061
0.00
0.25
0.50
0.75
1.00
Millet Maize Sorghum Groundnuts Cotton Cowpeas
Pro
port
ion
of lo
ss
Pests Drought Other
FIGURE 4.3. PROPORTIONAL IMPACT OF
VARIOUS ADVERSE RISK
EVENTS BY CROP, 1980–2012
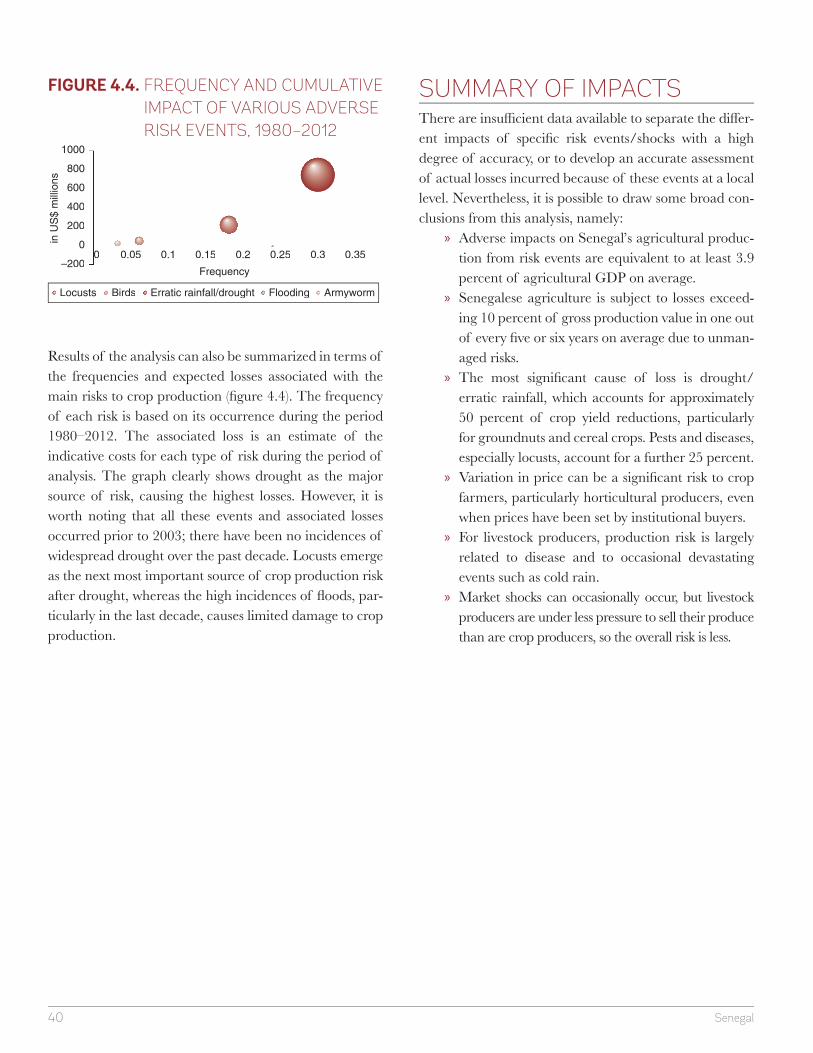
40 Senegal
Results of the analysis can also be summarized in terms of the frequencies and expected losses associated with the main risks to crop production (fi gure 4.4). The frequency of each risk is based on its occurrence during the period 1980–2012. The associated loss is an estimate of the indicative costs for each type of risk during the period of analysis. The graph clearly shows drought as the major source of risk, causing the highest losses. However, it is worth noting that all these events and associated losses occurred prior to 2003; there have been no incidences of widespread drought over the past decade. Locusts emerge as the next most important source of crop production risk after drought, whereas the high incidences of fl oods, par-ticularly in the last decade, causes limited damage to crop production.
SUMMARY OF IMPACTSThere are insuffi cient data available to separate the diff er-ent impacts of specifi c risk events/shocks with a high degree of accuracy, or to develop an accurate assessment of actual losses incurred because of these events at a local level. Nevertheless, it is possible to draw some broad con-clusions from this analysis, namely:
» Adverse impacts on Senegal’s agricultural produc-tion from risk events are equivalent to at least 3.9 percent of agricultural GDP on average.
» Senegalese agriculture is subject to losses exceed-ing 10 percent of gross production value in one out of every fi ve or six years on average due to unman-aged risks.
» The most signifi cant cause of loss is drought/erratic rainfall, which accounts for approximately 50 percent of crop yield reductions, particularly for groundnuts and cereal crops. Pests and diseases, especially locusts, account for a further 25 percent.
» Variation in price can be a signifi cant risk to crop farmers, particularly horticultural producers, even when prices have been set by institutional buyers.
» For livestock producers, production risk is largely related to disease and to occasional devastating events such as cold rain.
» Market shocks can occasionally occur, but livestock producers are under less pressure to sell their produce than are crop producers, so the overall risk is less.
–200
0
200
400
600
800
1000
0 0.05 0.1 0.15 0.2 0.25 0.3 0.35
in U
S$
mill
ions
Frequency
Locusts Birds Erratic rainfall/drought Flooding Armyworm
FIGURE 4.4. FREQUENCY AND CUMULATIVE
IMPACT OF VARIOUS ADVERSE
RISK EVENTS, 1980–2012

41Agricultural Sector Risk Assessment
All stakeholders in agricultural value chains assume some level of risk. Vulnerability presents when the potential impact of risk events is greater than a stakeholder’s capac-ity to absorb adverse impacts. This may be because knowledge of the frequencies or impacts of risk events is inadequate (as a result, for example, of unforeseen changes in climate) or because actions that might otherwise limit the level of risk assumed are constrained by circumstances so that involuntary exposure to risk is increased. (This is especially true where capacity for adaptation lags behind changing circumstances.) A more comprehensive analysis of the factors contributing to vulnerability is presented in appendix C. Its key conclusions and relevance to diff erent types of stakeholders are listed below.
Table 5.1 provides a simple ranking of risks reported by smallholders (Wane and Galandou 2012). The most oft-cited risk, reported by almost 50 percent of households, highlights their perceived vulnerability to food price shocks. This is indicative of high levels of market dependence because of insuffi cient productive capacity together with low levels of off -farm income. It is perhaps notable that the most important vulnerabil-ity is not to a risk inherent to agricultural production but to rural households as con-sumers. Initiatives designed to increase the prices paid for staple crops may well expose households to higher levels of vulnerability if not accompanied by other measures.
The second most oft-cited risk also relates to cash dependence and the limited fi nan-cial resources of producers that constrain their capacity to deal with increases in the costs of inputs. It is again signifi cant that although this shock does aff ect agricultural production, it is mediated through local input markets rather than through a physical event such as drought or disease. The same is true for the fourth most important area of vulnerability, that is, the loss of productive capacity through death, disease, or dis-ability, which altogether aff ect almost 25 percent of households. These shocks may aff ect agricultural production, but the eff ect is not upon the agricultural production system itself.
It is only the third most frequently cited risk event (poor rains), reported by nearly one-quarter (23.8 percent) of households, that has a direct eff ect on agricultural production
CHAPTER FIVE
VULNERABILITY ANALYSIS

42 Senegal
systems. Moreover, although the impacts of most of the subsequently listed shocks, including pests and diseases, theft, fl oods, and fi res, also directly aff ect agricultural pro-duction, three of the four most important areas of vulner-ability lie beyond agriculture and refl ect inadequate household income on the one hand and limited health service capacity on the other.
Nevertheless, table 5.1 shows that rural households are vulnerable to a variety of agricultural shocks. In practice, that vulnerability has been reduced through a variety of practices that limit their exposure to risk. In an agricul-tural context, vulnerability to risk can be considered from the perspective of those practices and the extent to which they can be employed by diff erent types of agricultural supply chain actors.
STAKEHOLDER AND LIVELIHOOD RISK PROFILES This section profi les various types of agricultural stake-holders in terms of some of the key risks they face and their capacity to mitigate such risks and recover from related shocks.
PASTORALISTSIt is widely recognized that the least vulnerable of liveli-hood groups are the nomadic pastoralists, who although living in arid areas have adopted a lifestyle that enables them to mitigate the risk of drought by continually moving to areas of fresh grazing. Studies have shown that as long as the mobility of pastoralists is not con-strained, their vulnerability to weather risks such as drought is low. However, if pastoralist herds are unable to move freely to new grazing areas, their chances of survival are substantially reduced. Ready access to ani-mal protein contributes to a balanced diet, and the characteristic of livestock to maintain value allows them to be used as a source of fi nance that is both mobile and little prone to decay (in marked contrast to the produc-tion of crop farmers).
Nevertheless, the pastoralist livelihood is particularly vul-nerable to four risks: namely, widespread (regional) drought, locust infestations, severe animal disease out-breaks, and constraints upon movement. The frequency of the fi rst three risks is low, though ex post impacts of related shocks can be high. However, growing land pres-sures and other factors are increasingly inhibiting tran-shumance, and with that, the ability of pastoralist
TABLE 5.1. FREQUENCY OF RISK EVENTS AND PERCENTAGE AFFECTED
Type of Shock No. of People Aff ected Share of Total (%)
Rising prices of food 2,878 48.9Increase in the price of inputs/farm equipment 1,891 32.1Poor rains 1,402 23.8Illness/accident of household member 1,221 20.7Decline in the price of products sold by the household 560 9.5Theft of property or animals 533 9.0Animal disease/death of animals 468 7.9Insecurity 455 7.7Animal damage 439 7.5Animal disease/death of animals (cattle) 407 6.9Invasion of pests/granivorous birds 351 6.0Diseases of plants 207 3.5Loss of employment or unemployment 199 3.4Floods 134 2.3Fire/bushfi res 74 1/3Confl icts 72 1.2
Source: Wane and Galandou 2012; Authors’ notes.

43Agricultural Sector Risk Assessment
households to mitigate risk and rebound from shocks when they manifest.
OTHER LIVESTOCK PRODUCERSLivestock are raised by at least three other types of pro-ducers. Agro-pastoralists who are transitioning out of pas-toralism are among the most vulnerable households. Such households generally possess few livestock and occupy lands on the margins of pastoral areas—lands that are inherently low in rainfall. These households are thus exposed to low and variable rainfall, but their sedentary lifestyle denies them the advantages of mobile pastoralism so that capacity for risk avoidance is limited. Few house-holds adopt an agro-pastoralist livelihood by choice. Instead, they are obliged to do so by changing circum-stances, especially reduced access to grazing. As a result, agro-pastoralists tend to be the poorest households, lack-ing the resources needed to absorb the impact of shocks, which further enhances their vulnerability.
Intensive livestock producers are constrained by the avail-ability of land to support their livestock. They are obliged to use supplementary feed to fatten their animals, which are often kept in close confi nement. The extent to which intensive producers are more or less vulnerable to risk than their extensive counterparts is debatable. On the one hand, the purchase of feed allows intensive produc-ers to be largely independent of weather and grazing, whereas the confi nement of livestock can reduce expo-sure to disease. On the other hand, a higher level of man-agement is required to ensure consistent rates of growth and disease outbreaks, when they do occur, can be more debilitating than those experienced under extensive pro-duction. The greater level of investment into intensive livestock production systems also increases the potential vulnerability of producers who have more to lose in the event of a disaster. On balance, it would appear that whereas the impacts of risk events upon intensive live-stock production may be greater than those experienced by extensive producers, most intensive producers have a greater capacity both to prevent such events and to with-stand their impacts and are hence less vulnerable to the impacts of risk events.
Finally there are those smallholders whose main liveli-hood is derived from crops but who raise a small number
of animals either for draft, for home consumption, or for cash. These smallholders make a signifi cant contribution to the national livestock herd, but their vulnerability is related more to their cropping activities. Indeed, for these households, livestock may help to reduce vulnerability because they can be sold as a source of cash in the event of crop failure.
DRY LAND SMALLHOLDER FARMERSThe risk of inadequate moisture renders dry land small-holders more vulnerable to production risk than their irrigated counterparts. This is refl ected in the lower lev-els of inputs applied to dry land crops. Not only does the lower anticipated average yield not justify the same level of investment, but also the increased probability of risk events that could result in little or no return acts as an additional hindrance to investment. From this perspective, the advantage of irrigation is not only that it allows greater yields to be achieved, but also that by enhancing certainty that such yields are attainable, it justifi es a much higher level of investment into the crop. Thus, the impact of irrigation upon average yields is usually much greater than the yield increase that might be ascribed to the better availability of adequate moisture alone.
IRRIGATED SMALLHOLDER FARMERSGenerally, irrigated smallholder producers face far less risk of inadequate moisture than their rain-fed counter-parts. They therefore can be considered to be less vulner-able. This is correct insofar as a given level of production is concerned, but it is not inevitably so. Growers of irri-gated crops are often obliged to adopt a more intensive approach to production to generate the revenues needed to cover the cost of the irrigation systems. Whereas the greatest component of agricultural risk (insuffi cient mois-ture) may be controlled, the level of investment under irri-gation is generally increased so that the overall risk may not be reduced unless all other potential risk factors can also be controlled. This implies the need for a high level of technical competence in pest and disease control and in overall crop management, as well as a greater capacity to manage losses when they do occur. From this perspective, the risk faced by a smallholder is not reduced through the

44 Senegal
introduction of irrigation systems unless that system has low fi xed costs and/or the smallholder possesses the nec-essary agricultural acumen to avoid losses caused by other risk factors such as pests, diseases, mismanagement, and market prices.
COMMERCIAL FARMERSCommercial farmers face the same risks as smallholders, but their levels of vulnerability may diff er according to the type of risk. On the one hand, access to paid labor and machinery can reduce exposure to some risks, whereas higher levels of savings can allow commercial producers to absorb the impacts of risk events. On the other hand, commercial producers face a greater level of market risk than their subsistence counterparts. In general, commer-cial production systems have an increased reliance upon management practices that reduce the risk of loss (includ-ing the use of insecticides and fungicides), but the overall increased intensity of production can increase vulnerabil-ity in the event of an unforeseen loss or a breakdown in crop protection practices.
PROCESSORSProcessors in Senegal include groundnut processors, mill-ers, and cotton ginners. All of these are vulnerable to mar-ket risk because of increased local prices and/or reduced costs of competing imports. Cotton and groundnut pro-cessors are also vulnerable to the risk of afl atoxin con-tamination, which cannot be detected in the unprocessed materials but which can render the fi nal products unsale-able if detected at a later date. Processors also face the risk of inadequate supplies because of either poor production or a redirection of inputs toward food crops for household consumption, especially after a poor harvest. In the case of groundnuts, in cases in which the buying price is prede-termined, processors may also be vulnerable to political expediency that results in a price that is higher than the market can bear.
TRADERSTraders are primarily vulnerable to risks caused by mar-ket uncertainty. In particular, whereas mobile phones allow traders good access to immediate price information, they have poor knowledge of market volumes or of the extent of production. As a result of this vulnerability, few traders are willing to accumulate large positions with the intention of selling at higher prices. The risk that they might not be able to sell their stock owing to declining prices or to the presence of other traders in the same mar-ket limits most traders to short-term back-to-back trades. Similarly, whereas traders might discover a higher price of a commodity in a remote area, they are unlikely to pur-chase and transport large volumes to take advantage of that market because they are uncertain that the potential demand will be great enough to justify the expenditure. As a result, most markets are both temporally and spatially fragmented so that both seasonal fl uctuations and geo-graphic disparities in prices can be signifi cant.
INCOME LEVELSIncome level is a variable characteristic of many liveli-hoods that has a dramatic eff ect upon vulnerability to risk and is therefore worthy of consideration in its own right. Studies have shown that risk is perceived relative to one’s capacity to absorb that risk so that for households of low income, the perception of a given risk is much greater than it is for those of higher income. This is particularly evident for agricultural households of limited resources, who might be obliged to pledge vital assets (such as oxen, donkey carts, or savings) as collateral for a loan to increase food production through intensifi cation. The impact of a low yield that for such a household could result in a failure to repay and consequent loss of assets can be so debilitat-ing that the loans are often refused. This behavior has led to the general observation that smallholder farmers are risk averse. This is not necessarily the case, a more accu-rate observation being that poorer farmers are risk averse.

45Agricultural Sector Risk Assessment
Previous sections have highlighted sources of risks that are pervasive across the Senega-lese agriculture landscape. These risks are both numerous and complex. They manifest with varying levels of frequency and severity, and can cause substantial losses to crops and livestock, with profound short-term and long-term impacts on income and livelihoods. Putting in place eff ective risk management measures can help mitigate adverse impacts on agricultural supply chains and the livelihoods they support. However, it is virtually impossible to address all risks at once. Thus, it is necessary to prioritize interventions based on which risks occur most frequently and which cause the greatest fi nancial losses.
RISK PRIORITIZATIONUsing quantitative measures and anecdotal evidence collected directly from stakehold-ers, this analysis has evaluated risks for the crop and livestock subsectors. Owing to the lack of reliable data, some of the risks could not be quantifi ed. In such cases, the assessment team relied more on qualitative measures. Based on the team’s combined quantitative and qualitative assessment, table 6.1 prioritizes the most important risks. This prioritization was presented during a roundtable at MEF in Dakar on March 21, 2014. It provides a basic ranking of agricultural risks on the basis of the probability of the event occurring and the anticipated impacts in terms of fi nancial losses. The iden-tifi ed risks located in the grayer areas represent the most signifi cant risks.
Overall, this prioritization identifi ed (1) erratic rainfall, punctuated by drought; (2) locusts; (3) price volatility; and (4) crop pest and diseases as the most important risks facing Senegal’s agricultural sector. Parasitic weeds such as Striga, afl atoxin contami-nation (maize, groundnuts) and other postharvest threats, and livestock diseases were also deemed important, but to a lesser extent.
It is worth noting that incidences of drought have declined signifi cantly within the most recent decade, but it remains unclear whether this change is temporary or rather the result of a shift in long-term weather patterns. Although an observed wetting over roughly the same period has led to recurrent fl ooding in many parts of the country, aff ecting urban and coastal areas, impacts on crop and livestock production have been limited at the aggregate level.
CHAPTER SIX
RISK PRIORITIZATION AND MANAGEMENT

46 Senegal
This prioritization exercise is based upon the direct impacts of risk events. The indirect ex ante impacts are less easily quantifi ed, but can for the most part be consid-ered proportional to the ex post loss of profi tability. Thus, from the perspective of prioritization, an analysis of ex ante responses to risk is unnecessary.
AGRICULTURAL RISK MANAGEMENTThe various risk events that give rise to both ex post losses and reduced ex ante investment can be addressed at three levels, according to impact and frequency as shown in fi gure 6.1.
Risk mitigation—Responding to risk events of high fre-quency and low impact, the adoption of techniques or behaviors that reduce the impact of the event on produc-tion or profi tability. Risk mitigation would include the
The above assignment of risk priorities is in part based upon the responses of stakeholders collected through interviews over the course of the assessment. From that exercise, it is possible to list the priority risks faced by each subsector (table 6.2). It is notable that only cash crop pro-ducers highlighted severe drought as the most important risk they faced.
The listing of priority risks clearly shows the major impor-tance of erratic rainfall as the main risk and of drought as a more extreme but less frequent expression of the same phenomenon. After this, the other priorities vary among crops and it is hard to identify a consistent theme. How-ever, the reporting of locusts as a primary, secondary, and tertiary threat would make this phenomenon the second aggregate priority for the agricultural sector. Beyond this point, aggregation of crop-specifi c risk loses meaning and the next level of priority could well be accorded to price volatility, pests, and diseases, and perceived inconsisten-cies in policy implementation in equal measure.
TABLE 6.1. RISK PRIORITIZATION MATRIX
Negligible Moderate Considerable Critical Catastrophic
Highly probable Tifa (R-I) Perceived
inconsistency of policy (L)
Pests and diseases Striga (M,S) Price volatility (dom
crops.) Newcastle (L)
Probable Birds (M, S) Bushfi res (L)
Pests and Diseases (P, T, C, Ma)
Erratic access to quality medicines/vaccines (L)
Erratic access to quality inputs and services (M, S, G, Ct)
Dom/Int’l price variability (R, Mz)
Birds (R-I) Afl atoxin (Mz, G)
Erratic rainfall (S, M, R-R, Mz,C, G)
Locusts Price Volatility (T, O,
G, C) Pest/disease (R)
Occasional Termites (All crops)Theft (M, R-R, MZ, L) Absence of regional
standards (R-I) Contract default/
counterparty risk (All crops)
Fires (M)
Windstorms (M, S, R-R)
Temperature variability (R-I)
Floods (All crops) Regional confl ict Release of Food
stocks (R-I, R-R)
Price volatility for poultry feed
Localized Drought
Cold season rains (L)
Severe drought
Rare
Source: World Bank.Key: Sorghum, Millet, Rice–Irrigated, Rice–Rain-fed, Maize, Tomato, Potato, Mango, Cowpeas, Groundnuts, Cotton, Livestock, Onion.

47Agricultural Sector Risk Assessment
Severity
Layer 3
Layer 2
Layer 1High frequency,
low lossesRisk mitigation
Low frequency,medium lossesRisk mitigation
+ Risk transfer
Very low frequency,very high lossesRisk mitigation
+ Risk transfer+ Risk coping
Pro
babi
lity
FIGURE 6.1. INTEGRATED RISK-LAYERING
SOLUTIONS
Source: World Bank.
impact of risk, but to absorb it. For example, food-insecure households can be provided with food aid or cash, whereas others that may have taken out loans can in the event of dis-aster be aff orded debt relief or debt restructuring. Coping strategies may be applied on an ex ante or ex post basis.
Potential responses to key risks are recommended on the basis of the above-referenced risk-layering approach.
Table 6.3 lists the proposed risk management mechanisms that are appropriate to the most signifi cant risk events as defi ned by the combined impact of their frequency and extent of losses incurred. The majority of these are aimed at risk mitigation, although some coping strategies may also be required. The main risk transfer mechanism rec-ommended is insurance, which not only can transfer risk impacts, but also can be used in conjunction with the cop-ing strategy of debt relief. Moreover, it is appropriate that the recent introduction of parametric crop insurance in Senegal is closely linked to the provision of credit. A vari-ety of coping strategies could also be leveraged. Many of these rely upon social protection mechanisms that may not be fully in place and will require development assistance to implement rapidly. It is notable however that almost all of the population of Senegal is dependent upon access to markets for some part of their food security so that rapidly implementable market-based solutions can be put in place
TABLE 6.2. LISTING OF PRIORITY RISKS BY COMMODITY
Commodity
Risk
Priority #1 Priority #2 Priority #3
Sorghum Erratic rainfall Locusts Timely access to quality inputsMillet Erratic rainfall Pests, diseases, and Striga Timely access to quality inputsRice (Irrigated) Bird damage Price volatility Water weed (Tifa)Rice (Rain fed) Erratic rainfall Price volatility WindstormsTomatoes Price volatility Inconsistent policy Diseases and pestsPotatoes Price volatility Locusts Disease/quality of inputsBeans Locusts Diseases Access to inputsMango Drought Locusts Price volatilityCowpeas Erratic rainfall Drought LocustsGroundnuts Drought Logistics breakdown DiseaseCotton Drought Logistics breakdown LocustsLivestock Erratic rainfall Inconsistent policy Poor policy implementationAggregate for Sector Erratic rainfall/drought Locusts
Source: World Bank
development of irrigation systems to reduce the impact of drought, or the breeding and distribution of disease or drought-resistant crop varieties or animal breeds.
Risk transfer—Risk events of low frequency and medium impact can benefi t from both risk mitigation and risk transfer, that is, the transferring of risk to third parties, either through insurance or through other fi nancial mech-anisms such as hedging (against currency risk) or the pur-chase or sale of futures contracts and/or options.
Coping Strategies—Risk of very low frequency and very high losses, strategies that are designed not to reduce or transfer the

48 Senegal
TABLE 6.3. PROPOSED RISK MANAGEMENT MECHANISMS
Mitigation Transfer Coping
Drought Promoting development of small-, medium-, and large-scale irrigation; water harvesting
Macro-level crop insurance
Use of weather index to trigger early warning and response
Establishing and improving regional and national NDVI and early warning systems (EWS) linked to an eff ective and early emergency response system.
Farm-level crop and livestock insurance
Facilitating temporary migration and transhumance
Improve or establish suffi cient livestock related infrastructure: borehole, fodder reserves, roads, sale yards, abattoirs.
Contingent fi nancing and other instruments to support coping measures
Improve livestock feed and forage supply through either local provision or through subsidies, vouchers, and so on and developing community-level food and fodder/forage (that is, livestock) banks
Promoting development of social safety net programs (for example, food aid, Food-for-Work, Cash-for-Work)
Commercial destocking Livestock supplementary feed programsDebt restructuring/relief
Erratic rainfall All the above drought mitigation measures, plus improved access to weather forecasts to inform and advise farmers on adequate time for cropping operations
Farm-level crop and livestock insurance
Promoting household/community savings
Promotion of reforestation Improved access to fi nance and micro-fi nance.
Promotion of conservation farming technique Debt restructuring/reliefImproved access to drought tolerant and short
season crops and varieties.Facilitating temporary migration and
transhumanceLocusts Strengthening early outbreak detection/
response systems Crop
InsuranceContingent fi nancing and other
instruments to support coping measuresPromoting development of social safety
net programs (for example, food aid, Food-for-Work, CFW)
Debt restructuring/reliefPrice volatility Adoption of mixed farming and crop rotation Hedging of
currenciesSocial safety net programs
(for example, food aid, Food-for-Work)Promote the development of private sector
aggregation points, warehouse capacity and cold storage facilities as well as the development of warehouse receipt and inventory credit systems
Use of commodity futures and options markets
Direct cash payments to aff ected households
Enhanced domestic market capacity, including strengthening of market linkages and improved access to fi nance
Promoting household savings
Access to credit during commercialization to avoid any sale
Substitutions and/or reductions in household diet
Spreading production over time using appropriated varieties
Market regulation (import ban)Improving harvesting quality and processing
for longer conservation

49Agricultural Sector Risk Assessment
TABLE 6.3. PROPOSED RISK MANAGEMENT MECHANISMS
Mitigation Transfer Coping
Pests/diseases (crops)
Strengthening early outbreak detection/response systems
Crop insurance (yield-based)
Developing social protection programs
Promoting crop rotation and transition to more pest/disease resistant crops
Use of savings and borrowing
Promoting IPM techniques Direct compensation to aff ected farmersDiversifying seeds varietals within crops Debt restructuring/reliefStrengthening of P/D-tolerant seed
development and distribution systemsImproving farmer access to agrochemicals
Pests/diseases (livestock)
Biosecurity including active surveillance, vaccination and quarantine
Livestock insurance
Emergency vaccination and treatment programs
Improved application of existing veterinary standards, laws and policies.
Direct subsidies, vouchers
Training and capacity building of privatized and decentralized animal health services including vet vouchers
Quarantine
LEGSa programming in planning LEGS programming in responsesInconsistent
livestock sector policy formulation and implementation
Promote the development of business associations and advocacy groups to enable stakeholder and private sector participation in agricultural policy formulation
Disengagement of government from market intervention
Diversifi cation of agricultural entreprisesIncreased vertical integration within value
chains More transparent policy and better
enforcement of existing policies and lawsBroader community involvement in land use
plans to ensure access (forage, water)
Establish clear emergency animal health response and declaration of emergencies
Capacity building, training
Enforcement of rules and regulationsLinking emergency response to modern
development policies.
Source: World Bank.a The Livestock Emergency Guidelines and Standards (LEGS) provide a set of international guidelines and standards for the design, implementation, and assessment of livestock interventions to assist people aff ected by humanitarian crises. Established in 2005, the LEGS Project is overseen by a Steering Group of individuals from the AU, FAO, the International Committee of the Red Cross, the Feinstein International Center at Tufts University, the World Society for the Protection of Animals, and Vetwork UK.
(Continued)
in the event of an unforeseen shortage in domestic produc-tion. Similarly, cash-based debt relief and restructuring initiatives can relieve the burden of risk events on house-holds that have borrowed to invest in production.
RISK MANAGEMENT SOLUTIONSThe following discusses some of the broad intervention areas that the government could consider in responding to risks prioritized by this assessment.
IMPROVED WATER AND SOIL MANAGEMENTThere is one intervention that can truly mitigate the impact of drought, namely, total or supplementary irrigation, according to the circumstances. The introduction of irriga-tion to those areas where it is economically feasible and revi-talization and maintenance of existing infrastructure should be viewed as a major priority, although earlier studies have suggested that the economics of irrigated production systems should be carefully scrutinized before development proceeds (Franzel 1979). In particular, irrigation per se is of

50 Senegal
limited value if it is not accompanied by an increased inten-sity of production that allows the fi xed costs of irrigation systems (especially their maintenance and management) to be met fully. This requires access to improved inputs, espe-cially pesticides and fungicides, and the technical compe-tence to ensure optimal yields at a much higher level of production than before.
From this perspective, the construction of a new irrigation scheme is less critical than the development (in the case of communal small-scale irrigation) of an eff ective water users’ association and irrigation management structure, as well as ensuring both the supply of improved inputs and providing the necessary training to growers. Finally, not only must growers be able to access inputs and produce, but they should be able to market their increased produc-tion without diffi culty as well. The new public-private partnership (PPP) program for staple crop-processing zones being undertaken by the Nigerian government is an example of such integrated market-led development.
From a policy perspective, the high priority of drought as a risk facing both crop and livestock producers requires con-scious decisions to be made to achieve the best use of a limited resource (the irrigable land beside perennial rivers). On the one hand, it can be rendered extremely productive for crop production, albeit at considerable cost, whereas on the other, it can be critical to the survival of many pastoral-ists. It is diffi cult to reconcile these two priorities, but it is important to develop a land use strategy for such areas that will allow both crop and livestock producers to benefi t from the limited resource. Unless such a strategy can be not only developed, but also agreed and adhered to by all stakehold-ers, there is a further risk of confl ict and suff ering.
The impacts of erratic rainfall can be mitigated not only by irrigation, but also by the small-scale adoption of water conservation practices. Nevertheless, it is the broad-scale adoption of two interventions that have the potential for the greatest impact, namely, conservation agriculture (CA) and the development of crop varieties bred for reduced drought susceptibility or drought avoidance. CA, or con-servation farming, as practiced elsewhere in Zambia and Zimbabwe, has been shown to increase yields by (1) increas-ing soil water infi ltration rates, and hence reducing runoff ; (2) increasing root development so that each plant can
extract nutrients from a larger volume of soil; and (2) pro-moting timely planting so that the crop can take maximum advantage of rains without becoming susceptible to mois-ture stress. The CA system can substantially improve a soil’s capacity to absorb water and a crop’s ability to extract it resulting in yield increases of 50 percent and more within the fi rst year of implementation. It is also well suited for use in fragile soils that might otherwise be subject to erosion and degradation, since it minimizes cultivation so that soils are not left exposed to wind or rain erosion.
Almost all new technical interventions require the small-holder to apply additional inputs or labor and increase the cost of production and the risk associated with it. CA does neither. It allows for reduced labor and requires no increase in inputs (USAID 2013). From this perspective alone, it reduces risk to the smallholder, but the benefi ts of the technique are such that the risk associated with erratic rainfall is also substantially reduced. It is for these reasons that CF has achieved high rates (>90 percent) of sustain-able adoption by smallholders (Kabamba & Muimba-Kankolongo 2009). GOS together with USAID have been promoting the establishment of CA since 2009. It is recommended that this initiative should receive greater support including the training of agricultural extension workers in CA and the promotion of its use among all smallholders that lack access to irrigation.
To maximize limited resources, farmers need good and timely information. For example, enhancing farmer access to weather forecasting information coupled with technical advice can greatly aid farmers in making better decisions, such as the most opportune time to plant. Similarly, as weather becomes more unpredictable, technical advice with regard to crop and variety selection can be custom-ized based on anticipated rainfall patterns and amounts, helping farmers mitigate impacts.
STRENGTHENING SEED DEVELOPMENT AND DISTRIBUTION SYSTEMSDemand for and use of improved seed varieties remains limited in Senegal. Enhancing farmer access to improved planting materials can greatly strengthen their ability to manage production risks. GOS and donors have invested substantial resources over the years in variety development, and seed multiplication and distribution projects. As a
51Agricultural Sector Risk Assessment
result, seven seed production and processing centers and nine seed laboratories have been established across the country. Since 1989, the Senegalese government has grad-ually shifted to a private mode of seed multiplication and distribution. Today, groundnut seed is produced and dis-tributed by a combination of parastatal and private entities, whereas millet seed is multiplied and distributed exclusively by individual farmers and farmers’ groups or associations. Under the West Africa Agricultural Productivity Program (WAAPP), approximately 12,000 tons of certifi ed seeds were produced over the past year, 2,000 tons of which were distributed to farmers in August 2014 when the rains failed.
ISRA has developed a number of improved seed varieties covering the country’s main crops (that is, millet, ground-nuts, rice, cowpeas, sorghum), including seven new varieties of millet and sorghum, which are either less susceptible to moisture stress or mature in a shorter period of time, reduc-ing the probability that moisture stress could aff ect growth. Thirteen groundnut varieties have been introduced. Never-theless, their availability among smallholders remains lim-ited and adoption rates across many crops remains limited. Numerous instances of poor-quality or mislabeled seed were reported to the study team and it is evident that the seed multiplication and distribution system does not enjoy the full confi dence of producers. In addition, lack of infor-mation and poor farmer access to certifi ed seeds further constrain uptake. As a result, many smallholders use home-saved seed and do not benefi t from ISRA research.
There is a clear need to improve the seed multiplication and distribution system with particular regard to the testing of seed to meet minimum germination and purity stand-ards. The current system is not meeting the needs of farm-ers who noted that as a result, the purchase of seed has become in itself a risk for farmers. Support for increased testing capacity and stronger enforcement of the regula-tions regarding seed standards will encourage broader adoption of improved varieties by smallholders and help reduce farmer vulnerability to erratic rainfall and drought.
FASTER, MORE TARGETED LOCUST CONTROLThe impact of locust swarms can be visited upon all forms of agriculture, including fi eld and horticultural crops as well as livestock. Risk management lies beyond the scope
of the individual farmer who is obliged to rely upon national and international institutions to control this peri-odic pest. Nevertheless, it is a regrettable fact that out-breaks of locusts continue to occur and that a signifi cant proportion of these remain—for diverse reasons—uncon-trolled at an early stage (Lecoq 2010). The cost of control measures increases substantially as a locust swarm devel-ops and it is therefore in the interest of all parties that initial identifi cation and response should both be as rapid as possible. Continued support to the national locust con-trol center in strengthening outbreak identifi cation and response systems is essential, and programs such as the Italian Institute of Biometeorology’s (IBIMET) collabora-tion with FAO/EMPRES to provide a meteorological information service to assist in the prediction of outbreaks will in the long term provide greater benefi t than the (nec-essary) emergency responses that still remain typical of many donor interventions.
As a frontline country for locust control in Sahel West Africa, Senegal has already established autonomous national locust control units (CNLA) responsible for all desert locus control activities. With support from neigh-boring countries and from the African Development Bank, USAID, the World Bank, France, and FAO, GOS has equipped CNLAs to both prevent and respond to SGR outbreaks by building needed infrastructure and training technical staff . Such eff orts merit additional support.
Over the past 10 years it has been recognized that the probability of locust swarms developing and their initial development can both be controlled through the use of pheromones and mycopesticides. There is also stronger recognition that locust control is not simply a matter of observation and reaction, but can be achieved through proactive IPM. This will require government support for the registration and production of biopesticides, as well as training in their eff ective use. The aim of a locust IPM is to manage locust populations so that uncontrolled out-breaks no longer occur. This requires continuous inter-vention, but may well be less costly in terms of control measures and will certainly be both more environmentally friendly, and more eff ective in terms of reduced impacts, than the more reactive responses that characterized the last locust invasions in Senegal.

52 Senegal
UPGRADE CROP AND LIVESTOCK SERVICESBoth crop and livestock producers are faced with the risk of losses caused by pests and diseases. These are suffi -ciently frequent for them to be considered more as con-straints than as risks were it not for the fact that they can be avoided. In practice, outbreaks of livestock and crop diseases are widespread and common, due in the case of livestock to inadequate institutional disease control sys-tems (veterinary services, vaccination programs, and con-trols over animal movement) and in the case of crops to the slow rate of dissemination of disease-resistant varie-ties and to the high cost and limited availability of imported agrochemicals. Among both crop and livestock producers there is limited knowledge of disease control procedures as well as limited capacity to identify and react to insect pests in a timely fashion.
Although public spending on the agricultural and live-stock sectors exceeds 10 percent of the national budget, the current impact of agricultural extension and veteri-nary services does not refl ect this expenditure. Instead, producers face a level of risk from pests and diseases that could be signifi cantly reduced through improved agricul-tural extension and veterinary services. Improper animal disease control, in particular, has a substantial impact on production and productivity and public health and contributes to increased pandemic risks.
Mitigation of disease risks is largely through raising awareness, good public hygiene, eff ective quarantines and vaccination programs, promoting good agricultural prac-tices, and capacity building at the farmer level. In the case of poultry, the intensive or industrial production system also mitigates risk through good biosecurity and hygiene. The Senegalese government’s decision to ban poultry imports in 2005 following the avian infl uenza outbreak, although supporting the growth of its domestic poultry industry, has remained the country’s principal mitigation strategy against the disease.
The privatization of veterinary services has taken place without fully understanding the economic viability of such an approach. This has led to very low levels of cover-age in the extensive livestock system, creating not only a
higher likelihood of disease outbreak but also a signifi cantly greater risk of higher losses when outbreaks occur. Such low coverage levels means that diseases will not be eradi-cated and, indeed, in recent years Senegal has seen a resurgence of CBPP, which once had been eradicated within Senegal’s borders.
Improved service delivery could be achieved in a num-ber of ways, including the use of PPPs and/or of para- veterinarians, but in all cases it will be critical that government should provide a level of oversight that can ensure performance. Currently, this is not the case. The study heard that those tasked with providing services frequently fail to do so, but continue to receive remu-neration, suggesting that the strengthening of agricul-tural and livestock extension management systems could signifi cantly enhance performance and reduce risks to stakeholders.
IMPROVED MARKET EFFICIENCY A key area of uncertainty is that of price, which varies substantially both within and between seasons. Those institutions (such as the groundnut processors and SOD-EFITEX) that buy on the local market and sell interna-tionally could reduce price risk through the use of mechanisms such as hedging, futures contracts, and the purchase of options. The greater risk, however, is to the smallholders and livestock producers as well as traders who sell and buy on the domestic market in which no such mechanisms exist. The uncertainties of the market reduce the extent to which traders in particular are will-ing to take a position and thereby limit selling opportuni-ties for producers as well as contributing to increased market fl uctuations. Such uncertainties could be reduced through enhanced market regulation, including stronger enforcement of existing performance requirements, more rapid dispute resolution, and strong adherence to competition law.
There are a number of mechanisms that can enhance market effi ciency, including the development of warehouse receipt systems and improved dissemination of produc-tion information (price information travels freely and rap-idly through the mobile phone network). In the livestock sector, support for commercial destocking exercises

53Agricultural Sector Risk Assessment
through the development of market linkages has proved eff ective in stabilizing prices, although such exercises must be carefully managed to avoid market disruption. Overall, however, it is the general performance of the market as a result of its inadequate regulation that is the key cause of uncertainty. Regional, departmental, and arrondissement authorities all have a role to play in eff ective market regu-lation, and strengthening at all levels will help to enhance market performance and reduce price and other market risks facing stakeholders.
Additionally, there is a need to strengthen existing value chains within the livestock sector. This requires increased commercialization and market orientation as well as capacity building at all levels, including support for improved market access and strengthening of market information systems.
IMPROVING THE ENABLING ENVIRONMENTThis study noted the perception of uncertainty among stakeholders in terms of policy and/or policy implemen-tation. Although the cause could not be accurately deter-mined, the existence of the uncertainty was quite evident. Stronger stakeholder participation in the development and implementation of market interventions and of other legislation and regulations aff ecting the agricultural sector would help to reduce this uncertainty. It is recommended that greater support be given to the development of pro-ducer and marketing associations and advocacy groups. Although such institutions are indeed involved in the negotiation of groundnut prices, there is a wider role to be played in determining the nature, extent, and timing of other interventions. This will help to develop a stronger partnership between private sector stakeholders and gov-ernment so that the perception of inconsistency in policy can be eff ectively reduced.
For the livestock sector, in particular, policy initiatives in the past and uncertainty over current GOS policy as well as perceived weakness in the capacity of govern-ment to implement regulations continue to have adverse impacts on livestock husbandry. Policies that led to changes in land use in the 1960s and 1970s alienated key grazing areas from livestock owners who tradition-
ally had user rights to the land. Land zoning in the Sen-egal River Valley is supposed to protect such loss of land. However, recently, further use of grazing land for cropland expansion purposes can be observed. If live-stock owners and other stakeholders are all fully involved in the process, such changes may not necessarily consti-tute risk, but there are many examples in which only elites or community representatives are involved in plan-ning and decision making, leaving the vast majority out of the process.
Knowing that farming and livestock keeping in non-equilibrium Sahelian environments entail high risk, to create an enabling environment there must be policies and structures that build resilience, include early warn-ing and early response, and can link and integrate long-term development approaches and actors to short-term emergency responses.
SOCIAL SAFETY NET PROGRAMS Social protection programs can be an integral part of eff ective agricultural risk management. They often focus on speeding up postshock recovery but can also aid in supporting mitigation strategies. Such programs can take many forms, and can be especially transformative when resources are channeled into strengthening ex ante resiliency. They can include Food-for-Work pro-grams that provide relief while facilitating the recovery of aff ected communities and enhancing their future resiliency. They can include programs that promote household savings to direct ex post cash payments and food aid delivery to aff ected communities. The World Food Programme’s Food for Assets programs (2005–10) supported 37,000–209,000 benefi ciaries a year in 14 departments and seven regions via food security analysis and community-level targeting. Participants received a combination of food and other incentives, such as train-ing and seedlings, for asset construction during the lean season (WFP 2014). Other social safety net initiatives can include construction of community-level food and fodder banks that can greatly enhance access to food and livestock feed in times of emergency while speeding up food distribution and relief eff orts. GOS is currently developing a social safety net system as part of a national social protection framework, and a National Cash

54 Senegal
Transfer Program (PNBSF) targeting poor and vulnera-ble households.
DEVELOPING INSURANCE MARKETSThe government of Senegal has long recognized the importance of agriculture insurance to protect rural households from disasters. In 2008, it created the Com-pagnie Nationale d’Assurances Agricole du Sénégal (CNAAS) as a PPP together with the country’s insurance industry. Today, CNAAS off ers a wide range of products to farmers and herders, but will need substantial growth and product evolution to have a signifi cant impact in addressing smallholder vulnerability and protecting their assets. Ongoing government support such as premium subsidies (GOS contributes 50 percent of the premium) and tax exemptions are powerful stimulants but leave room for further strengthening.
The experience of CNAAS in serving smallholders has benefi ted from a number of private sector pilot projects centering on index insurance, supported by the World Food Programme, World Bank Group, USAID, and other donors. They provide important proof of concept for inno-vative approaches to agriculture insurance, but cannot aspire to reach substantial numbers of farmers or herders in the absence of a more coordinated and strategic approach.
Public-private partnerships allow the private sector to pro-vide services that a government might wish to off er, but in which it lacks the necessary expertise to undertake effi -ciently. Agricultural insurance is well suited to be under-taken by a PPP, which can maintain commercial objectivity while allowing for subsidization as necessary. If well implemented, such a program could help support, when implemented in complementarity with other risk management measures, substantial increases in produc-tivity. The challenge is to provide coverage to smallholders across wide areas without incurring excessive costs of administration. Parametric insurance programs are designed to achieve this, but require a level of geographic resolution commensurate with local variations in soil type and climate if the system is to be eff ective. This may become increasingly possible as costs of technology decrease, but benefi ciary responses suggest that the pro-cess remains in development.
PRIORITIZATION OF RISK MANAGEMENT MEASURESMost all of the measures outlined above are complemen-tary in nature and have potential to contribute to improve agricultural risk management systems in Senegal in the short, medium, and long term. However, decision mak-ers in often resource-constrained environments are com-pelled to fi nd the quickest, cheapest, and most eff ective measures among myriad policy options. Ideally, a detailed, objective, and exhaustive cost-benefi t analysis will help in selecting the most appropriate intervention options. But conducting a cost-benefi t analysis of so many diff erent options can often be a costly and time-consuming process.
The use of decision fi lters is an alternative approach to evalu-ate and prioritize among a lengthy list of potential interven-tions. This can aid decision makers in making appropriate resource allocation decisions more expediently and more cost eff ectively. The following decision fi lters were developed and used by the World Bank team. The study team applied these fi lters to facilitate a rapid assessment to obtain fi rst order of approximation, based on its assessment of the situa-tion in the fi eld. Whatever the fi ltering process and criteria adopted to evaluate decision options, it is important to ensure their clarity and consistency.
Table 6.4 describes the basic fi ltering criteria the assess-ment team used to rate each intervention, based on a scale of 1 to 5 (1—No; 2—marginally; 3—somewhat; 4—yes; 5—absolutely).
GOS has a long track record of investing in risk reduc-tion. In recent years, Senegal has adopted a broad array of measures toward increasing capacity around Disaster Risk Reduction (DRR). Such measures include the crea-tion of the Directorate of Civil Protection (DPC), the development of a National Platform for DRR, and the elaboration of a National Action Plan on DRR (2010–15). Senegal also participates in the recently launched, EU-led Global Alliance for Resilience Initiative (AGIR), a regional response to chronic food and nutritional insecu-rity across the Sahel and is a member of the Comité Per-manent Inter-Etats de Lutte contre la Sécheresse dans le Sahel (CILSS). These and other initiatives are primarily

55Agricultural Sector Risk Assessment
focused on emergency rescue and response support to victims of disasters, rather than actual prevention, prepar-edness, and mitigation measures.
In 2006, Senegal fi nalized its National Adaptation Pro-gramme of Action (NAPA) for climate change adap-tion. Under its NAPA, Senegal identifi ed saltwater intrusion, coastal zone inundation, drought, storm surges, and extreme temperatures as urgent climate-related hazards that called for immediate action. In looking at areas of vulnerability and possible adapta-tion options, Senegal’s NAPA focused on the water resources sector, the agriculture sector, and coastal zones. In line with these principal hazards and areas of concern, Senegal’s NAPA prioritizes adaption projects related to the development of agro-forestry, programs to promote the rational use of water, protection of the coastline, and programs to raise awareness and educate the public on related issues.
Other initiatives are not new and have been adapted over the years to meet the shifting risk landscape. For example, to help pastoralists cope through drought periods, the GOS’s Opération Suvegarde du Bétail (OSB) protects the most sensitive categories of livestock species (for example, lactating females, calves, and animal traction animals) by distributing subsidized animal feed during emergencies to vulnerable areas. In March 2012, the GOS bought over CFA 3.5 billion of animal feed from national industrial mills and distributed it at a 50 percent subsidy, thereby encouraging the establishment of community-managed
“animal feed” banks. Launched in July 2008, the Fonds d’Appui à la Stabulation (FONSTAB) contributes to the modernization and intensifi cation of animal production by promoting infrastructural and process upgrade invest-ments. These include the acquisition of equipment for the production, processing, packaging, and marketing of ani-mal products; the provision of fodder crops; and the installation of artisanal, semi-industrial, and industrial units for the modernization and intensifi cation of live-stock production. Launched in February 2014, GOS’s newest initiative, the National Agro-sylvo-pastoral Devel-opment Fund (FNDASP), aims to promote broader dis-semination of technological innovations through value chain approaches, producer training, institutional sup-port, and funding for research programs.
These and other GOS and donor initiatives are already helping to address vulnerabilities and strengthen the resil-iency of the agricultural sector. And yet, as highlighted by this report, agricultural supply chains in Senegal remain highly vulnerable to a wide range of risks that jeopardize rural livelihoods. The current study highlights the need for a more targeted and systematic approach to agricul-tural risk management in Senegal.
Based on an analysis of key agricultural risks, an evalua-tion of levels of vulnerability among various stakeholders, and the fi ltering of potential risk management measures, this assessment makes the following recommendations for GOS’s consideration. The proposed focus areas of inter-vention encompass a broad range of interrelated
TABLE 6.4. FILTERING CRITERIA FOR RISK MANAGEMENT SOLUTIONS
Criteria Description
Applicability to current agricultural policy/programming or business objectives
Public sector: Is the proposed solution in line with current/existing agricultural policy/programs/priorities and so on?
Private sector: Is the proposed solution in line with current/existing business objectives, and so on?
Feasibility of implementation Is the proposed solution “easy” to implement in the short to medium term?
Aff ordability of implementation Is the proposed solution aff ordable to put into action/implement?
Scalability of implementation Is the proposed solution easy to scale up/make available to an increased number of benefi ciaries?
Long-term sustainability Is the proposed solution sustainable in the long term?
Source: World Bank.

56 Senegal
investments, which together hold strong scope strengthen agricultural risk management systems and improve agri-cultural resilience in Senegal.
1. Strengthening extension delivery systems (for example, face-to-face, farmer-driven, ICT-based) for improved farmer access to technology and agronomic advice on improved soil, water, and pest management practices (for example, Conser-vation Agriculture, IPM).
2. Promoting improved water management mea-sures (for example, water pans, roof and rock catchment systems, subsurface dams) and micro-irrigation technology (for example, drip irrigation) via community-led initiatives (for example, cash/Food-for-Work programs).
3. To further reduce rainfall dependency and better exploit existing water and land resources, promot-ing expansion of irrigation infrastructure.
4. Promoting use of contour erosion and fi re barriers, cisterns for storing rainfall and runoff water, con-trolled/rotational grazing, grazing banks, homestead enclosures, residue/forage conservation, and other Sustainable Land Management (SLM) practices to reverse degradation of water, soil, and vegetation cover ensure sustainable access to grazing land.
5. Establishing and improving regional and national NDVI and early warning systems and farmer training linked to an eff ective and early emergency response system for drought and locust outbreaks.
6. To improve decision making among farmers and pastoralists and attenuate price volatility, strength-ening the quality and access to needed agricultural information, including weather forecasting, exten-sion advice and innovations (that is, seeds, water management), input/output prices, and so on for improved decision making.
7. Strengthening seed distribution systems, vaccina-tion programs, and animal health services through improved monitoring and enforcement of existing quality control regulations governing product and service delivery, institutional capacity building, reform measures, and so on.
8. Building resiliency in northern pastoralist zones via more broadly inclusive policy making based on land administration for improved mobility and
access, and development of community-driven feed/fodder production and storage centers.
CONCLUSIONThis Phase I assessment assesses agricultural risks and impacts during the period 1980–2012. By documenting and analyzing how Senegal’s agricultural economy has been aff ected in the past by risk events, the study has gen-erated insight into which sources of risks are most likely to aff ect the sector and dependent livelihoods in the future. By prioritizing risks, the study can help GOS focus atten-tion and resources on a smaller set of key risks that are having the most adverse impacts on production yields, incomes, and livelihoods. The study suggests a framework for the development of a more comprehensive, integrated risk management strategy to strengthen existing mitiga-tion, transfer, and coping measures in Senegal. Finally, it provides a fi ltering mechanism to aid in the selection of a set of strategic interventions for improved agricultural risk management.
The assessment recognizes that many of the proposed strategies may already be covered to varying degrees under existing risk management programs. Others may currently be in the process of implementation, either by government agencies or by donors. Moving forward, the Phase II Solu-tions Assessment will analyze the eff ectiveness of existing programs, identify and assess challenges impeding their eff ectiveness, and outline strategies for scaling up eff ective interventions to reach a larger number of benefi ciaries. This follow-up activity will place strong emphasis on ensuring a more coordinated, integrated approach to risk management in Senegal to ensure more eff ective and meaningful risk reduction and resilience building across the sector.
It is hoped that the fi ndings and conclusions of this assess-ment will help to contribute to the existing knowledge base regarding the agricultural risk landscape in Senegal. It is also hoped that the study will help to inform a dia-logue moving forward between the GOS, the World Bank, and GOS’s other development partners that will lead to concrete interventions toward improved agricultural risk management and stronger resilience among stakeholders in the years ahead.

57Agricultural Sector Risk Assessment
Ahmed, M. M., J. H. Sanders, and W. T. Nell. 2000. “New Sorghum and Millet Cultivar Introduction in Sub-Saharan Africa: Impacts and Research Agenda.” Agricultural Systems 64: 55–65.
Ainsworth, E., and J. M. McGrath. 2010. “Direct Effects of Rising Atmospheric Carbon Dioxide and Ozone of Crop Yields.” Global Change Research, 37, 109–130. DOI: 10.1007/978-90-481-2953-9_7.
ANACIM (National Agency for Civil Aviation and Meteorology of Senegal), WFP (World Food Programme), IRI (Columbia University’s International Research Institute for Climate and Society). 2013. “Climate Risk and Food Security in Sen-egal: Analysis of Climate Impacts on Food Security and Livelihoods.” Rome/Dakar. Online: http://documents.wfp.org/stellent/groups/public/documents/newsroom/wfp269381.pdf
Bot, A. 2003. “The Importance of Soil Organic Matter.” FAO Bulletin 80.Caprio, G., and D. Klingebiel. 1996. “Bank Insolvencies: Cross Country Experience,”
Working Paper 1620, World Bank, Washington, DC. CSE (Centre de Suivi Ecologique). 2013. Rapport sur les feux détectés par les capteurs MODIS.
Dakar.Del Ninno, Carlos, and B. Mull. 2015. “Safety Nets in Africa: Effective Mecha-
nisms to Reach the Poor and Most Vulnerable.” Washington, DC: World Bank Publications.
de Nicola, F., and X. Gińe. 2011. “How Accurate Is Recall Data? Evidence from Coastal India.” IFPRI and World Bank, DECRG.
Diaz-Bonilla, E., M. Thomas, S. Robinson, and A. Cattaneo. 2000. “Food security and Trade Negotiations in the WTO: A Cluster Analysis of Country Groups.” TMD Discussion Paper No. 59, IFPRI, Washington, DC.
Diop, A., and O. Faye. 2012. Senegal Scenario Analysis 2011–2012: Two Rural Liveli-hood Zones Assessed Using the Household Economy Approach (HEA). London: Save the Children UK.
Eilerts, G., J. Verdin, and L. White. 2012. “A Climate Trend Analysis of Senegal.” U.S. Geological Survey Fact Sheet 2012–3123, p. 4.
Elbers, C., J. W. Gunning, and B. Kinsey. 2007. “Growth and Risk: Methodology and Micro Evidence.” World Bank Economic Review 21 (1): 1–20 .
Ericksen, P., et al. 2011. “Mapping Hotspots of Climate Change and Food Insecurity in the Global Tropics.” CCAFS Report. 5. CGIAR Research Program on Climate Change, Agriculture and Food Security (CCAFS). Copenhagen, Denmark.
FAO (Food and Agriculture Organization of the UN). 1971. “Irrigation Practice and Water Management.” Irrigation & Drainage Paper 1.
———. 2014. “Secteur Avicole Senegal”. Revues nationales de l‘élevage de la division de la production et de la santé animales de la FAO. No. 7. Rome.
FAOSTAT. 2009. “Food Balance Sheet.”
REfERENCES

58 Senegal
Franzel, S. 1979. “An Interim Evaluation of Two Agricultural Production Projects in Senegal: The Economics of Rainfed and Irrigated Agriculture.” Working Paper 28, USAID African Rural Economy Program.
Funk, C., J. Rowland, A. Adoum, G. Eilerts, J. Verdin, and E. White. 2012. A Climate Trend Analysis of Senegal, USGS Famine Early Warning Systems Network—Informing Climate Change Adaptation Series.
Gary F., P. Facelli, and S. Hutter. 2010. “Analyse OIE des écarts du PVS au Sénégal.” Report prepared for OIE PVS Gap Analysis.
GFDRR (Global Facility for Disaster Reduction and Recovery). 2012. Senegal: Disaster Risk Financing and Insurance Country Note. World Bank, November.
Hathie, I., et al. 2012. “Economic Impacts of Climate Change on Farmers in Nioro du Rip, Senegal: An Integrated Assessment.”
Iglesias, A., and C. Rosensweig. 2009. “Eff ects of Climate Change on Global Food Production from SRES Emissions and Socioeconomic Scenarios.” Palisades, NY: NASA Socioeconomic Data and Applications Center (SEDAC). http://dx.doi.org/10.7927/H4JM27JZ.
International Monetary Fund. December 2010. IMF Country Report No. 10/368. Senegal: Poverty Reduction Strategy Paper Annual Progress Report. Washington, DC.
IPCC (International Panel on Climate Change). 2007. “Climate Change 2007: Impacts, Adaptation and Vulnerability.” Contribution of Working Group II to the Fourth Assessment Report of the Intergovernmental Panel on Climate Change. M. L. Parry, O. F. Canziani, J. P. Palutikof, P. J. van der Linden, and C. E. Hanson, eds. Cambridge University Press, Cambridge, UK, 976 pp.
Jalloh, A., G. C. Nelson, T. S. Thomas, R. Zougmoré, and H. Roy-Macauley. “West African Agriculture and Climate Change: A Comprehensive Analysis.” Washing-ton, DC: International Food Policy Research Institute.
Kabamba, H., and A. Muimba-Kankolongo. 2009. “Adoption and Impact of Con-servation Farming on Crop Productivity among Smallholder Farmers in Kapiri Mposhi District of Zambia.” Journal of Animal & Plant Sciences 3 (2): 205–214.
Kandji S. T., L. Verchot, and L. Mackensen. 2005. “Climate Change and Variability in the Sahel Region: Impacts and Adaptation Strategies in the Agricultural Sector.”
Khouma, M., et al. (2013). Senegal. IFPRI book chapters, 291–322.Lecoq, M. 2010. “Integrated Pest Management for Locusts and Grasshoppers: Are
Alternatives to Chemical Pesticides Credible?” Journal of Orthoptera Research 19 (1): 131–32.
Mahul, O., and C. Stutley. 2010. Government Support to Agricultural Insurance. Washington, DC: World Bank.
McSweeney, C., M. New, and G. Lizcano. 2010. “UNDP Climate Change Country Profi les: Senegal.” http://country-profi les.geog.ox.ac.uk/.
Muilenburg, V. L., and D. A. Herms. 2013. “Responses of Insect Pests to Climate Change: Eff ects and Interactions of Temperature, CO2, and Soil Quality.” In Climate Change and Food Security in West Asia and North Africa, 115–130. Amsterdam, the Netherlands: Springer.
Oceanium. 2014. “Bushfi res.” http://www.oceaniumdakar.org/Les-feux-de-brousse.html?lang=en.

59Agricultural Sector Risk Assessment
Resnick, D. 2013. “The Political Economy of Food Price Policy in Senegal.” Research Brief No. 7, March 2013. Cornell University, New York. http://dyson.cornell.edu/faculty_sites/pinstrup/pdfs/ResearchBriefs/senegal-2.pdf.
Sene, I. M., et al. (2006). “Impacts of Climate Change on the Revenues and Adapta-tion of Farmers in Senegal.” CEEPA DP20, University of Pretoria, South Africa.
Sultan, B., et al. 2013. “Assessing Climate Change Impacts on Sorghum and Millet Yields in the Sudanian and Sahelian Savannas of West Africa.” Environmental Research Letters 8 (1): 14–40.
USAID (U.S. Agency for International Development). 2013a. “Low Cost Farming Techniques Defy Drought in Senegal.” http:// www.usaid.gov/results-data/success-stories/Low-cost-farming-techniques-defy-drought-in-senegal.
———. 2013b. “Global Food Security Response: Senegal Rice Study. October 2013. microREPORT #160. https://www.microlinks.org/library/global-food-security-response-senegal-rice-study.
Wane, A., V. Ancey, and I. Toure. 2010. “Pastoralisme et recours aux marchés: cas du Sahel sénégalais (Ferlo).” Cahiers Agricultures 19: 14–20.
Wane, A., and Diouf Galandou. 2012. Vulnérabilité économique et résilience au Ferlo., Déterminants contextuels en dynamique.
Weeks, J. 1970. “Uncertainty, Risk, and Wealth and Income Distribution in Peasant Agriculture.” Journal of Development Studies 7 (1): 28–36.
WFP (World Food Programme). 2011. “Comprehensive Food Security and Vulner-ability Analysis (CFSVA): Republic of Senegal.” New York.
———. 2014. Summary Report of the Evaluation for the Impact of Food for Assets on Livelihood Resilience in Senegal, Evaluation Reports, Rome, February 10–11.
Wheeler, D. 2011. “Quantifying Vulnerability to Climate Change: Implications for Adaptations Assistance,” CGD Working Paper 240. Washington, DC: Center for Global Development. (and accompanying data set and maps).
World Bank. 2013. Project Information Document (PID) Concept Stage. Public Dis-closure Copy Report No.: PIDC491. Project Name SN: Casamance Regional Development Pole (P125506). Region: Africa. Country: Senegal.


61Agricultural Sector Risk Assessment
INTRODUCTIONClimate change is a long-term trend that will exacerbate natural resource constraints on agricultural production in Senegal by making weather patterns more variable, and increasing the frequency and intensity of severe weather events. As result, climate change will directly aff ect the incidence of some agricultural risk events and indirectly aff ect the incidence of others. Understanding how climate change trends aff ect farm productivity is essential to formulating an agricultural risk management plan that maximizes the use of scarce resources. Regardless of the future extent of global warming, identifying and implementing risk management strategies that address agricultural risks, including those exacerbated by climate change, can reduce volatility and improve sustainability in the sector.
VULNERABILITY TO CLIMATE CHANGEIn the Mapping the Impacts of Climate Change index under “Agricultural Productivity Loss,” the Center for Global Development ranks Senegal sixth out of 233 countries globally for “direct risks” due to “physical climate impacts” and 23rd out of 233 for “overall vulner-ability” due to “physical impacts adjusted for coping ability” (Wheeler 2011).
Like most of the countries in the Sahel region, Senegal’s agricultural sector is highly vulnerable to the eff ects of climate change. The country’s climate is already charac-terized by high temperatures and low, highly variable annual precipitation, factors that negatively aff ect the productivity of heat-sensitive crops. More than 95 percent of the total cropped area depends on rain-fed systems, and most farmers and herd-ers practice traditional forms of agriculture (Khouma et al. 2013, 319). Because of these factors and the importance of the sector in Senegal’s national economy, cli-mate change impacts on crop yields and land suitability will have far-reaching eff ects.
The agricultural sector accounts for approximately 15 percent of GDP and is an important source of foreign exchange earnings. Agriculture also plays a key role in
APPENDIX A
CLIMATE CHANGE IMPACTS ANALYSIS

62 Senegal
poverty reduction and food security through its contribu-tion to livelihoods. The sector employs 77 percent of the workforce and generates 55 percent of national grain requirements (IFPRI 2012). Although Senegal is a net food importer, domestic production is an essential source of household food consumption, especially in rural areas. In 2009, the average Food Self- Suffi ciency Rate was 86 percent for millet/sorghum but just 39 percent for rice (IMF 2010), which constitutes a larger share of total cereal consumption in urban households (54 percent) compared with rural households (24 percent) (USAID 2013b).
PATHWAYS OF IMPACTClimate change aff ects agriculture through temperature increases, changes in precipitation, and increases in the frequency and severity of extreme weather events. There are direct impacts, such as changes in land suitability for crops related to temperature changes, and indirect impacts, such as changes in food prices that ultimately aff ect food demand and well-being. Models predicting the eff ects of climate change on agriculture vary across regions and crop/livestock sectors, and depend heavily on the underlying assumptions. The projected eff ects of changes in precipitation are particularly diffi cult to recon-cile given the vast regional variation in annual rainfall and limited district-level data. Rising temperatures are also expected to increase evapotranspiration, off setting pro-ductivity gains. Although there is a large degree of uncer-tainty about the magnitude of impact, this appendix synthesizes existing climate projections and crop forecasts, highlights areas of consensus between diff erent studies, and identifi es areas of disagreement.
PRINCIPAL FINDINGS
TEMPERATURETemperature changes over the past 40 years have been faster in Senegal than temperature changes globally. Since 1975, temperatures have increased by approximately 0.9°Celsius (Funk et al. 2012), and downscaled general cir-culation models (GCMs) predict future increases in the average daily maximum temperature during the warmest month of at least 1°C to 1.5°C ( Jalloh et al. 2012). The rate of warming is higher in the interior regions than in the coastal region, and all projections indicate that the
frequency of extremely hot temperatures will increase (McSweeney, New, and Lizcano 2010).
PRECIPITATIONIn contrast to the general consensus on rising and extreme temperatures, models of future rainfall conditions in Sene-gal predict varied outcomes. There is no consensus on the magnitude of change in precipitation, and little agreement on the direction of change in diff erent regions, although model projections trend toward decreases in mean annual rainfall. According to a multimodel United Nations Development Programme (UNDP) analysis, projected annual change in rainfall ranges from –38 to +21 percent by the 2090s, and the mean annual change predicted ranges from –18 to +7%. In sum, diff erent models predict a wide range of scenarios for large parts of Senegal.
There is broad agreement across models that precipita-tion extremes will be more frequent, increasing the inci-dence of droughts and fl oods (IPCC 2007). Most models also predict an increase in the intensity of high-rainfall events, and greater variability in the onset and cessation of the rainy season (Sene et al. 2006). These factors would negatively aff ect agricultural production, especially in regions where precipitation is already highly variable.
LENGTH OF GROWING PERIOD The length of growing period (LGP) is a key determinant of land suitability for agricultural production, and is defi ned by the average number of days per year when average air temperature and evapotranspiration rates are conducive to crop growth. In central Senegal, a large area is expected to fl ip from an LGP greater than 120 days in the 2000s to an LGP less than 120 days by 2050 (Erickssen et al. 2011). The 120-day threshold is signifi cant because cultivating crops like maize is considered very diffi cult below this threshold.
AREAS OF UNCERTAINTY » Extent of crop yield increases due to CO2 fertilization » Extent of increase in pest and disease incidence due
to CO2 fertilization (Muilenburg and Herms 2013) » Impact on total crop production and postharvest
losses caused by the evolution of pests and diseases » Impact of ozone damage on crop yields (Ainsworth
and McGrath 2010; Iglesias et al. 2009)

63Agricultural Sector Risk Assessment
METHODOLOGIESData analyses from the literature reviewed in this appen-dix draw from downscaled GCMs. The studies use multi-ple GCMs, simulate between one and fi ve greenhouse gas emissions scenarios, and incorporate crop prediction models. As a result, the conclusions vary depending on the underlying model assumptions.
» A country-level International Food Policy Research Institute (IFPRI) study (Khouma et al. 2013, 291–322) compares yield projections for 2050 across four diff erent GCMs (CNRM-CM3, ECHAM 5, CSIRO, and MIROC), using 2000 climate data as the baseline. Each model is simulated with the IPCC A1B emissions scenario, which assumes fast economic growth, a midcentury global population peak, new and effi cient technologies, and a mix of fossil and nonfossil energy sources.
» AgMIP (Hathie et al. 2012) projected future crop yields using two crop simulation models calibrated with household survey data and future climate data under fi ve GCMs (CCSM4, GFDL-ESM2M, Had GEM2-ES, MIROC5, and MPI-ESM-MR).
The study simulated the eff ects of climate change with and without adaptation on crop yields using multiyear baseline (1980–2009) and future (2040–69) climate projections. The analysis was limited to Nioro du Rip, a district in southeastern Senegal.
» A multicountry study published in Environmental Research Letters (Sultan et al. 2013) projected future crop yields in Senegal based on several climate mod-els from CMIP3 (the World Climate Research Pro-gramme’s Coupled Model Intercomparison Project), three IPCC emissions scenarios (A2, A1B, and B1), and the crop model SARRA-H v.32. The analysis incorporated multiple climate datasets for the 1961–90 baseline period and simulated the eff ects of cli-mate change on crop yields through 2100.
CROP PROJECTIONS
MAIZEMaize is grown in most parts of the country, except in the Sahel and other very dry regions (fi gure A.1). The most important areas of production areas are located in the
2000 old area lost
CNRM-CM3 GCM
ECHAM 5 GCMECHAM 5 GCM MIRMIROC 3.2 medium resolution GCOC 3.2 medium-resolution GCMM
CSIRO Mark 3 GCM
2050 new area gained
Yield gain > 25%
Yield gain 5–25%
Yield change within 5%
Yield loss 5–25%
Yield loss > 25% of 2000
FIGURE A.1. RAIN-FED MAIZE YIELD CHANGE UNDER FOUR CLIMATE
MODELS, 2010–50 (IPCC A1B SCENARIO)
Source: Khouma et al. 2013, 311.

64 Senegal
southern Groundnut Basin and the Casamance region. Maize is also grown under irrigation in the Senegal River Basin in the north, with higher yields (about 2 tons per hect-are) than rain-fed maize (about 1 metric ton per hectare) (Khouma et al. 2013). After rice and wheat, maize is the most-consumed grain in the country, accounting for approx-imately 10 percent of the food supply (FAOSTAT 2009).
According to the IFPRI study, all models predict that some areas of Senegal will experience maize yield gains of between 5 and 25 percent. The models display consid-erable agreement on the location of the yield increases, but disagree on the magnitude. All models also predict that some areas will experience yield losses in places where maize currently grows. The CNRM and ECHAM models predict a larger decline in maize yields than do the CSIRO and MIROC models. The ECHAM model also predicts a greater loss in total harvested area than do the CSIRO and MIROC models. The IFPRI study concludes that maize will be less negatively aff ected by the impacts of climate change compared with millet and groundnuts.
The AgMIP study, which was limited to a single district in southeastern Senegal, concluded that farmers would
2000 old area lost
CCNRM-CM3 GCM
EECHAM 5 GCM MIROC 3.2 medium-resolution GCM
CSIRO Mark 3 GCM
2050 new area gained
Yield gain > 25%
Yield gain 5–25%
Yield change within 5%
Yield loss 5–25%
Yield loss > 25% of 2000
FIGURE A.2. RAIN-FED GROUNDNUTS YIELD CHANGE UNDER FOUR
CLIMATE MODELS, 2010–50 (IPCC A1B SCENARIO)
Source: Khouma et al. 2013, 310.
experience declines in crop yields, net farm revenue, and per capita income. The simulated models estimated greater economic losses for maize-based farms compared with nonmaize farms.
GROUNDNUTSGroundnuts are the most widely grown crop in Senegal, ranking fi rst in terms of area harvested and second in terms of production volume (fi gure A.2). Groundnut oil is the country’s top agricultural export and an important component of the domestic food supply. Typically, groundnuts are intercropped with millet.
All of the models in the IFPRI study predict a general 5 to 25 percent decline in groundnut yields. Model pre-dictions diverge at the northern edge of the Groundnut Basin: Two of the four models predict yield losses of more than 25 percent in this area. Two of the models predict small areas of yield gains closer to the coast and in the southeast.
All of the model simulations in the AgMIP analysis pre-dict lower groundnut yields in Nioro district in the 2040–69 period compared with the baseline period.

65Agricultural Sector Risk Assessment
RICERice is the most widely consumed food in Senegal, accounting for approximately 29 percent of the food supply (FAOSTAT 2009). Between 2001 and 2005, 80 percent of domestic rice consumption depended on imports. Since 2005, domestic rice production has more than doubled, but the country still relies heavily on imports.9 Rice accounts for approximately 4 per-cent of the total area harvested in Senegal, behind mil-let, groundnuts, sorghum, and maize. Rain-fed rice is grown in most areas in the southern half of the coun-try, and irrigated rice is grown in the Senegal River Basin.
According to the IFPRI study, predicted yield increases for rain-fed rice are similar to those for maize, but relatively greater in magnitude, with larger areas of yield gains between 5 and 25 percent (fi gure A.3). Overall, rice yields are expected to be less negatively aff ected than groundnuts.
9 OECD, 2008.
MILLETAfter groundnuts, millet is the most widely grown crop in Senegal, accounting for approximately 7 percent of the food supply (FAOSTAT 2009). Millet’s contribution to food security is especially important in the Sahel region, where it the most widely consumed and widely cultivated crop.
A study published in Environmental Research Letters concluded that millet yields in Senegal would be negatively aff ected by climate change (Sultan et al. 2013). Out of 35 scenarios, 31 showed a negative impact on millet yields, with yield up to 41 percent. Yield reductions were predicted to be greater in the Sudanian region (southern Senegal), compared with the Sahelian region. According to the multicountry study, traditional cultivars were more resilient than modern high-yielding varieties. However, owing to the large diff erence in mean yields, modern varieties would still outperform tradi-tional ones (under optimal fertility conditions), even if they are more aff ected by climate change.
The AgMIP study in Nioro district also concluded that millet yields would be negatively aff ected by climate change. All model simulations predicted a decrease in future yields compared with the baseline period.
2000 old area lost
CNRM-CM3 GCM
ECHAM 5 GCMECHAM 5 GCM MIRMIROC 3.2 medium-resolution GCOC 3 2 medium-resolution GCMM
CSIRO Mark 3 GCMk
2050 new area gained
Yield gain > 25%
Yield gain 5–25%
Yield change within 5%
Yield loss 5–25%
Yield loss > 25% of 2000
FIGURE A.3. RAIN-FED RICE YIELD CHANGE UNDER FOUR CLIMATE
MODELS, 2010–50 (IPCC A1B SCENARIO)
Source: Khouma et al. 2013, 313.

66 Senegal
CONCLUSIONUncertainties surrounding the degree of temperature increases and the direction of change in precipitation lev-els make it diffi cult to determine the precise impact of future climate change on crop yields. Predictions of crop yields vary depending on the underlying assumptions, and most models do not account for the way in which the
changing incidence of pests and diseases will aff ect farm productivity. Despite these uncertainties, most studies agree that Senegal’s agricultural sector is highly vulnerable to the eff ects of climate change, and that the overall impacts of climate change will be detrimental to national food security. Absent climate adaptation measures, the eff ects of climate change can be expected to exacerbate the impact of risk events on farm productivity and food security.
67Agricultural Sector Risk Assessment
INTRODUCTIONAgricultural shocks are one important factor driving chronic poverty and food insecu-rity in Senegal. Shocks aff ect household well-being in a variety of ways, by limiting food availability, weakening food access, and negatively aff ecting monetary well-being through the depletion of productive assets. Chronically vulnerable groups with high exposure to hazards experience a disproportionate impact from adverse events and lack coping mechanisms available to other groups. In this context, vulnerability is a useful lens through which to examine agricultural shocks because it allows policy mak-ers to determine which groups are most aff ected and to target risk management solu-tions accordingly.
GENERAL TRENDS Rural households are more likely to be poor and food insecure than are urban house-holds in Senegal. In rural districts, 15.1 percent of households are severely or moder-ately food insecure, compared with 8.6 percent in urban districts. Malnutrition, a direct cause of food insecurity, is signifi cantly higher in rural areas: almost 20 percent of rural children under age fi ve are stunted, compared with 9 percent of children in urban zones. Important sources of vulnerability in the rural environment include (1) poor access to markets, (2) low levels of educational attainment and poor quality edu-cation, and (3) lack of diversity in income opportunities. All three factors increase the vulnerability of households to food insecurity and aff ect rural communities more acutely than urban ones.
APPENDIX B
SENEGAL VULNERABILITY ANALYSIS

68 Senegal
Location is a key determinant of poverty and food secu-rity status for Senegalese households. In fact, national averages of food security and poverty mask stark regional diff erences. The prevalence of severe food insecurity ranges from less than 1 percent in Dakar and Diourbel to 35 percent in Oussouye (see table B.1).
Food price shocks are by far the most important source of vulnerability for both rural and urban households. More than 34 percent of rural households and 29 percent of urban households reported experiencing a spike in food prices between April 2009 and April 2010. Households experience food price volatility more frequently than any other risk event.
AGRO-CLIMATIC CONDITIONS, LIVELIHOODS, AND VULNERABILITY In rural areas, the prevailing agro-climatic conditions, par-ticularly rainfall and water resources, are strong predictors of livelihood activities, which in turn infl uence household food consumption and vulnerability (fi gure B.1). In areas rich in water resources, producers are more likely to grow cash crops, employ farm laborers, sell market garden products, and engage in fi sheries. In the Sahel region where rainfall is highly variable, communities rely heavily on pastoralist activities and drought-tolerant food crop production. Because three-quarters of rural Senegalese households do not produce enough food to meet their minimum food requirements, diversifi cation of revenue sources and access to markets are important determinants of both poverty and food security. Households that lack multiple sources of income and market opportunities are more vulnerable to a range of production and market risk events. These types of households exist in all livelihood zones, but are most prevalent in the agro-pastoral and sylvo-pastoral zones. Several underlying factors increase the vulnerability of pastoral and agro-pastoralist commu-nities, including land fragmentation, population growth, low literacy and education provision, and poor infrastruc-ture. These chronic weaknesses undermine the capacity of communities to respond to shocks. In turn, the increasing frequency and simultaneous occurrence of multiple shocks
TABLE B.1. PREVALENCE OF FOOD
INSECURITY BY DISTRICT
District
Severe Food
Insecurity (%)
Moderate Food
Insecurity (%)
Dakar <1 4.8
Diourbel <1 1.9
Mattam 1.5 11.1
Fatick 1.7 3.5
Bounkiling 1.9 11.1
Goudiry 2.2 14.4
Saint-Louis 2.3 10.7
Tambacounda 2.5 15.9
Louga 2.6 7.9
Koumpentoum 2.6 17.8
Bakel 3 9
Kaolack 3.2 23.9
Thiès 3.2 12.6
Goudomp 4.3 18.8
Kanel 4.6 14.1
Kaff rine 4.8 12.1
Salémata 5.2 21.9
Kédougou 5.8 22.7
Vélingara 5.9 16.5
Médina Y.F 6.4 18.7
Saraya 7.9 28.4
Ranérou 9 8.8
Kolda 9.2 23.4
Sédhiou 9.6 10.9
Bignona 19.7 22.7
Ziguinchor 20 30.4
Oussouye 35 23.7
Rural Districts 3.7 11.4
Guédiawaye 0.6 5.5
Kédougou 1.9 5.8
Tambacounda 2.3 5.3
Oussouye/Bignona 12.4 21.3
Urban Districts 2 6.6
Source: WFP 2011.

69Agricultural Sector Risk Assessment
FIGURE B.1. SENEGAL LIVELIHOOD ZONE MAP
Source: FEWSNET http://www.fews.net/west-africa/senegal/remote-monitoring-report/may-2014.
erode the eff ectiveness of traditional coping mechanisms, creating a vicious cycle of crisis and underdevelopment.
LIVESTOCK OWNERSHIP AND FOOD SECURITYAlthough pastoralists and agro-pastoralist zones have above-average rates of food insecurity, livestock owner-ship is actually positively correlated with food security. In rural areas of Senegal, food-secure households have an average of 8.4 tropical livestock units (TLU), compared with 5.1 TLU for food-insecure households. The ability to sell productive assets during the annual lean season to obtain food and basic necessities is an important coping strategy for agricultural households. Households with large herd sizes are better equipped to employ this strategy, without compromising their future income, than households with only a few animals or stockless households.
FOOD PRICE VOLATILITY AND VULNERABILITYAs mentioned previously, the vast majority of both urban and rural households purchase at least some of their food on the market, especially during the annual lean season when prices peak. Dependence on the market is com-pounded by Senegal’s reliance on food imports and expo-sure to international price fl uctuations, which directly aff ect household purchasing power. As a result, Senega-lese households are extremely vulnerable to food price shocks. Figure B.2 depicts the geographic distribution of food price shocks, measured by the percentage of house-holds that reported experiencing one or more food price increases in the previous 12 months. Households in the northern Sahel region were more likely to experience food price shocks than any other part of the country (except the Kaolack region, where households were simi-larly aff ected).

70 Senegal
Pastoralists and agro-pastoralists • 37% of households that depend on livestock belong at the bottom income quintile. More than 60% are considered poor or very poor.
• Illiteracy rate is 59% among head-of-households (HH). Households with an illiterate HH are more likely to be food insecure than are those with similar characteristics and a literate HH.
• Low savings rate (between 11% and 13%).Unskilled wage laborers • 29% of households that depend on wage labor belong to the bottom income quintile.
More than 60% are considered poor or very poor.• Low savings rate (between 11% and 13%).• Second-lowest monthly expenditure (US$1.13 per person per day).
Food crop farmers • 28% of these households belong to the bottom income quintile. More than 50% are considered poor or very poor.
Cash crop farmers • Similar to food crop farmers, 29% of these households belong to the bottom income quintile. More than 50% are considered poor or very poor.
Households that rely primarily on forest resources
• More than 50% of these households belong to the bottom income quintile. More than 75% are considered poor or very poor.
• Low savings rate (between 11% and 13%).• Lower monthly expenditure than any other livelihood group (US$0.94/person/day).• 25% of households do not eat three meals a day.
Source: WFP 2011.
TABLE B.2. VULNERABLE GROUPS
FIGURE B.2. FOOD PRICE SHOCKS BY DISTRICT
Source: WFP 2011.
71Agricultural Sector Risk Assessment
Agriculture is important for Senegal. It contributes 20 percent to GDP and provides employment to 60 percent of its workforce. It is key to food security and to protect the country against the increasing fl uctuations of international food prices, which saw rice prices triple in 2007–08.
The increase of agriculture productivity is a paramount objective of the government of Senegal. The Programme de Relance et d’Accélération de la Cadence de l’Agriculture au Sénégal aims at implementing the objectives of the Plan Senegal Emergent in the agriculture sector and focuses on four strategic crops: rice, onions, groundnuts, and off -season fruits and vegetables. The underlying goals that explain the selection of these crops are: (1) coverage of the whole of Senegal with these products; (2) gradual suppression of food dependence (rice and onions); (3) development of exports (off -season fruits and vegetables); and (4) jobs creation and additional income generation.
Agriculture is risky in Senegal. Ninety-eight percent of cultivated land is rain fed, and as Senegal belongs to the Sahel, rain is scarce in parts of the country and unreliable across the country, causing damage by excess as well as scarcity. The World Bank’s Agriculture Risk Management Team estimates that during 1980–2012, total losses from production risks aff ecting maize, rice, millet, sorghum, peanuts, and cowpeas alone totaled US$1.38 billion, that is, US$41.7 million per year. A detailed report was shared with the government of Senegal in the second half of 2014; its fi ndings have informed the work of the AIDP and this report.
World Bank analysis using the Modèle d’Analyse des Risques de Cultures du Sénégal modeled an average annual crop loss cost of 10 percent of national crop value and indicates a 1 in 100 year loss of 44 percent of the national average crop value. The 2002–03 drought cost an estimated 35 percent of national crop production, almost US$50 million. Annual groundnut production decreased by 70 percent, likewise the average cash fl ow to groundnut farmers. The 2004–05 locust infestation reduced mil-let yields by 23 percent and sorghum yields by 14 percent. The livestock sector is also
APPENDIX C
AGRICULTURAL INSURANCE IN SENEGAL

72 Senegal
aff ected: the 2011 drought required government to spend CFA 4 billion on 21,000 tons of forage to control livestock mortality.
Climate change is likely to aggravate rural households’ exposure to risk. Mean annual temperature has increased by almost 1°C between 1960 and 2006 and may increase by up to 3°C by midcentury. Variability of rainfall pat-terns has also increased, causing both droughts and fl oods. The model of the World Food Programme and the Agence Nationale de l’Aviation Civile et de la Météorologie esti-mates that climate variability explains half of agriculture yield variations in Senegal (ANACIM 2012). Repeated droughts, along with population growth and agriculture expansion, have already led to severe environmental deg-radation in wide parts of the country.
Agricultural risk limits access to fi nance, and that restrains agriculture productivity. To increase productivity, crop and livestock producers have to invest, and in most cases they depend on credit to do that. The supply of credit usually does not meet their needs, and although logistical challenges are one reason for this mismatch, risk is another. In Senegal, the 1988–91 banking crisis shows how drought precipitated the closure of seven banks (Caprio and Klingebiel 1996).
One common risk management approach of farmers in Senegal as elsewhere is diversifi cation of income sources. Forty-one percent of rural households have two main sources of income and 44 percent depend on three or more sources. In contrast, 43 percent of urban households depend on one livelihood activity. The agri-culture production of rural households is itself charac-terized by diversifi cation, as diff erent crops are planted on the often-fragmented small plots. This is a very sen-sible approach to addressing risk in the absence of other instruments to manage risk. But it limits their productive capacity as they forgo higher profi ts in risk-ier activities.
Insurance has been recognized as one important instru-ment to address risk by pooling and transferring it. Risk transfer complements risk mitigation and risk coping as the third fundamental pillar to address agriculture risk. Insurance is one of the oldest and best-developed instru-
ments for risk transfer; it has contributed to prosperity of developed countries around the world, and is increas-ingly reducing vulnerability and protecting productive investment also in developing countries. The formaliza-tion of organized solidarity for the redistribution of money between individuals and in time under the con-cept of insurance has been refi ned for centuries. The mathematical law of large numbers explains how the outcome of a collection of comparable units (such as agriculture hectares or livestock units) exposed to risk is more predictable than the outcome of each one of the units, thus moving from gambling to the statistical man-agement of risk that allows commercial companies to sustainably off er insurance in exchange for a commensu-rate premium. In this way, insurance transforms future uncertainty into predictability, for government budgets as well as for households.
Although insurance is a mature and well-developed instru-ment, agriculture insurance is one of the later lines to emerge, and it has not been available to small-scale farm-ers until very recently. The principal obstacle that has excluded small-scale farmers from agriculture insurance is the cost of claims assessment, which traditionally requires farm visits of highly specialized experts but is not viable for small farmers. Fortunately, this obstacle is being over-come with the spread of index-based agriculture insur-ance during the past 15 years.
Agriculture insurance serves two main purposes. On the one hand, it reduces vulnerability, in that it compensates producers for the economic losses suff ered from insured events, thus preventing them from falling into poverty and/or using suboptimal strategies to cope with the losses, such as reducing food consumption, selling productive assets, or taking children out of school. On the other hand, it increases productivity through increased investment by securing credit in case of loan default due to insurable events; this encourages lenders to off er credit to the other-wise risky client group of farmers and herders. Subsistence farming may work without access to credit, but the market oriented productivity growth that Senegal wants from its agriculture sector will require considerable credit. This is unlikely to become available without insurance solutions that remove the agriculture risks that lenders are not pre-pared and equipped to bear themselves.

73Agricultural Sector Risk Assessment
Although insurance is a powerful ex ante instrument to address risk before it materializes in the form of adverse events, it coexists with ex post mechanisms, typically gov-ernment or donor handouts after the event. Setting up disaster funds with more or less elaborated rules of fund-ing and disbursing to target populations in case of calam-ities is more straightforward than developing insurance solutions in countries where the corresponding insurance markets are not well developed. Such funds give govern-ments control and fl exibility, may attract donor funding, and can serve other political objectives. If not based on clear and generally known rules, however, they keep the target benefi ciaries in uncertainty about what to expect, limiting investment on the one hand and individual initi-ative to mitigate risk on the other. And if not based on solid governance, such funds may not be available as needed.
Agriculture risk is a continuum, and diff erent instruments are best suited to address diff erent severities. Just as instru-ments for risk mitigation, risk transfer, and risk coping each have their role to address diff erent degrees of sever-ity, diff erent instruments for risk transfer such as contin-gent budgets or funds, contingent credits, and insurance solutions can be combined for best results.
The government of Senegal has implemented a number of measures aimed at reducing vulnerability of agricul-ture and livestock producers and at increasing their access to fi nance. The Fonds de Securisation, Fonds d’Appui à la Stabulation, and Fonds de Garantie des Investissements Prioritaires all aim to promote lending to farmers and herders and include guarantees that operate like insurance by compensating lenders for loan defaults. The Opération de Sauvegarde du Bétail and the African Risk Capacity are insurance or insurance-like mechanisms that reduce the vulnerability of Sene-gal’s herders.
Acknowledging the importance of insurance, the govern-ment of Senegal created the Compagnie Nationale d’Assurances Agricole du Sénégal (CNAAS) in 2008 together with the country’s insurance industry. Before then, agriculture insurance was limited to farm equip-ment and had little outreach. To crowd in the private s ector and let the insurance industry profi t from lessons
learned on products and processes, Senegal’s private sec-tor insurance companies were invited to jointly own the majority of the CNAAS. This has resulted in a well-run and equipped national champion of agriculture insurance whose development has benefi ted from ongoing govern-ment support.
International research shows that agriculture insur-ance programs conducted by either the public sector or the private sector alone struggle considerably to suc-ceed; moreover, public-private partnerships tend to be a necessary condition for successful scale of agriculture insurance. On a global basis, only 7 percent of agricul-tural insurance transaction volume is purely private. Market and regulatory impediments are often invoked to justify public intervention; they include the systemic nature of agriculture risk, information asymmetries, and the low motivation of any private sector company to invest in the public good of the Agricultural Risk Market Infrastructure necessary for functioning agri-culture insurance. Private insurance providers oper-ated in 54 percent of the 65 countries surveyed by the World Bank in 2008, and public-private partnerships were implemented in 37 percent of them (Mahul and Stutley 2010).
CNAAS has experienced good growth and off ers a wide range of products for farmers and herders, but will need substantial additional growth and product evolution to serve signifi cant proportions of rural households, reduce their vulnerability, and secure their investments in increased productivity. In March 2014, the CNAAS esti-mated that it had insured approximately 5,000 producers with about 8,000 hectares in 2013, and 1,500 livestock producers with about 200,000 animals (three-quarters of them chickens). This is a substantial growth since the company’s fi rst year of operation, and healthy growth is projected going forward. But the outreach to wider rural populations is still limited, and considerably more scale will be required for the CNAAS to noticeably reduce Senegalese vulnerability to shocks and secure the required large amounts of credit. With the current level of devel-opment of agricultural insurance, Senegal’s small and marginal crop and livestock producers are still too reliant on ex post disaster relief interventions by the government and donor partners.

74 Senegal
Agriculture insurance is expensive. Depending on circum-stances, it can reach 10 percent or more of the expected payout amounts, compared with less that 1 percent for life insurance, for example. This is not necessarily an obstacle for prosperous producers (which are few) but usually is a chal-lenge for low-income farmers and herders (which constitute the majority), and contributes to explain the slow growth of agriculture insurance in most developing countries.
The level of the insurance premium—and hence the aff ordability of insurance—is driven by various factors, and each one of them can be addressed to make premium more aff ordable.
The main components of any insurance premium are contained in table C.1.
The various components of an insurance premium corre-spond to various roles and interventions that the public and the private sector can assume. Distribution and servicing of insurance to rural populations, for example, is costly, and initial volumes of agriculture and livestock insurance may not look suffi cient to justify the up-front investment in developing the necessary structures. Partnering with organ-izations that already have that infrastructure in place is
promising; they may come from the private sector—such as rural fi nancial institutions—as well as from the public sector—such as Regional Offi ce for Rural Development (DRDR), Departmental Offi ce for Rural Development (SDDR), Service Regional de l'élevage (SREL) Regional Offi ce for Livestock Service, Service Départemental de l'élevage (SDEL) Departmental Offi ce for Livestock Ser-vices, and Agence Nationale du Conseil Agricole et Rural.
Ongoing government support such as premium subsidies and tax exemptions are powerful stimulants but leave room for further strengthening of agriculture insurance in Senegal. Examples of possible additional support include the following:
1. Reduction of administration and distribution ex-penses by access to government rural infrastruc-ture and staff for insurance-related tasks such as veterinary services or awareness creation
2. Reduction of statistical variance, reinsurance cost, and per-policy administration and distribution cost through growth of the insurance pool by manda-tory inclusion of insurance in rural development projects related to agriculture, livestock, and fi shing
TABLE C.1. INSURANCE PREMIUM COMPONENTS
Premium Component Function Potential Reduction
Actuarial premium Quantifi es the statistically expected payments Focus on infrequent severe eventsLoading for deviations Honor payment liabilities in years when claims
exceed premiumsLarger pool size to reduce statistical variance
Loading for reinsurance Sharing risk with larger pools to protect insurer against statistical outliers
Reduce capital requirements Benefi t from specialized expertise of reinsurers
Larger pool size to reduce statistical variance and the need for reinsurance, reduce statistical variance of cessions to reinsurers, and off er more attractive business proposition to reinsurers
Government fi nancing of reinsurance layersLoading for amortization of
up-front costRecover initial investment in product and
process development, IT, and so on Donor funding of start-up expenses
Loading for data cost Fund payment to providers of recurrent data needs
Public good data access
Other administration expense loading
Fund ongoing variable operation cost Outsource administrative tasks to lower cost providers
Distribution expense loading Fund ongoing distribution cost Partner with lower cost distribution channels, such as government rural outreach infrastructure
Profi t margin Justify the eff ort and build reserves Increase business volume and outlook for future market growth

75Agricultural Sector Risk Assessment
3. Reduction of statistical variance, reinsurance cost, and per-policy administration and distribu-tion cost through growth of the insurance pool by mandatory inclusion of insurance in government-supported agriculture lending
4. Reduction of up-front cost and administration expenses through free access to meteorological and crop yield data necessary to design, price, and service index insurance
5. Reduction of administration expenses through the establishment of and free access to a livestock registry
6. Reduction of administration and distribution expenses if cross-selling of other lines of insur-ance to rural populations is allowed in addition to agriculture insurance
Governments often provide support for the fi nancing of risk through direct premium subsidies, but there are risks with this approach. Governments hope that subsidizing premiums will incentivize insurers to enter the market and will increase the take-up of insurance products and there-fore outreach. However, experience documented from elsewhere points to potential risks with this approach, including the following:
1. Sustainability: Direct premium subsidy can become quite costly and is subject to changing political priorities.
2. Market distortion: Premium subsidy can lead to market distortion.
3. Poor incentives: Premium subsidy can motivate undesired behavior by insurers and reinsurers (lead-ing to overpricing) and insured policyholders (by crowding out alternative risk mitigation strategies).
4. Poor targeting: It is diffi cult to target subsidies to those who need it.
5. Eff ects of withdrawal: Withdrawal of subsidy may to lead to an increase in price, which can severely aff ect future take-up—particularly if the subsidy is
withdrawn too rapidly—and thus reverse the ben-efi ts intended by the subsidy.
In addition to the government-led interventions aiming to reduce farmer and herder vulnerability and increase access to fi nance, Senegal is characterized by a dynamic landscape of donor-driven agriculture insurance initia-tives. CNAAS is testing novel approaches to agriculture insurance in pilots with partners including the Global Index Insurance Facility, the World Food Programme, and USAID, and another program funded by the West Afri-can Development Bank is expected to start soon. A com-prehensive government strategy on agriculture insurance should take into consideration the lessons learned and expected outcomes of these projects, and be informed of the gaps not yet covered by any of the existing govern-ment and nongovernment insurance and noninsurance interventions, to avoid duplications.
Any agriculture insurance strategy should also take into consideration existing social protection mechanisms and objectives to explore synergies. Subsidized agricul-ture insurance premiums amount to self-targeted trans-fer payments. They are aimed at reducing vulnerabilities of specifi c target groups, but only farmers and herders who buy insurance benefi t from them; hence these transfers often benefi t the rich more than they do the poor. Links between insurance and social protection mechanisms are varied and can be complex. Increas-ingly, the concept of payments triggered by readily available indexes that correlate with hardship is trans-ferred from agriculture and disaster index insurance to social safety nets, where benefi ts are increased or pro-vided to larger populations based on suitable indexes that allow such dynamic response to be very fast and well targeted. If based on insurance quality indexes, such increases in government payments can be trans-ferred to international reinsurance markets, reducing budget uncertainty.


77Agricultural Sector Risk Assessment
APPENDIX D
CROP YIELD LOSS ANALYSES
1980 1982 1984 1986 1988 1990 1992 1994 1996 1998 2000 2002 2004 2006 2008 2010 20120
1.2
0.9
0.6
0.3
Yie
ld (
MT
/Ha)
Yield (MT/Ha) Trend 0.3 trend Linear (Yield (MT/Ha))
1980 1982 1984 1986 1988 1990 1992 1994 1996 1998 2000 2002 2004 2006 2008 2010 20120.00
0.60
0.45
0.30
0.15
Yie
ld (
MT
lint
/Ha)
Yield (MT lint/Ha) 0.3 trend Linear (Yield (MT lint/Ha))
FIGURE D.1. GROUNDNUTS,
1980–2012
YearsLoss
(in MT)Loss
(US$, millions)1980 333,101 –117.21983 –339,662 –$119.51984 –197,985 –$69.61992 –204,762 –$72.01996 –113,385 –39.91997 –107,586 –37.82002 –420,376 –147.82006 –41,281 –14.52007 –182,587 –64.22011 –211,477 –74.4Total: –2,152,202 –757.0
Source: DAPS.
FIGURE D.2. COTTON,
1980–2012
YearsLoss
(in MT)Loss
(US$, millions)1980 –2,443 –0.4001982 –1,988 –0.4921996 –2,516 –0.4441997 –3,250 –0.5631998 –17,301 –2.451999 –1,766 –0.2042002 –1,715 –0.1792009 –1,913 –0.2722011 –1,350 –0.4412012 –1,347 –0.261Total: –35,589 –5.7
Source: FAOSTAT.

78 Senegal
1980 1983 1986 1989 1992 1995 1998 2001 2004 2007 20100
3
2.25
1.5
0.75
Yie
ld (
MT
/Ha)
Yield (MT/Ha) Trend 0.3 trend Linear (Yield (MT/Ha))
Yield (MT/Ha) Trend 0.3 trend Linear (Yield (MT/Ha))
1980 1985 1990 1995 2000 2005 20100.00
5.00
3.75
2.50
1.25
Yie
ld (
MT
/Ha)
Yield (MT/Ha) Trend 0.3 trend
1980 1985 1990 1995 2000 2005 2010
1.38
1.10
0.83
0.28
0.55
Yie
ld (
MT
/Ha)
0.00
FIGURE D.3. MAIZE, 1980–2012
YearsLoss
(in MT)Loss
(US$, millions)1980 –16,677 –5.31994 –25,517 –8.01995 –18,238 –5.71996 –21,469 –6.71997 –21,723 –6.81998 –27,694 –8.71999 –29,902 –9.42000 –19,385 –6.12001 –15,899 –5.02002 –74,229 –23.42007 –63,302 –19.92011 –54,419 –17.1Total: –388,454 –122.3
FIGURE D. 4. RICE, 1980–2012
YearsLoss
(in MT)Loss
(US$, millions)1980 –34,165 –10.81996 –31,944 –10.12000 –29,967 –9.52001 –33,236 –10.52002 –41,616 –13.22004 –37,596 –11.92006 –69,667 –22.12007 –57,233 –18.2Total: –335,423 –106.6
Source: FAOSTAT.
FIGURE D.5. COWPEA,
1980–2012
YearsLoss
(in MT)Loss
(US$, millions)1982 –5,792 –3.81983 –1,414 –0.931984 –3,121 –2.01990 –3,657 –2.41992 –8,761 –5.71996 –9,601 –6.32002 –31,143 –20.52003 –13,282 –8.72004 –49,783 –32.72006 –9,949 –6.5Total: –136,503 –89.7
Source: DAPS.

79Agricultural Sector Risk Assessment
1980 1982 1984 1986 1988 1990 1992 1994 1996 1998 2000 2002 2004 2006 2008 2010 2012
Yield (MT/Ha) Linear (0.3 trend) 0.3 trend Linear (Yield (MT/Ha))
0
40
30
20
10
Yie
ld (
MT
/Ha)
0.00
10.00
20.00
30.00
40.00
50.00
60.00
1980 1985 1990 1995 2000 2005 2010
Yie
ld (
MT
/Ha)
Yield (MT/Ha) Trend0.3 trend Linear (0.3 trend)
0
10
20
30
40
1980 1983 1986 1989 1992 1995 1998 2001 2004 2007 2010
Yie
ld (
MT
/Ha)
Yield (MT/Ha) Trend Linear (Yield (MT/Ha))
FIGURE D.6. POTATO, 1980–2012
YearsLoss
(in MT)Loss
(US$, millions)1992 –6,529 –0.9472000 –4,662 –0.6762003 –2,523 –0.3662004 –1,614 –0.2342005 –1,859 –0.2702008 –1,942 –0.282Total: 19,129 –2,774
Source: DAPS.
FIGURE D.7. TOMATO, 1980–2012
YearsLoss
(in MT)Loss
(US$, millions)1994 –12,052 –2.41996 –4,984 –1.01997 –14,103 –2.81998 –17,432 –3.51999 –17,737 –3.62000 –41,486 –8.42001 –32,456 –6.52004 –27,109 –5.52008 –11,304 –2.3Total: –178,665 –36.0
Source: DAPS.
FIGURE D.8. ONION, 1980–2012
YearsLoss
(in MT)Loss
(US$, millions)1991 –5,130 –2.81995 –4,039 –2.21999 –13,475 –7.42000 –25,111 –13.82001 –13,575 –7.52002 –30,095 –16.52003 –11,917 –6.52010 –28,524 –15.7Total: –131,867 –72.5
Source: DAPS.
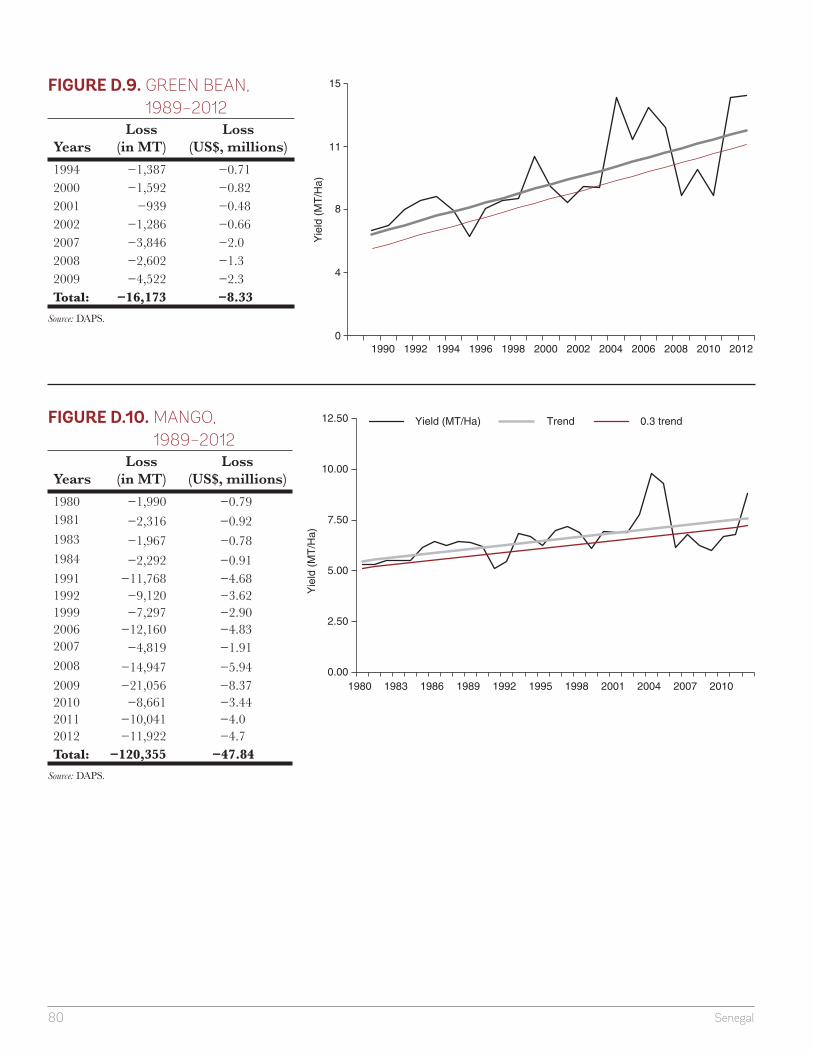
80 Senegal
0
4
8
11
15
1990 1992 1994 1996 1998 2000 2002 2004 2006 2008 2010 2012
Yie
ld (
MT
/Ha)
0.00
2.50
5.00
7.50
10.00
12.50
1980 1983 1986 1989 1992 1995 1998 2001 2004 2007 2010
Yield (MT/Ha) Trend 0.3 trend
Yie
ld (
MT
/Ha)
FIGURE D.9. GREEN BEAN,
1989–2012
YearsLoss
(in MT)Loss
(US$, millions)1994 −1,387 −0.712000 −1,592 −0.822001 −939 −0.482002 −1,286 −0.662007 −3,846 −2.02008 −2,602 −1.32009 −4,522 −2.3Total: −16,173 −8.33
Source: DAPS.
FIGURE D.10. MANGO,
1989–2012
YearsLoss
(in MT)Loss
(US$, millions)1980 −1,990 −0.791981 −2,316 −0.921983 −1,967 −0.781984 −2,292 −0.911991 −11,768 −4.681992 −9,120 −3.621999 −7,297 −2.902006 −12,160 −4.832007 −4,819 −1.912008 −14,947 −5.942009 −21,056 −8.372010 −8,661 −3.442011 −10,041 −4.02012 −11,922 −4.7Total: −120,355 −47.84
Source: DAPS.

81Agricultural Sector Risk Assessment
TABLE E.1. RICE: PREHARVEST
Species (common name) LossesDevastating pest Locusta migratoria (migratory locust)
Oedaleus senegalensis (Senegalese grasshopper)Mythimnauni loreyi (maize caterpillar)Mythimnauni puncta (rice armyworm)
Total
Major pest Agrotis segetum (turnip moth)Dimorphopterus
Major pest—role in virus and disease transfer
Orseolia oryzivora (African rice gall midge)Cofana spectra (white leafhopper)Leptoglossus gonagra (squash bug)Trichispase ricea (rice, hispid)
Up to 15%
Cob borers and stem borers Chilo diff usilineusChilo zacconiusCorcyra cephalonica (rice meal moth)Earias insulana (Egyptian stem borer)Eldana saccharina (African sugarcane borer)Heteronychus licas (black sugarcane beetle)Sesamia calamistis (African pink stem borer)Spodoptera exempta (black armyworm)Spodoptera exigua (beet armyworm)Spodoptera littoralis (cotton leafworm)
Minor pests Atherigona orientalis (pepper fruit fl y)Gryllotalpa africana (african mole cricket)Nezara viridula (green stink bug)Pachnoda interrupta (chafer beetle) Parapoynx stagnalis (rice case worm)
APPENDIX E
CROP PEST ANALYSIS

82 Senegal
TABLE E.2. RICE: POSTHARVEST
Species (common name) Losses
Major postharvest pests Rhyzopertha dominica (lesser grain borer)Sitophilus zeamais (greater grain weevil)Sitotroga cerealella (grain moth)Stegobium paniceum (drugstore beetle)Tribolium castaneum (red fl our beetle)
Up to 15%
Minor postharvest pests Cadra cautella (driedcurrantmoth)Liposcelis bostrychophila (book louse)Liposcelis entomophila (grain psocid)
Up to 5%
TABLE E.3. SORGHUM: PREHARVEST
Species (common name) Losses
Devastating pest Locusta migratoria (migratory locust)Oedaleus senegalensis (Senegalese grasshopper)Schistocerca gregaria (desert locust)
Total
Quarantine pest Thaumatotibia leucotreta (false codling moth)Major pest Atherigona soccata (shootfl y)
Agrotis ipsilon (black cutworm)Mythimnauni loreyi (maize caterpillar)Stenodiplosis sorghicola (sorghum midge)Diabolocatantops axillaris (devil grasshopper)Rhinyptia infuscataTrichoplusia ni (cabbage looper)
Major pest—role in virus and disease transfer
Aphis spiraecola (Spirea aphid)Melanaphis sacchari (yellow sugarcane aphid)Rhopalosiphum maidis (green corn aphid)
Major pest—cob borers and stem borers Eldana saccharina (African sugarcane borer)Helicoverpa armigera (cotton bollworm)Sesamia calamistis (African pink stem borer)Spodoptera exempta (black armyworm)Spodoptera littoralis (cotton leafworm)Heteronychus licas (black sugarcane beetle)
Minor pests Anoplocnemis curvipes (giant coreid bug)Atherigona orientalis (pepper fruit fl y)Dimorphopterus spp.Nezara viridula (green stink bug)Pachnoda interrupta (chafer beetle)
Less than 2%

83Agricultural Sector Risk Assessment
TABLE E.4. SORGHUM: POSTHARVEST
Species (common name) Losses
Major postharvest pests Araecerus fasciculatus (cocoa weevil)Cadra cautella (driedcurrant moth)Rhyzopertha dominica (lesser grain borer)Sitophilus zeamais (greater grain weevil)Sitotroga cerealella (grain moth) Tribolium castaneum (red fl our beetle)
Up to 30%
Quarantine pest Trogoderma granarium (khapra beetle) Total—needs to be destroyedMinor postharvest pests Alphitobius laevigatus (black fungus beetle)
Corcyra cephalonica (rice meal moth)Liposcelis bostrychophila (book louse)Liposcelis entomophila (grain psocid)
TABLE E.5. MILLET: PREHARVEST
Species (common name) LossesDevastating pest Locusta migratoria (migratory locust) Total Major pest Pachnoda interrupta (chafer beetle) Up to 50%Cob borers and stem borers Spodoptera exempta (black armyworm)Minor pest Mythimna unipuncta (rice armyworm)
TABLE E.6. MILLET: POSTHARVEST
Species (common name) LossesQuarantine pest Trogoderma granarium (khapra beetle) Total—needs to be destroyedMajor postharvest pests Cadra cautella (driedcurrant moth) Up to 30%
Tribolium castaneum (red fl our beetle)Minor postharvest pests Corcyra cephalonica (rice meal moth)

84 Senegal
TABLE E.7. COWPEA: PREHARVEST
Species (common name) LossesDevastating pest Locusta migratoria (migratory locust)
Oedaleus senegalensis (Senegalese grasshopper)Up to total
Quarantine pest Amsacta moorei (tiger moth) Major pest Anoplocnemis curvipes (giant coreid bug)
Aphis craccivora (groundnut aphid)Clavigralla tomentosicollis (African pod bug)Maruca vitrata (lima bean pod borer)Megalurothrips sjostedti (bean fl ower thrips)
Major pest—role in virus and disease transfer
Aphis gossypii (cotton aphid)Aphis spiraecola (Spirea aphid)Ferrisia virgata (striped mealybug)Frankliniella schultzei (cotton thrips)Nezara viridula (green stink bug)
Minor pests Agrius convolvuli (sweet potato moth) Agrotis ipsilon (black cutworm)Aspidiotus destructor (coconut scale)Diaphania indica (cucumber moth)Helicoverpa armigera (cotton bollworm)Lampides boeticus (pea blue butterfl y)Liriomyza trifolii (American serpentine leafminer)Ootheca mutabilis (leaf beetle, brown)Ophiomyia phaseoli (bean fl y)Oxycarenus hyalinipennis (cotton seed bug)Spodoptera exigua (beet armyworm)Spodoptera littoralis (cotton leafworm)Trichoplusia ni (cabbage looper)
Less than 2%
TABLE E.8. COWPEA: POSTHARVEST
Species (common name) Losses
Quarantine pest Trogoderma granarium (khapra beetle) Total—needs to be destroyedMajor postharvest pests Callosobruchus maculatus (cowpea weevil) Up to 30%Minor postharvest pests Cadra cautella (driedcurrant moth)
Corcyra cephalonica (rice meal moth)Sitophilus zeamais (greater grain weevil)

85Agricultural Sector Risk Assessment
The rationale behind the risk prioritization exercise is based upon the nature of risk in agriculture, and it is necessary to defi ne risk to understand its nature. First it is key to recognize that risk is an abstract concept associated with an activity, and cannot exist of itself. Only if an activity is undertaken does the possibility of its outcomes being diff erent to those hoped. Secondly, risk involves a detrimental outcome normally but not always associated with reduced returns on investment. Farmers the world over are aware that there is “a risk” inherent in crop production and that in doing so they “risk” the assets that they invest in the process. Thirdly, the risk inherent in an activity is mag-nifi ed as the ratio between the potential for downside loss and the capacity to absorb that loss (Weeks 1970) Commercial farmers who risk $1,000 per ha but have the assets to sustain a loss of that size take on less risk than a smallholder for whom the loss of $1,000 might result in complete bankruptcy and loss of livelihood.
Since the word risk is widely used colloquially, It is also important to defi ne what, for the purposes of this prioritization exercise at least, risk is not. It is not a specifi c type of event—such as drought. Although we talk of such events as “risks,” they are not risks of themselves. Although the potential for a drought to occur might contribute to the risk inherent in crop production, the fact that a drought might contribute much more to rain-fed crop production that it would to irrigated vegetable production highlights the fact that risk is more a property of an activity than of the event itself. Neither is risk the probability that an event might occur. Although the work risk is often colloquially used in place of chance or probability, the words are not interchangeable. A greater prob-ability that a detrimental event might occur can increase the risk inherent in an activity that is aff ected by that event, but does not itself constitute that risk.
Risk as described above is an abstract and subjective concept, but it is a critical aspect of the stochastic processes that typify agricultural production systems. Although deter-ministic value chain analyses can help to determine the optimal path for rural develop-ment, the reality is often at odds with deterministic optima, frequently as a result of the impacts of risk upon rural investment decisions. Unless the perceived risks faced by
APPENDIX F
RATIONALE FOR RISK ASSESSMENT METHODOLOGY
86 Senegal
smallholders are understood, it is diffi cult to design strate-gies to meet the objectives of rural development policies.
A key aspect of risk that confounds analyses is that there is no standardized procedure for its quantifi cation and measurement. Although it is possible to measure the ex post impacts of events that contribute to risk in terms of the loss of yield or income resulting from those events, it is more diffi cult to estimate income foregone by producers who limit their level of investment due to the risks that they perceive to be associated with the production of a specifi c crop. Although such ex ante impacts of risk might be quantifi ed as potential losses, but their attribution and measurement is extremely complex.
This is even more the case in the livestock sector. The majority of ruminants in Africa are kept under extensive management in ancient systems that were not set up to achieve maximum profi t or production but to enable their adherents to be able to live and make use of specifi c resources in areas where there may not be other viable means of making a living or earning an income. These extensive livestock production systems are strongly driven by tradition, heritage and cultural issues. Normal fi scal indicators may not capture the key characteristics of the system where signifi cant cultural and noncommercial drivers may be as, or even more, important than market drivers.
To understand and prioritize the risks in agricultural and livestock sectors, this assessment has adopted a semi-quantitative approach that does not focus on risk per se. Rather it considers the impacts of the events that contrib-ute to the risk inherent in undertaking a given agricultural enterprise or livelihood. Such impacts are moderated by mitigating measures and their fi nal eff ect upon a house-hold in terms of perceived risk will depend upon the capacity of each household to absorb the moderated impacts. All three aspects of risk are assessed to generate an eventual listing of key risks and their relative impor-tance to production.
Risks in agriculture can be both idiosyncratic, linked quite specifi cally to individual commodities (especially prices risks), systemic, where large populations and diff erent crops are aff ected in the same way (inadequate rainfall
being perhaps the most important), or they may be covar-iate, either through being dependent upon a common causal factor or through one aff ecting the other (the rela-tion between price and production can often result in covariate risks being faced by diff erent groups of consum-ers). Each of these aspects of risk must be understood so that the analysis of data and prioritization of risks can be undertaken in an informed and eff ective manner.
A key aspect of risk prioritization is the perspective from which the priorities should be determined. From a national perspective, the highest priority risks may be those that result in the greatest impact on national and rural eco-nomic development, but from the perspective of a small-holder, risk is determined with regard to the livelihood of the household, and especially its food security. It is the fear of food insecurity that drives the majority of investment decisions faced by smallholders so that, when faced with limited resources for investment in crop production, the smallholder will allocate those resources in such a way that the risk to household food security is minimized. It is important therefore to qualify the priorities developed from national data and to note and explain the diff erences that may occur when these priorities are assessed at the household level.
The methodology thus focuses on three aspects of agri-cultural risk: (1) the frequency and impacts of specifi c events upon production at the national and individual household level, (2) the measures employed to mitigate those impacts, and (3) vulnerability, that is, the inverse of the capacity of rural households to absorb the negative impacts of such events. The frequency and impacts of specifi c events (such as drought, disease epidemics of locust swarms) are assessed from available data and from interviews with key stakeholders. Mitigating measures are assessed primarily through interviews with stakeholders, while the capacity of households to absorb negative impacts has been assessed from both the literature and from discussions with smallholders themselves. Such an approach focuses mainly upon the ex post impacts of events that contribute to risk, while the ex ante impacts of risk itself upon investment decisions are largely ignored. It is recognized that in terms of foregone production the ex ante impacts of risk upon agricultural GDP are poten-tially as great if not greater than ex post impacts of risk

87Agricultural Sector Risk Assessment
events (Elbers et al. 2007). Nevertheless, the measurement of perceived risk and its impact upon investment is a com-plicated task beyond the resources available in this pre-liminary assessment. Instead this assessment focuses upon available data on the basis that ex ante impacts can be expected to be roughly proportional to ex post losses, so that after taking into account the qualitative input from interviews and focus groups, the priority components of risk can be readily identifi ed and responses recommended.
The fi rst step of the assessment is to determine the timing and extent of reductions in yield below a predetermined threshold, in this case, a third of a standard deviation below the trend line for national yield over time. Losses that exceeded this threshold are judged to have had a sig-nifi cant impact upon national production and the indica-tive value of such losses is calculated using either domestic or international prices according to the nature of the enterprise. Data for such analyses has been sourced from national statistics or when these have not been readily available through FAOSTAT. For each year that a signifi -cant reduction in yield occurred, key stakeholders were canvassed as to the primary causes for the reduction in that year. This information was triangulated from diff er-ent sources to obtain the most accurate assessment of which events had led to particular crop losses.
National data can provide a useful indication of the main events that resulted in substantial loss of production and reduced agricultural GDP, but such data tends to obscure events of a more localized impact that may nevertheless contribute signifi cantly to the risk inherent in a particular enterprise. These events were captured by extensive can-vassing of stakeholders who were asked to identify the key elements of the risk that they faced when growing a crop or undertaking a specifi c livestock enterprise. Neither does national data cover the extent or eff ectiveness of mitigation measures that may already exist to reduce the impact of these events (and hence to reduce risk), but these too were captured through stakeholder interviews. Finally, national data cannot reveal the eff ect of vulnera-bility to real or potential loss upon producers’ investment
decisions. For the most part, it was considered that small-holders are homogeneous in their response to risk. This is recognized to be an approximation since the large pro-ducers and traders tend to be less risk averse than their smaller counterparts, but it is not anticipated that the approximation would aff ect the fi nal results of the prioritization.
The qualitative results of interviews and focus groups was combined with the quantitative data to develop an overall assessment of the key risks facing the main subsectors of agriculture (crop production, horticulture and livestock production) to allow for the fi nal prioritization and recom-mendation of response measures.
The timescale of the risk is important. In the preparation of this assessment, the greatest signifi cance has been ascribed to those elements of risk that have discernible impact within the period of infl uence of government pol-icy, estimated in this case to be 10 years. Within such a time frame of manageable interest, long-term trends such as climate change contribute little to the ex ante risks per-ceived by stakeholders, whereas ex post impacts remain below the statistical thresholds used to identify risk events. The changing climate may indeed contribute to agricul-tural risk, but its impacts are not identifi ed by the empiri-cal methodology used to develop this risk prioritization.
The response model of this methodology is graphically depicted in fi gure 6.5. It relies upon three diff erent levels of response according to the frequency and severity of impact of risk events. Where risk events may be common, but their direct impacts can be eff ectively reduced, then mitigation measures are appropriate. Where events are less frequent and those impacts generally exceed capacity for mitigation, then it is more appropriate to undertake the transfer of risk impacts to another party (for example, through insurance). Finally, for the more exceptional risk events that have a substantial impact, coping strategies may be the most eff ective response. The application of this model is described in more detail in the fi nal section of this report.


89Agricultural Sector Risk Assessment
APPENDIX G
ANALYSIS OF WEATHER RISK EVENTS
TABLE G.1. FREQUENCY OF LOW RAINFALL EVENTS BY REGION, 1981–2010
ZoneYear
North North Central South Central South East South West
Saint Louis Louga Matam Dakar Thies Diourbel Fatick Kaolack Kaff rine Tambacounda Kedougou Kolda Sedhiou Ziguinchor
1980 –0.03 –0.28 –1.40 –0.09 –0.80 –1.02 –1.32 –1.39 –0.39 –1.16 –0.51 –1.94 –1.31 –1.40 Ext Dry1981 0.98 –0.37 –0.08 –0.39 –0.10 –0.46 –0.33 0.10 0.24 0.63 0.63 –0.17 0.60 0.60 Normal1982 –0.88 –0.04 –0.86 –0.57 –0.29 –0.86 0.06 –0.51 –0.89 –1.17 –0.97 –0.16 –0.74 –0.79 Normal1983 –1.81 –0.62 –1.68 –1.57 –1.61 –1.78 –2.13 –1.22 –1.05 –1.57 –1.01 –1.46 –1.53 Ext Dry1984 –2.09 –0.75 –1.54 –1.11 –0.84 –0.33 –0.21 –0.75 –0.50 –1.34 0.19 –0.14 0.14 –0.23 Dry1985 –0.63 –0.62 –0.28 0.83 –0.43 –0.91 0.34 –0.67 –0.24 –0.36 0.38 –0.97 –0.80 –0.16 Normal1986 –0.97 –0.59 –0.34 –0.01 –0.95 –1.15 –0.70 0.30 –0.04 –0.07 0.02 0.64 –0.07 –1.06 Normal1987 0.25 1.06 0.64 0.38 0.03 –0.68 0.03 0.20 –0.01 –0.75 –0.28 –0.48 0.46 –0.64 Normal1988 0.65 0.99 0.35 0.49 0.91 0.74 0.28 0.98 0.21 1.09 –0.87 –0.36 0.04 0.26 Normal1989 0.44 1.84 –0.19 1.47 1.23 1.57 0.72 0.60 –0.18 0.33 –0.62 0.41 0.82 1.05 Excess1990 –1.19 –0.49 –0.24 –0.95 –0.58 –0.09 –1.53 –1.12 –1.33 –0.58 –1.69 –1.14 –0.43 –0.10 Dry1991 –0.89 –0.17 –1.28 –0.82 –0.70 –0.97 –0.84 –1.50 –2.04 –1.09 –0.19 –1.46 –1.18 0.94 Dry1992 –1.16 –1.07 –1.87 –1.45 –0.88 –0.73 –0.78 –0.39 –0.34 –0.72 –1.08 1.14 –0.08 –1.06 Dry1993 0.11 –0.04 –0.57 –0.46 –0.95 –0.68 –0.17 –0.08 –0.01 –1.23 –0.25 0.33 0.72 –0.15 Normal1994 –0.41 –0.92 0.73 –0.99 –0.46 0.57 –0.12 0.08 0.44 1.55 0.50 0.89 0.76 –0.39 Normal1995 0.37 –0.31 –0.51 0.48 0.04 1.20 0.87 –0.62 –0.70 –0.32 –0.58 –0.34 –3.21 –0.07 Normal1996 –1.44 0.56 –0.10 0.46 –0.09 –1.21 –0.78 –1.24 –0.53 –0.28 –0.19 –1.61 0.21 –0.14 Dry1997 –0.30 –1.29 –0.33 –1.34 –0.86 –0.47 –1.03 –0.68 –1.11 –0.17 2.01 0.61 –0.19 0.04 Dry1998 0.16 0.12 –0.85 –0.34 –0.77 –1.02 –0.58 –1.11 –0.50 0.02 0.37 0.96 –0.50 –0.34 Normal1999 0.64 0.40 1.26 0.69 0.88 1.00 0.62 1.95 1.38 1.31 1.24 1.99 0.76 2.70 Ex Excess2000 0.19 0.74 2.68 0.54 1.83 0.50 1.27 1.07 0.58 0.26 1.26 –0.21 –0.60 0.25 Excess2001 1.05 –0.39 0.26 –0.79 0.81 1.10 –0.10 0.26 –0.56 –0.83 0.17 –1.20 –0.18 0.26 Normal2002 –1.10 –1.54 0.49 –0.71 –1.58 –0.93 –0.99 –0.59 –0.78 –1.50 –0.40 –1.32 –1.47 –1.89 Ext Dry2003 1.21 –0.65 1.62 0.18 –0.73 –0.73 –0.06 0.57 0.23 2.46 2.89 1.04 1.38 –0.64 Excess2004 –1.31 0.72 0.80 –1.15 –1.19 –0.59 –0.35 0.06 1.73 0.83 0.93 0.71 0.59 –0.84 Normal2005 0.67 0.54 0.36 1.93 0.77 1.57 0.59 0.69 1.67 0.54 0.11 1.10 0.98 –0.05 Excess2006 0.64 –1.16 –1.35 0.21 –0.09 –0.35 0.23 0.38 –0.10 –0.90 –0.39 –0.59 1.09 0.61 Normal2007 0.03 –0.43 0.60 –0.87 –0.22 0.56 –1.39 –0.50 –0.78 –0.16 –1.78 0.16 –0.19 –1.12 Normal2008 –0.28 0.66 0.35 0.86 1.09 1.87 1.63 0.58 0.62 1.12 –0.68 0.89 0.77 2.05 Excess2009 1.03 2.15 0.57 1.19 1.72 1.24 1.96 0.77 0.06 1.21 –0.31 0.76 0.36 0.66 Ex Excess2010 2.92 2.65 1.65 1.61 2.16 0.95 1.61 2.51 2.93 1.33 1.05 2.00 1.27 1.08 Ex Excess2011 –0.16 0.49 –0.32 –0.68 0.21 –0.41 –0.38 –0.06 0.02 –0.53 0.98 –0.81 –0.31 –0.23 Normal2012 1.00 0.16 1.31 1.84 1.13 1.55 2.06 1.42 1.70 1.13 –0.38 0.52 1.83 1.54 Ex Excess2013 0.51 –0.17 0.04 1.27 1.28 0.79 1.16 0.82 0.43 0.39 0.03 –0.24 –0.05 0.79 Normal
Source: ANACIM 2014.
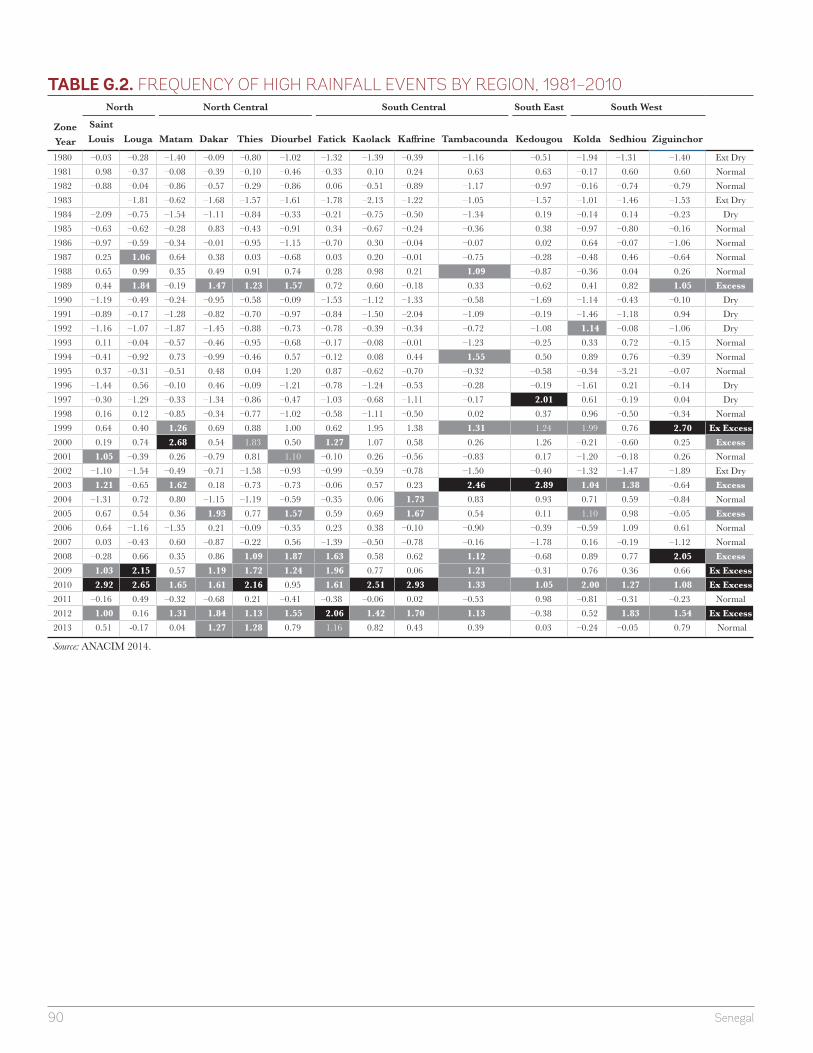
90 Senegal
TABLE G.2. FREQUENCY OF HIGH RAINFALL EVENTS BY REGION, 1981–2010
ZoneYear
North North Central South Central South East South West
Saint Louis Louga Matam Dakar Thies Diourbel Fatick Kaolack Kaff rine Tambacounda Kedougou Kolda Sedhiou Ziguinchor
1980 –0.03 –0.28 –1.40 –0.09 –0.80 –1.02 –1.32 –1.39 –0.39 –1.16 –0.51 –1.94 –1.31 –1.40 Ext Dry1981 0.98 –0.37 –0.08 –0.39 –0.10 –0.46 –0.33 0.10 0.24 0.63 0.63 –0.17 0.60 0.60 Normal1982 –0.88 –0.04 –0.86 –0.57 –0.29 –0.86 0.06 –0.51 –0.89 –1.17 –0.97 –0.16 –0.74 –0.79 Normal1983 –1.81 –0.62 –1.68 –1.57 –1.61 –1.78 –2.13 –1.22 –1.05 –1.57 –1.01 –1.46 –1.53 Ext Dry1984 –2.09 –0.75 –1.54 –1.11 –0.84 –0.33 –0.21 –0.75 –0.50 –1.34 0.19 –0.14 0.14 –0.23 Dry1985 –0.63 –0.62 –0.28 0.83 –0.43 –0.91 0.34 –0.67 –0.24 –0.36 0.38 –0.97 –0.80 –0.16 Normal1986 –0.97 –0.59 –0.34 –0.01 –0.95 –1.15 –0.70 0.30 –0.04 –0.07 0.02 0.64 –0.07 –1.06 Normal1987 0.25 1.06 0.64 0.38 0.03 –0.68 0.03 0.20 –0.01 –0.75 –0.28 –0.48 0.46 –0.64 Normal1988 0.65 0.99 0.35 0.49 0.91 0.74 0.28 0.98 0.21 1.09 –0.87 –0.36 0.04 0.26 Normal1989 0.44 1.84 –0.19 1.47 1.23 1.57 0.72 0.60 –0.18 0.33 –0.62 0.41 0.82 1.05 Excess1990 –1.19 –0.49 –0.24 –0.95 –0.58 –0.09 –1.53 –1.12 –1.33 –0.58 –1.69 –1.14 –0.43 –0.10 Dry1991 –0.89 –0.17 –1.28 –0.82 –0.70 –0.97 –0.84 –1.50 –2.04 –1.09 –0.19 –1.46 –1.18 0.94 Dry1992 –1.16 –1.07 –1.87 –1.45 –0.88 –0.73 –0.78 –0.39 –0.34 –0.72 –1.08 1.14 –0.08 –1.06 Dry1993 0.11 –0.04 –0.57 –0.46 –0.95 –0.68 –0.17 –0.08 –0.01 –1.23 –0.25 0.33 0.72 –0.15 Normal1994 –0.41 –0.92 0.73 –0.99 –0.46 0.57 –0.12 0.08 0.44 1.55 0.50 0.89 0.76 –0.39 Normal1995 0.37 –0.31 –0.51 0.48 0.04 1.20 0.87 –0.62 –0.70 –0.32 –0.58 –0.34 –3.21 –0.07 Normal1996 –1.44 0.56 –0.10 0.46 –0.09 –1.21 –0.78 –1.24 –0.53 –0.28 –0.19 –1.61 0.21 –0.14 Dry1997 –0.30 –1.29 –0.33 –1.34 –0.86 –0.47 –1.03 –0.68 –1.11 –0.17 2.01 0.61 –0.19 0.04 Dry1998 0.16 0.12 –0.85 –0.34 –0.77 –1.02 –0.58 –1.11 –0.50 0.02 0.37 0.96 –0.50 –0.34 Normal1999 0.64 0.40 1.26 0.69 0.88 1.00 0.62 1.95 1.38 1.31 1.24 1.99 0.76 2.70 Ex Excess2000 0.19 0.74 2.68 0.54 1.83 0.50 1.27 1.07 0.58 0.26 1.26 –0.21 –0.60 0.25 Excess2001 1.05 –0.39 0.26 –0.79 0.81 1.10 –0.10 0.26 –0.56 –0.83 0.17 –1.20 –0.18 0.26 Normal2002 –1.10 –1.54 –0.49 –0.71 –1.58 –0.93 –0.99 –0.59 –0.78 –1.50 –0.40 –1.32 –1.47 –1.89 Ext Dry2003 1.21 –0.65 1.62 0.18 –0.73 –0.73 –0.06 0.57 0.23 2.46 2.89 1.04 1.38 –0.64 Excess2004 –1.31 0.72 0.80 –1.15 –1.19 –0.59 –0.35 0.06 1.73 0.83 0.93 0.71 0.59 –0.84 Normal2005 0.67 0.54 0.36 1.93 0.77 1.57 0.59 0.69 1.67 0.54 0.11 1.10 0.98 –0.05 Excess2006 0.64 –1.16 –1.35 0.21 –0.09 –0.35 0.23 0.38 –0.10 –0.90 –0.39 –0.59 1.09 0.61 Normal2007 0.03 –0.43 0.60 –0.87 –0.22 0.56 –1.39 –0.50 –0.78 –0.16 –1.78 0.16 –0.19 –1.12 Normal2008 –0.28 0.66 0.35 0.86 1.09 1.87 1.63 0.58 0.62 1.12 –0.68 0.89 0.77 2.05 Excess2009 1.03 2.15 0.57 1.19 1.72 1.24 1.96 0.77 0.06 1.21 –0.31 0.76 0.36 0.66 Ex Excess2010 2.92 2.65 1.65 1.61 2.16 0.95 1.61 2.51 2.93 1.33 1.05 2.00 1.27 1.08 Ex Excess2011 –0.16 0.49 –0.32 –0.68 0.21 –0.41 –0.38 –0.06 0.02 –0.53 0.98 –0.81 –0.31 –0.23 Normal2012 1.00 0.16 1.31 1.84 1.13 1.55 2.06 1.42 1.70 1.13 –0.38 0.52 1.83 1.54 Ex Excess2013 0.51 -0.17 0.04 1.27 1.28 0.79 1.16 0.82 0.43 0.39 0.03 –0.24 –0.05 0.79 Normal
Source: ANACIM 2014.
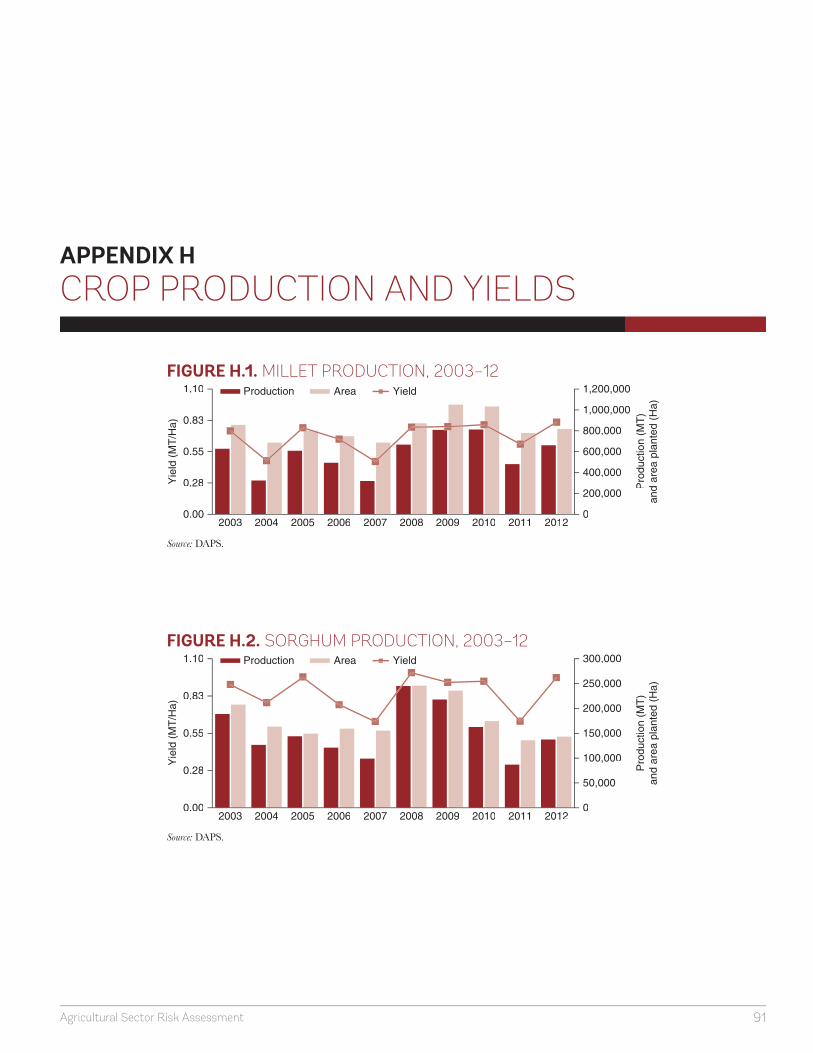
91Agricultural Sector Risk Assessment
APPENDIX H
CROP PRODUCTION AND YIELDS
0
200,000
400,000
600,000
800,000
1,000,000
1,200,000
0.00
0.28
0.55
0.83
1.10
2003 2004 2005 2006 2007 2008 2009 2010 2011 2012
Pro
duct
ion
(MT
)an
d ar
ea p
lant
ed (
Ha)
Yie
ld (
MT
/Ha)
Production Area Yield
FIGURE H.1. MILLET PRODUCTION, 2003–12
Source: DAPS.
2003 2004 2005 2006 2007 2008 2009 2010 2011 2012
Pro
duct
ion
(MT
)an
d ar
ea p
lant
ed (
Ha)
Yie
ld (
MT
/Ha)
0
50,000
100,000
150,000
200,000
250,000
300,000
0.00
0.28
0.55
0.83
1.10 Production Area Yield
FIGURE H.2. SORGHUM PRODUCTION, 2003–12
Source: DAPS.

92 Senegal
2003 2004 2005 2006 2007 2008 2009 2010 2011 2012
Pro
duct
ion
(MT
)an
d ar
ea p
lant
ed (
Ha)
Yie
ld (
MT
/Ha)
0
50,000
100,000
150,000
200,000
250,000
300,000
0.00
0.28
0.55 Production Area Yield
FIGURE H.3. COWPEA PRODUCTION, 2003–12
Source: DAPS.
2003 2004 2005 2006 2007 2008 2009 2010 2011 2012
Pro
duct
ion
(MT
)an
d ar
ea p
lant
ed (
Ha)
Yie
ld (
MT
/Ha)
050,000100,000150,000200,000250,000300,000350,000
450,000400,000
0.00
1.00
2.00
3.00
4.00
5.00 Production Area Yield
FIGURE H.4. RICE PRODUCTION, 2003–12
Source: DAPS.
0
325,000
650,000
975,000
1,300,000
1,625,000
0.00
0.28
0.55
0.83
1.38
1.10
2003 2004 2005 2006 2007 2008 2009 2010 2011 2012
Pro
duct
ion
(MT
)an
d ar
ea p
lant
ed (
Ha)
Yie
ld (
MT
/Ha)
FIGURE H.5. MAIZE PRODUCTION, 2003–12
Source: DAPS.
2003 2004 2005 2006 2007 2008 2009 2010 2011 2012
Pro
duct
ion
(MT
)an
d ar
ea p
lant
ed (
Ha)
Yie
ld (
MT
/Ha)
0
1,625,000
1,300,000
975,000
650,000
325,000
0.000
0.275
0.55
0.825
1.1
1.375
FIGURE H.6. GROUNDNUT PRODUCTION, 2003–12
Source: DAPS.

93Agricultural Sector Risk Assessment
2003 2004 2005 2006 2007 2008 2009 2010 2011 2012
Pro
duct
ion
(MT
)an
d ar
ea p
lant
ed (
Ha)
Yie
ld (
MT
/Ha)
0
60,000
45,000
30,000
15,000
0.00
1.50
1.20
0.90
0.60
0.30
FIGURE H.7. COTTON PRODUCTION, 2003–12
Source: DAPS.
20032002 2004 2005 2006 2007 2008 2009 2010 2011
Pro
duct
ion
(MT
)an
d ar
ea p
lant
ed (
Ha)
Yie
ld (
MT
/Ha)
200,000
150,000
100,000
50,000
00
10
20
30
40
FIGURE H.8. ONION PRODUCTION, 2002–11
Source: DAPS.
20032002 2004 2005 2006 2007 2008 2009 2010 2011
Pro
duct
ion
(MT
)an
d ar
ea p
lant
ed (
Ha)
Yie
ld (
MT
/Ha)
225,000
180,000
135,000
90,000
45,000
00
15
30
45
60
FIGURE H.9. TOMATO PRODUCTION, 2002–11
Source: DAPS.
20032002 2004 2005 2006 2007 2008 2009 2010 20122011
Pro
duct
ion
(MT
)an
d ar
ea p
lant
ed (
Ha)
Yie
ld (
MT
/Ha)
22,500
18,000
13,500
9,000
4,500
00
10
20
30
40 Production (MT) Area planted (Ha) Yield (MT/Ha)
FIGURE H.10. POTATO PRODUCTION, 2003–12
Source: DAPS.

94 Senegal
20032002 2004 2005 2006 2007 2008 2009 2010 2011
Pro
duct
ion
(MT
)an
d ar
ea p
lant
ed (
Ha)
Yie
ld (
MT
/Ha)
150,000
120,000
90,000
60,000
30,000
00.0
5.0
2.5
7.5
10.0
12.5
FIGURE H.11. MANGO PRODUCTION, 2002–11
Source: DAPS.
20032002 2004 2005 2006 2007 2008 2009 2010 2011
Pro
duct
ion
(MT
)an
d ar
ea p
lant
ed (
Ha)
Yie
ld (
MT
/Ha)
14,000
10,500
7,000
3,500
00.0
3.8
7.5
11.3
15.0
FIGURE H.12. GREEN BEAN PRODUCTION, 2002–11
Source: DAPS.


1818 H Street, NW
Washington, D.C. 20433 USA
Telephone: 202-473-1000
Internet: www.worldbank.org/agriculture
W O R L D B A N K G R O U P R E P O R T N U M B E R 96296-SN
A G R I C U L T U R E G L O B A L P R A C T I C E T E C H N I C A L A S S I S T A N C E P A P E R