5.5 selection of software tools - eth zurich · 5.5 selection of software tools ... actions in a...
TRANSCRIPT
5.5 Selection of Software Tools
Dimensions of Software
1) Statistical capabilities
2) Data Mining
3) Simulation
4) Optimization
5) Visualization / Reporting
Others: User-friendliness, costs (cost of license vs. open-source), maintenance, transparency,…
25.11.2015Data Analytics in Organisations and Business - Dr. Isabelle
Flückiger300
5.5 Selection of Software Tools
25.11.2015Data Analytics in Organisations and Business - Dr. Isabelle
Flückiger301
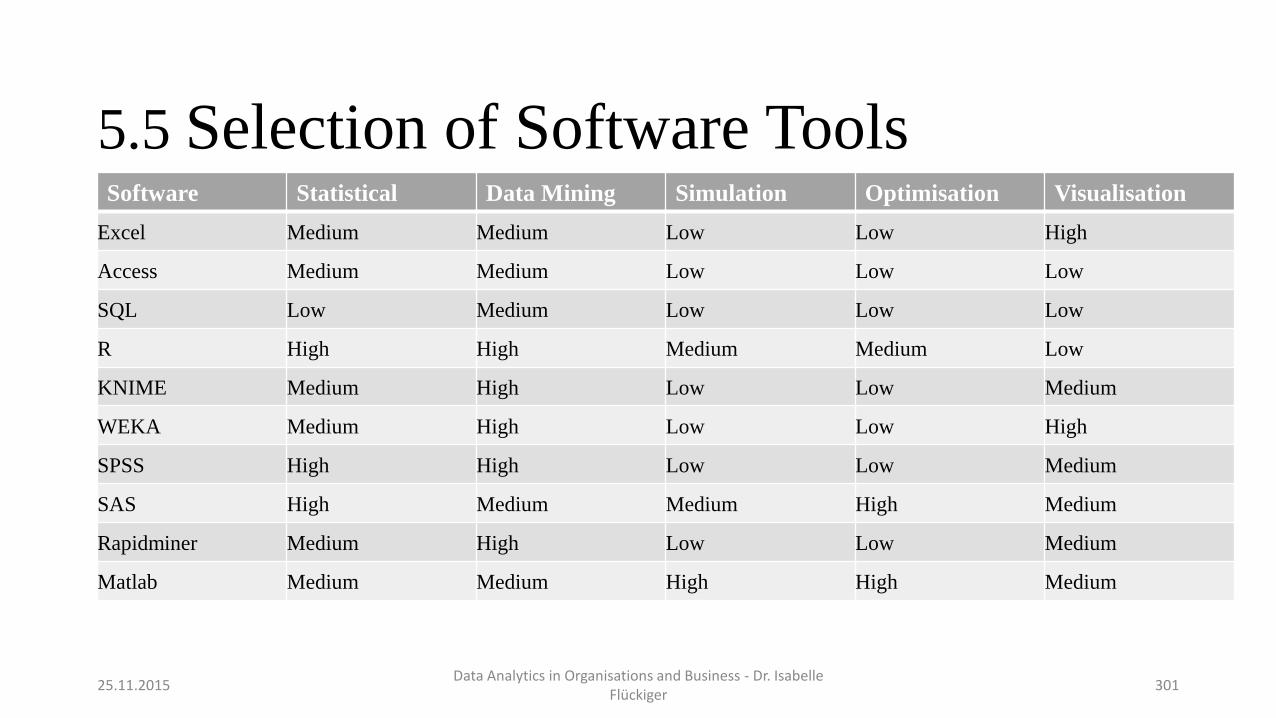
Software Statistical Data Mining Simulation Optimisation Visualisation
Excel Medium Medium Low Low High
Access Medium Medium Low Low Low
SQL Low Medium Low Low Low
R High High Medium Medium Low
KNIME Medium High Low Low Medium
WEKA Medium High Low Low High
SPSS High High Low Low Medium
SAS High Medium Medium High Medium
Rapidminer Medium High Low Low Medium
Matlab Medium Medium High High Medium
5.5 Selection of Software Tools
25.11.2015Data Analytics in Organisations and Business - Dr. Isabelle
Flückiger302
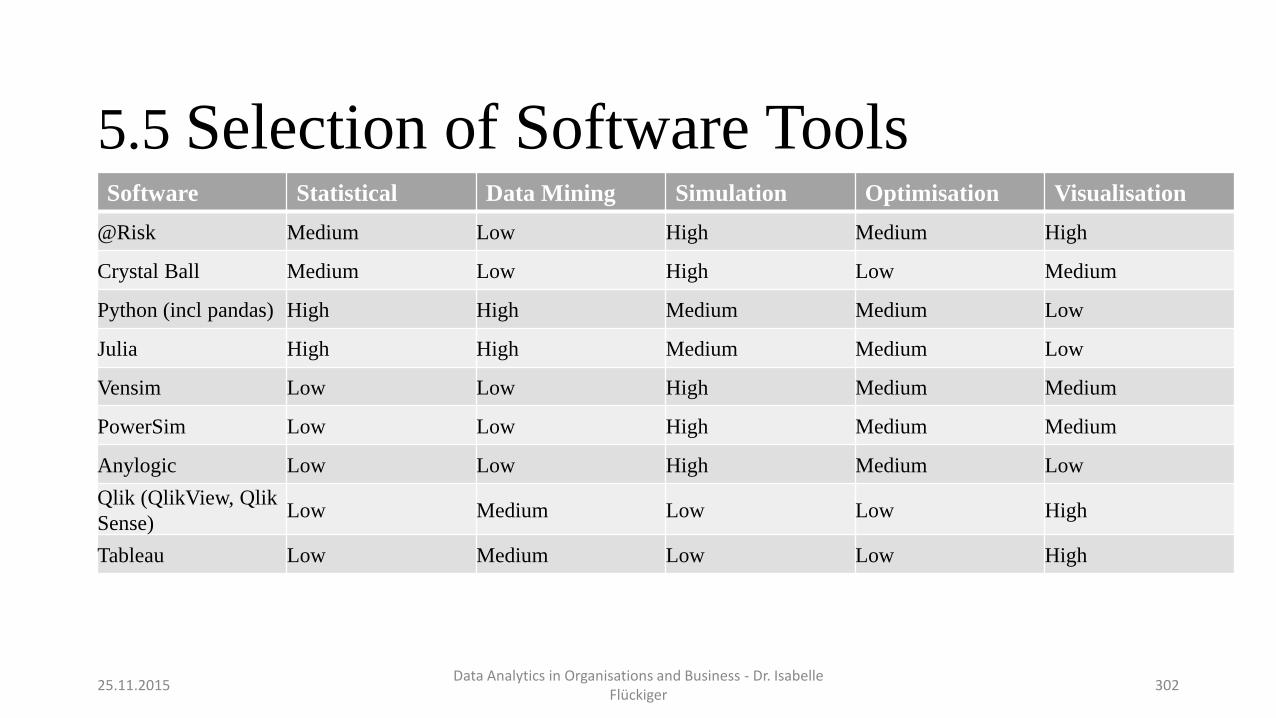
Software Statistical Data Mining Simulation Optimisation Visualisation
@Risk Medium Low High Medium High
Crystal Ball Medium Low High Low Medium
Python (incl pandas) High High Medium Medium Low
Julia High High Medium Medium Low
Vensim Low Low High Medium Medium
PowerSim Low Low High Medium Medium
Anylogic Low Low High Medium Low
Qlik (QlikView, Qlik
Sense)Low Medium Low Low High
Tableau Low Medium Low Low High
5.5 Selection of Software Tools
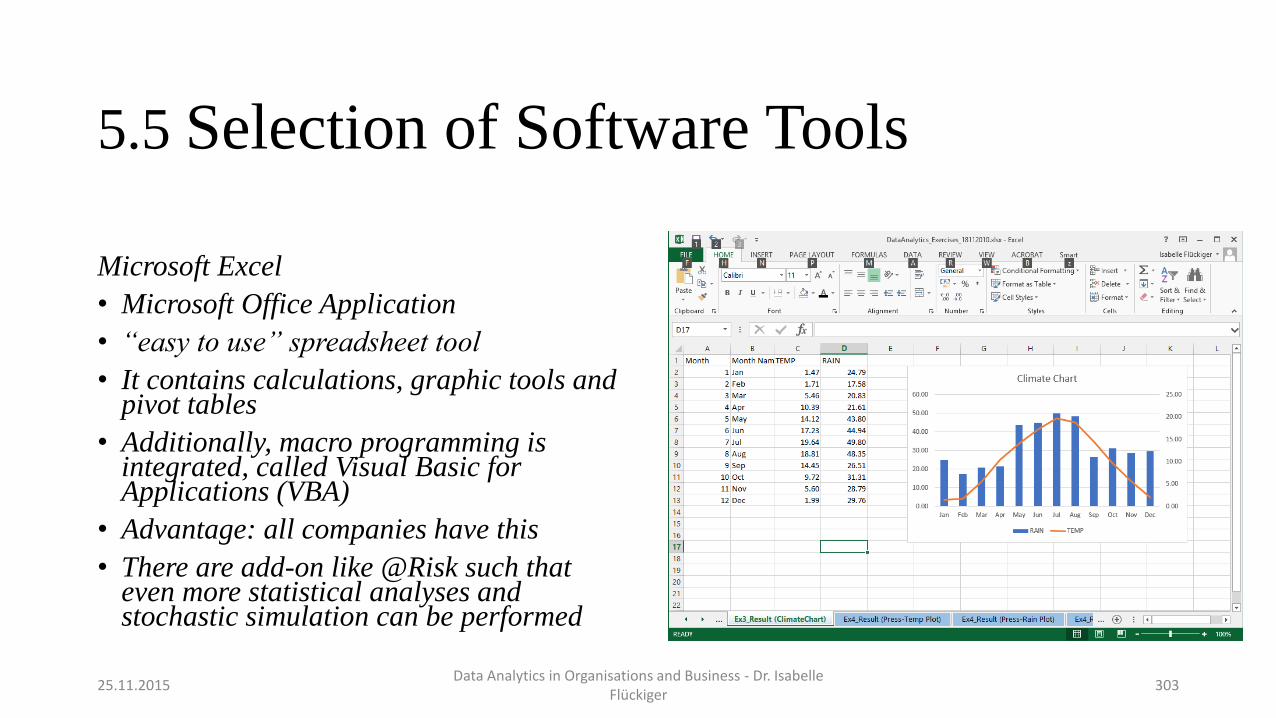
Microsoft Excel
• Microsoft Office Application
• “easy to use” spreadsheet tool
• It contains calculations, graphic tools and pivot tables
• Additionally, macro programming is integrated, called Visual Basic for Applications (VBA)
• Advantage: all companies have this
• There are add-on like @Risk such that even more statistical analyses and stochastic simulation can be performed
25.11.2015Data Analytics in Organisations and Business - Dr. Isabelle
Flückiger303
5.5 Selection of Software Tools
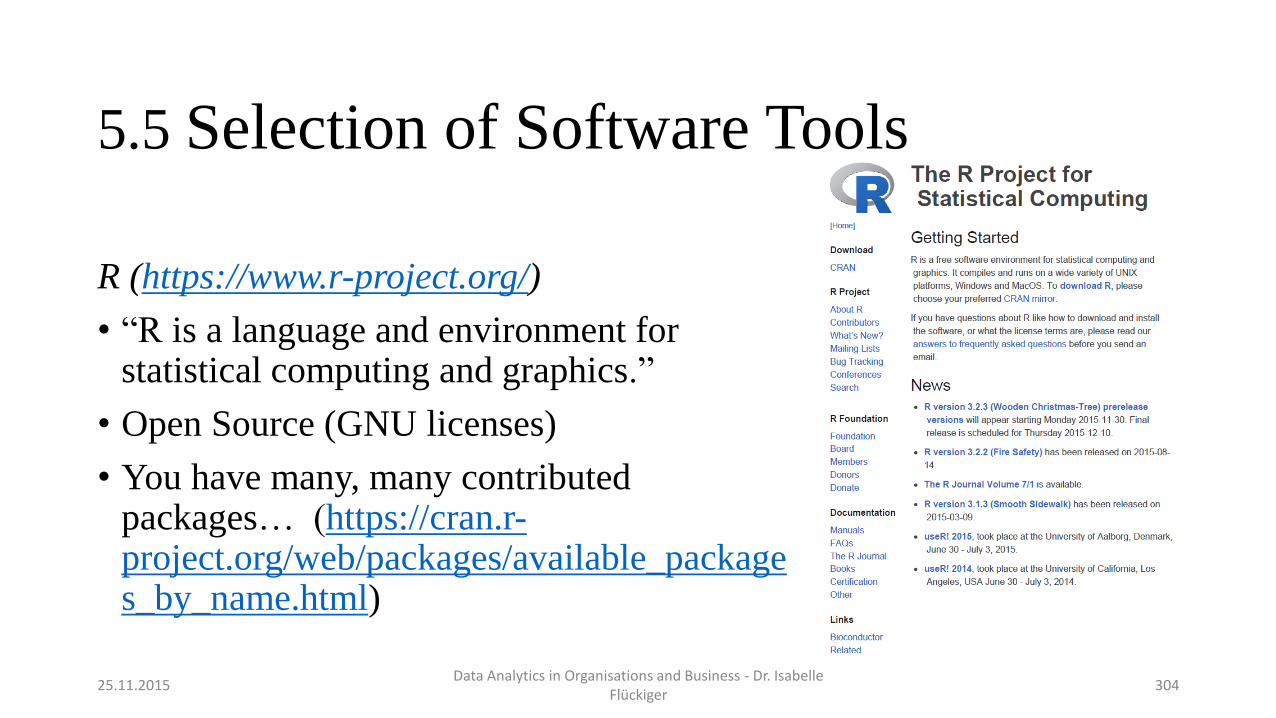
R (https://www.r-project.org/)
• “R is a language and environment for statistical computing and graphics.”
• Open Source (GNU licenses)
• You have many, many contributed packages… (https://cran.r-project.org/web/packages/available_packages_by_name.html)
25.11.2015Data Analytics in Organisations and Business - Dr. Isabelle
Flückiger304
5.5 Selection of Software Tools
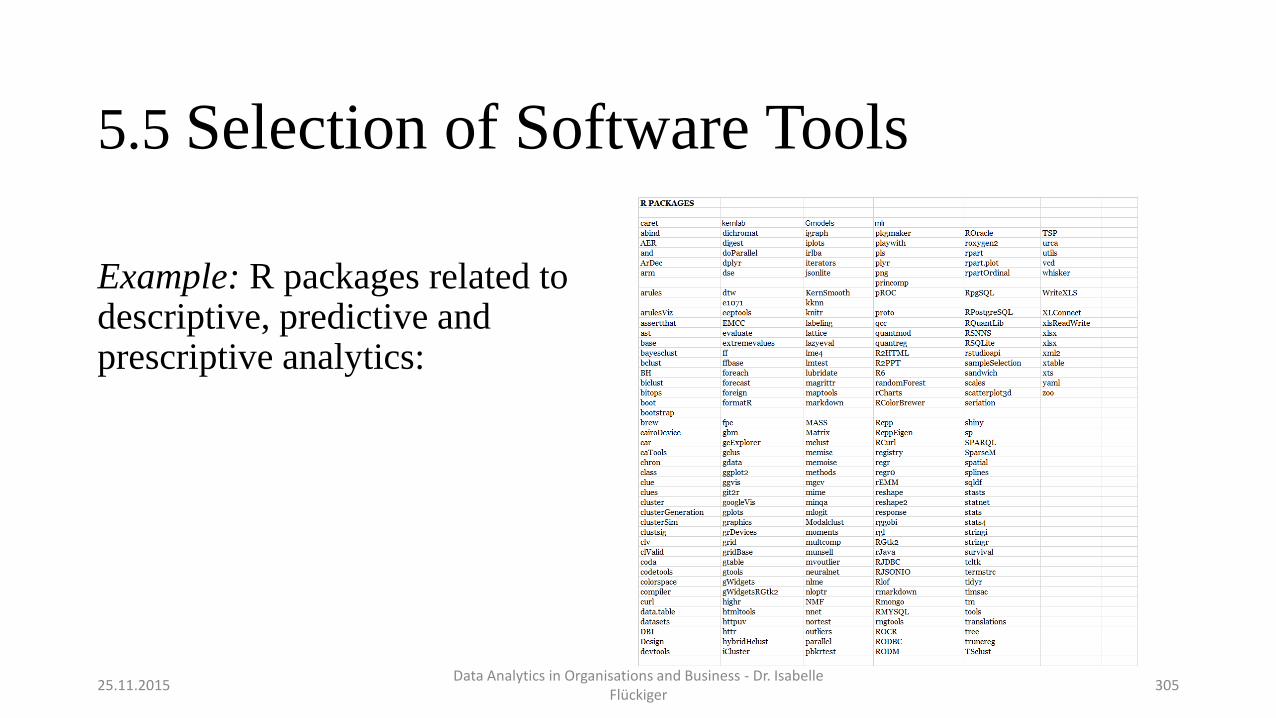
Example: R packages related to descriptive, predictive and prescriptive analytics:
25.11.2015Data Analytics in Organisations and Business - Dr. Isabelle
Flückiger305
5.5 Selection of Software Tools
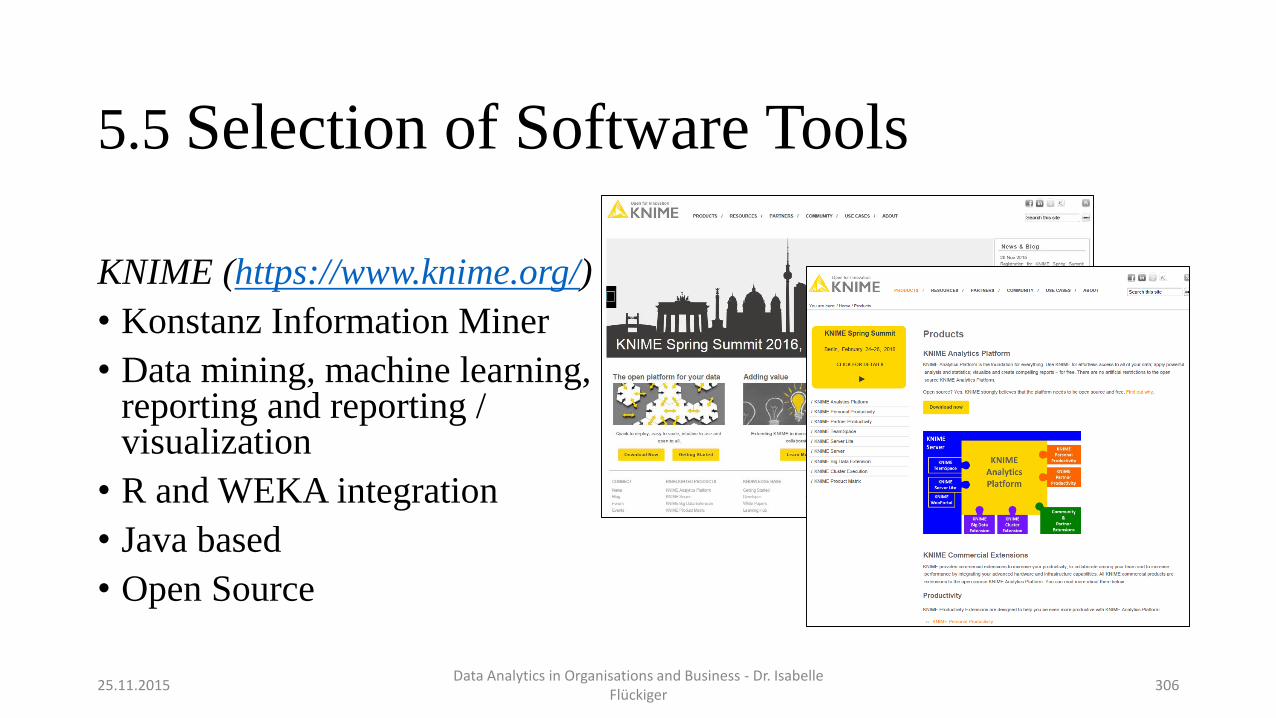
KNIME (https://www.knime.org/)
• Konstanz Information Miner
• Data mining, machine learning, reporting and reporting / visualization
• R and WEKA integration
• Java based
• Open Source
25.11.2015Data Analytics in Organisations and Business - Dr. Isabelle
Flückiger306
5.5 Selection of Software Tools
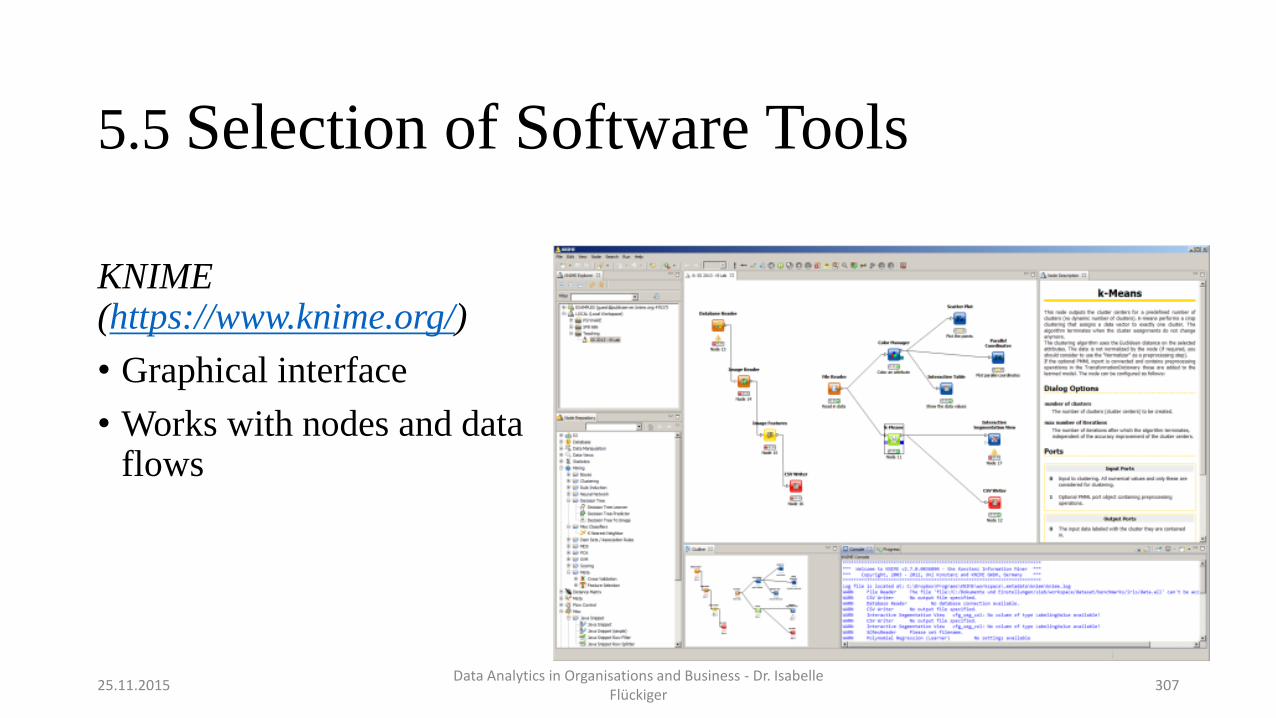
KNIME (https://www.knime.org/)
• Graphical interface
• Works with nodes and data flows
25.11.2015Data Analytics in Organisations and Business - Dr. Isabelle
Flückiger307
5.5 Selection of Software Tools
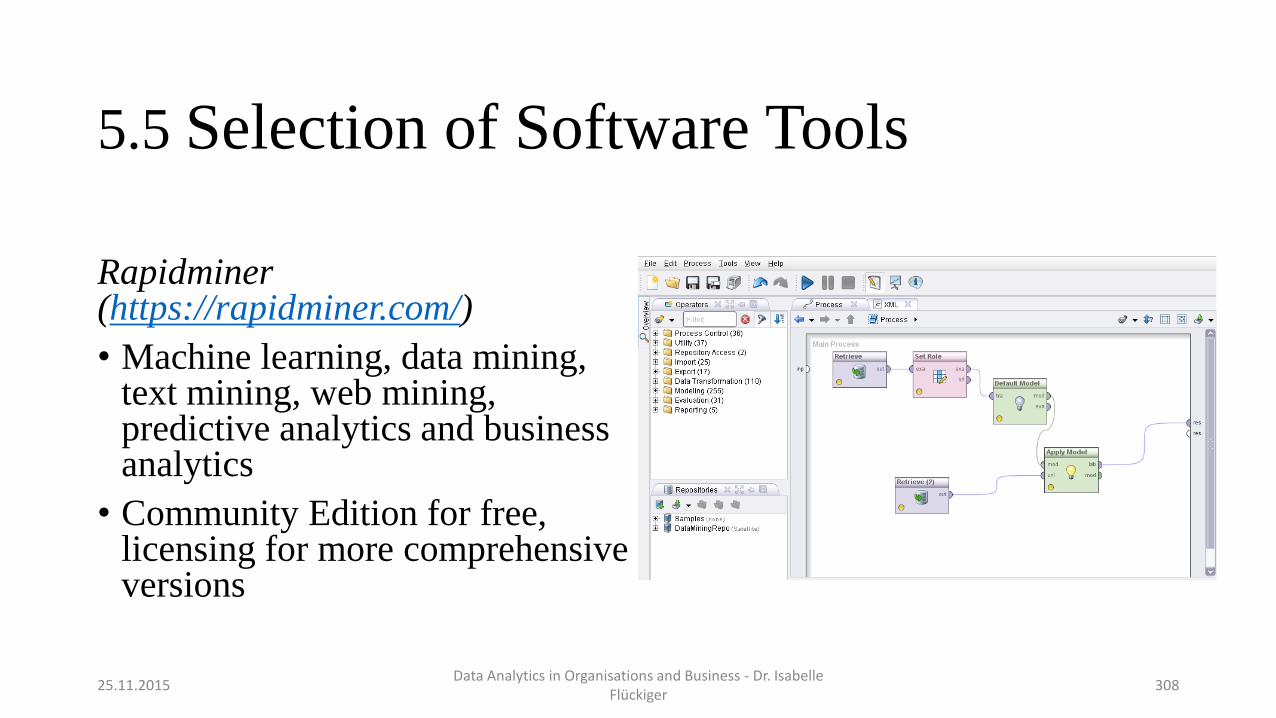
Rapidminer(https://rapidminer.com/)
• Machine learning, data mining, text mining, web mining, predictive analytics and business analytics
• Community Edition for free, licensing for more comprehensive versions
25.11.2015Data Analytics in Organisations and Business - Dr. Isabelle
Flückiger308
5.5 Selection of Software Tools
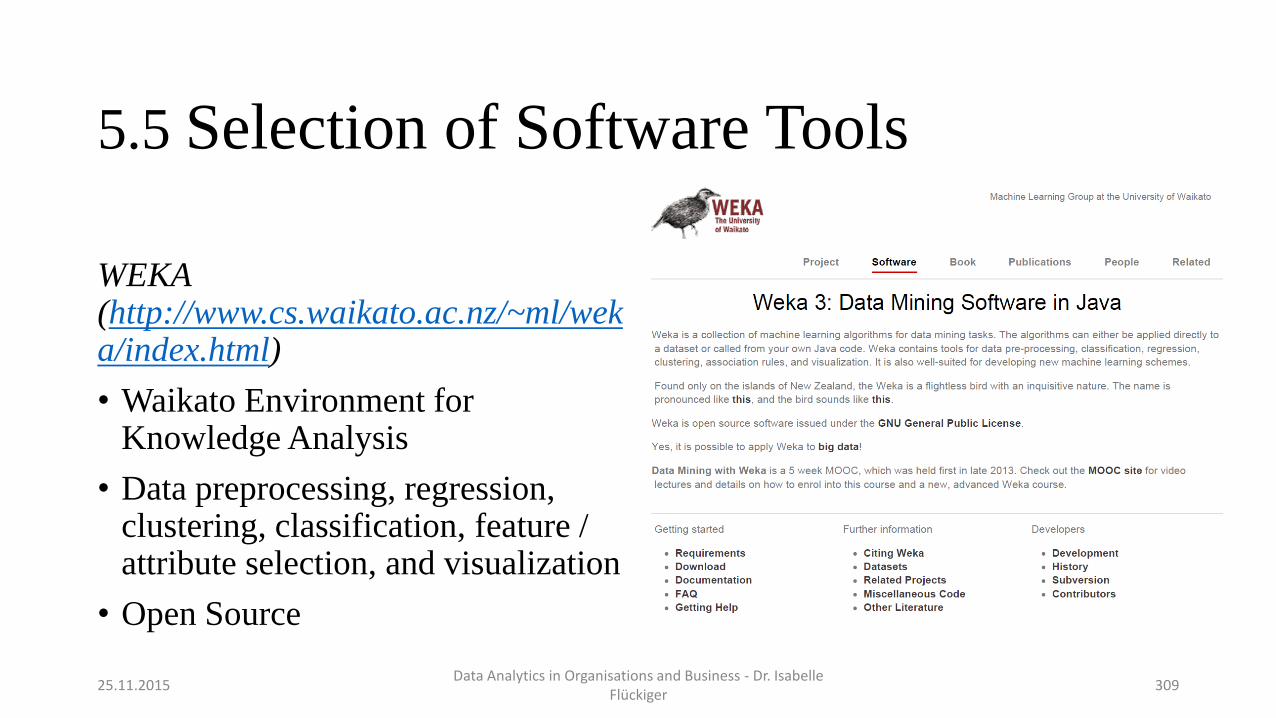
WEKA (http://www.cs.waikato.ac.nz/~ml/weka/index.html)
• Waikato Environment for Knowledge Analysis
• Data preprocessing, regression, clustering, classification, feature / attribute selection, and visualization
• Open Source
25.11.2015Data Analytics in Organisations and Business - Dr. Isabelle
Flückiger309
5.5 Selection of Software Tools
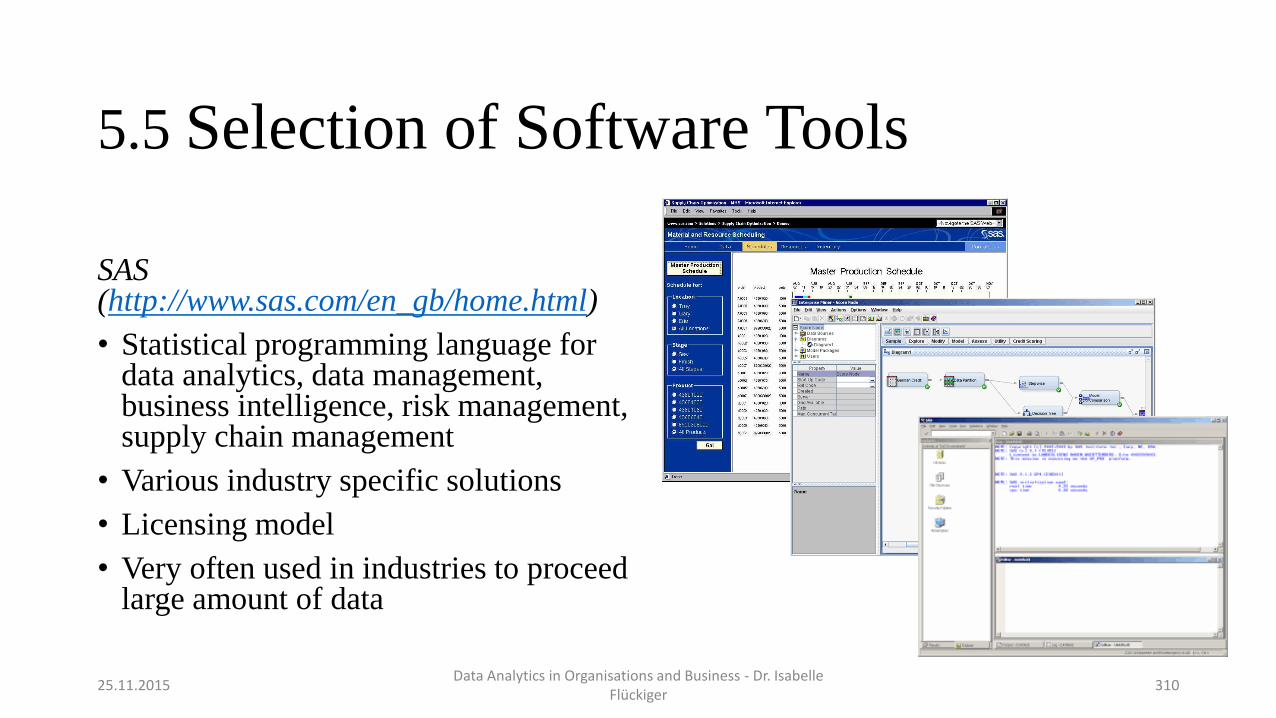
SAS (http://www.sas.com/en_gb/home.html)
• Statistical programming language for data analytics, data management, business intelligence, risk management, supply chain management
• Various industry specific solutions
• Licensing model
• Very often used in industries to proceed large amount of data
25.11.2015Data Analytics in Organisations and Business - Dr. Isabelle
Flückiger310
5.5 Selection of Software Tools
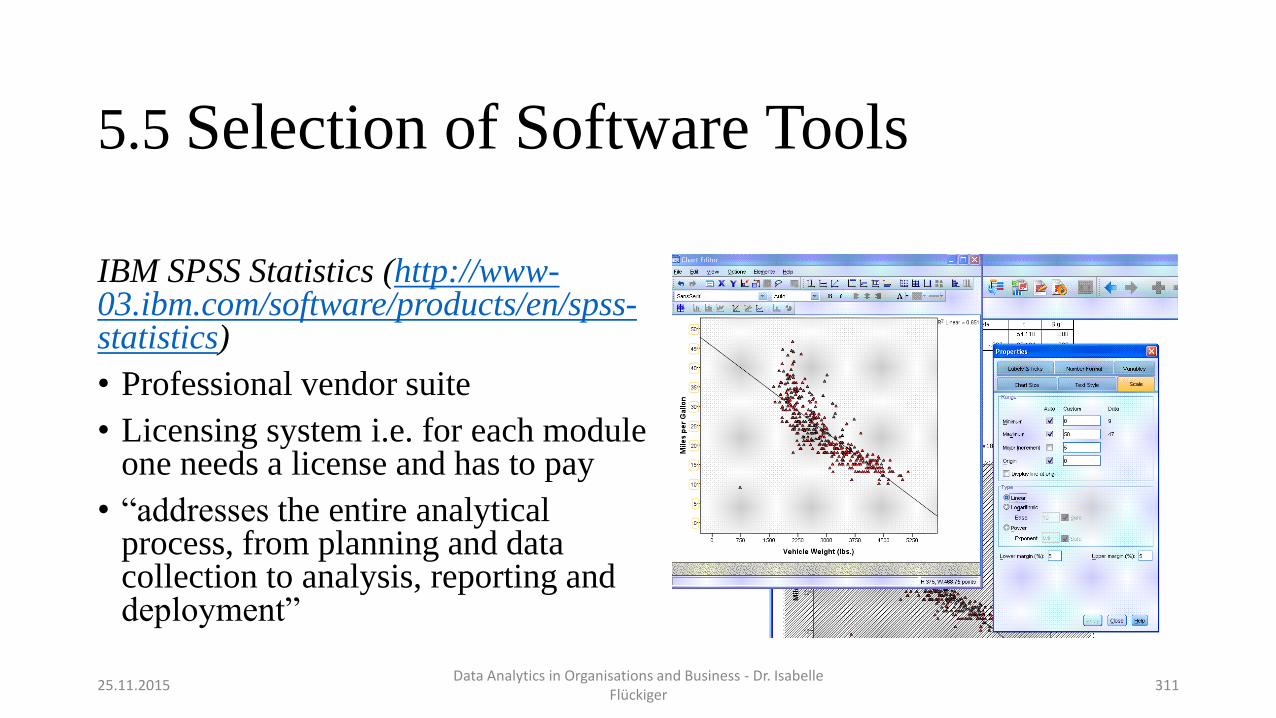
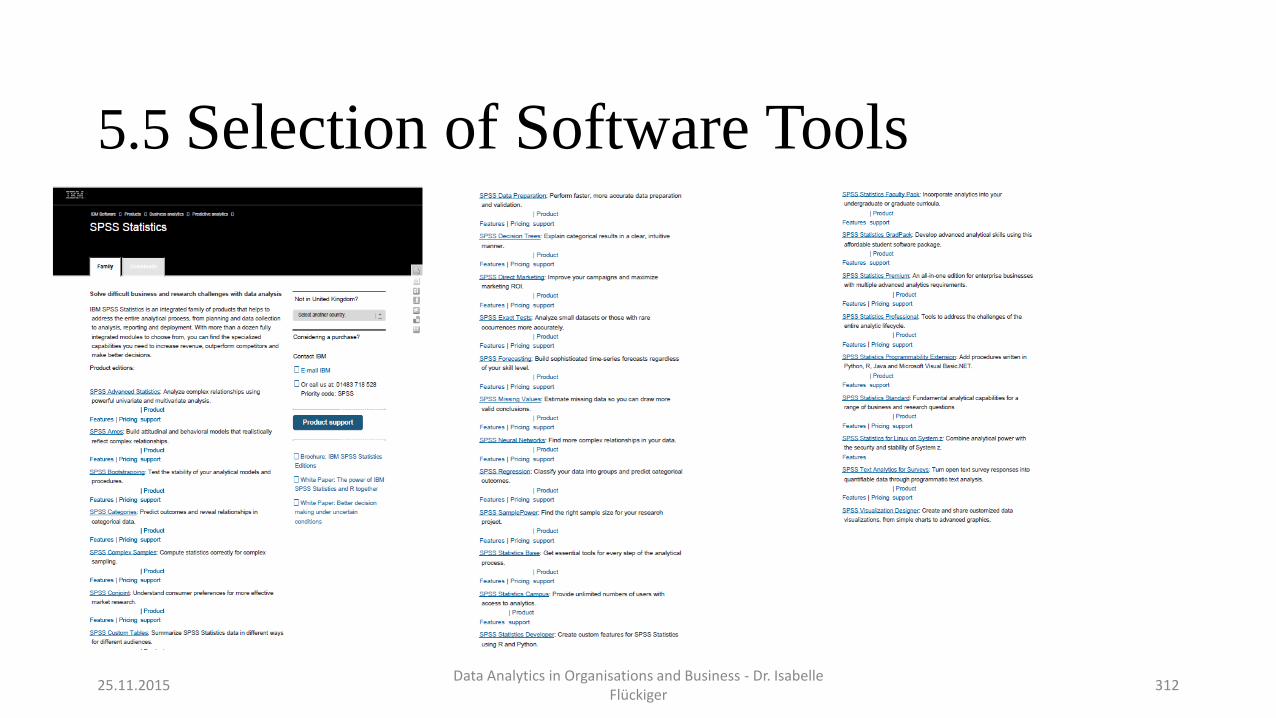
IBM SPSS Statistics (http://www-03.ibm.com/software/products/en/spss-statistics)
• Professional vendor suite
• Licensing system i.e. for each module one needs a license and has to pay
• “addresses the entire analytical process, from planning and data collection to analysis, reporting and deployment”
25.11.2015Data Analytics in Organisations and Business - Dr. Isabelle
Flückiger311
5.5 Selection of Software Tools
25.11.2015Data Analytics in Organisations and Business - Dr. Isabelle
Flückiger312
5.5 Selection of Software Tools
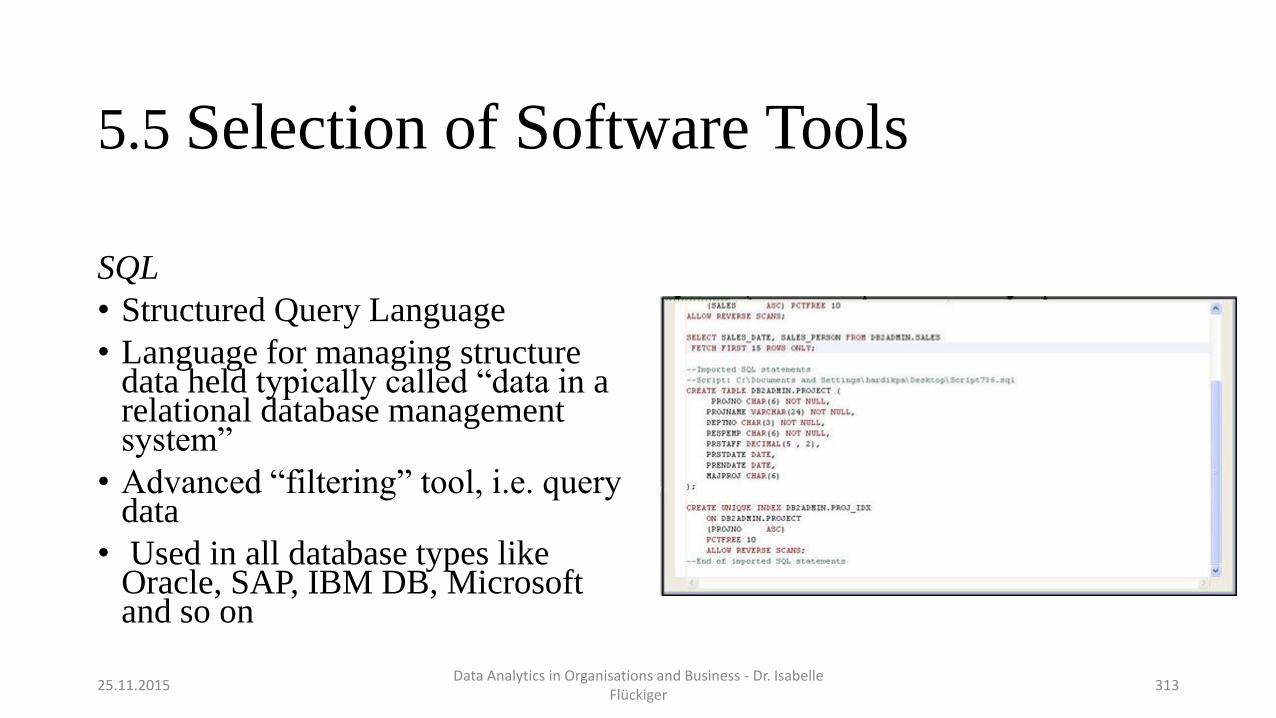
SQL
• Structured Query Language
• Language for managing structure data held typically called “data in a relational database management system”
• Advanced “filtering” tool, i.e. query data
• Used in all database types like Oracle, SAP, IBM DB, Microsoft and so on
25.11.2015Data Analytics in Organisations and Business - Dr. Isabelle
Flückiger313
5.5 Selection of Software Tools
25.11.2015Data Analytics in Organisations and Business - Dr. Isabelle
Flückiger314
And there are many more programming languages or frameworks used like
• Apache Hadoop: open-source software framework in Java “for distributed storage and distributed processing of very large data sets”
• .NET Framework: it is a software framework developed by Microsoft and includes user interfaces, data access management, database connectivity, cryptography, web application development, numeric algorithms and network communications. E.g C# is one part of it.
• Java
• Julia (http://julialang.org/): high-level dynamic programming language used for scientific computing, machine learning, data mining, large-scale linear algebra, distributed and parallel computing; it is a very efficient and effective language.
• and so on
5.5 Selection of Software Tools
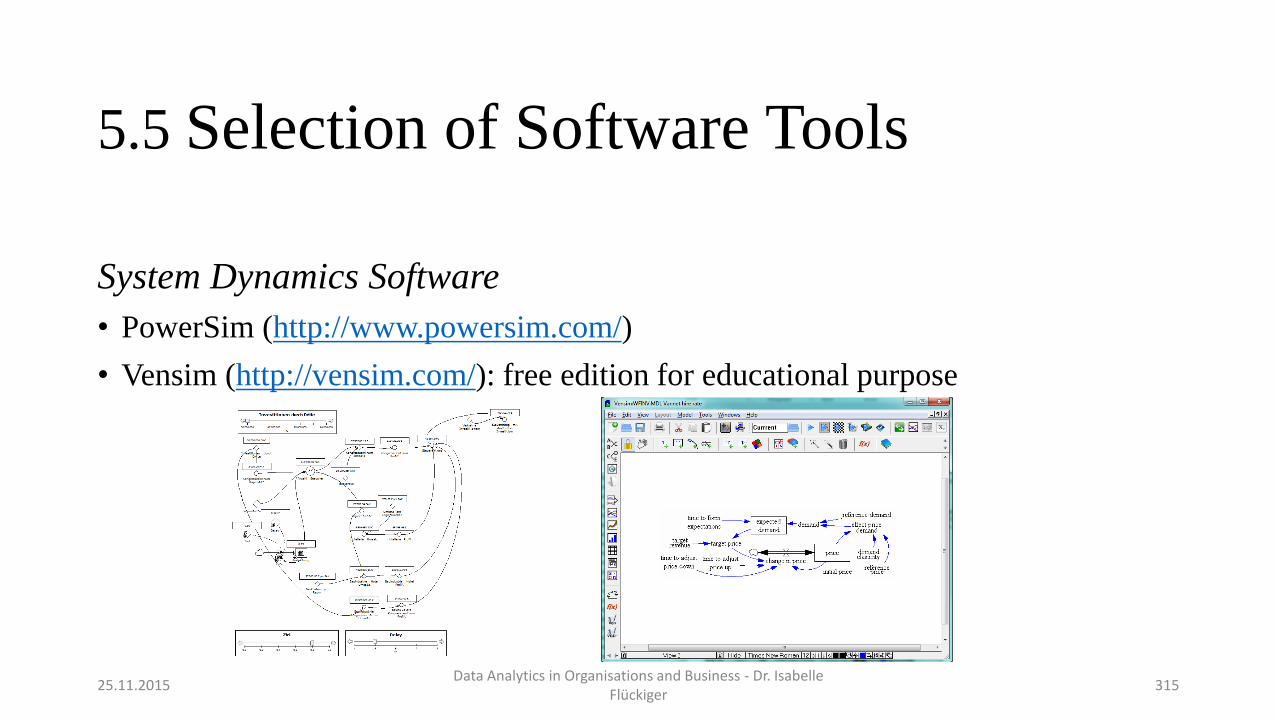
System Dynamics Software
• PowerSim (http://www.powersim.com/)
• Vensim (http://vensim.com/): free edition for educational purpose
25.11.2015Data Analytics in Organisations and Business - Dr. Isabelle
Flückiger315
Excurse System Dynamics
What is System Dynamics?
System Dynamics (SD) is a methodology for framing, modelling and understanding the dynamic of complex system.
It is used for the understanding of non-linear behavior of systems.
It is finally a tool to support us in system thinking.
25.11.2015Data Analytics in Organisations and Business - Dr. Isabelle
Flückiger316
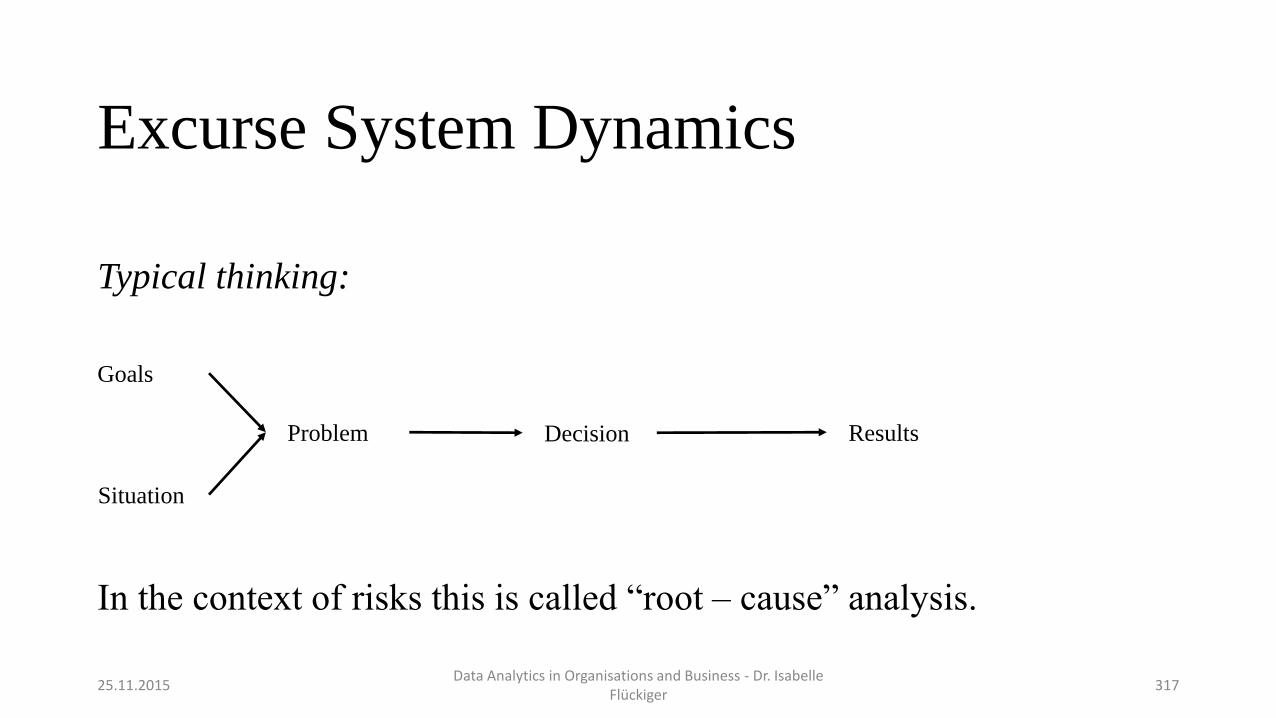
Typical thinking:
In the context of risks this is called “root – cause” analysis.
Excurse System Dynamics
25.11.2015Data Analytics in Organisations and Business - Dr. Isabelle
Flückiger317
Goals
Situation
Problem Decision Results
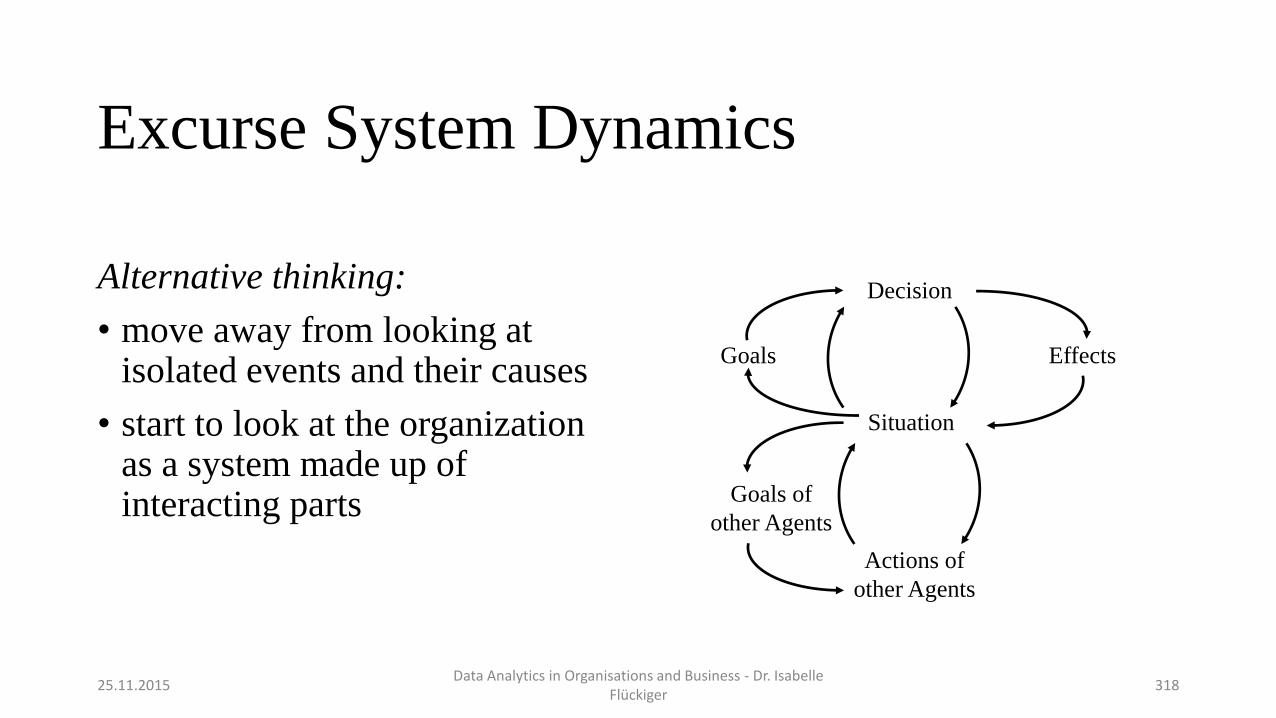
Alternative thinking:
• move away from looking at isolated events and their causes
• start to look at the organization as a system made up of interacting parts
Excurse System Dynamics
25.11.2015Data Analytics in Organisations and Business - Dr. Isabelle
Flückiger318
Goals
Situation
Effects
Decision
Goals of
other Agents
Actions of
other Agents
Excurse System Dynamics
Why system thinking is important?
Today’s world and the business problem one has to solve are
• Dynamic and evolving over time
• Non-linear
• Have accumulations and delays
• And have typically feedback loops
25.11.2015Data Analytics in Organisations and Business - Dr. Isabelle
Flückiger319
Excurse System Dynamics
Patterns of Behavior
First, one is considering patterns of behavior of the variables that characterize the problem and/or situation.
In a business context such variables are:
• Costs• Sales• Revenue• Profit• Market share• Risk• And so on
25.11.2015Data Analytics in Organisations and Business - Dr. Isabelle
Flückiger320
Excurse System Dynamics
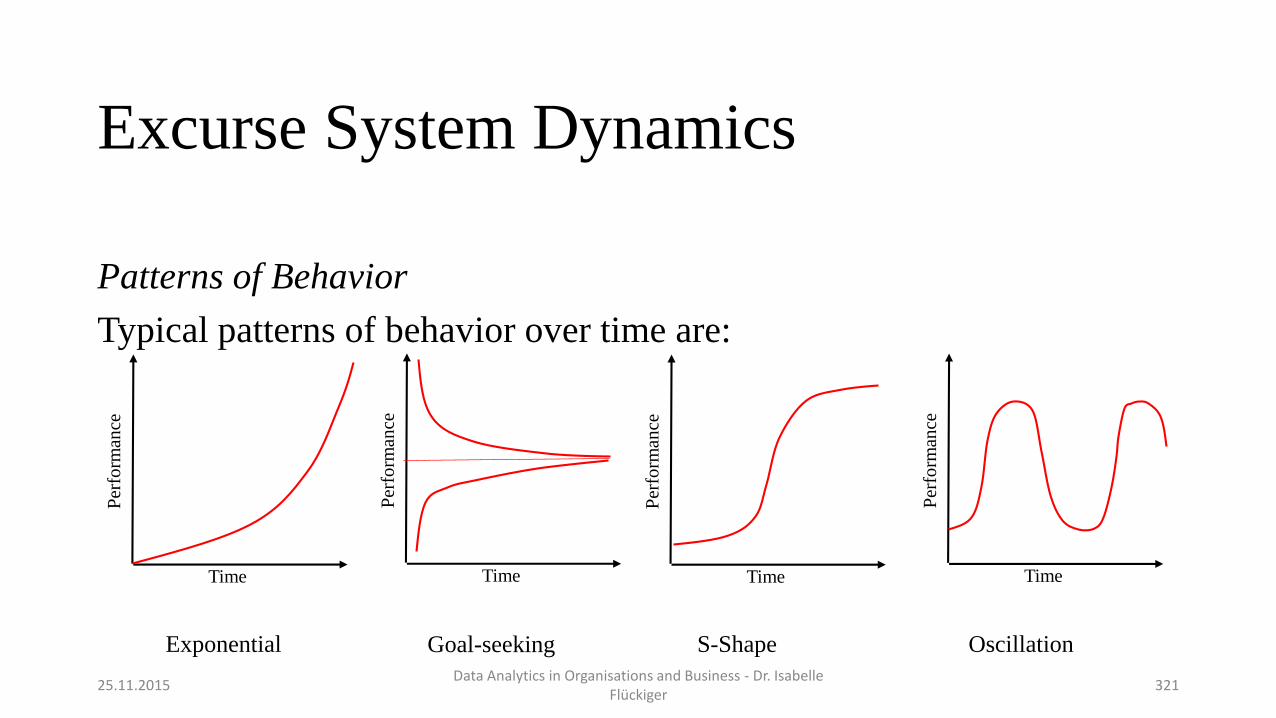
Patterns of Behavior
Typical patterns of behavior over time are:
25.11.2015Data Analytics in Organisations and Business - Dr. Isabelle
Flückiger321
Time
Per
form
ance
Time
Per
form
ance
Time
Per
form
ance
Time
Per
form
ance
Exponential Goal-seeking S-Shape Oscillation
Excurse System Dynamics
Patterns of Behavior
Common combinations of these four patterns:
• Exponential growth combined with oscillation
• Goal-seeking behavior combined with an oscillation whose amplitude gradually declines over time
• S-shaped growth combined with an oscillation whose amplitude gradually declines over time
25.11.2015Data Analytics in Organisations and Business - Dr. Isabelle
Flückiger322
Excurse System Dynamics
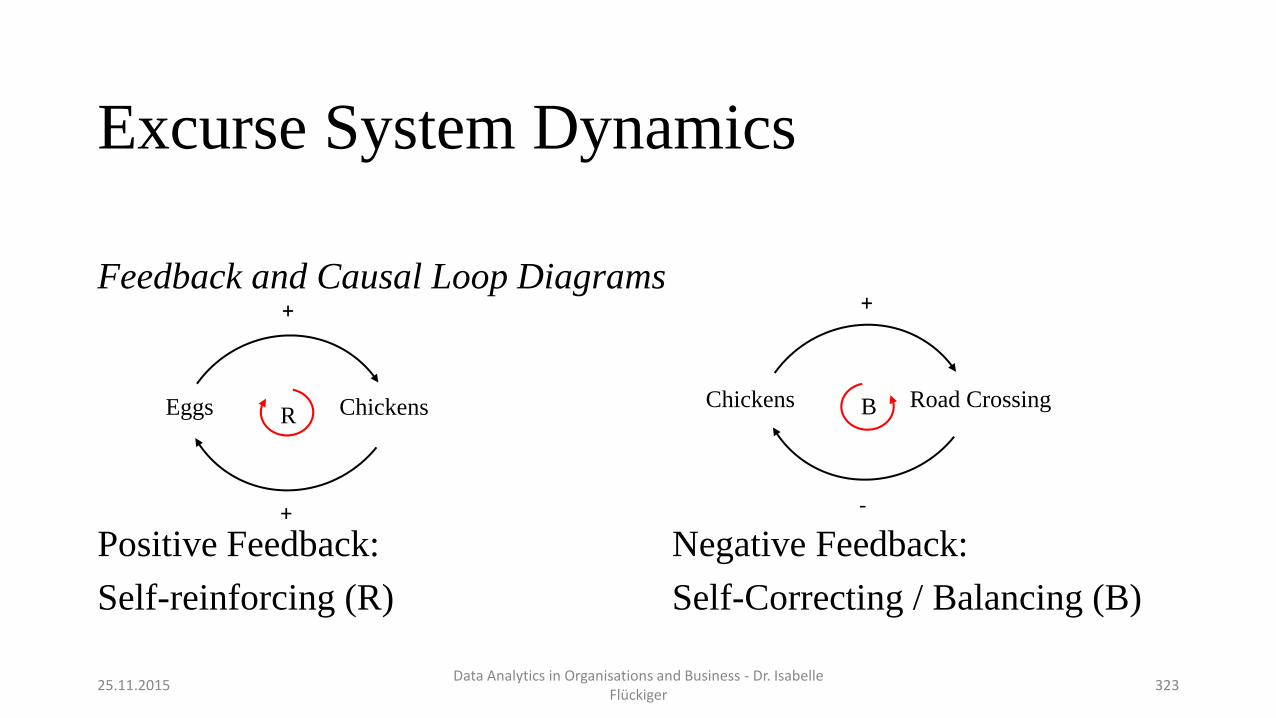
Feedback and Causal Loop Diagrams
Positive Feedback: Negative Feedback:
Self-reinforcing (R) Self-Correcting / Balancing (B)
25.11.2015Data Analytics in Organisations and Business - Dr. Isabelle
Flückiger323
Eggs Chickens
+
+
RChickens Road Crossing
+
-
B
Excurse System Dynamics
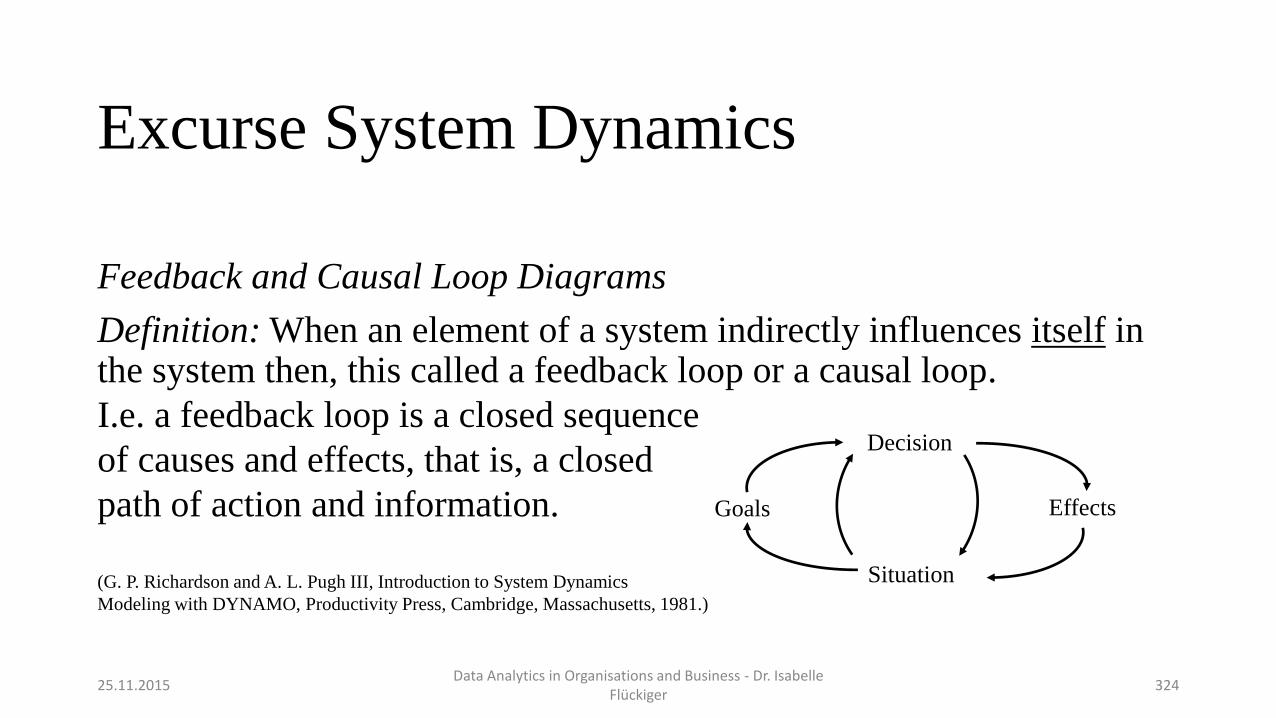
Feedback and Causal Loop Diagrams
Definition: When an element of a system indirectly influences itself in the system then, this called a feedback loop or a causal loop.
I.e. a feedback loop is a closed sequence
of causes and effects, that is, a closed
path of action and information.
(G. P. Richardson and A. L. Pugh III, Introduction to System Dynamics
Modeling with DYNAMO, Productivity Press, Cambridge, Massachusetts, 1981.)
25.11.2015Data Analytics in Organisations and Business - Dr. Isabelle
Flückiger324
Goals
Situation
Effects
Decision
Excurse System Dynamics
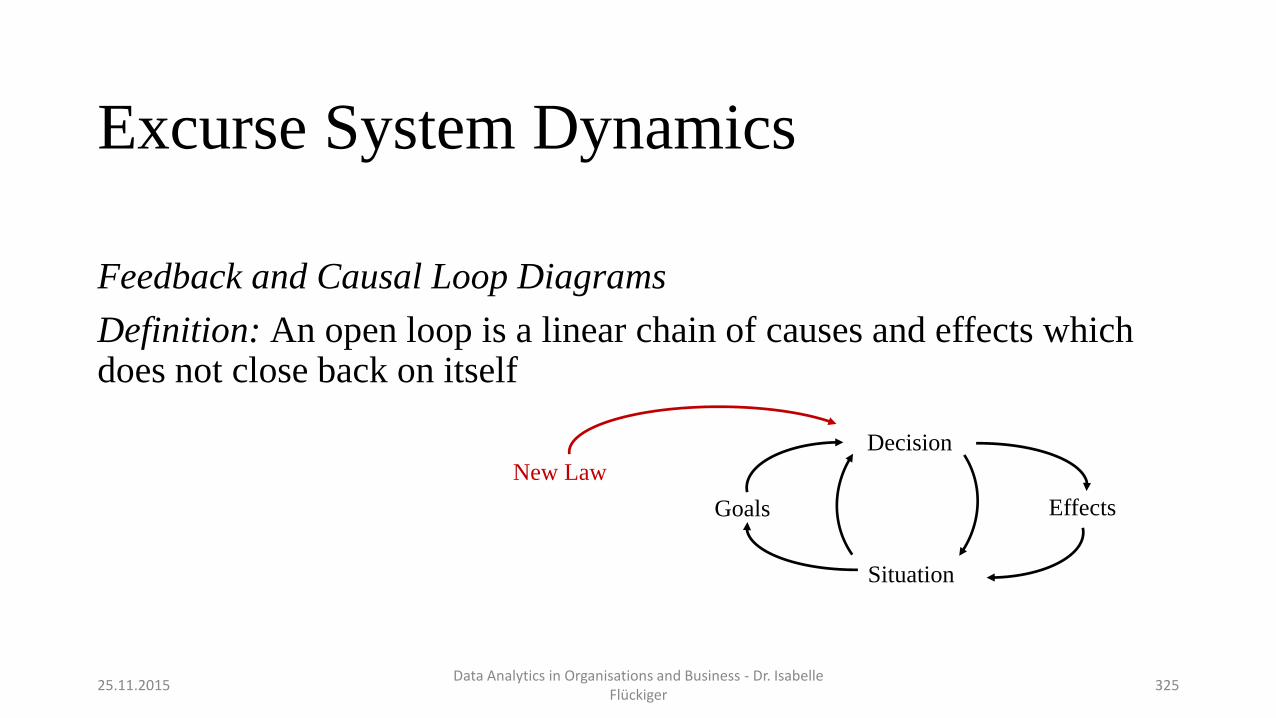
Feedback and Causal Loop Diagrams
Definition: An open loop is a linear chain of causes and effects which does not close back on itself
25.11.2015Data Analytics in Organisations and Business - Dr. Isabelle
Flückiger325
Goals
Situation
Effects
Decision
New Law
Excurse System Dynamics
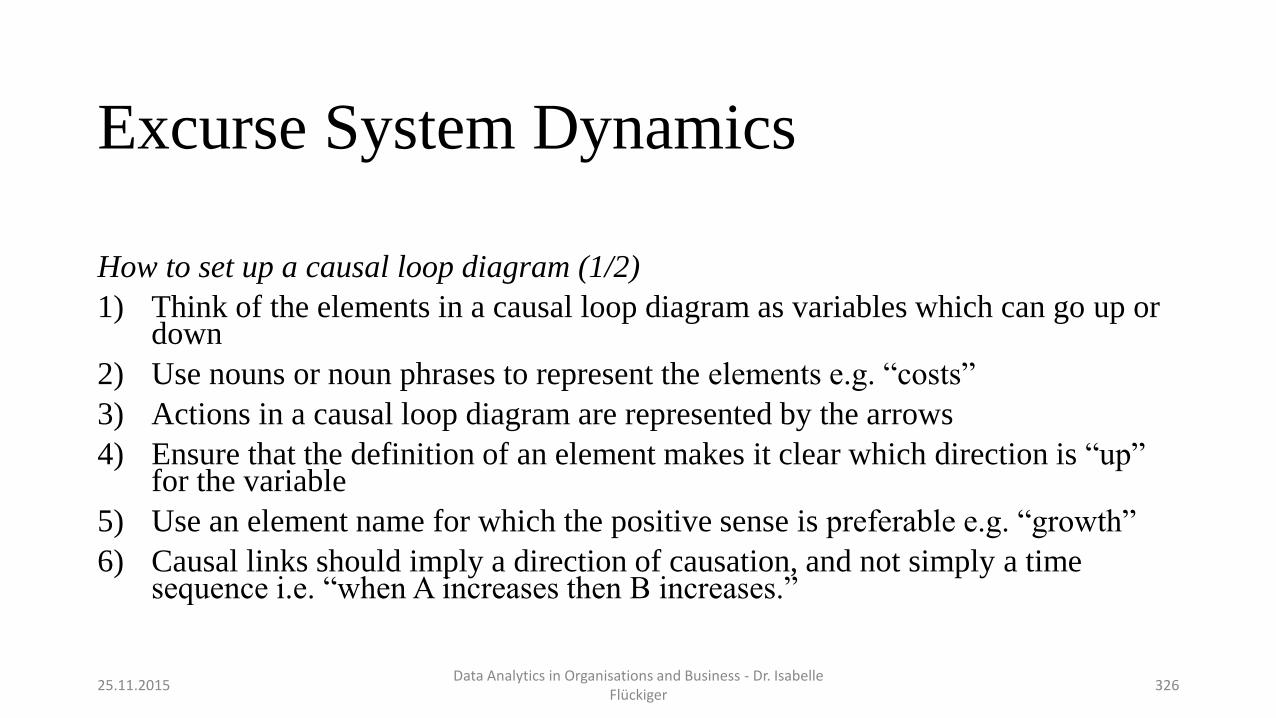
How to set up a causal loop diagram (1/2)
1) Think of the elements in a causal loop diagram as variables which can go up or down
2) Use nouns or noun phrases to represent the elements e.g. “costs”
3) Actions in a causal loop diagram are represented by the arrows
4) Ensure that the definition of an element makes it clear which direction is “up” for the variable
5) Use an element name for which the positive sense is preferable e.g. “growth”
6) Causal links should imply a direction of causation, and not simply a time sequence i.e. “when A increases then B increases.”
25.11.2015Data Analytics in Organisations and Business - Dr. Isabelle
Flückiger326
Excurse System Dynamics
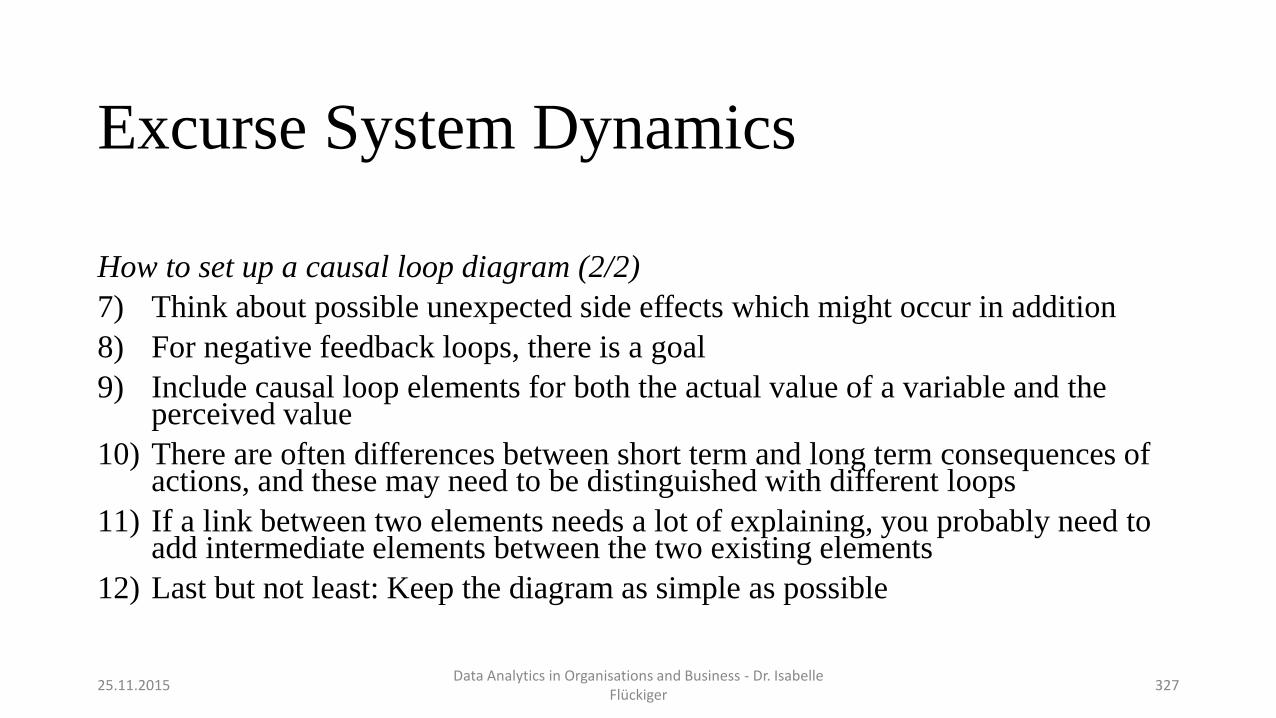
How to set up a causal loop diagram (2/2)
7) Think about possible unexpected side effects which might occur in addition
8) For negative feedback loops, there is a goal
9) Include causal loop elements for both the actual value of a variable and the perceived value
10) There are often differences between short term and long term consequences of actions, and these may need to be distinguished with different loops
11) If a link between two elements needs a lot of explaining, you probably need to add intermediate elements between the two existing elements
12) Last but not least: Keep the diagram as simple as possible
25.11.2015Data Analytics in Organisations and Business - Dr. Isabelle
Flückiger327
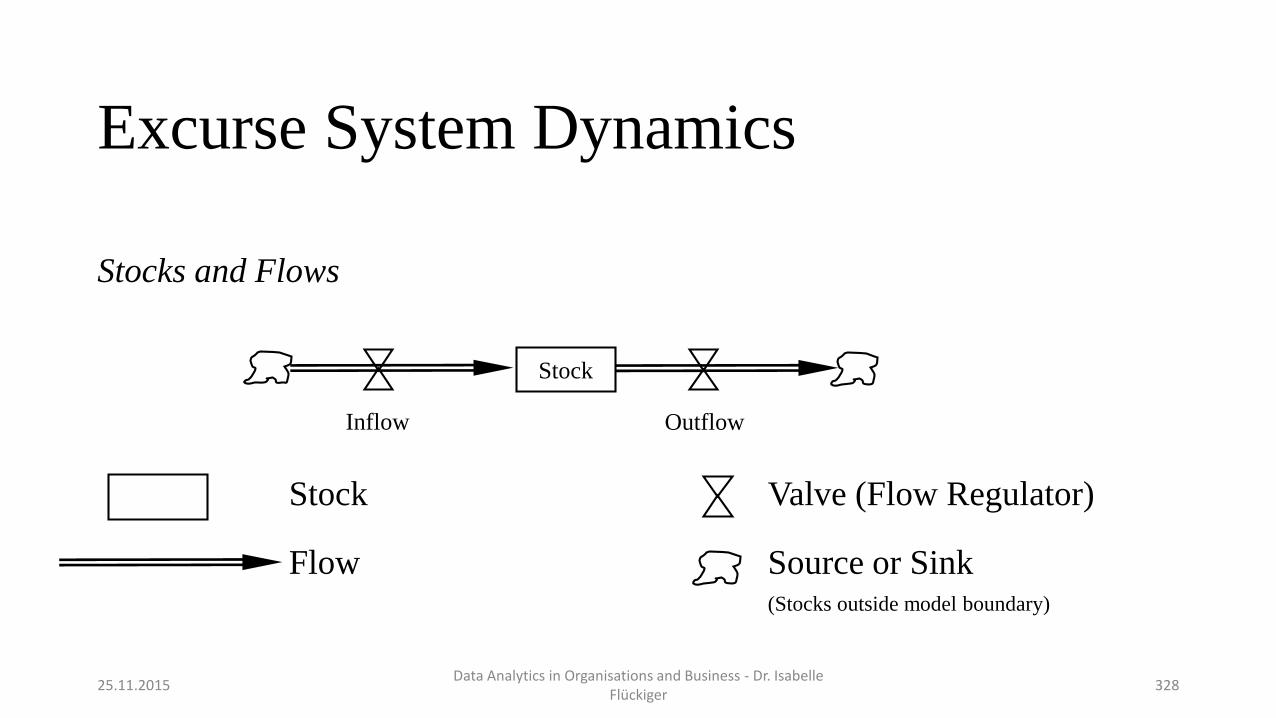
Excurse System Dynamics
Stocks and Flows
Stock Valve (Flow Regulator)
Flow Source or Sink (Stocks outside model boundary)
25.11.2015Data Analytics in Organisations and Business - Dr. Isabelle
Flückiger328
Stock
Inflow Outflow
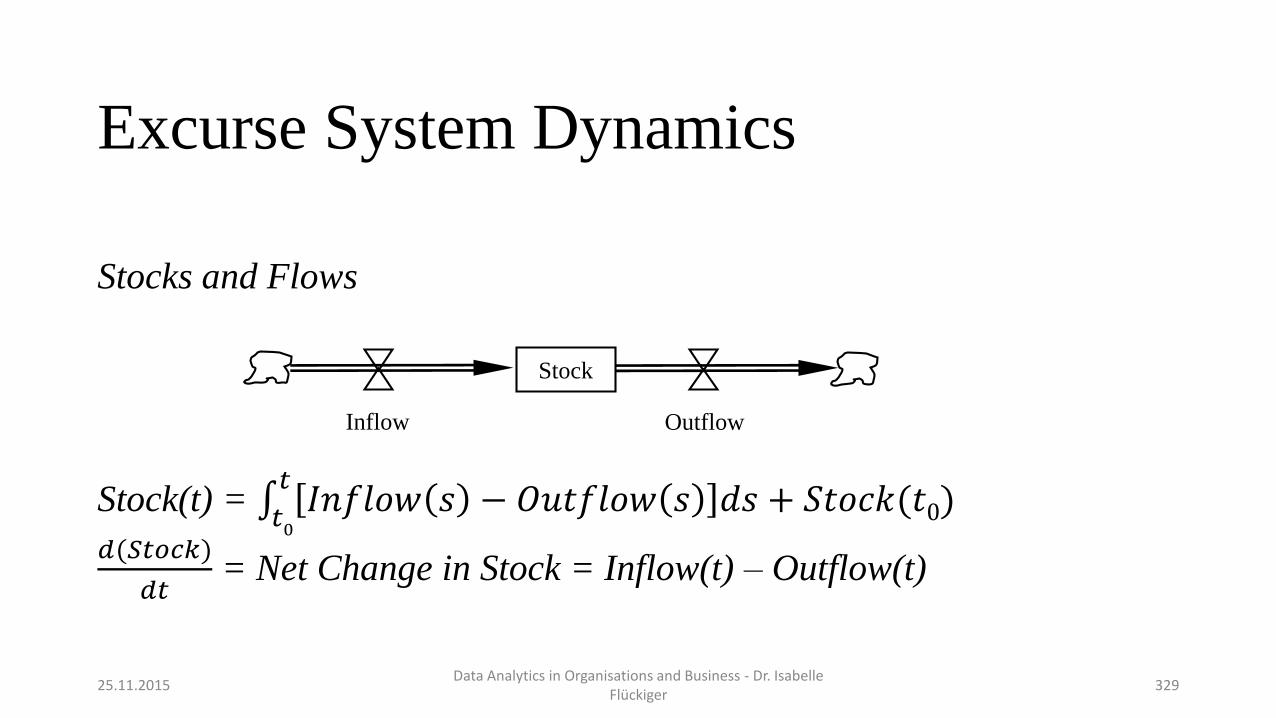
Excurse System Dynamics
Stocks and Flows
Stock(t) = 𝑡0
𝑡𝐼𝑛𝑓𝑙𝑜𝑤 𝑠 − 𝑂𝑢𝑡𝑓𝑙𝑜𝑤 𝑠 𝑑𝑠 + 𝑆𝑡𝑜𝑐𝑘(𝑡0)
𝑑(𝑆𝑡𝑜𝑐𝑘)
𝑑𝑡= Net Change in Stock = Inflow(t) – Outflow(t)
25.11.2015Data Analytics in Organisations and Business - Dr. Isabelle
Flückiger329
Stock
Inflow Outflow
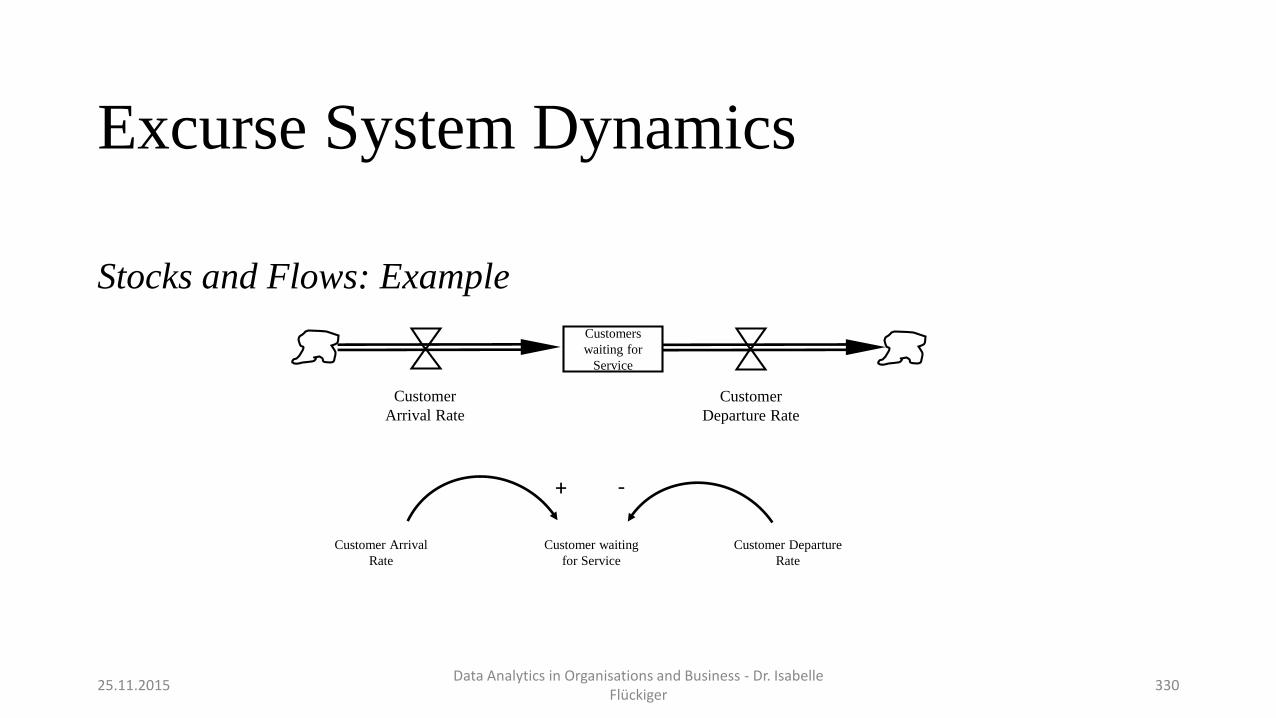
Excurse System Dynamics
Stocks and Flows: Example
25.11.2015Data Analytics in Organisations and Business - Dr. Isabelle
Flückiger330
Customers
waiting for
Service
Customer
Arrival Rate
Customer
Departure Rate
Customer waiting
for Service
Customer Arrival
Rate
Customer Departure
Rate
+ -
Excurse System Dynamics
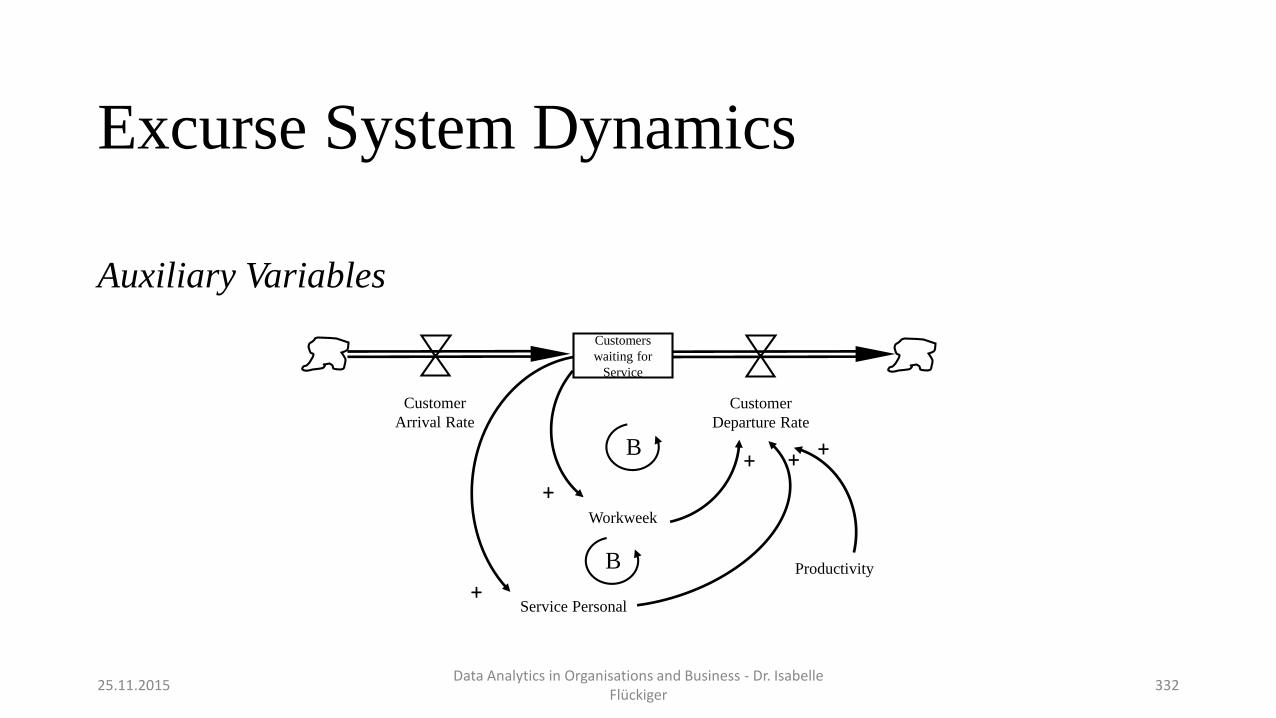
Auxiliary Variables
Assume: The rate at which customers can be processed depends on
• Number of service personal
• The productivity of the personal (customer processed per hour)
• Numbers of working hours per week
These variables are auxiliary variables which determine the dynamic.
25.11.2015Data Analytics in Organisations and Business - Dr. Isabelle
Flückiger331
Excurse System Dynamics
Auxiliary Variables
25.11.2015Data Analytics in Organisations and Business - Dr. Isabelle
Flückiger332
Customers
waiting for
Service
Customer
Arrival Rate
Customer
Departure Rate
Workweek
Service Personal
Productivity
+
+
+ + +B
B
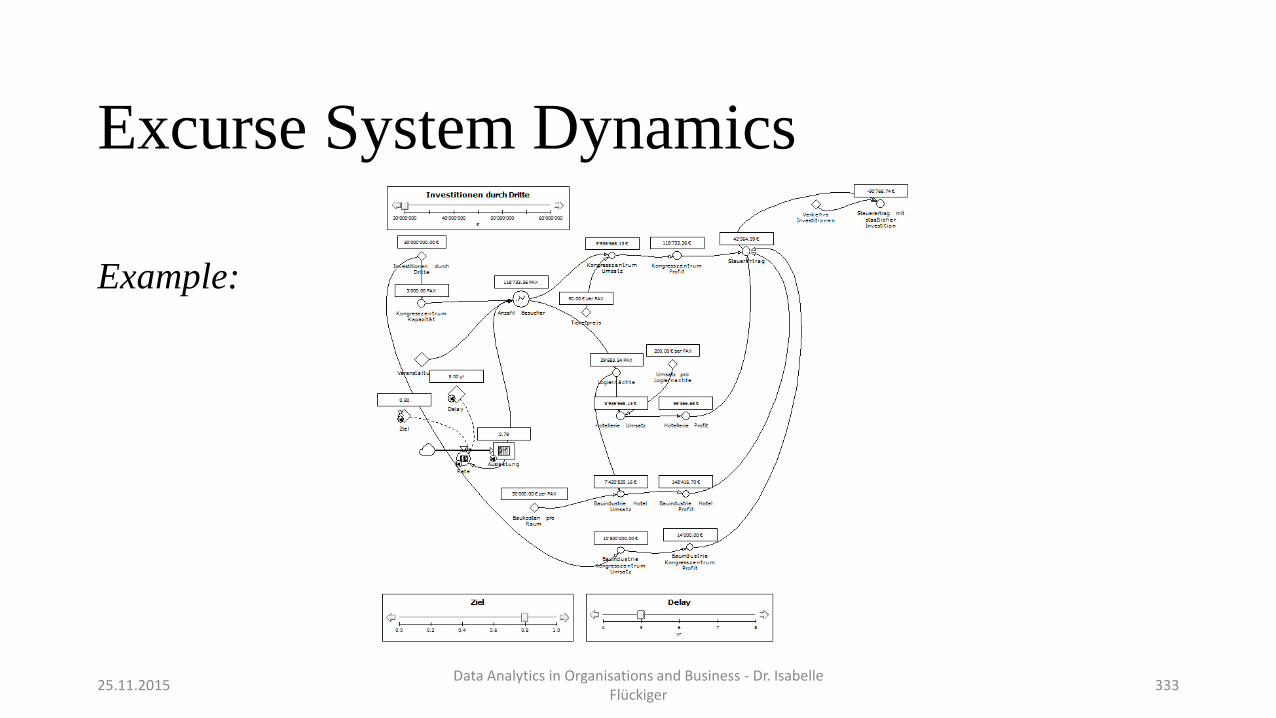
Excurse System Dynamics
Example:
25.11.2015Data Analytics in Organisations and Business - Dr. Isabelle
Flückiger333