564 ieee transactions on visualization and …rheingan/pubs/probsurf.tvcg04.pdfgevorg grigoryan and...
TRANSCRIPT

Point-Based Probabilistic Surfacesto Show Surface Uncertainty
Gevorg Grigoryan and Penny Rheingans, Member, IEEE Computer Society
Abstract—Efficient and informative visualization of surfaces with uncertainties is an important topic with many applications in science
and engineering. In these applications, the correct course of action may depend not only on the location of a boundary, but on the
precision with which that location is known. Examples include environmental pollution borderline detection, oil basin edge
characterization, or discrimination between cancerous and healthy tissue in medicine. This paper presents a method for producing
visualizations of surfaces with uncertainties using points as display primitives. Our approach is to render the surface as a collection of
points and to displace each point from its original location along the surface normal by an amount proportional to the uncertainty at that
point. This approach can be used in combination with other techniques such as pseudocoloring to produce efficient and revealing
visualizations. The basic approach is sufficiently flexible to allow natural extensions; we show incorporation of expressive modulation of
opacity, change of the stroke primitive, and addition of an underlying polygonal model. The method is used to visualize real and
simulated tumor formations with uncertainty of tumor boundaries. The point-based technique is compared to pseudocoloring for a
position estimation task in a preliminary user study.
Index Terms—Uncertainty, visualizing surface uncertainty, point-based graphics.
�
1 INTRODUCTION
EVERYTHING we measure in science and engineering canhave uncertainty associated with it. When the measured
(or predicted) data are visualized, it is important tocommunicate information about the uncertainty along withthe data itself, especially when the visualization is to beused in decision-making. For simple situations with modestamounts of data, there are standard methods for dealingwith this problem, for example, representing uncertainty atpoints of a 2D graph with vertical bars or graphingprobability density curves. In more complicated situations,the task becomes more challenging.
We have chosen to concentrate on the problem ofvisualizing surfaces with uncertainties. Approaches forvisualizing the uncertainty of surfaces are particularlyuseful for studying the general problem of deducing anddisplaying border information from a volume data set. Forexample, in protein structure determination with X-raycrystallography, where atomic coordinates are deducedfrom electron density, properly estimating the uncertaintiesin atomic position resulting from thermal motion andcrystallographic artifacts is as important as finding thecoordinates themselves. Similar problems exist in medicine,where the task is to determine the boundary between twodifferent types of tissue (healthy/sick or contaminated/noncontaminated) so that surgery or radiation therapy maybe planned.
An ideal technique suitable for displaying surfaces withuncertainties should meet certain requirements. First, themethod must give information about the geometry of thesurface and the uncertainty in every region. The methodshould be intuitive so that, by simply looking at avisualization, one can easily surmise the desired informa-tion. In order to communicate sufficient information about a3D surface in a still 2D picture, the method should beinteractive to allow viewing from different positions.Whatever means of visualizing uncertainty is used, itshould not distract one from the perception of likely surfacelocation. And, ideally, one has to be able to visualize othervariables along with uncertainty.
In this paper, we present an approach to visualizingsurfaces with uncertainties which meets all of the aboverequirements. Our technique is based on using points asdisplay primitives to render a surface. The main ideabehind dealing with uncertainty is to follow the logicalconsequence of having an uncertainty at a point. Namely, ifwe are not certain about how the surface behaves in aparticular region, then we are not certain about exactlywhere to put points representing the surface in that region.Hence, we should displace these points from their originallocation in a way that incorporates a certain amount ofrandomness proportional to the uncertainty in the region.
We apply our approach to the visualization of growingtumors. It is well-known that finding strict borders of agrowing tumor is extremely important when it comes tomaking decisions on how to treat the tumor, but also veryhard because areas of low tumor cell density can be the oneswith the highest growth rates. We demonstrate our methodusing both modeled and diagnostic tumor formations.
2 RELATED UNCERTAINTY VISUALIZATION WORK
There is a rich and active body of research addressing thechallenge of showing data values in the context of their
564 IEEE TRANSACTIONS ON VISUALIZATION AND COMPUTER GRAPHICS, VOL. 10, NO. 5, SEPTEMBER/OCTOBER 2004
. G. Grigoryan is with the Department of Biology, Massachusetts Institute ofTechnology, 77 Massachusetts Ave., Cambridge, MA 02139.E-mail: [email protected].
. P. Rheingans is with the Computer Science and Electrical EngineeringDepartment, University of Maryland Baltimore County, 1000 HilltopCircle, Baltimore, MD 21250. E-mail: [email protected].
Manuscript received 19 Feb. 2003; revised 27 Mar. 2003; accepted 20 Nov.2003.For information on obtaining reprints of this article, please send e-mail to:[email protected], and reference IEEECS Log Number TVCGSI-0010-1102.
1077-2626/04/$20.00 � 2004 IEEE Published by the IEEE Computer Society

certainties in an organic and effective manner. Theseapproaches may be grouped into three basic categories:sampling approaches, additional variable approaches, andgeometry modifications.
Sampling approaches rely on showing uncertainty in-formation only at discrete points of the space. Examples areuncertainty glyphs [1], [2], sonification [3], [4], [5], proceduralannotations [6], and discrete probability distributions [7].Uncertaintyglyphs incorporate certainty information into thevisual appearanceof theglyph. For example, aglyph forwinddirection might show an uncertain direction as a wedge,rather than a precise arrow. Sonification approaches mapuncertainty at probed locations to sound. Using proceduralannotations, uncertainty values may be used as parameterscontrolling the distortion or appearance of annotationmarks.Finally, discreteprobabilitydistributionsdescribe the regionsof space spanned by a discrete number of possible surfaceconfigurations. These methods are useful as samplingdevices; however, the fact that uncertainty is only shown atdiscrete points limits their utility in continuous domains.
Perhaps the simplest approach to representing uncer-tainty relies on simply treating uncertainty as an extravariable, effectively increasing the number of dimensions ofthe data set by one. This extra variable is then displayedusing any of the standard methods for displaying multi-dimensional data sets. In particular, pseudocoloring [8] canbe easily used for this task. Unlike the previous group, theseapproaches do convey information about the uncertaintycontinuously. However, by visualizing uncertainty as anindependent variable, they fail to treat it as a quantityassociated with another measure. Indeed, when we sayuncertainty, we refer to uncertainty in some variable. If thisvariable is also shown in the visualization, then, ideally, thevisual display mechanism of the uncertainty shouldcorrespond to that of the variable. For example, uncertaintyin location is associated with coordinates. So, if we usepseudocolor to render uncertainty, we lose the connectionbetween the uncertainty and the geometry.
The third widely used general method for visualizinguncertainties on surfacesmodifies thegeometryof the surfacebased on the uncertainty in each region. Approaches fromthis collection are fat surfaces [1], [9], displacements andother perturbations of geometry [1], [10], animation [11],and IFS fractal interpolation [12]. In the fat surfacesapproach, several surfaces are rendered to show the rangeof possible locations of the data points. This technique iswell-suited for situations when the uncertainty is given inthe form of minimum/maximum value pairs. The anima-tion approach is based on oscillating regions of the surfacewith amplitudes proportional to uncertainty. This approachis convenient, but has the disadvantage that it cannot beviewed on static media. Also, with the surface oscillating, itmay be hard to display variables other than uncertainty.The IFS fractal interpolation method [12] produces surfaceswith perturbed geometry, with larger perturbations inuncertain regions. This is similar to the technique employedhere, but, with the IFS approach, the most salient feature ofthe visualization is the high frequency nature of uncertainregions. The distinction between certain and uncertainregions is clear, but the location of the most likely surfacemay be obscured. This paper builds upon a preliminarywork of the authors [13], offering several enhancements andpreliminary evaluation of the effectiveness of the approach.
3 TUMOR GROWTH MODEL APPLICATION
We apply our techniques to visualizing tumor formationssimulated by a tumor growth model [14], [15]. One of thebest known and simplest models of this type is theGompertz model [14]. We apply it to build a tumor out ofmany small tumors initially dispersed in space. The growthof each of these small tumors is simulated using the samegrowth formula prescribed by the Gompertz model, butwith different growth parameters corresponding to differ-ent conditions. In order to estimate uncertainty associatedwith the border of the tumor, we begin with the followingobservations: First, we observe that, no matter what thediagnostic detection technique, the uncertainty will be highin the areas where tumor cell density is low. Next, weobserve that high cell density means limited nutrientsupply, hence, a low growth rate and vice versa. Fromthese two observations, we estimate uncertainty as thegrowth rate of the tumors, which can be calculated as thederivative of volume with respect to time.
As a modification of this computational model, wedeveloped a method in which we incorporated metastasis.Metastasis is a well-known phenomenon in cancer devel-opment where cells detach from a tumor formation, travelalong blood vessels, settle in other places in the organism,and start new tumors there. This behavior is modeled asfollows: At each growing time interval, the sizes of all thetumors are increased according to the model. At this point,if the size of a tumor exceeds some threshold, then, with acertain probability, it is forced to metastasize. This meansthat a new tumor center is created a random distance awayfrom the old one along the predefined blood vesseldirection. This introduced a new parameter into our model—age, which we output along with uncertainty. In real life,the age of a tumor region would be hard to assess directly,however, the parameter is still very meaningful in under-standing the growth of tumor formations.
Using a computational model to test our visualizationmethod has several advantages. First of all, one can getmore accurate certainty information from a computationalmodel. Eventually, of course, a way of estimating un-certainty using medical images has to be developed, butwith a working visualization technique this becomes aseparate problem. One advantage of the approach proposedin this paper is the ability to add additional variables to thevisualization already containing uncertainty data. A com-putational model allows us to develop meaningful supple-mentary variables on which to test the visualizationapproach.
A simple isosurface visualization of a data set generatedusing this model is presented in Fig. 1a. Fig. 1b shows thesame model with pseudocolor indicating uncertainty. Thisrepresentation conveys information about both surfaceshape as well as uncertainty. However, there are limitationsto this type of a visualization approach. Pseudocolor onlygives us information about relative uncertainty valuesthroughout the surface. Even though one can introduce acolorbar into the visualization, one still will not have a clearspatial concept of how bad a particular uncertainty value is.In other words, there is no direct connection betweenuncertainty and geometry.
GRIGORYAN AND RHEINGANS: POINT-BASED PROBABILISTIC SURFACES TO SHOW SURFACE UNCERTAINTY 565

4 APPROACH
Our approach to visualizing surfaces with uncertaintiescorresponds directly to how we think of these uncertainties.A nonzero uncertainty value at a particular point on asurface indicates that we are not sure precisely where thepoint is. Specifically, that point in the actual object may besomewhere different from where it is on the rendering. Theexpected difference range is given by the size of theuncertainty value associated with this point. The heart ofour approach is to displace each point on the surface alongthe surface normal at the point, with the displacementproportional to the uncertainty value at the point. Becausethe uncertainty value at each point shows the expectedrange of displacement, rather than a precise value, we showdisplacements randomly distributed in the range. Per-formed for many points, this will produce the expecteddisplacement distribution in a region.
Triangles and other polygons have been historically usedas display primitives in representing 3D objects because ofthe availability of hardware acceleration for polygonrendering. But, as scenes grow more complex, polygonsshrink to sizes approaching that of a pixel. The possibility ofusing points as general display primitives was introducedby Levoy and Whitted [16]. It was shown that, as thecomplexity of the scene increases, choosing points asrendering primitives presents a great number of advantagesin terms of making algorithms simple by enabling therendering of surfaces without the necessity for underlyinggeometry. Hence, at some point, it becomes appropriate touse points instead of polygons [17], [18]. The advent ofhardware support for point rendering as well as work donein the area of optimizing point-based rendering [19], [20]makes this representation even more attractive.
The idea of representing fuzzy phenomena as pointclouds dates back to the particle systems [21] which werelater applied to surface modeling [22]. Treating uncertainsurfaces as fuzzy phenomena and rendering then with apoint-based system seems a particularly natural choice.Note that, if we use a point-based representation of thesurface, then, given an uncertainty value at a point, we are
free to do whatever we want with that point withoutexplicitly having to consider what happens to the rest of thesurface. This inherent flexibility of point-based models hasproven useful as the basis for a geometric modeling andediting package [23]. We use that flexibility here to makeindependent decisions about the position and appearanceof each point making up a surface. Rendering time isunaffected by the specific uncertainty values. Hence, in oursituations, it is convenient, natural, and efficient to renderthe scene point-by-point.
5 BASIC IMPLEMENTATION
Our visualization program is implemented using the OpenGraphics Library (OpenGL). It provides user parameters forthe scale factor (scale) and falloff (a) for displacement. Thebasic algorithm is outlined below:
1. Read in surface and uncertainty information.
2. Create N random points inside each triangle.
3. Interpolate uncertainty and normals from vertices.
4. for each point P do
5. calculate the displacement:
disp ¼ randðÞ � ðuncert at P Þa � ðscaleÞ,6. Displace P in the direction of the normal at P .
7. end for
8. Display all the points.
The simplest version of our method is one in which thesurface is represented as a collection of displaced points. Anexample of such a visualization is presented in Fig. 1c.Several advantages of this model are immediately apparent.First of all, it is very clear by looking at the visualizationwhich regions of the surface have high uncertainties andwhich have low. Second, the spatial extent of the un-certainty is clear because one can see the region around thesurface where points are likely to be found. So, if the size ofthis region is on the order of surface detail, we know thatthe uncertainty in that region is rather high and we havepractically no idea about the location of the surface in thatregion. However, if the size of this region is rather small
566 IEEE TRANSACTIONS ON VISUALIZATION AND COMPUTER GRAPHICS, VOL. 10, NO. 5, SEPTEMBER/OCTOBER 2004
Fig. 1. Tumor formation. (a) Polygonal model only. Excellent surface geometry information, however, no uncertainty information. (b) Polygonal model
with pseudocolor. Both surface geometry and relative uncertainty information are clearly conveyed. (c) Point-based model. Surface geometry as well
as absolute uncertainty information (as it relates to coordinate uncertainty) are conveyed.
compared with surface detail, we can be fairly certain abouthow the surface behaves in the region. Looking at Fig. 1c,we can see that the region indicated by the red arrow israther uncertain, as opposed to the region indicated by theblue arrow, where the surface behavior is clear.
Since our method displays 3D information on a2D medium, it is essential for the display to be fast enoughto be interactive. Our method provides real-time interactionand allows the user to rotate, move, zoom in and out, aswell as allowing the control of representation parameterssuch as point density, uncertainty scale factor, and otheroptional enhancements.
6 RESULTS ON DIAGNOSTIC DATA
In order to assess the wider applicability of this method todiagnostic data, we also used it to visualize both segmentedand unsegmented medical volumes. These volumes differfrom the growth model data in that neither tumor certaintynor age are directly available. Since only density informa-tion is given by the data, other quantities must be estimated.We use preliminary and simple methods for estimatingtumor certainty here; more complex models could be easilysubstituted.
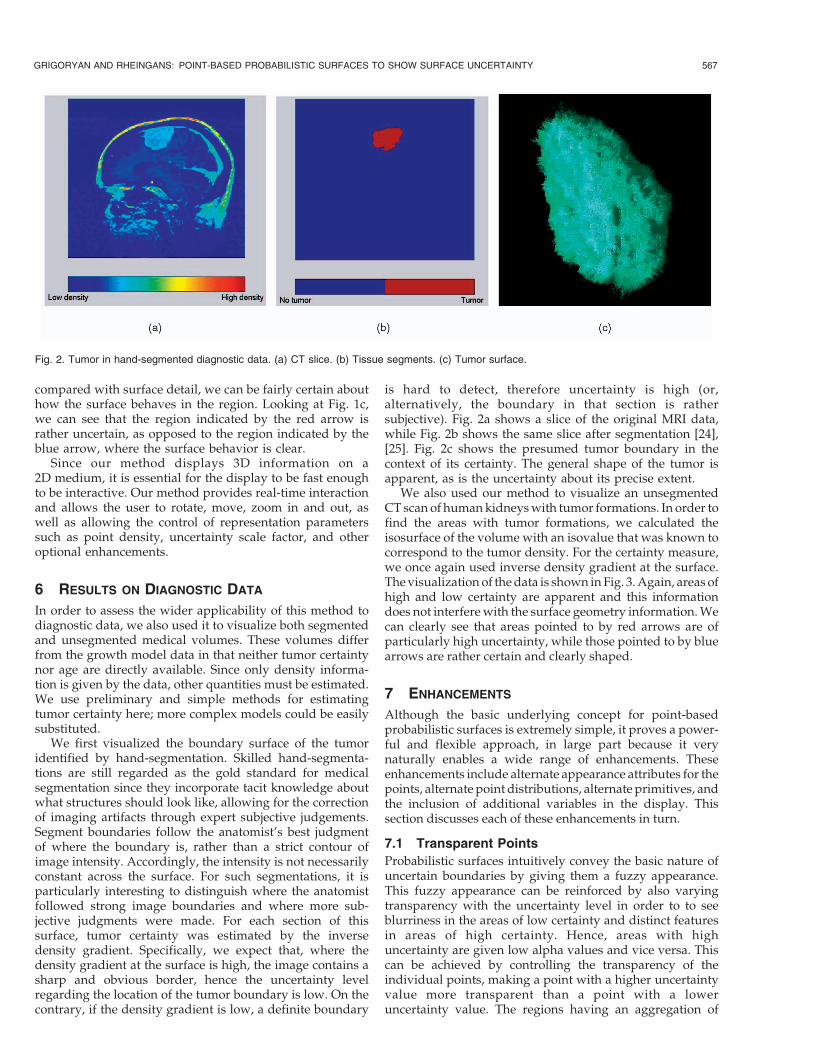
We first visualized the boundary surface of the tumoridentified by hand-segmentation. Skilled hand-segmenta-tions are still regarded as the gold standard for medicalsegmentation since they incorporate tacit knowledge aboutwhat structures should look like, allowing for the correctionof imaging artifacts through expert subjective judgements.Segment boundaries follow the anatomist’s best judgmentof where the boundary is, rather than a strict contour ofimage intensity. Accordingly, the intensity is not necessarilyconstant across the surface. For such segmentations, it isparticularly interesting to distinguish where the anatomistfollowed strong image boundaries and where more sub-jective judgments were made. For each section of thissurface, tumor certainty was estimated by the inversedensity gradient. Specifically, we expect that, where thedensity gradient at the surface is high, the image contains asharp and obvious border, hence the uncertainty levelregarding the location of the tumor boundary is low. On thecontrary, if the density gradient is low, a definite boundary
is hard to detect, therefore uncertainty is high (or,alternatively, the boundary in that section is rathersubjective). Fig. 2a shows a slice of the original MRI data,while Fig. 2b shows the same slice after segmentation [24],[25]. Fig. 2c shows the presumed tumor boundary in thecontext of its certainty. The general shape of the tumor isapparent, as is the uncertainty about its precise extent.
We also used our method to visualize an unsegmentedCT scan of humankidneyswith tumor formations. In order tofind the areas with tumor formations, we calculated theisosurface of the volume with an isovalue that was known tocorrespond to the tumor density. For the certainty measure,we once again used inverse density gradient at the surface.Thevisualization of thedata is shown inFig. 3.Again, areas ofhigh and low certainty are apparent and this informationdoes not interferewith the surface geometry information.Wecan clearly see that areas pointed to by red arrows are ofparticularly high uncertainty, while those pointed to by bluearrows are rather certain and clearly shaped.
7 ENHANCEMENTS
Although the basic underlying concept for point-basedprobabilistic surfaces is extremely simple, it proves a power-ful and flexible approach, in large part because it verynaturally enables a wide range of enhancements. Theseenhancements include alternate appearance attributes for thepoints, alternate point distributions, alternate primitives, andthe inclusion of additional variables in the display. Thissection discusses each of these enhancements in turn.
7.1 Transparent Points
Probabilistic surfaces intuitively convey the basic nature ofuncertain boundaries by giving them a fuzzy appearance.This fuzzy appearance can be reinforced by also varyingtransparency with the uncertainty level in order to to seeblurriness in the areas of low certainty and distinct featuresin areas of high certainty. Hence, areas with highuncertainty are given low alpha values and vice versa. Thiscan be achieved by controlling the transparency of theindividual points, making a point with a higher uncertaintyvalue more transparent than a point with a loweruncertainty value. The regions having an aggregation of
GRIGORYAN AND RHEINGANS: POINT-BASED PROBABILISTIC SURFACES TO SHOW SURFACE UNCERTAINTY 567
Fig. 2. Tumor in hand-segmented diagnostic data. (a) CT slice. (b) Tissue segments. (c) Tumor surface.

points with high uncertainty values will be a collection ofhighly displaced, blurred points and, hence, the shape ofthe surface in these regions will not be apparent. In thiscase, the transparency of the underlying point model isdependent on uncertainty values with the followingrelationship: � ¼ 1:0� errc, where err is the scaled un-certainty value (from 0 to 1) and c is a constant whichcontrols how quickly the transparency increases withincreasing uncertainty. The utility of this approach isapparent from Fig. 4a. Regions of high uncertainty becomeeven more blurry than with the basic technique.
7.2 Alternative Point Distributions
The basic probabilistic surface algorithm uses a uniformdistribution of displacements along the surface normal, upto a maximum displacement. This implies that the surfacemight be located anywhere in the window given by themaximum displacement with equal likelihood. In somesituations, more may be known about the probabilitydistribution of likely surface locations. For example,
positions near the best estimate given by the surfaceposition may be more likely than those farther away. Thedisplacement of points may be modified in a straightfor-ward manner to incorporate uncertainty of arbitrarydistribution by adding a term to the calculation ofdisplacement. Specifically, the displacement is given by:
disp ¼ randðPDF Þ � ðuncert at P Þa � ðscaleÞ; ð1Þ
where a and scale are controlled by the user andrandðPDF Þ is a random number distributed according tothe probability density function PDF . We used the rejectionmethod [26] to generate random numbers with an arbitraryprobability distribution.
Fig. 4b shows the result of using a Gaussian probabilitydistribution function for displacement. Points are morelikely to be displaced small distances than large, resulting ina somewhat more defined shape even in uncertain regions.We also tried using a probability distribution which ensuresequal density of points at all distances from the surface (in aparticular range of distances). However, for the particularsurface geometries and displacements we considered, thisdid not seem to make much difference, so we used thesimpler distribution. We expect that equal density displace-ment might produce a visible difference in cases of surfaceswith highly varying curvature or when displacementdistances are extremely large.
7.3 Line Primitives
Other types of stroke primitives can be used to producesimilar effects in probabilistic surface visualization. Wehave implemented a variant using line primitives instead ofpoints. Points on the surface are generated and displaced asbefore, but, instead of simply drawing the points, we drawa line segment linking the original and displaced point. Inthis way, uncertain sections of the surface grow furry withdisplacement lines. Fig. 4c shows the tumor growth modelwith furry uncertain regions. This technique may bethought of as a generalization of the error bars commonin 2D graphs, showing both the estimated value and thevariability of that quantity. Because of the larger screenextent of a line, compared to a point, fewer primitives areneeded to create an effective visualization. As with points,the transparency of the line segment may be modulated to
568 IEEE TRANSACTIONS ON VISUALIZATION AND COMPUTER GRAPHICS, VOL. 10, NO. 5, SEPTEMBER/OCTOBER 2004
Fig. 3. Kidney tumors in unsegmented diagnostic data.
Fig. 4. Some enhancements to basic point-based surfaces. (a) Point opacity modulation. (b) Gaussian probability distribution. (c) Lines.
create more intuitive effects. One method would be to havelines fade from full opacity at the root (i.e., the end near thesurface) to half opacity at the tip (i.e., the end displacedaway from the surface). This mimics the structure offamiliar furry objects with fiber diameter decreasing withdistance from the skin. Like points, line primitives grace-fully provide a mechanism for conveying both probablesurface location and certainty by enabling independentdecisions about line geometry and appearance properties tobe made for each primitive.
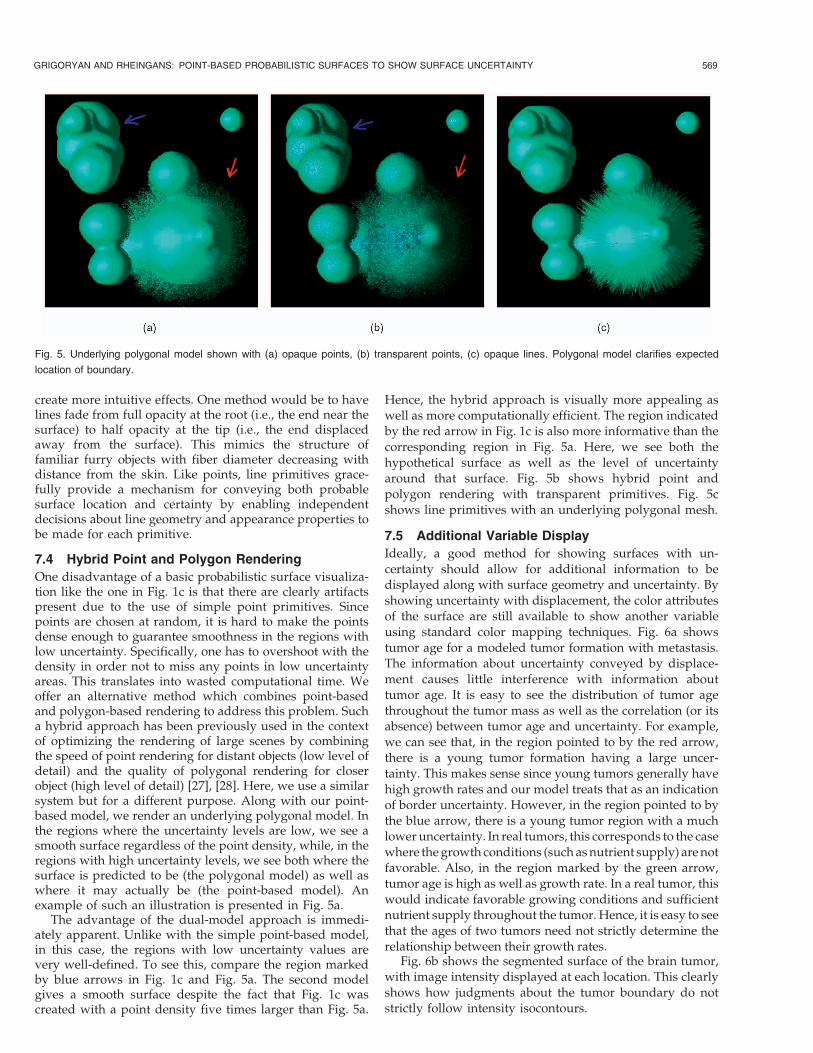
7.4 Hybrid Point and Polygon Rendering
One disadvantage of a basic probabilistic surface visualiza-tion like the one in Fig. 1c is that there are clearly artifactspresent due to the use of simple point primitives. Sincepoints are chosen at random, it is hard to make the pointsdense enough to guarantee smoothness in the regions withlow uncertainty. Specifically, one has to overshoot with thedensity in order not to miss any points in low uncertaintyareas. This translates into wasted computational time. Weoffer an alternative method which combines point-basedand polygon-based rendering to address this problem. Sucha hybrid approach has been previously used in the contextof optimizing the rendering of large scenes by combiningthe speed of point rendering for distant objects (low level ofdetail) and the quality of polygonal rendering for closerobject (high level of detail) [27], [28]. Here, we use a similarsystem but for a different purpose. Along with our point-based model, we render an underlying polygonal model. Inthe regions where the uncertainty levels are low, we see asmooth surface regardless of the point density, while, in theregions with high uncertainty levels, we see both where thesurface is predicted to be (the polygonal model) as well aswhere it may actually be (the point-based model). Anexample of such an illustration is presented in Fig. 5a.
The advantage of the dual-model approach is immedi-ately apparent. Unlike with the simple point-based model,in this case, the regions with low uncertainty values arevery well-defined. To see this, compare the region markedby blue arrows in Fig. 1c and Fig. 5a. The second modelgives a smooth surface despite the fact that Fig. 1c wascreated with a point density five times larger than Fig. 5a.
Hence, the hybrid approach is visually more appealing aswell as more computationally efficient. The region indicatedby the red arrow in Fig. 1c is also more informative than thecorresponding region in Fig. 5a. Here, we see both thehypothetical surface as well as the level of uncertaintyaround that surface. Fig. 5b shows hybrid point andpolygon rendering with transparent primitives. Fig. 5cshows line primitives with an underlying polygonal mesh.
7.5 Additional Variable Display
Ideally, a good method for showing surfaces with un-certainty should allow for additional information to bedisplayed along with surface geometry and uncertainty. Byshowing uncertainty with displacement, the color attributesof the surface are still available to show another variableusing standard color mapping techniques. Fig. 6a showstumor age for a modeled tumor formation with metastasis.The information about uncertainty conveyed by displace-ment causes little interference with information abouttumor age. It is easy to see the distribution of tumor agethroughout the tumor mass as well as the correlation (or itsabsence) between tumor age and uncertainty. For example,we can see that, in the region pointed to by the red arrow,there is a young tumor formation having a large uncer-tainty. This makes sense since young tumors generally havehigh growth rates and our model treats that as an indicationof border uncertainty. However, in the region pointed to bythe blue arrow, there is a young tumor region with a muchloweruncertainty. In real tumors, this corresponds to the casewhere thegrowth conditions (suchasnutrient supply) arenotfavorable. Also, in the region marked by the green arrow,tumor age is high as well as growth rate. In a real tumor, thiswould indicate favorable growing conditions and sufficientnutrient supply throughout the tumor. Hence, it is easy to seethat the ages of two tumors need not strictly determine therelationship between their growth rates.
Fig. 6b shows the segmented surface of the brain tumor,with image intensity displayed at each location. This clearlyshows how judgments about the tumor boundary do notstrictly follow intensity isocontours.
GRIGORYAN AND RHEINGANS: POINT-BASED PROBABILISTIC SURFACES TO SHOW SURFACE UNCERTAINTY 569
Fig. 5. Underlying polygonal model shown with (a) opaque points, (b) transparent points, (c) opaque lines. Polygonal model clarifies expected
location of boundary.

7.6 Additional Uncertain Variable Display
The independent nature of individual point primitives alsovery naturally supports the inclusion of uncertaintyinformation about the additional variable mapped to color.Just as an additional variable could have a distribution ofvalues in a region of the surface, so can the colors given topoints representing that region be given a distribution ofvalues. This assignment can follow any known distributionfunction for that variable. We have implemented a methodwhich randomly colors some primitives in the variablemapped to color. Fig. 7 shows the effect when tumor age ismapped to color. Regions where tumor age is believed to beknown precisely are colored clearly to indicate that age.Regions where age is less certain contain an increasednumber of gray primitives, producing the visual effect ofdecreased saturation. This gives an intuitive indication oftumor age uncertainty.
8 ENHANCED IMPLEMENTATION
Incorporating the various enhancements into the algorithmyields the more general algorithm, with user controlledparameters for displacement falloff (a), displacement scalefactor (scale), transparency falloff (c), and pseudocolor falloff(�). Also, the random function (randðPDF Þ) now generates arandom number according to a given probability function(PDF ). This results in the following enhanced algorithm:
1. Read in surface and uncertainty information.
2. Create N random points inside each triangle.
3. Interpolate uncertainty and normals from vertices.
4. for each point P do
5. calculate the displacement:
disp ¼ randðPDF Þ � ðuncert at P Þa � ðscaleÞ,6. Displace P along the normal at P resulting in P 0.
7. if transparency used then
8. Calculate the transparency (alpha value):
� ¼ 1� ðuncert at P Þc,9. end if
10. if pseudocolor used then
11. if ðrandðÞ < ðuncert in variable at P Þ�Þthen
12. color ¼ neutral color.
570 IEEE TRANSACTIONS ON VISUALIZATION AND COMPUTER GRAPHICS, VOL. 10, NO. 5, SEPTEMBER/OCTOBER 2004
Fig. 6. Display of additional variable on point-based surface: (a) Age in growth model: Color represents age in tumor growth model. (b) Intensity in
diagnostic data: Color shows intensity of along segmented boundary of MRI volume.
Fig. 7. Display of an uncertain additional variable on a probabilisticsurface. Meaning of color here is the same as in Fig. 6a. Areas of lowvariable uncertainty are dominated by primitives indicating variablevalue, while areas with high variable uncertainty contain many primitivescolored a neutral gray.

13. else
14. color ¼ lookupðvariable at P Þ.15. end if
16. else
17. color ¼ default.
18. end if
19. if line primitives are wanted then
20. Generate line from P to P 0
21. else
22. Generate P 0
23. end if
24.end for
25.Display all the points or lines.
26.if underlying polygonal model is used then
27. Display all the polygons.
28.end if
9 PERFORMANCE
One of the notable advantages of our method is the abilityto use it interactively. Table 1 summarizes the performanceof our implementation with the data and parameters usedin some of the figures. It shows the data complexity for eachof the cases in terms of the number of polygons in thepolygonal model shown in column Polygons (N/A when apolygonal model absent), the number of points per polygonand the total number of points in the point-based model incolumns Density and Points (N/A when a point-basedmodel is absent). The running time complexity is demon-strated in terms of the time required for generating all theprimitives and the time required for displaying the model.These are shown in columns Build and Display, respec-tively (time is in seconds). The tests were performed on acomputer running RedHat Linux 6.1, with an Intel 1 GHzprocessor, 256 Mb of memory, and NVIDIA GeForce3graphics card.
Fig. 1c corresponds to our basic method—where only apoint-based model is used. From Table 1, we can see that,since we have to use 100 points per polygon in order toguarantee smoothness in the regions of low uncertainty, atotal of 1,853,200 points are present in the scene. When,instead, we employ the point-based and polygonal hybridmodel, we obtain better smoothness in low uncertaintyareas (see Fig. 5a) using fewer points per polygon—only 20,which translates into five times fewer points in total—370,640. An additional advantage of the hybrid model isthat we see both where the surface is thought to be as wellas an idea of how certain it is. Comparing the running timesfor the two models, we see that the hybrid model is aboutfive times faster in both displaying as well as building theprimitives. Both models are interactive with time to redis-play below one second, however, the hybrid model has aframe rate of 6.25 frames per second while the basic modelonly rund at 1.64 frames per second.
Additionally, we see that adding transparency to thehybrid model has practically no effect on the running time(compare entries for Fig. 5a and Fig. 5b). The data set used forvisualizing tumor age as an extra variable (Fig. 6a) is slightlymore complex, having about 1.5 times more points in totalthan the data set for the previous figures. Hence, we see a1.5-fold increase in running time both for displaying as well
as building the model. However, here again the model is stillinteractive, having a frame rate of 4.0 frames per second. Aswe move to the more complex data set corresponding to thereal kidney tumor data (Fig. 3), running time increasesproportionally with the number of points.
As is common in visualization systems, some aspects ofimage quality are at odds with the need for interactiveperfomance. In some cases, we included a parameter to letthe user select the desired balance point. The optionalhybrid rendering and controllable number of points perpolygon are examples of this. In other cases, design choicesreflect the need for interactivity. Examples of this includethe use of hardware-supported transparent points and theconstant number of points per polygon. In the first case,sorting of points by depth would be required to ensurecorrect compositing. In the second case, a scaling of thenumber of points by the size of the polygon would result ina more even distribution of points. In both cases, we chose asimpler solution in the interests of interactivity.
10 EVALUATION OF EFFECTIVENESS
We conducted a preliminary user study to compare theeffectiveness of our point-based method and the pseudo-color approach for visualizing positional uncertainty.Eighteen volunteers used the two techniques to judgewhether a small teapot-shaped marker was inside oroutside the error margin of a surface. Marker locationswere generated randomly near the edge of the error margin.Fig. 8a shows the display screen for a pseudocolor trial. Thecolor of each part of the surface shows the thickness of theerror margin at that point. A legend for the colors and theassociated distance was provided below the display. Fig. 8bshows the display screen for a point-based trial. In thisdisplay, the error margin was shown by the spread ofpoints out from the surfaces.
After a brief introduction to the representations and thetask, each subject completed eight trials with one repre-sentation, followed by eight trials with the other represen-tation. Half of the subjects used the pseudocolorrepresentation first, while the other half used the point-based representation first. Subjects were randomly assignedto a trial order.
Analysis of the results showed an average increase inaccuracy of 20 percent using the point-based representation,a statistically significant difference (p < 0:01). This level ofsignificance indicates a less than 1 percent likelihood thatthe differences observed resulted from random chance.Table 2 shows summary statistics over all subjects: mean
GRIGORYAN AND RHEINGANS: POINT-BASED PROBABILISTIC SURFACES TO SHOW SURFACE UNCERTAINTY 571
TABLE 1Running Time (in Seconds) for the Visualization Method on the
Data Sets from the Figures in This Paper
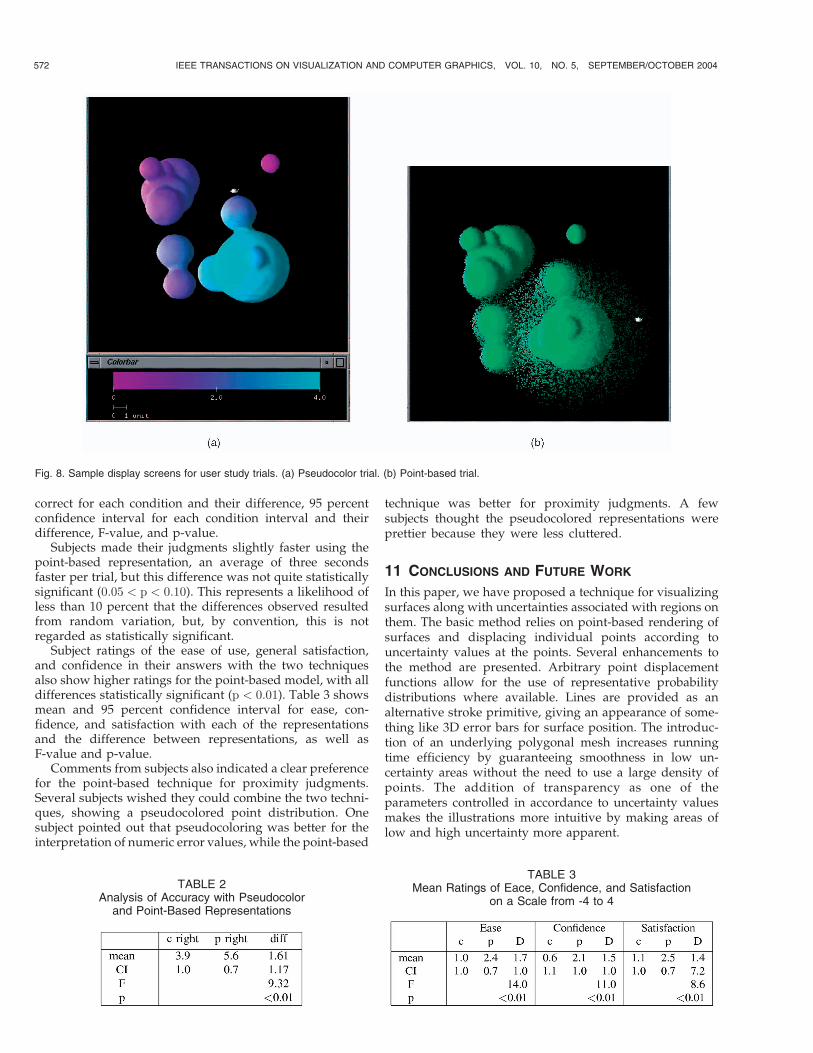
correct for each condition and their difference, 95 percentconfidence interval for each condition interval and theirdifference, F-value, and p-value.
Subjects made their judgments slightly faster using thepoint-based representation, an average of three secondsfaster per trial, but this difference was not quite statisticallysignificant (0:05 < p < 0:10). This represents a likelihood ofless than 10 percent that the differences observed resultedfrom random variation, but, by convention, this is notregarded as statistically significant.
Subject ratings of the ease of use, general satisfaction,and confidence in their answers with the two techniquesalso show higher ratings for the point-based model, with alldifferences statistically significant (p < 0:01). Table 3 showsmean and 95 percent confidence interval for ease, con-fidence, and satisfaction with each of the representationsand the difference between representations, as well asF-value and p-value.
Comments from subjects also indicated a clear preferencefor the point-based technique for proximity judgments.Several subjects wished they could combine the two techni-ques, showing a pseudocolored point distribution. Onesubject pointed out that pseudocoloring was better for theinterpretation of numeric error values, while the point-based
technique was better for proximity judgments. A fewsubjects thought the pseudocolored representations wereprettier because they were less cluttered.
11 CONCLUSIONS AND FUTURE WORK
In this paper, we have proposed a technique for visualizingsurfaces along with uncertainties associated with regions onthem. The basic method relies on point-based rendering ofsurfaces and displacing individual points according touncertainty values at the points. Several enhancements tothe method are presented. Arbitrary point displacementfunctions allow for the use of representative probabilitydistributions where available. Lines are provided as analternative stroke primitive, giving an appearance of some-thing like 3D error bars for surface position. The introduc-tion of an underlying polygonal mesh increases runningtime efficiency by guaranteeing smoothness in low un-certainty areas without the need to use a large density ofpoints. The addition of transparency as one of theparameters controlled in accordance to uncertainty valuesmakes the illustrations more intuitive by making areas oflow and high uncertainty more apparent.
572 IEEE TRANSACTIONS ON VISUALIZATION AND COMPUTER GRAPHICS, VOL. 10, NO. 5, SEPTEMBER/OCTOBER 2004
Fig. 8. Sample display screens for user study trials. (a) Pseudocolor trial. (b) Point-based trial.
TABLE 2Analysis of Accuracy with Pseudocolor
and Point-Based Representations
TABLE 3Mean Ratings of Eace, Confidence, and Satisfaction
on a Scale from -4 to 4
Among the advantages of our approach is that itrepresents uncertainty in a nondistracting manner. Weshowed that uncertainty did not interfere with surfacegeometry information and, moreover, it was also possible toeffectively visualize at least one additional variable withoptional uncertainty. This makes for a six-dimensional dataset, which can be effectively displayed using our visualiza-tion technique. Another highlight of our method is the factthat uncertainty is represented in an intuitive way. Unlikeother possible approaches, ours explicitly connects uncer-tainty with the variable with which the uncertainty isassociated. In the data presented here, uncertainty wasassociated with location; however, it can potentially beassociated with any variable in the visualization as long asthis variable is displayed as one of the coordinates of thepoints. Finally, our method is fast enough to be interactive.This is important for any technique that displays data withmore than two dimensions on a 2D medium.
In the future, we would like to experiment by addingmore parameters under the control of uncertainty such asspecular coefficient or refractive index to see if this gives amore intuitive look to the areas of high and low uncertainty.Additionally, we would like to explore point distributionfunctions which are more sensitive to surface shapecharacteristics.
ACKNOWLEDGMENTS
This work was supported by grants from the US NationalScience Foundation (#121288 and #9996043). The kidneytumor data set is courtesy of Dr. Ron Summers of the USNational Institutes of Health. The brain tumor data comesfrom the Brigham and Women’s Hospital Surgical PlanningLab and NSG Brain Tumor Database courtesy of Drs. SimonWarfield, Michael Kaus, Ron Kikinis, Peter Black, andFerenc Jolesz.
REFERENCES
[1] A. Pang, C. Wittenbrink, and S. Lodha, “Approaches toUncertainty Visualization,” The Visual Computer, vol. 13, no. 8,pp. 370-390, 1997.
[2] C. Wittenbrink, A. Pang, and S. Lodha, “Glyphs for VisualizingUncertainty in Vector Fields,” IEEE Trans. Visualization andComputer Graphics, vol. 2, no. 3, pp. 226-279, Sept. 1996.
[3] G. Kramer, Auditory Display, Sonification, Audification, and AuditoryInterfaces, pp. 1-78. Addison-Wesley, 1994.
[4] R. Minghim and A.R. Forrest, “An Illustrated Analysis ofSonification for Scientific Visualization,” Proc. Visualization ’95,pp. 110-117, 1995.
[5] S. Lodha, C. Wilson, and R. Sheehan, “LISTEN: SoundingUncertainty Visualization,” Proc. Visualization ’96, pp. 189-195,1996.
[6] A. Cedilnik and P. Rheingans, “Procedural Annotation ofUncertain Information,” Proc. IEEE Visualization ’00, pp. 77-84,2000.
[7] P. Rheingans and S. Joshi, “Visualization of Molecules withPositional Uncertainty,” Proc. Data Visualization ’99, E. Groller,H. Loffelmann, and W. Ribarsky, eds., pp. 299-306, 1999.
[8] C. Wittenbrink, A. Pang, and S. Lodha, “Verity Visualization:Visual Mappings,” Technical Report UCSC-CRL-95-48, Univ. ofCalifornia Santa Cruz, 1995.
[9] R. Barnhill, K. Opitz, and H. Pottmann, “Fat Surfaces: A TrivariateApproach to Triangle-Based Interpolation on Surfaces,” ComputerAided Geometric Design, vol. 9, no. 5, pp. 365-378, 1992.
[10] S. Lodha, R. Sheehan, A. Pang, and C. Wittenbrink, “VisualizingGeometric Uncertainty of Surface Interpolants,” Proc. GraphicsInterface, pp. 238-245, May 1996.
[11] C. Ehlschlaeger, A. Shortridge, and M. Goodchild, “VisualizingSpatial Data Uncertainty Using Animation,” Computers inGeoSciences, vol. 23, no. 4, pp. 387-395, 1997.
[12] C.M. Wittenbrink, “IFS Fractal Interpolation for 2D and 3DVisualization,” Proc. Visualization ’95, pp. 77-84, 1995.
[13] G. Grigoryan and P. Rheingans, “Probabilistic Surfaces: PointBased Primitives to Show Surface Uncertainty,” Proc. IEEEVisualization 2002, 2002.
[14] G. Steel, Growth Kinetics of Tumors. Oxford: Clarendon Press, 1977.[15] A. Kansal, S. Torquato, G. Harsh, E. A. Chiocca, and T. Deisboeck,
“Simulated Brain Tumor Growth Dynamics Using a Three-Dimensional Cellular Automaton,” J. Theoretical Biology, vol. 203,pp. 367-382, 2000.
[16] M. Levoy and T. Whitted, “The Use of Points as a DisplayPrimitive,” Technical Report 85-022, Univ. of North Carolina atChapel Hill, Jan. 1985.
[17] M. Gross, “Are Points the Better Graphics Primitives?” ComputerGraphics Forum, vol. 20, no. 3, 2001.
[18] S. Rusinkiewicz and M. Levoy, “Qsplat: A Multiresolution PointRendering System for Large Meshes,” Proc. SIGGRAPH 2000,pp. 343-352, July 2000.
[19] H. Pfister and J. van Baar, “Surfels: Surface Elements as RenderingPrimitives,” Proc. SIGGRAPH 2000, K. Akeley, ed., pp. 335-342,July 2000.
[20] M. Alexa, J. Behr, D. Cohen-Or, S. Fleishman, D. Levin, and C.Silva, “Point Set Surfaces,” Proc. IEEE Visualization ’01, pp. 21-28,2001.
[21] W. Reeves, “Particle Systems: A Technique for Modeling a Classof Fuzzy Objects,” ACM Trans. Graphics, vol. 2, no. 2, pp. 91-108,1983.
[22] R. Szeliski and D. Tonnesen, “Surface Modeling with OrientedParticle Systems,” Proc. SIGGRAPH 1992, pp. 185-194, July 1992.
[23] M. Zwicker, M. Pauly, O. Knoll, and M. Gross, “Pointshop 3D: AnInteractive System for Point-Based Surface Editing,” ACM Trans.Graphics, vol. 21, no. 3, pp. 322-329, 2002.
[24] M. Kaus, S.K. Warfield, A. Nabavi, P.M. Black, F.A. Jolesz, and R.Kikinis, “Automated Segmentation of MRI of Brain Tumors,”Radiology, vol. 218, no. 3, pp. 586-591, 2001.
[25] S.K. Warfield, M. Kaus, F.A. Jolesz, and R. Kikinis, “Adaptive,Template Moderated, Spatially Varying Statistical Classification,”Medical Image Analysis, vol. 4, no. 1, pp. 43-55, 2000.
[26] W.H. Press, Numerical Recipes in C: The Art of Scientific Computing,second ed., p. 290. Jan. 1993.
[27] B. Chen and M.X. Nguyen, “POP: A Hybrid Point and PolygonRendering System for Large Data,” Proc. Visualization 2001, pp. 45-52, 2001.
[28] J. Cohen, D. Aliaga, and W. Zhang, “Hybrid Simplification:Combining Multi-Resolution Polygon and Point Rendering,” Proc.IEEE Visualization ’01, pp. 37-44, 2001.
Gevorg Grigoryan received the BS degree incomputer science and the BS degree inbiochemistry from the University of Maryland,Baltimore County, in 2002, where he worked asan undergraduate research assistant. Currently,he is a PhD student at the MassachusettsInstitute of Technology, Department of Biology.His current research interests lie in computa-tional biology and include protein design, denovo structure prediction, electrostatics in pro-
tein-protein interactions, and energetics of protein folding.
Penny Rheingans received the PhD degree incomputer science from the University of NorthCarolina, Chapel Hill, and the AB degree incomputer science from Harvard University. Sheis an associate professor of computer science atthe University of Maryland, Baltimore County.Her current research interests include uncer-tainty in visualization, multivariate visualization,volume visualization, information visualization,perceptual and illustration issues in visualization,
dynamic and interactive representations and interfaces, and theexperimental validation of visualization techniques. She is a memberof the IEEE Computer Society
GRIGORYAN AND RHEINGANS: POINT-BASED PROBABILISTIC SURFACES TO SHOW SURFACE UNCERTAINTY 573