57 3 design and performance of kenya’s tax system: an ... · design and performance of kenya’s...
TRANSCRIPT

57
Design and Performance of Kenya’s Tax System:An Inequality PerspectiveBernadette Wanjala13Abstract
The effectiveness of using taxation as a redistributive tool depends on the
design of the tax system. The Kenyan tax system comprises two main direct
taxes (individual income and corporate taxes), and three main indirect taxes
(Value Added Tax, Excise tax and Customs duties). Usage of income taxes
has declined over time. However, income taxes still contribute the largest
share of total tax revenue. There has been a deliberate shift towards indirect
taxes. The design and performance of the tax system has implications on
inequality. Under income taxes, widening of tax brackets, reduction of the
top marginal tax rates and increasing the levels of personal relief have made
income tax progressive and equitable. However, exemption of low-income
individuals from the tax net limits the effectiveness of the income tax as a
redistribution tool given that income tax payers are a small proportion of
the population. VAT is considered highly regressive, but the analysis shows
that the use of exemptions and zero-rating of specific commodities that are
mainly consumed by low-income earners has made the system more
progressive and thus more equitable. The equity objective under excise taxes
has mainly been pursued through use of high and largely differentiated rates
on goods that are considered luxurious. Overall, there has been increased
reliance on indirect taxes as opposed to direct taxes, which has had
implications on using the tax system to achieve income redistribution.
However, the regressivity of consumption taxes can be overcome by use of
exemptions and zero-rating of basic commodities. Taxation of wealth and
property income can play an important role in income redistribution but
still remains a big challenge. Also, the fast growing informal sector
undermines the use of tax policy to achieve redistributive goals. In conclusion,
the effectiveness of using tax policy to achieve redistribution objectives cannot
be underestimated, even though research has shown that equity objectives
are better pursued through expenditure policies rather than taxation.
1I acknowledge review comments by Prof. Francis Mwega, Prof. Terry Ryan, Dr. Mbui Wagacha, Mr. NjeruKirira and Mr. Jocelyn Ogai.

Readings on Inequality in Kenya: Sectoral Dynamics and Perspectives58
2 Even though these principles (equity, efficiency and simplicity) are either complementary or tradeoffs.3 The challenge, therefore, is to come up with an appropriate welfare measure.4 Policies are pro-poor if the social and economic indicators for the disadvantaged people improve morerapidly than those for the rest of the society (Vandemoortele, 2004).
Introduction
Governments need money. Modern governments need lots of money. Howthey get this money and whom they take it from are two of the most difficultpolitical issues faced in any modern political economy (Steinmo, 1993 asquoted by Hardiman, 2004)
From the mediaeval times, political authority has been used to raise financesfor the operation of governments. One way of raising finances is through taxation.In practice, there are three common objectives of tax systems: (i) to raise revenueto fund government operations; (ii) to assist in the redistribution of wealth orincome; and (iii) to encourage or discourage certain activities through the use oftax provisions (Karingi and Wanjala, 2005). In addition to the above objectives,taxation can also be used as a stabilization tool, whereby various instruments areadjusted depending on the economic situation of the country. The extent to whichthese objectives are met differs from country to country.
There are several principles that guide tax policy. The most commonly citedprinciples are adequacy, equity, exportability, neutrality and simplicity. Neutralityimplies that imposing a tax does not distort economic decisions. This is one of thestrong arguments for imposing sales tax. Simplicity implies that the tax collectionand assessment system does not impose costs greater than the revenue raised, andthe tax code should also be easily understood by tax payers. An adequate tax system,on the other hand, raises enough money to pay for public services. Exportabilityrefers to the extent to which taxes are paid for by non-residents, for example anexport tax. This is not an important aspect of Kenya’s tax system.
The principle of equity is the main concern of this Chapter.2 A tax system isequitable if it is fair. There are two measures of equity–horizontal and vertical equity.A system is horizontally equitable if persons or businesses in similar circumstances(in terms of welfare) have similar tax burdens. Taxes that affect one group (such aswage-earners) more harshly than another (such as investors) are not equitable.Income tax is an example of this disparity. Progressivity and regressivity areunderlying concepts under vertical equity, which are defined in terms of welfarepositions.3 Regressive taxes require lower-income families to pay a greaterpercentage of their income in tax than upper-income families. The classic regressivetax is a sales tax; this is why some governments zero-rate basic commodities as ameans of making the system more pro-poor.4 The sales tax in most cases has beenapplied as a uniform commodity tax and excludes leisure, which is one of thecommodities consumed by economic agents, thereby impacting on resourceallocation.

59
At firm level, failure to take into account the different distributional channelscan also discriminate against firms that undertake more distributional functionsafter the tax imposition point. Progressive taxes require upper-income families topay a larger share of their income in taxes than lower-income families. The classicprogressive tax is income tax. Proportional taxes assess each taxpayer equally andare, therefore, considered bad. Adam Smith is one of the early proponents ofprogressive taxation:
‘The subjects of every state ought to contribute towards the support of thegovernment, as nearly as possible, in proportion to their respective abilities;that is, in proportion to the revenue which they respectively enjoy underthe protection of the state…’ (The Wealth of Nations, as quoted in BritannicaEncyclopedia).
This implies that taxes should be based on the individual’s ability to pay, knownas the ability-to-pay principle, and the benefit principle, the idea that there shouldbe some equivalence between what the individual pays and the benefits one derivesfrom governmental activities. However, it is argued that horizontal equity is asubordinate of vertical equity, and the two concepts, therefore, go hand in hand.These principles of taxation are well known but the practice has deviated from theprinciples and greatly varies across countries (Thirsk, 1997).
One of the roles of the state is to ensure an equitable distribution of income andwell-being of its citizens. This can be pursued through a more equitable tax systemin addition to other policy instruments such as expenditure policies. The KenyanGovernment has over time implemented several measures (both through taxationand expenditure) to aid in income redistribution and consequently poverty andinequality reduction. Despite these attempts, inequality continues to be one ofKenya’s biggest development challenges. The 10 percent richest households controlmore than 42 percent of incomes, while the poorest 10 percent control 0.76 percentof income (SID, 2004). Inequality matters for both poverty reduction and growth.The ability of a country to grow and reduce poverty largely depends on thedistributional impact of the targeted fiscal policy initiatives. As acknowledged inthe Economic Recovery Strategy (ERS), Kenya’s tax system is depicted as complexand cumbersome, faced with low compliance, uneven and unfair taxes, and a narrowtax base with very high tax rate dispersions with respect to trade. Therefore, usingthe tax system to achieve redistribution of income remains a challenge.
The distribution of tax burden and the effect of taxes on inequality is at thecentre of public finance debate. A better understanding of the distribution of taxesis important in formulation and assessment of tax systems. Public discourse on taxpolicy focuses on who gains and who loses from a proposed tax measure. However,information on inequality and progressivity of a tax measure is in most cases lackingor inadequate. This study intends to fill this knowledge gap and provide advice onwhat constitutes a fair tax system.
Design and performance of Kenya’s tax system: An inequality perspective

Readings on Inequality in Kenya: Sectoral Dynamics and Perspectives60
The questions arising are:
• How has the Kenyan tax system evolved over time, and to what extent havethe reforms aided in achieving an equitable distribution of income?
• To what extent does greater progressivity in the rate schedule for personaltaxes contribute to increases in progressivity and inequality reduction?
• How do indirect taxes on consumption impact on the distribution of income?
• What are the implications of shifting reliance from income taxes towardsconsumption taxes?
Taxation, Progressivity and Inequality: Concept andMethodology
In practice, there are two fundamental concerns in public finance: who has thelegal liability of a tax (statutory burden) and; who bears the final/ultimate burdenof the tax (the economic incidence of the tax). It is through these concerns that taxpolicy can be used to achieve redistribution objectives. Tax burden can be shiftedto other agents mainly by altering economic behaviour through changes in prices.The degree of shifting depends on the elasticities of demand, supply and substitutionin the use of factors of production. Agents with lower elasticities are more likely tobear greater tax burden as compared with those with higher elasticities (thus greaterflexibility). Economic incidence is expected to be different in the short and longrun,given that long-run elasticities tend to be higher.
The distribution of the burden of a tax determines how a tax instrument can beused in achieving income redistribution, i.e. a more equitable tax system is onethat ensures that individuals with higher incomes (and thus expenditures) bear agreater tax burden as compared to the low-income earning individuals. Therefore,an equitable distribution of income is associated with a more progressive tax system.It is commonly accepted that a rate structure is progressive when the average taxrate rises with income, or when the marginal tax rate exceeds the average tax rate.The debate has been on how progressive a tax system should be for it to be used forredistribution purposes. Some have argued that a proportional tax system can alsobe used for this purpose, but only if accompanied with targeted expenditures andincentives towards the low-income class.
What, therefore, is the link between progressivity, inequality and taxation? Asindicated above, taxation can only be used as a redistribution tool if the structureis progressive. Inequality and progressivity are related, but quite distinct. Inequalityis defined over the entire income distribution, while progressivity focuses on relativeaverage tax rates faced by various income groups (Kesselman and Cheung, 2004).
There are various measures of assessing the distributional impact of taxes. Somerelate to the structure (how progressive the rates are), while others compare thepre-tax and post-tax distribution. The commonly used methods are: tax progression

61
measures; tax progressivity measures (concentration curves, dominance tests);marginal social cost analysis; and computable general equilibrium models (Gemmelland Morrissey, 2003). The basic methodology under the tax progression measuresis to allocate tax burdens to different agents according to income or consumptionlevels.
The total tax burden is expressed as an average tax rate (ATR), which is computedas the tax liability divided by a relevant measure of income/expenditure. A tax issaid to be progressive if the ATR rises with income/expenditure and regressive if itdeclines with income/expenditure. There are two types of progressivity indices.Local indices of progressivity are used to rank a given type of tax over a given rangeof income, while global progressivity characterizes the tax system across the entireincome scale. Global progressivity is preferred, given that progressivity can varywith income. A more global progressive tax system is associated with a moreequitable tax distribution. Lorenz and concentration curves assess the distributionof income by use of Gini coefficients. Under Lorenz curves, the cumulativeproportion of income recipients (ranked from lowest to highest) is plotted againstthe proportion of total income received, while under concentration curves,expenditures or tax payments are plotted against the proportion of populationranked by pre-tax income. The ATR and Gini index derived from these curves canbe used to derive ‘distributional progressivity indices’,5 which include:
• The Relative Share Adjustment index (RSA): expressed as RSAi = (1-ATR
i)/
(1-ATR), where ATRi is the average tax rate paid by the ith income group, and
ATR is the total tax collected as a proportion of aggregate income/expenditure. RSA
i > 1 indicates that the group pays a locally progressive tax,
and RSAi < 1 implies a locally regressive tax.
• Effective Progression index: Expressed by EP = (1-Ga)/(1-G
b), where G
a is the
Gini index for after-tax income, and Gb is the Gini index before tax. EP > 1
indicates progressivity.
• The Pechman-Okner index (PO): Expressed by PO = (Ga-G
b)/G
a, whereby
PO < 0 indicates progressivity.
• The Reynolds-Smolenski index (RS): expressed as RS = Ga-G
b, whereby RS <
0 indicates progressivity.
The major limitation of these indices is that they use a social welfare functionthat gives most weight to individuals close to the mode of the distribution as opposedto the tails (Martinez-Vazquez, 2001). The alternative is to use an equally distributedequivalent level of income/expenditures, such as the Atkinson’s index.6
Design and performance of Kenya’s tax system: An inequality perspective
5 Musgrave and Thin (1948) as quoted by Martinez-Vazquez (2001), Baum (1987) as quoted by Kesselmanand Cheung (2004).
6This is one of the measures of income inequality. Unlike the Gini coefficient, this measure has theability to gauge movements in different income segments.

Readings on Inequality in Kenya: Sectoral Dynamics and Perspectives62
The marginal social cost analysis is used to examine the impact of a tax on anindividual’s well-being. This can be done by construction of money-metric measuresof utility, and then determine how a tax would affect this level of utility. Anotherapproach is by use of Computable General Equilibrium models, specifically the‘representative household approach’, whereby the tax burden is computed for asmall number of households whose composition, income sources and expenditurepatterns are assumed to mimic the entire population. This type of analysis givesthe economic incidence, given that agents are allowed to react to price changesresulting from imposition of a tax, yielding an economy-wide impact. Followingfrom the welfare measure in social cost analysis, another measure of welfare that iscommonly used in Computable General Equilibrium models is the equivalentvariation (EV), which represents the amount of money an individual would bewilling to pay to avert a change in prices resulting from an increase in a tax rate.The EV is, therefore, a measure of the welfare loss resulting from a tax change.
The applicability of these methods above on the Kenyan case depends on theavailability of data. The tax progression and tax progressivity measures are appliedin this Chapter. Use of other methodologies is left as an area of further research.
There are several assumptions that are required for an incidence analysis.According to Martinez-Vazquez (2001), the following assumptions could be madeunder incidence analysis:
• Personal income tax is assumed to be wholly borne by its recipients so that aprogressive income tax system would yield a progressive incidence.
• There is no universal agreement as regards the shifting of incidence ofcorporate taxes. Firstly, it can be assumed that there is no shifting, implyingthat shareholders pay the full tax mainly by equalizing after-tax rates of returnfor all capital. Secondly, the burden can be shifted to consumers in the formof higher consumer prices depending on the existing market structure.
• Consumption taxes (VAT, sales tax, excise and trade taxes) are assumed tobe borne by the final consumer. VAT and sales tax are assumed to beregressive, but exemptions and zero-rating of basic commodities could makethem less regressive. Excise taxes on the other hand can be progressive iflevied on items that are considered luxuries. The regressivity of customs dutiesdepends on who is the final consumer of imported goods.
• The incidence of property taxes is also controversial. The tax burden can befully borne by capital owners or shifted to tenants.
In summary, conventional incidence analysis assumes that the final tax burdenof direct taxes is borne by factors of production (labour and capital), while indirecttaxes are borne by consumers.

63
Tax Structure, Reforms and Implications on Inequality
Kenya makes use of several tax instruments. Theoretically, use of many instrumentshas both advantages and disadvantages (Karingi and Wanjala, 2005). Consideringthe advantages, diversifying the tax system can provide insulation against economicor cyclical changes, which might affect only one particular tax. Diversifying taxrates also ensures lower rates across several tax handles, thereby minimizing thedistortionary effect of the tax given that distortion increases with the tax rate.Governments may also diversify the tax structure for political reasons, which ensuresa broader tax base with lower tax rates. Finally, multiple tax bases may reduceevasion or avoidance because taxpayers are unlikely to be able to avoid all taxes.Looking at disadvantages, using several tax instruments makes the system morecomplex, and therefore increases administrative costs. Also, diversification will notnecessarily reduce distortions if several taxes apply to one good/service. Thecumulative distortionary effect could be higher. Lastly, it is not easy to determinethe individual distribution of tax burden when several instruments are applied.
The current tax structure comprises two main direct taxes (individual incometax and corporate tax) and three main indirect taxes (Value Added Tax, excise andcustoms duties). A look at the relative use of these instruments over time revealsthat the importance of income tax has been declining, though it still plays animportant role in its contribution to total tax revenue. According to variousEconomic Surveys, income taxes accounted for an average of 44.6 percent over theperiod 1968/69-1972/73, but declined to an average of 35.8 percent over 2001/02-2005/06. Corporate taxes accounted for a bigger proportion than individual incometaxes till 1997/98, when individual taxes became more important. For instance, in2005/06, income taxes accounted for 38.5 percent of total tax revenue, of which54.4 percent were individual income taxes, while corporate taxes accounted for45.6 percent. Value added taxes have gained importance over time, while tradetaxes have had a declining role. Over 2001/02-2005/06, VAT accounted for anaverage of 27.5 percent, excise taxes accounted for 20.1 percent, while customs dutiesaccounted for about 13.0 percent. These taxes have evolved over time from an initialtax structure that was inherited from the British system.
In general, the tax reform experience can mainly be sub-divided into two mainphases: 1963/64-1983/84 and 1984/85 to date.
The 1963/64-1983/84 phase: This period was characterized by piece-meal changes,which are explained below under the tax-by-tax analysis. During this period, theeconomy performed well over the most of the 1964-80 period, with GDP growthaveraging 5.8 percent per year in 1965-73 and 5.3 percent in 1974-80. Revenueshortfalls were not severe, as surplus was experienced in at least one year.
Design and performance of Kenya’s tax system: An inequality perspective

Readings on Inequality in Kenya: Sectoral Dynamics and Perspectives64
The 1984/85 to date phase: This period marked the beginning of major tax policyreforms in Kenya. The reforms were necessitated by the need for increased resourcemobilization from the soaring overall balance of payments crisis in the late 1970s.There was slackened growth in the mid-1970s, which was partly attributed to thefirst oil shock in 1973, the coffee and tea boom in 1976-79, which sparked an increasein consumer and government spending, and also the break-up of the East AfricanCommunity in 1977, which ended the access of Kenyan exports to Ugandan andTanzanian markets. As a result, balance of payments deficits rose from 3 percent ofGDP in 1975-77 to 10-11 percent in 1978-82. By the end of the 1970s, there wasclear evidence of the need to change the direction of economic policy. This wasembarked on between 1978 and 1982. Structural Adjustment Programmes werethen introduced in 1979 with the main objective of restoring macroeconomicstability following the disruptions of the 1970s (mainly the oil shocks) and to reviveeconomic growth through increased resource mobilization and more efficientutilization of resources. These reforms were outlined in Sessional Paper No. 1 of1986 on Economic Management for Renewed Growth.
Key tax policy reforms were initiated in 1984/85 under the Tax ModernizationProgramme (TMP), which was outlined in the Sessional Paper No. 1 of 1986. TheTMP had a set of objectives, among them raising revenue level from 22 to 28 percentof GDP, improving economic efficiency of the tax system through lowering andrationalizing of tax rates, and enhancing greater reliance on self-assessment systemssupported by selective audit. Other objectives included improving administrativeefficiency through computerization and audit capacity, as well as developingcapacity for tax policy analysis to implement organizational reforms. However, theobjectives of enhancing administrative efficiency were not implemented until the1990s.
Apart from the major tax policy reforms that have been carried out under thisperiod, major administrative reforms were implemented from 1994/95. However,some few administrative reforms (such as introduction of the Personal IdentificationNumber) were carried out before 1994/95.
Below is a tax-by-tax analysis of the tax structure, tax reforms and theirimplications on inequality.
Personal income tax
Income taxes are levied in Kenya as legislated under the Income Tax Act, whichcame into operation on 1st January 1974 after the dissolution of the East AfricanCommunity Management Act. This is a direct tax that is imposed on income derivedfrom business, employment, rent, dividends, interests and pensions, among others.

65
Structure of personal income tax
Personal income tax and Pay As You Earn (PAYE) are charged at the same graduatedscale. The income tax brackets for 2005/06 are:
• 10% on the first Ksh 121,968;
• 15% on the next Ksh 114,912;
• 20% on the next Ksh 114,912;
• 25% on the next Ksh 114,912; and
• 30% on all income over Ksh 466,704 (annually).
Every taxpayer is granted a personal tax relief, which is Ksh 13,944 for fiscalyear 2005/06. Insurance and mortgage reliefs are also available for eligible persons.The total tax credit is spread evenly during the charge year. At the end of the year,an individual submits his or her self-assessment on total income received fromvarious sources. Should the tax credit be lower than actual tax charged during theyear, the balance of tax due is payable back to the taxpayer.
Withholding taxes are deducted at source from the following sources of income:interest, dividends, royalties, management or professional fees, commissions,pension or retirement annuity, rent, appearance or performance fees forentertaining, sporting or diverting an audience. The person paying out theseamounts is required to withhold a certain percentage, as prescribed in the Act, andremit the same to the Commissioner of Income Tax by the 20th of the followingmonth. A withholding tax certificate is issued for the amount withheld.
Income tax reforms: The equity and growth trade-off
(i) Piecemeal reforms: Initial reforms under income tax were mainly carriedout to raise more revenue. Some of the measures included reduction in personalreliefs and an increase in corporate tax rates. For instance, married allowance wasreduced from K£700 to K£600, single allowance from K£225 to K£216 and singlewith children from K£450 to K£432 in 1965/66 in a bid to raise more revenue.Married allowance was further reduced from K£600 to K£480. A new income taxrate of Ksh 13 for every pound was introduced on incomes over K£15,000. Effortswere also made to increase the tax base in 1970/71 when PAYE was extended tocover the whole range of income from employment. Tax payable on income fromother sources (self-employed and other sources) was paid in quarterly instalments.Tax brackets and rates were also restructured to simplify the tax system. Thethreshold exemption limit was also lowered; for instance, from K£960 to K£720for a family of four children or more in 1974/75. This type of income tax systemdepended on the marital status of a taxpayer and the number of children, whichrepresented a form of gender inequality. Further, personal reliefs varied between
Design and performance of Kenya’s tax system: An inequality perspective

Readings on Inequality in Kenya: Sectoral Dynamics and Perspectives66
married men, married women, special single persons (single with children), andsingles, with greater preference being awarded to married men.
Kenya, like many countries, hoped to use the income tax system to achieveredistribution (equity) objectives. Use of income tax to achieve an equitable taxburden was initiated in early 1970s with rationalization of tax rates and consequentsuspension of the surtax on employment in 1972/73. An income tax system withmany rates and brackets was applied in a quest to achieve progressivity, even thoughthe effectiveness of achieving such progressivity was undermined by the lowexemption rates (Table 3.1).
There were eight rates, with a top marginal tax rate of 65 percent over the 1970sand early 1980s. Also, the highly graduated tax system implied that only smallerproportions of income fell into the top tax bracket. The Income Tax Act was passedin 1974 and introduced new income tax rates. These rates and brackets were furtherrationalized and widened to reduce tax burdens on those with lower and fixedincomes and also to make the tax more equitable. A differentiated personal reliefdepending on the marital status and household size also ensured a more equitabledistribution of tax burden, whereby families with more children were entitled tohigher levels of relief, even though this relief was unified for all families in 1977/78.
(ii) Income tax reforms under the TMP: The personal income taxes were alsoconsidered as an essential instrument that could be used to achieve not only equityobjectives, but also growth outcomes under the Tax Modernization Programme(TMP). Income taxes in the pre-reform period were mainly characterized by multipletax brackets (eight in the 1960s and 1970s), with very high marginal tax rates (65%).The multiple rates were used to achieve nominal progressivity, guided by theprinciple that taxpayers should pay more income tax as a percentage of their incomeas they earn more. This has been achieved, traditionally, using progressively higherincome tax rates applied on progressively higher incomes. However, it should be
Table 3.1: Personal income tax progressivity
1974-1981 1982-85
Annual taxable income (Ksh) Rate (%) Annual taxable income (Ksh) Rate (%)
1 – 24,000 10 1 – 30,000 10
24,001 – 48,000 15 30,001 – 60,000 15
48,001 – 72,000 25 60,001 – 90,000 25
72,001 – 96,000 35 90,001 – 120,000 35
96,001 – 120,000 45 120,001 – 150,000 45
120,001 – 144,000 50 150,001 – 180,000 50
144,001 – 192,000 60 180,000 – 240,000 60
Over 192,000 65 Over 240,000 65
Source: Budget statements (various) and Finance Acts

67
realized that effective progressivity could also be achieved using a flat rate, mainlyby use of a personal exemption system. In this case, those earning more pay morein taxes as a percentage of income, thereby achieving progressivity. The maincriticism levied against flat taxes is that they dramatically shift the burden of taxationfrom high-income earners to low-income and middle-income earners, therebypromoting inequality.
The use of high and increasing marginal tax brackets and rates imposes a trade-off between growth and equity. Reducing the progressivity of the tax system, whileallowing the government the same tax revenue as a percentage of GDP leads tohigher levels of national income (Emes et al., 2001). Since the tax base increaseswhile the average tax rate remains unchanged, this suggests that governments canactually increase their revenues by moving to “flatter” tax systems. There is empiricalevidence that high and increasing marginal tax rates have negative effects oneconomic growth mainly through its negative effect on savings and investment,which are key ingredients for long-term growth.7 This implies that even though thehigh and increasing marginal tax rates in Kenya could be used to achieve nominalrate progressivity, they cannot be used to achieve growth outcomes as envisaged inthe TMP. It was in light of such realization that the income tax structure wasrestructured and rationalized. There has been continued rationalization throughlowering of rates and also reducing the number of brackets. Regular adjustment ofbrackets and relief were done to counter the inflation creep and also to make thetax more equitable. The structure of personal income tax was used to achieveredistribution objectives mainly through gradual lowering of the top marginal taxrate from 65 percent over the period 1974-89 to the current 30 percent. Given thathigh tax rates are a disincentive to savings, the lowering of the top marginal taxrate was used to remove the savings disincentive both for households andenterprises. The reduction in the number of tax brackets helped to remove thenominal progressivity of the tax system, whose effectiveness was limited, while atthe same time the many tax brackets created a complex system.
There were also regular increases in the personal income tax relief. This type oftax relief has been a useful instrument in providing income tax exemption for low-income earners and has been used by governments the world over to achieveredistribution objectives. The level of relief in Kenya has been increased over timeto its current annual level of Ksh 13,944, with the most significant reform being theunification of the single and the married (family) relief into one. In general, fairnessand efficiency were central in income tax rationalization in order to ensure that theobjectives of TMP were translated to reality.
Design and performance of Kenya’s tax system: An inequality perspective
7Marsden (1983), Koester and Kormendi (1989), Easterly and Rebelo (1993), Mullen and Williams (1996),Becsi (1996), and Engen and Skinner (1996) as quoted by Emes et al. (2001).
Readings on Inequality in Kenya: Sectoral Dynamics and Perspectives68
Income taxes and progressivity
One of the objectives of the Tax Modernization Programme was to have an equitabletax system. How effective have the different tax instruments been in redistributingwealth or income in the country? In both theory and practice, tax instruments varygreatly in their ability to redistribute wealth or income. Individual income taxesand wealth taxes are the primary instruments for achieving income redistribution(Karingi and Wanjala, 2005). Income taxes are recognized worldwide as having theability to aid in redistribution of wealth and income. However, achieving theredistributive policy via the income tax system can only be achieved through aneffective progressive tax system.
Progressivity has been in most times achieved through progressively higher marginaltax rates. However, this creates disincentives for entrepreneurial activities, savingsand investment. Taxes on consumption, on the other hand, are generally assumedto be regressive given that lower-income groups tend to spend a higher percentageof their income than higher income groups. The regressivity of consumption taxesis not as severe when considered over a lifetime perspective, as espoused in theoriescovering inter-generational equity issues.
There are various ways of addressing inequality through the design of specific taxinstruments. Looking at international experience, there are three major waysthrough which the redistribution goal can be achieved via the tax system (Karingiand Wanjala, 2005). Firstly, the tax system can be used as part of a social welfareprogramme to provide cash transfers to low-income individuals. Secondly, a highincome tax threshold can be used to exempt certain low-income individuals fromthe income tax net. Lastly, provisions (such as tax deductibility of individual pensionschemes, life-insurance premium payments, mortgage interest costs and educationpolicies) that seek to reduce the tax burden of low-income individuals can beadopted. For the Kenyan case, only the second and third instruments have beenused. Income tax reliefs have been used to exempt low-income taxpayers from thetax net. For instance, it was indicated that increases in tax relief resulted in thefollowing number of taxpayers being removed from the tax net: 140,000 in 1987/88; 60,000 in 1989/90; 50,000 in 1992/93; 150,000 in 1993/94; 230,000 in 1994/95; 152,000 in 1997/98; and 200,000 in 2000/01 (Annex 3. 1).
The third option has also been used under the income tax system, but has mainlybenefitted middle- to high-income earners given that they more likely invest ininsurance policies and mortgages. The income tax thresholdis currently four timesKenya’s per capita income (Figure 3.1),8 which implies that the lower income group
8 The multiple of the income tax threshold to per capita income has been computed by taking the country’sannual tax relief and using the lowest income tax rate and asking how much an individual would have toearn in order to be in a net income tax paying position. As per 2003, an individual earning Ksh 126,720was liable to an income tax at 10 percent of Ksh 12,672. Given that there was an annual tax relief of Ksh1,056 monthly, then the tax threshold is approximately Ksh 126,720 (around US$ 1,690 at the averageexchange rate for 2003), which is four times the current per capita income of about US$ 404.

69
0
20 0
40 0
60 0
80 0
1 0 0 0
1 20 0
1 40 0
1 60 0
1 80 0
1 995 1 996 1 997 1 998 1 999 200 0 200 1 20 0 2 20 0 3
US
$
PIT Th r esh old Per Capita In com e
takes longer today to be in a positive net personal income tax paying positioncompared to, for instance, 1995.
How progressive has Kenya’s income tax system been? Tracing the changes inthe income tax structure reveals that significant changes were experienced in 1974,1988, 1990, 1995 and 2000. The changes in these years mainly relate to reductionin the number of brackets, widening of brackets and also lowering of the topmarginal tax rates. To assess the level of progressivity, the approximate tax payablewas computed using the available information on tax brackets and tax relief (Annex3.2).
Progressive and arbitrary annual income levels were chosen and their level oftax payable computed. This gives an indication of the level of progressivity of anincome tax structure.9 A tax is said to be progressive if the tax burden (ratio of taxpayable to income) rises with income, regressive if it falls with income, andproportional if constant. This is key to fairness (ability to pay principle), which isone of the main principles of taxation.For example, tax payable by individualsearning an annual income of Ksh 50,000 and Ksh 500,000 for the years 1974, 1988,1990, 1995 and 2000 is given as:
Ksh 50,000:
1974 => [(24,000*0.1) + (24,000*0.15) + (2,000*0.25)] – 720 = 5,780
1988 => [(39,600*0.1) + (10,400*0.15)] - 1,500 = 4,020
1990 => [(42,000*0.1) + (8,000*0.15)] - 2,640 = 2,760
1995 => (50,000*0.1) - 4,550 = 450
Figure 3.1: Multiple of tax threshold to per capita income
Source: Karingi and Wanjala (2005)
Design and performance of Kenya’s tax system: An inequality perspective
9 Though in nominal terms, this measure can be sometimes misleading. There is need for measurementof real or effective progressivity.

Readings on Inequality in Kenya: Sectoral Dynamics and Perspectives70
2000 => (50,000*0.1)-11,520 = -6,520; zero tax payable because taxcomputed is negative
Ksh 500,000:
1974 => [(24,000*0.1) + (24,000*0.15) + (24,000*0.25) + (24,000*0.35) +(24,000*0.45) + (24,000*0.5) + (48,000*0.6) + (30,8000*0.65)] – 720 =271,480
1988 => [(39,600*0.1) + (39,600*0.15) + (39,600*0.25) + (39,600*0.35) +(39,600*0.45) + (302,000*0.65)] – 1,500 = 246,280
1990 => [(42,000*0.1) + (42,000*0.15) + (42,000*0.25) + (42,000*0.35) +(332,000*0.45)] - 2640 = 182,460
1995 => [(78,000*0.1) + (78,000*0.15) + (78,000*0.2) + (78,000*0.25) +(78,000*0.35) + (110,000*0.375)] – 4,550 = 118,600
2000 => [(104,400*0.1) + (104,400*0.15) + (104,400*0.2) + (104,400*0.25)+ (82,400*0.3)] – 11,520 = 86,280
Plotting the level of income against the tax burden, which is given as total taxpayable as a proportion of total income, gives an indication of progressivity of a taxsystem (Figure 3.2). The 45 degrees line indicates a proportional tax system (eventhough it is not drawn to scale, the curve can give an indication of the progressivity/regressivity of the system). The further to the right a curve is from the proportionalline represents a more progressive tax system, and the further to the left representsa more regressive tax system.
Two important points emerge from this analysis. First, the widening of taxbrackets and at the same time increasing the level of tax relief reduces the amountof tax payable and consequently the tax burden. The analysis indicates that morepeople have fallen out of the tax net as a result of widening the brackets andincreasing the relief over time. However, these reforms have implications on thedistributional aspects of income taxes (progressivity), which brings us to the secondpoint.
Looking at the redistributive aspects of income taxes over time, it can be deducedthat the income tax system has become more progressive over time (but in nominalterms). From the analysis, it can be shown that the income tax system in 1974 wasless progressive (and therefore less equal/fair) as compared to the current structure.As earlier discussed, the continued rationalization of tax rates, increase in reliefand also widening of tax brackets (and also increased level of exemptions) havemade the tax system more progressive and hence more equitable. Thus, flatter taxsystems with significant levels of relief are more desirable than a highly graduatedtax system, which is a more complex system. It is widely accepted that substantialenforcement, compliance, and efficiency costs arise from highly progressive incometaxes.

71
To what extent can a progressive income tax system help reduce inequality?Research has shown that income taxes have not played a major role in reducinginequality in developing countries (Bird and Zolt, 2005). In developing countriessuch as Kenya, the effects of progressive income taxation are likely to be smallerthan the distributional impacts of consumption taxes such as VAT and excise taxes.This is because the poor are effectively outside the tax net (because of tax relief andhigher tax thresholds), which undermines the effectiveness of using income tax asa redistribution tool. Personal income taxes cannot ‘level-up’ distributionalinequities but proper fiscal design can abate inequality (Bird and Zolt, 2005). Relyingon a progressive income tax to accomplish any desired redistribution in developingcountries may often amount to little more than ‘digging deeply…with a sieve’,(Simons, 1938 as quoted by Bird and Zolt, 2005). Therefore, expenditures could bea more effective redistributive tool than income taxation, even though the overalldistributional fiscal incidence is what is most important rather than any stand-alone fiscal puzzle.
Design and performance of Kenya’s tax system: An inequality perspective
Source: Own computation
Figure 3.2: Nominal income tax progressivity
0.00
10.00
20.00
30.00
40.00
50.00
60.00
70.00
25,00050,00 0
75,00 0
100 ,0 00150 ,0 00
200 ,0 00300 ,0 00
500 ,0 00
1 ,0 00 ,0 00
Income Level
Tax
Bur
den
(%)
1974 1988 1990 1995 2000
45deg

Readings on Inequality in Kenya: Sectoral Dynamics and Perspectives72
Corporate income tax
Structure of corporate income tax
Corporate income tax (CIT) is charged on profits of limited liability companies at aflat rate of 30 percent for local companies and 37.5 percent for foreign companies.Companies that are newly listed at the Nairobi Stock Exchange attract lower ratesof 20, 25 and 27 percent for an initial period of five years.
(i) Piecemeal reforms: There were very few reforms carried out undercorporate tax between independence and the advent of TMP. The only reforms underthe CIT during this time included raising of the tax rates over time; for instance, by50 cents in 1965/66, 50 cents in 1967/68 and by 5 percent in 1974/75.
There was differential treatment of domestic and foreign companies. This wasbecause of the perception that domestic companies needed some form of protectionas opposed to foreign companies.
(ii) Corporate tax reforms under TMP: The increased need for investment andintensified competition for investment funds in a globalized world necessitatedmajor reforms in corporate taxation. Major changes have involved the lowering oftax rates. The local company tax rates were reduced from 45 percent in 1974 to thecurrent 30 percent, while tax rates on foreign companies were reduced from 52.5percent in 1974 to 37.5 percent currently. These measures have been aimed atincreasing the disposable income for both corporate and individuals, thusencouraging private investment. In 2006/07, newly listed companies at the NairobiStock Exchange started enjoying lower corporation tax rates of 20, 25 and 27 percentfor the initial five years of inception.
A differentiated CIT rate has been applied to domestic versus foreign companies(Figure 3.3). With the advent of the Kenyanization policies since independence,this differentiated regime was meant to encourage local registration andincorporation of the companies. CIT rates have also been used as a means ofachieving export industrialization strategy mainly through use of tax incentives.One example of such incentives is the tax holiday for ten years for companies wishingto invest in Kenya for export. Repatriation of dividends and extending favourableinvestment deduction allowances has been critical lynchpins of the income taxsystem for companies wishing to invest in Kenya (Karingi and Wanjala, 2005).
Looking at the reform experience, personal income tax rates were much higherthan corporate tax rates until 1996. For instance, the top personal income tax ratein 1974 was 65 percent, while the corporate income tax for local companies was 40percent. This presented a case of horizontal inequality because the taxes affected

73
individual wage earners more harshly than company owners or investors, and thuswere not equitable. Therefore, the move to equalize the top corporate tax rate withthe top personal income tax rate was not only a way of reducing tax evasion throughtaxpayers opting to declare income as a profit (PIT or corporate) that attracts alower rate but also represented a means of achieving horizontal equity.
Consumption taxes
VAT structure
VAT was introduced in Kenya in 1990 after replacing sales tax. The tax is chargedon the supply of taxable goods or services made or provided in Kenya and on theimportation of taxable goods or services into Kenya. The guidelines of VAT areoutlined in the VAT Act, Cap 476. The definition of designated, exempt and zero-rated goods and services are contained in the various schedules in the VAT Act. Thedifference between VAT and sales tax is that sales tax never included services.
VAT is a multi-stage consumption tax based on the destination principle.10 Thetax is applied to the sale of goods and services at all stages of the production anddistribution chain, unlike sales tax, which only applied to final goods. Only registeredtraders are required to charge VAT and they include sole proprietors, partnerships,limited liability companies or corporations. The VAT threshold is an annual salesturnover of Ksh 3 million, or Ksh 2.4 million over 9 months or Ksh 1.8 million over6 months or Ksh 1.2 million over 3 months.
Design and performance of Kenya’s tax system: An inequality perspective
10 The VAT destination principle implies that goods are subject to VAT when they reach their destination,which implies that exports do not attract VAT in their country of origin.
Source: Budget Statements (various)
Figure 3.3: Corporate tax rates vs personal income tax rates
0.00
2,000.00
4,000.00
6,000.00
8,000.00
10,000.00
12,000.00
14,000.00
1974 1988 1990 1993 1995 1996 1998 2000
Year
Ksh
s
0
10
20
30
40
50
60
70
Perc
ent
Relief Top PIT CIT - local CIT - foreign

Readings on Inequality in Kenya: Sectoral Dynamics and Perspectives74
The 2005/06 standard VAT rate is 16 percent, with 14 percent being applicableto hotels and restaurants services. Also included under the 14 percent rate areaccommodation and all other services provided by hotel owners or operators,including telecommunications, entertainment, laundry, dry cleaning, storage, safetydeposits, conference and business services.
Several commodities are zero-rated under VAT. The term zero-rating is used inthe VAT law to refer to supplies of goods and services that are subject to tax buttaxable at the rate of zero percent; zero-rated supplies are deemed to be taxablesupplies. The zero-rating concept was introduced in the VAT system to enableexporters, manufacturers and suppliers of zero-rated goods and services to claimrefund of tax paid on inputs incurred in dealing with zero-rated supplies. Examplesof zero-rated supplies include all exports, agricultural inputs, pharmaceuticals, andeducational materials, among others. The VAT law provides for zero-rating ofexported goods irrespective of the tax status of the goods. The concept of zero ratingis a common phenomenon among countries where the VAT system is in operation.
Some commodities are considered exempt under VAT. Exempt supplies are nottaxable and do not form part of the taxable turnover. Persons who deal exclusivelyin exempt supplies are not liable to register and cannot claim input tax on thesesupplies. Exempt supplies include financial services, insurance, public educationand training services, health (including veterinary) services, sanitary services,agricultural services, and social welfare services.
VAT reforms
(i) Piecemeal reforms: Consumption taxes were levied for a short period inKenya (1971/72) and were mainly aimed at raising revenue. The tax had a similarstructure as excise taxes whereby commodities attracted different rates dependingon the quality of the product. For instance, traditional beer attracted a lower ratethan manufactured beer. Similarly, the rates on cigarettes were lower for lowerquality brands as compared to higher quality brands. This differentiated systempromoted vertical equity as compared to a flat rate system.
Consumption taxes were replaced by sales tax in 1972/73, a shift that was mainlynecessitated by the need for additional revenue. The sales tax was not only leviedfor revenue purposes, but like excise taxes, it also had the objective of controllingconsumption of specific commodities such as cigarettes and beer. For instance, thetax rates on beer and cigarettes were increased in 1974/75 in a bid to discourageconsumption of these commodities. The sales tax was also used to stimulate localproduction through increased domestic demand by reducing sales tax rates on localproducts in order to encourage domestic production.
The slight change in policy direction towards achievement of income distributionobjectives was witnessed in 1978/79 when the sales tax threshold was increased in
75
order to exempt small manufacturers from the tax net. Some income-specific policieswere also pursued; for instance, lowering duties on passenger cars so as to makethem more affordable, even though this was targeted at all income cadres. Despitethis shift, revenue mobilization continued to be the main objective, which was inline with the government’s policy of relying more on indirect taxes as a major sourceof revenue. Sales tax rates were also adjusted upwards over time to correct forinflation.
(ii) VAT reforms under TMP: After the inception of TMP, discretionary taxpolicy used sales tax as an instrument to maximize revenues from temporaryeconomic shocks such as in 1986/87 when sales tax on oil products was increasedand remissions on oil products revoked as part of a fiscal decision to increase theshare of the windfall gains from low oil prices in 1986.
VAT replaced sales tax with effect from 1st January 1990. The input credit systembased on the destination principle was adopted at its introduction.11 The standardVAT rate was set at 17 percent and it was to not only cover manufactured goods,but also all goods and services. The initial phase of VAT introduction had a complexsystem, which had 15 different rates. The only advantage of having such adifferentiated rate structure was that the system was more progressive as comparedto the flat rate.
Several changes have occurred in the VAT since its introduction (Figure 3.4).The major objective of reforming the VAT system was to improve its administrationthrough rationalization of rates. Other objectives of the rationalization were toremove misclassification, improve compliance, reduce smuggling and also reducerequests for exemptions. Lowering of the top rates was mainly to make the localindustries more competitive. The continued rationalization of rates has involvedboth lowering of the top rate and also reducing the number of tax rates. For instance,the number of VAT rates was reduced to 9 in 1990/91, just a year after itsintroduction, and eventually to three rates in 2005/06. The top rate on the otherhand was lowered from 210 percent for sales tax to the standard rate of 16 percentin 2005/06. The highly complex system encouraged tax evasion and also acted as adisincentive to both savings and investment. It has been shown that high marginaltax rates and a largely differentiated rate structure impose efficiency costs.12
The VAT was also used to finance unexpected increase in expenditures, forinstance in 1997/98. Rate reductions were mainly due to concerns with the taxburden and also as a means of revamping Kenyan industries by promoting localproduction, thereby stimulating economic activity. The VAT, being a tax on
Design and performance of Kenya’s tax system: An inequality perspective
11 Under this method, all VAT registrants are obliged to collect and remit VAT on their taxable supplies,with an allowance to recover tax paid on purchases.
12 Marsden (1983), Koester and Kormendi (1989), Easterly and Rebelo (1993), Mullen and Williams(1996), Becsi (1996), and Engen and Skinner (1996) as quoted by Emes et al. (2001).

Readings on Inequality in Kenya: Sectoral Dynamics and Perspectives76
13 See Katz Commission 1994 (South Africa) as quoted by Cnossen (2003), Bird and Zolt (2005).
consumption, is generally considered highly regressive, but use of exemptions andzero-rating of basic commodities have made the system less regressive. It is only in2003/2004 when the VAT was seen as an important instrument that can be usedto boost consumption demand in the country. This was done by reducing thestandard VAT rate with an objective of making consumer goods more affordable.
VAT and progressivity
A largely accepted notion about consumption taxes is that they are considered tobe highly regressive. This implies that they place a greater tax burden on the pooras compared to the rich. The burden is higher because low-income individuals spenda higher percentage of their income on consumption than high-income individuals.Countries that maintain progressive tax systems take several measures to removethe regressivity of VAT. These measures include: (i) exempting food and socialnecessities; and (ii) taxing luxuries at high rates and necessities at lower rates. Outof the 105 countries with VAT, about 50 developing countries exempt foodstuffsfrom tax, while 26 (mainly industrialized economies) apply reduced rates (Cnossen,2003). Countries in the South African Development Community (SADC) exempt anumber of goods such as basic foodstuffs, water, medicines, pharmaceuticalproducts, newspapers, books, agricultural inputs (seeds, fertilizer, animal feeds),public passenger transport, and handicraft products. A differentiated indirect taxstructure could also be used to achieve vertical equity. However, this type ofstructure leads to different treatment of households with the same total expenditurebut with different preferences. This reveals the importance of social choice (adistinction between needs and tastes) in determining the level of indirect tax burdena household will bear (Palme, 1996).
Looking at the VAT structure, the inclusion of the retail stage (with a higherthreshold) is expected to result in a less regressive structure as compared to onethat only includes the production stage, given that expensive goods (especiallyluxuries) have a higher taxable value (Cnossen, 2003). Also, the inclusion of servicesmitigates progressivity because services tend to be more income elastic as comparedto goods.
Progressivity of consumption taxes can also be increased through imposition ofhigher-than-standard rates on luxuries. However, some research findings haveargued that the disadvantages of differentially higher multiple rates (efficiencyconsequences) outweigh the possible redistributive gains.13 This is mainly becausesome of the goods in these categories represent a minimal proportion of householdexpenditure. The general rule is that the distortionary effect of taxes increasesproportionately with the square of the tax rate, such that doubling the rate of a taximplies a four-fold increase in its efficiency costs (Bird and Zolt, 2005). Therefore,

77
from an efficiency perspective, it is better to impose a single rate on a broad baserather than a highly segmented base with differentiated rates, even though thisargument needs to be balanced with the need for equitable distribution.
Findings from the 1994 Katz Commission in South Africa (as quoted by Cnossen,2003) indicated that “providing relief to the poor through exemptions and VATzero-rating is likely to be both unsound policy and ineffective social policy”. It wasargued that this is because poorer households spend much less than richerhouseholds in absolute terms, and also richer households tend to buy moreexpensive varieties of food. These findings are also confirmed in other countries,such as Ireland and New Zealand (Cnossen, 2003).
From the reform experience, it has been shown that Kenya adopted a fairlycomplex VAT system, which imposed significant administrative costs because ofthe difficulty of defining supplies eligible for lower or zero rates. Rationalizing therates, which also included zero-rating some of the items, was for not only achievingadministrative ease, but also for redistributive purposes. Regressivity of the VAThas been addressed through reduction of the tax burden on basic goods and servicesthrough zero-rating of the items. Targeting basic services would greatly benefit thepoor because it is believed that these commodities may constitute a higherproportion of total spending of low-income individuals as compared to high-incomeindividuals, as opposed to the above argument. However, the use of lower VATrates may be ineffective in achieving distributional goals if individuals of differentincome groups are purchasing many of the same goods and services.
Design and performance of Kenya’s tax system: An inequality perspective
Source: Budget Statements (various)
Figure 3.4: Rationalization of VAT rates
15
98
6
4 4 43 3
4 4 4 4 43
17
18 18 18 18 18
15 15
17
16
15
18 18 18
16
0
2
4
6
8
10
12
14
16
1989
/90
1991
/92
1993
/94
1995
/96
1997
/98
1999
/00
2001
/02
2003
/04
Perc
ent
13
14
15
16
17
18
19
Perc
ent
Number of Rates Standard Rate (%)

Readings on Inequality in Kenya: Sectoral Dynamics and Perspectives78
One way of assessing the regressivity of VAT is by analyzing the level of taxburden borne by individuals in different expenditure or income quintiles. If theproportion of VAT payable to total expenditure increases with income/expenditure,then the tax is progressive, and vice versa. For this particular analysis, the WelfareMonitoring Survey (1997) was used, whereby the VAT implication on thehousehold’s consumption basket was assessed. Households were grouped accordingto welfare level (using expenditure quintiles).
To compute the VAT tax burden, the VAT schedule of exempt, zero-rated andtaxable goods and services was analyzed. According to the VAT schedule, thefollowing commodities are exempt: grains and flours; roots and tubers; pulses, nutsand seeds; fruits; vegetables; meat, poultry, fish and livestock products; bread;newspapers; gas, kerosene, other petroleum products, charcoal; financial services,etc.14 Exempt supplies are divided into: financial services, insurance, publiceducation and training services, health (including veterinary) services, sanitaryservices, agricultural services, social welfare services, etc. Several goods are alsozero-rated, which include: coffee, tea and cocoa; books and stationery; medicines,etc.
As earlier mentioned, it is assumed that indirect taxes on goods are shiftedentirely to consumers if markets are competitive and taxes apply to final sales. VATin this case is fully borne by the consumer, and the producer/sales agent only collectsthe taxes on behalf of the government, but does not bear part of the burden.
Taxes can be computed by multiplying the base (which is the consumption of aparticular good or service) by the statutory rate. This gives the statutory incidence.For ad valorem rates, the tax paid is given as:
jij
jjijijji e
t
txptT ,,,, 1+
==
Where Ti,j
is household i’s total loss in purchasing power for a tax on good j;p
i,jx
i,j is household i’s pre-tax amount of expenditure on good j; t
j is the tax rate; and
ei,j
is the post-tax amount of expenditure on good j. The tax burden is then computedas VAT payable (T
i,j) as a proportion of the base (total expenditure in this case).
To analyze the effect of zero-rating and exemption of basic commodities on thedistribution of VAT tax burden, the tax burden per expenditure quintile wascomputed, assuming a flat VAT rate of 17 percent on all commodities (except the10% for hotels and restaurants).15
14 These commodities only include those specified in the consumption basket under the WelfareMonitoring Survey as purchased consumption, and not own consumption.
15 This VAT rate represents the VAT rates in 1997, given that the data used refers to 1997.
79
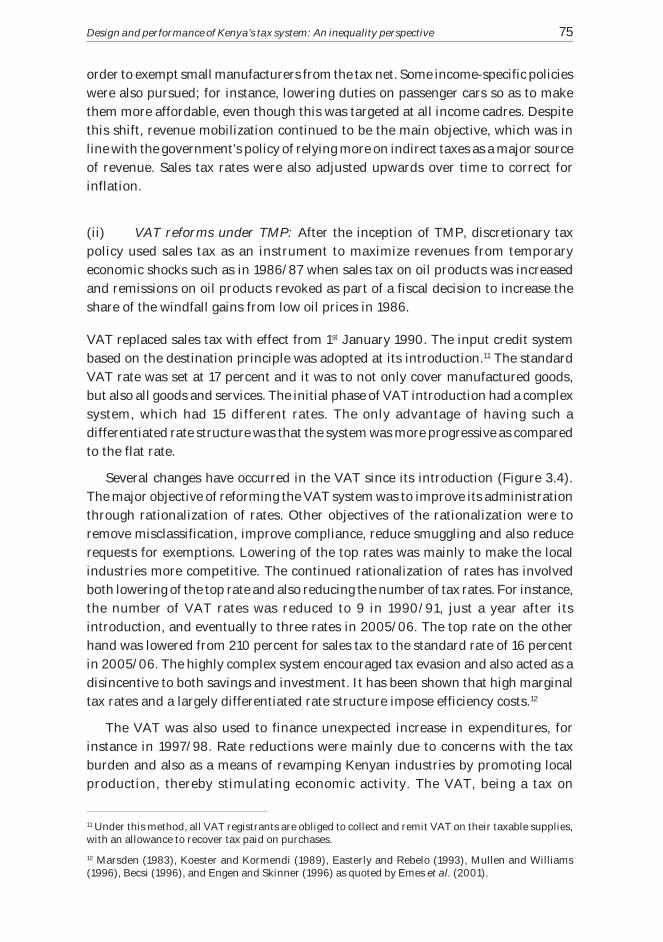
The results (Figure 3.5) show that VAT in Kenya before the exemptions andzero-rating was highly regressive. The first quintile bears the highest VAT burdenof about 17 percent, with the second and third quintile bearing 16 percent, fourthquintile 15.9 percent and fifth quintile 15.8 percent. These results confirm the notionthat poorer households spend a greater proportion of their income on basiccommodities (mainly foodstuffs), which implies a greater tax burden.
Analyzing the proportions of the consumption basket that are exempt, zero-rated and VATable assesses the progressivity of the VAT structure. The results areshown in Figure 3.6. The analysis of VAT tax burden based on expenditure quintilesshows that overall, the VAT structure is progressive as a result of exemptions andzero rating of basic commodities. In the expenditure of the first quintile, 82.8 percentof the value is VAT exempt and another 2.9 percent is zero-rated. Only 14.3 percentof the value of consumption is VATable.
The share of VAT exempt consumption declines slightly to 81.4 percent for thesecond quintile, 70.8 percent for the third quintile, 68.7 percent for the fourthquintile and 52.3 percent for the fifth quintile. Conversely, the VATable shareincreases by expenditure quintile, from 14.3 percent for the first quintile, 15.9percent for the second quintile, 26.6 percent for the third quintile, 28.6 percent forthe fourth quintile and 44.2 percent for the fifth quintile. This reveals a progressivestructure.
Analysis of the VAT burden also reveals a progressive structure, which provesthat a highly regressive VAT structure can be made less regressive by use ofexemptions and zero-rating of basic commodities (Figure 3.7). The first quintilebears a VAT burden of 2.4 percent (as compared to 17% before exemptions and
Design and performance of Kenya’s tax system: An inequality perspective
Source: Own computation from Welfare Monitoring Survey 1997
Figure 3.5: VAT burden 1997 (without exemptions and zero-rating)
1 5 .2
1 5 .4
1 5 .6
1 5 .8
1 6.0
1 6.2
1 6.4
1 6.6
1 6.8
1 7 .0
1 7 .2
1 st Quint 2nd Quint 3rd Quint 4th Quint 5 th Quint
Per
cen
t

Readings on Inequality in Kenya: Sectoral Dynamics and Perspectives80
zero-rating), the second quintile bears 2.7 percent (as compared to 16%), the third4.5 percent, the fourth 4.8 percent and the fifth 7.3 percent. Given that the burdenincreases progressively with expenditure level, the VAT can be said to be progressive.These results are not surprising given that the use of exemptions in the structurecan make a consumption tax more progressive. The move from import taxes toconsumption taxes motivated by globalization and trade liberalization has madetax incidence a little more progressive given the evidence that VAT is less regressivethan trade and excise taxes, and can be as progressive as income tax (Gemmell andMorrissey, 2003 and Whalley 1991 as quoted by Bird and Zolt, 2005).
Source: Own computation from Welfare Monitoring Survey 1997
Figure 3.6: Progressivity of the VAT structure
Source: Own computation from Welfare Monitoring Survey 1997
Figure 3.7: VAT burden 1997 (with exemptions and zero-rating)
81
Other measures of VAT progressivity
Local Index of Progressivity: The Relative Share Adjustment (RSA) developed byBaum (1987), as quoted by Kesselman and Cheung (2004), is a measure of thelocal distributional impact of a given tax compared with a proportional tax. As earlierindicated in section 2:
RSAi = (1-ATR
i)/(1-ATR)
Where ATRi is the average tax rate paid by the ith income group, and ATR is the
total tax collected as a proportion of aggregate income/expenditure. RSAi > 1
indicates that the group pays a locally progressive tax, and RSAi < 1 implies a locally
regressive tax. The RSA index can be used to calculate the gain or loss to a specificincome group of switching to a fully proportional tax. For example, an RSA
i = 1.05
implies that the ith taxpayer would suffer an income loss of about 5 percent if theexisting tax system was to be replaced by a proportional tax.
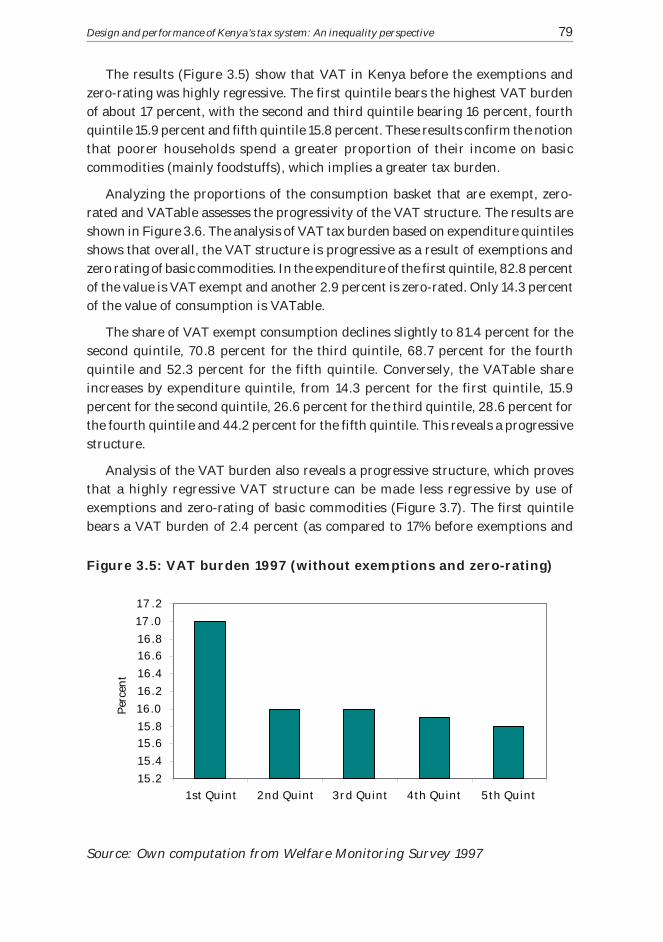
The RSA for VAT was derived using the information on tax burden per quintileand total expenditure as analyzed above. The RSA was then plotted against thetotal level of expenditure per quintile (Figure 3.8). Each point on the curve can beinterpreted independently.
From the analysis, it shows that VAT in the first to fourth quintiles is locallyregressive (their RSA
i < 1), while VAT in the fifth quintile is locally progressive
(RSAi > 1). Therefore, households in the fifth quintile would benefit more if the
system is converted to a fully proportional tax system, but the first to fourth quintileswould lose. The current tax structure is, therefore, locally regressive at lower quintilelevels and locally progressive at higher levels. These findings are similar to thefindings by Jimenez (1986).
Design and performance of Kenya’s tax system: An inequality perspective
Source: Own computation from Welfare Monitoring Survey 1997
Figure 3.8: Local index of progressivity
0 .3 00 . 3 6
0 .7 50 .8 1
1 . 3 7
0.00
0.2 0
0.4 0
0.6 0
0.80
1 .00
1 .2 0
1 .4 0
1 .6 0
2 3 ,6 83 ,6 00 4 1 ,1 4 8,3 55 7 6 ,6 50,3 55 1 07 ,2 9 0,7 1 1 2 2 3 ,7 7 1 ,2 3 5
Ex penditure
RS
A

Readings on Inequality in Kenya: Sectoral Dynamics and Perspectives82
Tax concentration curves
The tax concentration curve, developed by Kakwani (1977) as quoted by Kesselmanand Cheung (2004) is one of the measures of global progressivity, which is thecumulative proportion of taxes versus the position in the pre-tax income/expenditure distribution. According to Musgrave and Thin (1948) as quoted byKesselman and Cheung (2004), effective progression is a measure of the extent towhich a given tax structure results in a shift in the distribution of income towardsequality. This implies that changes in income affects the level of progressivity of atax, and the more unequal pre-tax income distribution is, the greater is the globalindex of progressivity, and consequently greater equalizing effects.
The tax concentration curve is plotted on the same axis as the Lorenz curve. TheLorenz curve coincides with the tax concentration curve for pre-tax incomes/expenditures if the tax system is proportional, outside the Lorenz curve ifprogressive, and conversely for a regressive tax. This index is twice the difference inarea between the Lorenz curve and the tax concentration curve, which is positive ifprogressive, zero if proportional, and negative if regressive.
Musgrave and Thin (1948), as quoted by Kesselman and Cheung (2004), usedthe Gini coefficient of the pre- and post-tax distribution, which mainly focuses onthe redistributive effect rather than departure from proportionality. Reynolds and
Figure 3.9: Tax concentration curves
83
Smolensky (1977), as quoted by Kesselman and Cheung (2004), also used a Gini-related coefficient, which is computed as the difference between the pre- and post-tax income/expenditure distribution. The Reynolds and Smolensky (1977)progressivity index gives the vertical inequality. Horizontal inequality is measuredas a weighted sum of the post-tax income/expenditure Gini coefficients ofhouseholds with given pre-tax incomes.
Following this approach, the concentration and Lorenz curves were derived usingDAD software (A Software for Distributive Analysis/Analyze Distributive).
The tax concentration curve was then plotted on the same axis as the Lorenzcurve, and also pre-and post-tax expenditure concentration and Lorenz curves. Thetax concentration curve lies outside the Lorenz curve, which implies that VAT isprogressive. The Lorenz curve (Gini) coefficient is 0.34227717, and the concentrationcurve coefficient is 0.36868043. The global progressivity index is twice the differencein the area between the Lorenz curve and the tax concentration curve, which is0.05. Since this index is greater than zero, then VAT is globally progressive.
Jimenez (1986), as quoted by Gemmell and Morrissey (2003), found that theAverage Rate of Progression for Kenya was U-shaped (regressive then progressive),but the major limitation of this approach was that the progression was measuredwith respect to income levels rather than expenditures. Bird and Miller (1997)showed that money-metric expenditure measures of tax burden were preferable toincome measures because of three main reasons. Firstly, primary data onexpenditure is more reliable than data on incomes, which is the case for Kenya.Secondly, money expenditures are more objectively observed and moreunderstandable as opposed to consumption levels and income measures. Thirdly,expenditures are a better basis of comparison with respect to the poor given thatthe poor mostly smooth consumption, implying that expenditure is a better measureof their well-being, rather than income.
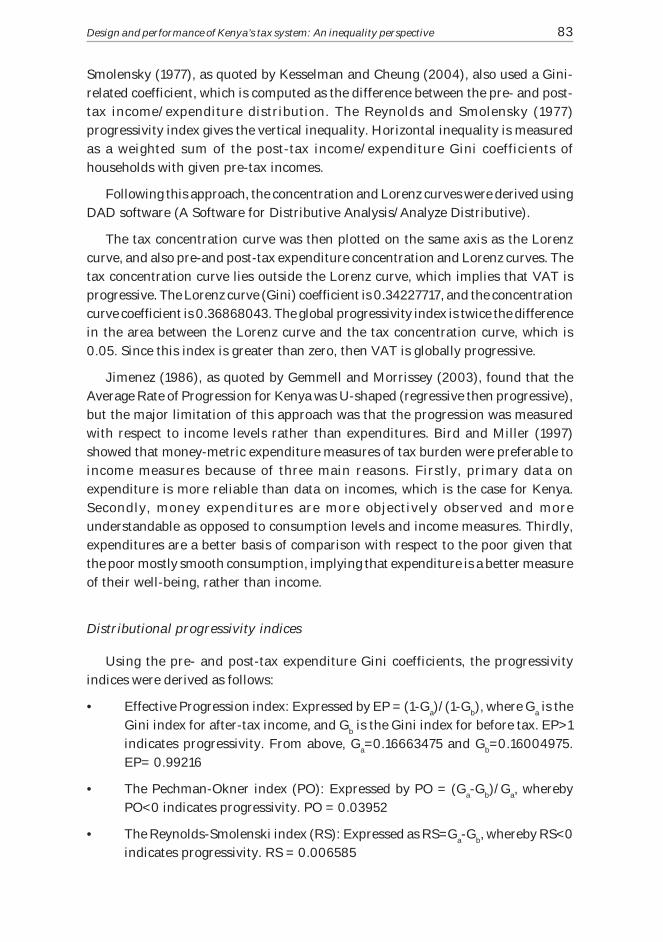
Distributional progressivity indices
Using the pre- and post-tax expenditure Gini coefficients, the progressivityindices were derived as follows:
• Effective Progression index: Expressed by EP = (1-Ga)/(1-G
b), where G
a is the
Gini index for after-tax income, and Gb is the Gini index for before tax. EP>1
indicates progressivity. From above, Ga=0.16663475 and G
b=0.16004975.
EP= 0.99216
• The Pechman-Okner index (PO): Expressed by PO = (Ga-G
b)/G
a, whereby
PO<0 indicates progressivity. PO = 0.03952
• The Reynolds-Smolenski index (RS): Expressed as RS=Ga-G
b, whereby RS<0
indicates progressivity. RS = 0.006585
Design and performance of Kenya’s tax system: An inequality perspective

Readings on Inequality in Kenya: Sectoral Dynamics and Perspectives84
Given the limitation of the above indices as discussed in section 2, the same indiceswere derived using the Atkinson index. The indices are as follows:
• Effective Progression index: Expressed by EP = (1-Ga)/(1-G
b), where G
a is the
Gini index for after-tax income, and Gb is the Gini index for before tax. EP>1
indicates progressivity. From above, Ga=0.21076132 and G
b=0.21930207. EP=
1.01093989.
• The Pechman-Okner index (PO): Expressed by PO=(Ga-G
b)/G
a, whereby
PO<0 indicates progressivity. PO= -0.0405233.
• The Reynolds-Smolenski index (RS): Expressed as RS=Ga-G
b, whereby RS<0
indicates progressivity. RS= -0.00854075.
The results using the Gini coefficient show that VAT is regressive, while the useof the Atkinson index reveals a progressive VAT structure. Given that the latter isan improvement over the previous, it can be concluded that using the progressivityindices, the VAT structure is progressive.
Therefore, from the analysis of the progressivity of the VAT, it has been shownthat the VAT in Kenya is progressive and, therefore, can be used as a means ofachieving redistribution objectives.16
Excise taxes
Structure of excise tax
An excise tax is a levy applied selectively on particular goods and services. The taxmay be applied to either production or sale, to domestic output or imported, witheither ad valorem or specific rates. Kenya’s excisable commodities at the momentare on alcoholic beverages, tobacco, fuel, motor vehicles and other smaller excisablecommodities such as mineral water, matches, etc. Other than motor vehicles, excisetaxes on beer, cigarettes and petroleum are currently charged on a specific basis.
Excise taxes are levied for a variety of reasons. Firstly, excise taxes have theability to raise substantial revenue for the government at relatively loweradministrative and compliance costs. Most excisable commodities are taxed at highrates and are in most cases produced by few large producers. Such goods tend tohave low own price elasticity of demand, which implies that price changes haveminimal effects on consumer demand. Excise taxes are also levied to correct forexternalities; for example, those arising from excessive smoking and drinking. Theycan also be used to achieve vertical equity through taxation of luxuriouscommodities.
16 The major caveat is that different methodologies are bound to produce different conclusions.
85
Reforms of excise taxes
(i) Piecemeal reforms: Initial reforms under excise taxation were mainly carriedout to achieve three objectives. The first and overriding objective of reforming theexcise tax regime was to raise more revenue. This was implemented through regularincreases in the excise tax rates on excisable commodities. Secondly, reforms werealso carried out to ensure more simplified and progressive tax rates, which weremainly achieved through the rate structure that was adopted at that time. This ratestructure had rates that increased with quality of the products, for instance cigaretteand beer brands. Lastly, excise tax rates were also increased over time to discourageconsumption of some commodities, for example beer and cigarettes.
(ii) Excise tax reforms under TMP: Excise taxes in Kenya have been mainlylevied for revenue purposes, not for internalization of externalities or direction ofindustries towards identified strategic directions. Before the advent of the TMP, aspecific excise tax regime was maintained. This required frequent increases in thetax rate to keep them in line with the level of inflation, which was a challenge giventhat inflation levels were moderate during those periods. There was a regime switchto ad valorem regime in 1991/92 mainly to ensure that revenues were kept in linewith inflation, and also for administrative ease. Rationalization of excise tax rateshas also been carried out to reduce mis-classification and smuggling of commodities.
The excise tax regime reverted back to specific in 2003/04 with a strategicobjective of helping the manufacturing industry to be more export-oriented througha taxation regime that was supportive of investments in high quality excisablecommodities. It also had the objective of reducing tax evasion and avoidance, andsimplifying and improving effective tax rate and subsequent revenue yield. Thereis empirical evidence that specific excise tax regimes are more favourable toinvestments in high quality products compared to outcomes of an ad valoremregime in low-inflation countries. Lastly, reforms in excise tax rates have also beendriven by the need to harmonize tax regimes in the regional trading blocs. Forinstance, the reduction of the ad valorem rates for malt beers from 95 to 90 percentin 1999/2000 was mainly driven by the need to harmonize the rates in the EastAfrican Community.
Excise taxes have also been used to improve vertical equity since they are mostlylevied on goods that are considered luxurious and are consumed by high-incomeearning individuals. The idea of using the excise tax rate to achieve vertical equitywas pursued as early as 1969/70 when excise tax rates were differentiated accordingto the quality of products, whereby lower quality products attracted cheaper rates.This move was to not only have an easier administered excise tax system thatdepended on prices, but was also a more progressive tax system. In general,progressivity has not been a central theme of excise taxation in Kenya.
An incidence analysis for excise taxes was not carried out because of datalimitations. Consumption of excisable commodities was not well captured in the
Design and performance of Kenya’s tax system: An inequality perspective
Readings on Inequality in Kenya: Sectoral Dynamics and Perspectives86
Welfare Monitoring Survey. For example, beer was reported as one type ofcommodity and yet different types of beer attract different rates, as is the case alsofor cigarettes. Therefore, this is left as an area of further research.
Customs duties
Structure
Customs duty is currently charged on the Cost, Insurance and Freight (CIF) valueof imported goods. The current structure of the tariff bands under the East AfricanCommunity Common External Tariff is in three bands of 0 percent for raw materials,10 percent for intermediate goods and 25 percent for finished products. However,some ‘sensitive’ goods attract a higher rate, such as sugar, maize and wheat, whichattract a high duty of almost 100 percent.
Reforms: Import substitution vs export-promotion trade policy
(i) Piecemeal reforms: The type of trade policy regime that was being pursuedimmediately after independence guided the changes in customs duties. With aninward-looking trade policy regime, trade taxes were mainly used as an instrumentof protecting the local industry by mainly discouraging competition from imports.Among the industries under protection were the printing, textiles and foodprocessing. As part of the import substitution strategy, duties on raw materialswere increased over time as a means of restructuring the economy towards use ofdomestic resources. For instance, a 10 percent duty was imposed on a wide rangeof items, such as raw materials and capital equipment in 1975/76, which werepreviously duty free. An ad valorem duty on clothing was increased from 45 to 50percent in a bid to protect textile industries, which were quite labour-intensive.
With the import-substitution trade policy still in place, the balance of paymentscrisis in the 1970s necessitated the emergence of focus on an export-ledindustrialization strategy in order to earn foreign exchange. As a result, a subsidypayment of 10 percent on exports of manufactured goods was introduced in 1974/75. Duties on manufactured goods were further increased over time, while dutieson raw materials lowered to encourage local production for export. More effortswere made in 1983/84 to make industries more competitive mainly through lowerprices resulting from lower duties on raw materials.
(ii) Reforms under TMP: Unlike many developing countries, Kenya has notrelied much on import duties for revenue mobilization since the onset ofliberalization in mid-1980s. The reforms under customs duties have mainly beendriven by the trade policy Kenya has been pursuing since 1984/85, with majorchanges in the number of tariffs and rates from the time the country started
87
implementing structural adjustment policies to date. The major objectiveunderpinning the reform process has been a move towards more openness, eventhough there have been episodes of protectionism for specific sectors or sub-sectorsof the economy. Some of the objectives highlighted include:
• To restructure the economy away from the highly protected and inefficientpattern of industrialization that was based on import substitution towardsproduction for exports. There were clear efforts towards putting in place asystem of restructuring incentives and reducing the cost of production in1984/85. For instance, agricultural inputs were zero-rated and tariffs on rawmaterials, intermediate inputs to industry and capital goods started to bereduced.
• To reduce prevailing economic distortions and also encourage localproduction through reduction of tariff rates in favour of intermediate andcapital goods. The economy had suffered significantly from an inefficientsystem of production arising from a protectionist trade policy.
• To simplify and rationalize the tariff structure since it was realized that thetariff structure was too complex. The goal of tariff simplification andrationalization was reaching a four-rate system (including duty free) thatsimplified import duty administration.
• To address the question of export competitiveness by lowering the cost ofproduction through reduction of average tariffs and also narrowing theirdispersion. Duties on imported raw materials, intermediate goods and spareparts were reduced with the objective of lowering the cost of manufacturingand hence raising the competitiveness of local goods in the export market.The import liberalization policy, which was part of the structural adjustmentprogramme, encouraged trade liberalization thereby ensuring exportcompetitiveness.
• To protect the local industry. The trade liberalization policy that had beenaggressively pursued since the mid-1980s started facing serious credibilityquestions from some of the sectors in the economy. Arguments were madethat there had been blind liberalization, which hurt the domestic producersof some of the import competing goods. Thus, in 1999/2000, a clear policyshift towards protection of some sectors outside the agricultural sector startedcreeping back.
The customs regime that Kenya has pursued since independence did not havean explicit objective of achieving equity. However, the impact of customs duties onequity depends on who the final consumers of imported products are. If commoditiesconsumed by low-income individuals attract lower duties, then such a duty would
Design and performance of Kenya’s tax system: An inequality perspective
Readings on Inequality in Kenya: Sectoral Dynamics and Perspectives88
be considered equitable. These linkages (between imports and final consumption)could not be pursued in this study because of data limitations.
Other taxes
There exists various other taxes that would have an impact on an equitabledistribution of income. First, is the Hut tax, which was levied at independence andwas paid by men depending on the number of homesteads (wives) one had. Themore the homesteads, the more wealthy one was considered to be, and consequentlythe more the tax liability. Sometimes one could pay the tax in kind, for example interms of commodities or animals.
Another form of tax was the Graduated Personal Tax (GPT), which was paid byadult men (over 18 years) irrespective of employment status. The amount was fixedat Ksh 20 per head. This tax was unfair since it was not based on the ability to payprinciple. It was abolished in the 1970s.
An estate duty or death duty was levied in Kenya from the 8th of June 1918 butwas suspended in 1959 in a bid to attract investment from the United Kingdom,given that estates were tax exempt in UK at that time. The duty was re-introducedin 1963 after a law was passed in UK making the estates taxable. The tax initiallyhad a progressive structure, with ad valorem rates ranging from 2 percent on estatesworth K£ 5,000 - K£ 7,000, up to 40 percent for estates worth over K£ 2 million.Estates with a value less than K£ 5,000 were exempted, which was lowered to K£1,000 in 1967/68 and increased to K£ 2,500 in 1972/73 with an aim of exemptingsmall farmers. This duty was abolished in 1982 mainly because of administrativecomplexities.
A capital gains tax on sale of property and shares by individuals was introducedin Kenya in 1975/76. A 15 percent duty was charged on the value of real propertyand shares charged on all transfer instruments submitted to the collector of stampduties for stamping. The 15 percent duty was also charged on the value of all realproperty and shares of deceased persons before assessment of estate duty. The rateof tax charged when the sale proceeds were not re-invested was 35 percent of theactual capital gain realized over the adjusted cost of the shares. All real propertytransactions under Ksh 10,000, one-owner occupied house for each family and thefirst sale of land after registration were exempted. The rationale behind introductionof this tax was to ensure an equitable distribution of income. In 1981/82, the capitalgains tax rates were lowered and made more progressive from 10 to 35 percent butthis presented a more complex rate structure. Following complaints that this taxinhibited capital and share mobility (inhibited trading in real estates) andconsequently economic growth, the capital gains tax was suspended in 1985/86.However, the tax was re-introduced in the 2006/07 budget proposals but coveringonly properties but not the stock market. Property owners are charged a 10 percenttax on the gain arising from the sale of property and buyers are charged 3 percent

89
of property value. This move impacts on the allocation of resources, mainly fromthe taxable properties to the non-taxable properties. For instance, it is likely thatthe stock market would attract more investment than the real estate. This is notequitable since it treats income from different sources differently (an aspect ofhorizontal equity).
Key administrative reforms
There were a few administrative reforms carried out under the TMP, such asintroduction of the Personal Identification Number (PIN). However, major reformswere undertaken from the fiscal year 1995/96. One of the key administrative reformswas the establishment of the Kenya Revenue Authority by an Act of Parliament inJuly 1995, which was meant to consolidate revenue collection, to improve theresource base, and improve the organizational flexibility for tax administration andthe conditions of employment for revenue officers. Other objectives were to improveadministrative efficiency through computerization, improved audit capacity andreduced revenue leakage and implementation of organizational reforms that couldsupport modern tax administration. Domestic taxes (income, VAT and excise) wereconsolidated into one department–the Domestic Taxes Department–which wouldmake it easier to administer the taxes, for example by carrying out joint taxpayeraudits.
Several measures were also carried out to streamline the operations of theCustoms and Excise Department (later renamed Customs Services Department),for example simplification of import procedures, direct payment of duties into thebanks, etc. The Customs Services Department implemented the Simba 2005 systemto streamline operations in the Department. Audit management has also beengreatly enhanced. The Investigation Branch and Revenue Protection Services weremerged to form the Investigation and Enforcement Department, and the IntelligenceUnit was set up. There are ongoing administrative reform measures under theDomestic Taxes Reform and Modernization Project; Road Transport Reform andModernization Project; Investigation and Enforcement Reform and Modernization;KRA Automation Project; Infrastructure Development Project, and Training andChange Management Project.
These administrative measures impact on equity in two major ways. Firstly,removal of discretion in implementation of tax policy ensures a more equitable taxsystem. For instance, when the Minister of Finance or Tax Commissioners had thediscretion to give tax exemptions to specific individuals, this created an unfair systemthat could have been easily abused. Therefore, removal of such discretions promotedequity. Secondly, the tax administration measures have been used to increasecompliance. This enhances equity in the sense that the tax burden is more widelydistributed as compared to a tax system with a very low compliance level. Therefore,an economy with a big shadow economy might rely more on wage taxes, and
Design and performance of Kenya’s tax system: An inequality perspective

Readings on Inequality in Kenya: Sectoral Dynamics and Perspectives90
therefore place a greater burden on wage earners as compared to businessmengetting higher sales margins but operating in the informal sector. Thus, one way ofensuring a more equitable tax policy is by increasing tax compliance.
Conclusion and Recommendations
This Chapter has looked at taxation and inequality in Kenya. Taxation is one of theways through which redistribution of income can be achieved. However, theeffectiveness of using taxation as a redistributive tool varies across countries anddepends on the design of the tax system. Several issues in terms of inequality emergefrom this analysis:
• Income taxes can play a major role in redistributing income and thereforepromote equality. The widening of tax brackets, reduction of top marginalrates and increasing the levels of personal relief over time have played a bigrole in making the income tax more progressive and therefore more equitable.However, there is a trade-off between nominal progressivity, which is achievedthrough high and progressive rates and growth. However, lower and flatterbrackets and rates have still achieved nominal progressivity for the Kenyancase. Therefore, despite the fact that proposals aimed at addressing the equityand pro-poor question need to be considered in the context of the entire taxsystem, reducing the number of individuals subject to income taxationthrough high income tax threshold should continue to merit seriousconsideration. However, exemption of low-income individuals from the taxnet limits the effectiveness of income tax as a redistribution tool given thatincome tax payers (mainly wage-earners) are a small proportion of thepopulation.
• Value Added Tax, on the other hand, is considered highly regressive, but theuse of exemptions and zero-rating of specific commodities has made thesystem more progressive and thus more equitable. Thus, zero rating andcharging lower rates on certain basic foodstuffs and other commodities mainlyconsumed by lower income categories is one of the ways through whichincome redistribution can be achieved through Value Added Tax (VAT).However, even though increasing VAT threshold levels is meant to achieveadministrative ease, this exempts small businessmen from qualifying for VATrefunds. This undermines the progressivity of the system.
• Excise taxes have continued to be levied at high rates on excisablecommodities that are considered luxuries, with revenue generation as themain objective. However, equity objectives have been pursued through adifferentiated tax structure. The 2006/07 budget provides major highlightsfor making the excise tax system more equitable, mainly throughharmonization of taxation of alcoholic drinks (for example taxation of spirits

91
and beer). However, these taxes have not played a significant redistributiverole.
• The major administrative reforms that have been pursued over time havesignificantly played a redistributive role in mainly two areas: streamliningthe use of exemptions and increasing compliance, thus ensuring a broaderdistribution of tax burden.
Apart from the main taxes, other fees and licences in Kenya have also been usedto exacerbate or reduce inequality. For instance, most fees under road transporthave been levied on road users, mainly vehicle owners, which promoted equity (butonly if these fees are not transferred to commuters). However, the recent lumpingof the road licence fees onto petroleum prices exacerbates inequality because otherroad users are subsidizing vehicle owners, which is highly regressive. Such leviesshould be entirely levied onto vehicle owners to promote fair distribution of income.
It is noteworthy that the evolution of tax policy (partly necessitated by changingfiscal architecture including globalization) has resulted into a tax structure thatplaces very little emphasis on trade taxes, and aims to shift reliance towards indirecttaxes. This has led to some form of fiscal squeeze. There is a clear policy directionof increasing reliance towards indirect taxes (mainly consumption taxes) with VATbeing seen as a tax for the future. This has implications on using taxation as aredistribution tool because consumption taxes are considered highly regressive.The Kenyan experience, however, indicates that use of exemptions and zero-ratingcan be effectively used to achieve progressivity in consumption taxes. The challengeremains maximizing revenues from the already ‘suffocated’ tax base, which bringsin the issue of compliance. Research has shown that compliance levels for mosttaxes are very low. Therefore, more revenue could still be collected with theprogressive VAT structure if compliance levels could be increased.
Taxation of wealth and property income in Kenya remains a challenge. Ifcaptured, taxation of wealth and property income is one of the ways through whichincome redistribution could be achieved. The current proposal of taxing rentalincome at 30 percent (same as corporate income) is equitable, but only if the cost isnot shifted to tenants through increased rent. Also, the policy on taxation of capitalgains can promote equity but only if implemented across all types of gains. Thecurrent structure promotes shifting of investments from the taxable gains to thenon-taxable segments. Therefore, implementing the tax policy on taxation of wealth,capital gains and other forms of income could greatly reduce inequality.
The shadow or black economy has important implications for tax policy and thedistribution of tax burdens. If the shadow economy is large, then a well-designedgeneral consumption tax might be more progressive than a personal income taxthat burdens only a few wage earners. Furthermore, the proportion of wage incomeis much lower given the fact that formal employment is not growing as fast as theinformal sector. Increasing the role of consumption taxes may make the tax system
Design and performance of Kenya’s tax system: An inequality perspective

Readings on Inequality in Kenya: Sectoral Dynamics and Perspectives92
less allocative, distorting and reducing the pressure of enterprises shifting to theinformal sector. For instance, registered VATable businesses will be entitled to aVAT refund unlike their unregistered counterparts, even though the net tax(between input and output tax) determines the net benefit of being informal. Thus,for the country to pursue a tax policy that is supportive of inequality reduction,there is need to reduce the size of the growing informal sector, which can be donethrough encouraging formal registration of these enterprises.
In conclusion, it is clear that the government acknowledges that taxation can beused as an effective tool of reducing poverty and inequality as evidenced by the keythemes of the 2006/07 budget speech. Considerable efforts have been made inmaking income tax and VAT more equitable, but more needs to be done with regardto taxation of wealth and property income, and also other licences and fees. Moreemphasis should be put on the design and implementation of consumption taxessince they have limited but very important redistributive effects. After a lot ofattempt to use income tax progressivity to achieve redistributive goals, it has beensuggested that developing countries concerned with equity should pursue a non-distorting tax policy and collect as much revenue as possible and then reduceinequality through expenditure policy. It has been shown that a flatter income taxrate with appropriate consumption taxes and an improved expenditure policy wouldprovide a better redistributive policy framework than a one-fits-all highlyprogressive personal income tax. However, more rigorous analysis such ascomputable general equilibrium modelling is needed to advise on the appropriatemix of tax instruments for an effective redistributive taxation role.
References
Besci, Zsolt (1996) ‘Do state and local taxes affect relative state growth?’ Economic Review81, 2: 18-36. Federal Reserve Bank of Atlanta.
Bird, R.M and E.M Zolt (2005) ‘The limited role of the personal income tax in developingcountries’, Journal of Asian Economics 16: 928-946.
Bourguignon and Da Silva (2003) ‘Evaluating poverty and distributional impact of economicpolicies: A compendium of existing techniques’, in The impact of economic policieson poverty and income distribution, evaluation techniques and tools, BourguignonF. and Da Silva, L.A.P. (eds), Washington DC: World Bank.
Cnossen, S (2003) ‘The incidence of consumption taxes in member countries of the SouthAfrican Development Community’. A paper prepared for the Southern AfricanConference on Excise Taxation, Gauteng, South Africa.
Emes. J. and J. Clemens, P. Basham and D. Samida (2001) “Critical Issues Bulletin onFlat Tax Principles and Issues”, The Fraser Institute.
Engen, Eric and Jonathan Skinner (1996) ‘Taxation and economic growth’, WorkingPaper 5826. Cambridge: National Bureau of Economic Research.
Gemmell, N. and O. Morrissey (2003) ‘Tax structure and the incidence on the poor indeveloping Countries’. University of Nottingham, CREDIT Research Paper, No. 03/18.
93Design and performance of Kenya’s tax system: An inequality perspective
Government of Kenya (1986) ‘Sessional Paper No. 1 of 1986 on Economic Management forRenewed Growth’, Nairobi: Government Printer.
Hardiman. N. (2004) ‘Paying for government’, Institute for the Study of Social Change,Discussion Paper Series, WP 2004/11.
Jimenez, E. (1986) ‘The public subsidization of education and health in developing countries:A review of equity and efficiency’, World Bank Research Observer 1, 111-130.
Karingi S., and B. Wanjala (2005) The tax reform experience in Kenya, Research Paper No.2005/67, UNU-WIDER.
Karingi, S.N., B. Wanjala, A. Kamau, A. Mwangi, E. Nyakang’o and M. Muhoro (2004) Fiscalarchitecture and revenue capacity in Kenya, KIPPRA Discussion Paper No. 45,Nairobi: Kenya Institute for Public Policy Research and Analysis.
Kesselman, J.R. and Cheung, R. (2004) ‘Tax incidence, progressivity and inequality inCanada’, Centre for Public Policy Research, Simon Fraser University.
Koester, Reinhard and Roger Kormendi (1989) ‘Taxation, aggregate activity and economicgrowth: Cross-country evidence on some supply-side hypotheses’, EconomicInquiry 27: 367-86.
Martinez-Vazquez, J. (2001), ‘The impact of budgets on the poor: Tax and benefit incidence’,Georgia State University, Andrew Young School of Policy Studies, InternationalStudies Program, Working Paper 01-10.
Moyes, P. and A. F. Shorrocks (1998) ‘The impossibility of a progressive tax structure’,Journal of Public Economics, 69, 49-65.
Mullen, John and Martin Williams (1994) ‘Marginal tax rates and state economic growth’,Regional Science and Urban Economics 24, 6: 687-705.
Palme, M. (1996) ‘Income distribution effects of the Swedish 1991 tax reform: An analysis ofa microsimulation using Generalized Kakwani Decomposition’, Journal of PolicyModelling 18(4): 419-443.
Society for International Development–SID (2004), ‘Pulling Apart: Facts and Figures onInequality in Kenya’. Nairobi: Society for International Development.
Thirsk, W. (1997) Lessons from tax reform: An Overview, World Bank Working PaperNo. 576. Washington DC: World Bank.
Vandemoortele, J. (2004) The MDGs and pro-poor policies: Can external partners make adifference’. New York: United Nations Development Programme.
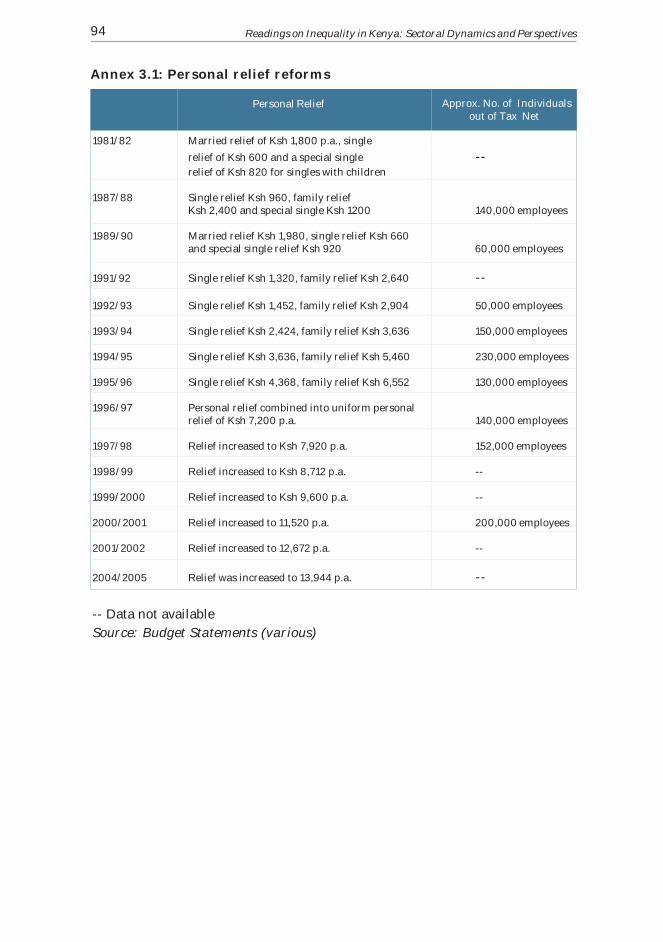
Readings on Inequality in Kenya: Sectoral Dynamics and Perspectives94
1981/82 Married relief of Ksh 1,800 p.a., single
relief of Ksh 600 and a special single --relief of Ksh 820 for singles with children
1987/88 Single relief Ksh 960, family reliefKsh 2,400 and special single Ksh 1200 140,000 employees
1989/90 Married relief Ksh 1,980, single relief Ksh 660and special single relief Ksh 920 60,000 employees
1991/92 Single relief Ksh 1,320, family relief Ksh 2,640 --
1992/93 Single relief Ksh 1,452, family relief Ksh 2,904 50,000 employees
1993/94 Single relief Ksh 2,424, family relief Ksh 3,636 150,000 employees
1994/95 Single relief Ksh 3,636, family relief Ksh 5,460 230,000 employees
1995/96 Single relief Ksh 4,368, family relief Ksh 6,552 130,000 employees
1996/97 Personal relief combined into uniform personalrelief of Ksh 7,200 p.a. 140,000 employees
1997/98 Relief increased to Ksh 7,920 p.a. 152,000 employees
1998/99 Relief increased to Ksh 8,712 p.a. --
1999/2000 Relief increased to Ksh 9,600 p.a. --
2000/2001 Relief increased to 11,520 p.a. 200,000 employees
2001/2002 Relief increased to 12,672 p.a. --
2004/2005 Relief was increased to 13,944 p.a. --
-- Data not availableSource: Budget Statements (various)
Personal Relief Approx. No. of Individualsout of Tax Net
Annex 3.1: Personal relief reforms

95Design and performance of Kenya’s tax system: An inequality perspective
Year Annual taxableincome (Ksh)
Rate(%)
Year Annual taxableincome (Ksh)
Rate(%)
Annex 3.2: Personal income tax brackets, 1986-2006
1986 - 1987 1 - 36,000 10.0 1988 - 1989 1 - 39,600 10.036,001 - 72,000 15.0 39,601 - 79,200 15.072,001 - 180,000 25.0 79,201 - 118,800 25.0108,001 - 144,000 35.0 118,801 - 158,400 35.0144,001 - 180,000 45.0 158,401 - 198,000 45.0180,001 - 216,000 50.0 Over 198,000 65.0216,001 - 252,000 60.0
Over 252,000 65.0 1990 - 1991 1 - 42,000 10.0 1992 1 - 46,000 10.0
42,001 - 84,000 15.0 46,001 - 92,000 15.084,001 - 126,000 25.0 92,001 - 138,000 25.0126,001 - 168,000 35.0 138,001 - 184,000 35.0
Over 168,000 45.0 Over 184,000 45.01993 1 - 52,800 10.0 1994 1 - 60,000 10.0
52,801 - 105,600 15.0 60,001 - 120,000 15.0105,601 - 158,400 20.0 120,001 - 180,000 20.0158,401 - 211,200 25.0 180,001 - 240,000 25.0211,201 - 264,000 35.0 240,001 - 300,000 35.0
Over 264,000 40.0 Over 300,000 40.01995 1 - 78,000 10.0 1996 1 - 78,000 10.0
78,001 - 156,000 15.0 78,001 - 156,000 15.0156,001 - 234,000 20.0 156,001 - 234,000 20.0234,001 - 312,000 25.0 234,001 - 312,000 25.0312,001 - 390,000 35.0 Over 312,000 35.0
Over 390,000 37.5 1997 1 - 82,080 10.0 1998 1 - 90,240 10.0
82,081 - 164,160 15.0 90,241 - 180,480 15.0164,161 - 246,240 20.0 180,481 - 270,720 20.0246,241 - 328,320 25.0 270,721 - 360,960 25.0328,321 - 410,400 30.0 360,961 - 451,200 30.0
Over 410,400 35.0 Over 451,200 32.51999 1 - 94,800 10.0 2000 1 - 104,400 10.0
94,801 - 189,600 15.0 104,401 - 208,800 15.0189,601 - 284,400 20.0 208,801 - 313,200 20.0284,401 - 379,200 25.0 313,201 - 417,600 25.0379,201 - 474,000 30.0 Over 417,600 30.0
Over 474,000 32.5 2001 1 - 109,440 10.0 2002-2003 1 - 116,160 10.0
109,441 - 218,880 15.0 116,161 - 225,600 15.0218,881 - 328,320 20.0 225,601 - 335,040 20.0328,321 - 437,760 25.0 335,041 - 444,480 25.0
Over 437,760 30.0 Over 444,480 30.02004-2006 1-121,960 10.0
121,961-236,880 15.0236,881-351,790 20.0351,791-466,700 25.0
Over 466,700 30.0
Source: Budget Statements and Finance Bills (various)

Readings on Inequality in Kenya: Sectoral Dynamics and Perspectives96