5796 corporate avenue cypress, california 90630 … corporate avenue cypress, california 90630 ......
TRANSCRIPT
Submitted to:
State of California Environmental Protection Agency Department of Toxic Substances Control
5796 Corporate Avenue Cypress, California 90630
Interim Removal Measure Air Monitoring Plan
Ascon Landfill Site
Huntington Beach, California Prepared for:
Ascon Site Responsible Parties Prepared by:
One Pointe Drive, Suite 320 Brea, California 92821
(714) 388-1800
and
2100 Main Street, Suite 150
Huntington Beach, CA 92648 Telephone: (714) 969-0800
Fax (714) 969-0820 www.Geosyntec.com
Project Number: SB0320
May 2010
TABLE OF CONTENTS
Page
1. INTRODUCTION ................................................................................................ 1
1.1 General......................................................................................................... 1 1.2 Site Description ........................................................................................... 1 1.3 Adjacent Land Uses ..................................................................................... 1 1.4 Interim Removal Measure Overview .......................................................... 2
2. TECHNICAL APPROACH ................................................................................. 3 2.1 Objectives .................................................................................................... 5 2.2 Target Chemical Selection .......................................................................... 6 2.3 Comparison Criteria and Action Levels ...................................................... 7 2.4 Work Area Monitoring ................................................................................ 7 2.5 Monitoring for Perimeter Impacts ............................................................... 8
3. MONITORING PROGRAM DESCRIPTION ..................................................... 9 3.1 Real-Time Monitoring ................................................................................. 9 3.2 Time-Integrated Sampling ........................................................................... 9 3.3 Measurement Locations ............................................................................. 10 3.4 Wind Monitoring ....................................................................................... 11 3.5 Laboratory Testing .................................................................................... 11 3.6 Sampling Methodologies ........................................................................... 12 3.6.1 Real-Time Monitoring .................................................................. 12 3.6.2 Odor .............................................................................................. 13 3.6.3 Time-Integrated Sampling ............................................................ 14
4. QUALITY ASSURANCE .................................................................................. 16 4.1 General....................................................................................................... 16 4.2 Field ........................................................................................................... 16 4.3 Laboratory ................................................................................................. 16 4.4 Data QA/QC .............................................................................................. 16 4.4.1 Precision ....................................................................................... 17 4.4.2 Accuracy ....................................................................................... 17 4.4.3 Representativeness ........................................................................ 18 4.4.4 Completeness ................................................................................ 18 4.4.5 Comparability ............................................................................... 18
5. REPORTING ...................................................................................................... 20
TABLE OF CONTENTS (Continued)
LIST OF TABLES
Table 1: Target Chemicals and Air Monitoring Methods
Table 2: Comparison Criteria for Target Chemicals
Table 3a: Direct-Reading Instrument Action Levels and Required Actions - PID Readings for Total VOCs
Table 3b: Direct-Reading Instrument Action Levels and Required Actions – Particulate Matter (Aerosol Monitor)
Table 3c: Other Action Levels and Required Actions
Table 4: Air Monitoring Program Activities – Odors and Emissions Testing
Table 5: Odor Classification
LIST OF FIGURES
Figure 1-1: Site Location Map and Surrounding Land Use
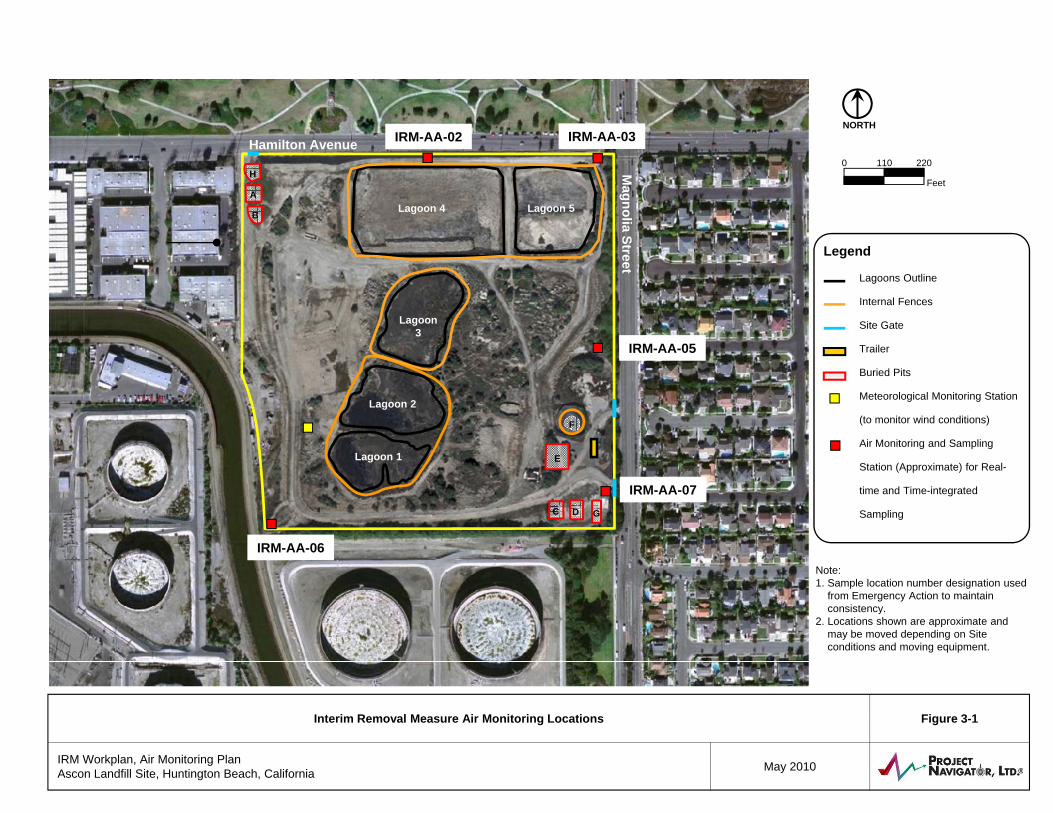
Figure 3-1: Interim Removal Measure Air Monitoring Locations
LIST OF ATTACHMENTS
Attachment A: Previous Ambient Air Monitoring Data
LIST OF ACRONYMS
SCAQMD South Coast Air Quality Management District ATSDR Agency for Toxic Substances and Disease Registry BHRA Baseline Health Risk Assessment COPC compounds of potential concern or chemicals of potential concern DQO data quality objective FS feasibility study GC/MS gas chromatograph and mass spectrometer LCS Laboratory Sample Control m3 cubic meters MDL method detection limit mg milligram mg/m3 milligrams per cubic meter MRL minimal risk level MS/MSD Matrix Spike/Matrix Spike Duplicate OEHHA Office of Environmental Health Hazard Assessment, which is part of the
California Environmental Protection Agency (Cal-EPA) PAH polycyclic aromatic hydrocarbon PC percent complete PID photoionization detector PM10 particulate matter ppbv parts per billion (by volume) ppmv parts per million (by volume) QA quality assurance QC quality control REL reference exposure levels SVOC semivolatile organic compound μg/m3 microgram per cubic meter USEPA United States Environmental Protection Agency VOCs volatile organic compounds
IRM Workplan 1 Air Monitoring Plan, May 2010
1. INTRODUCTION
1.1 General
This air monitoring plan (AMP) contains the scope of work for the air monitoring that will be conducted during the Interim Removal Measure (IRM) planned for the Ascon Landfill Site (the Site) located in Huntington Beach, California. This air monitoring plan was prepared by Geosyntec Consultants, Inc. (Geosyntec) under the direction of Project Navigator, Ltd. on behalf of the Ascon Site Responsible Parties (RPs). This monitoring plan has been prepared for submittal to the Department of Toxic Substances Control (DTSC).
1.2 Site Description
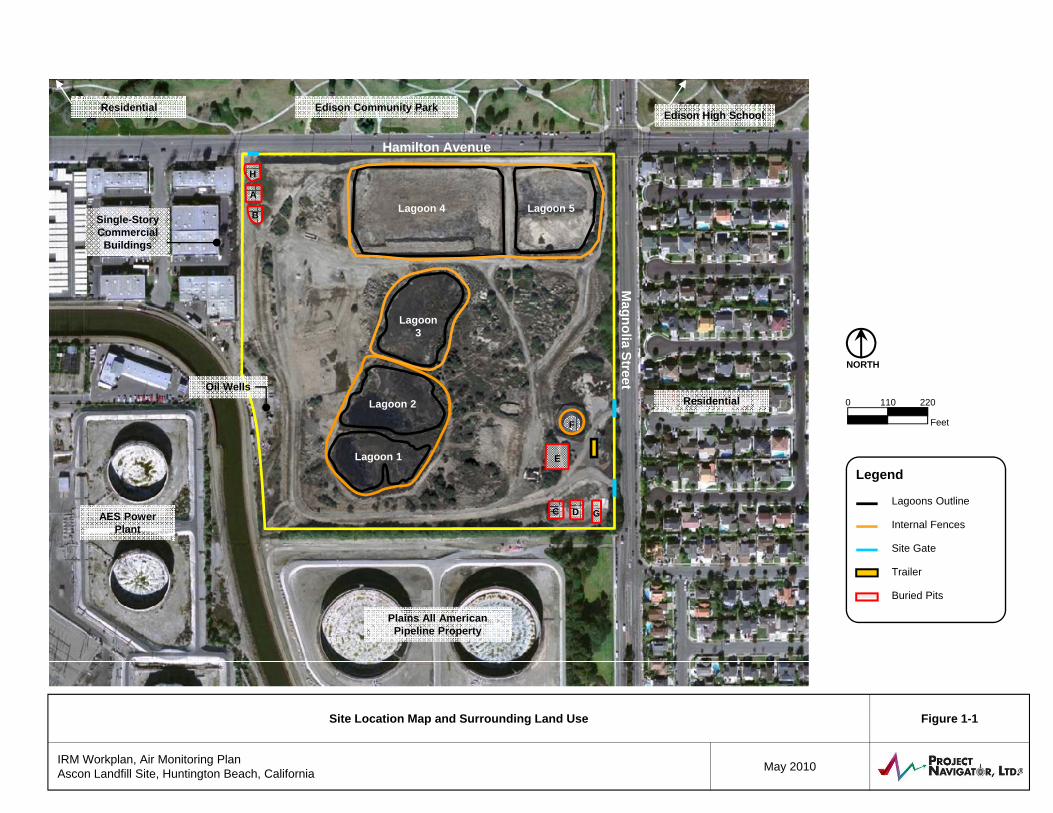
The Ascon Landfill Site encompasses approximately 38 acres located at 21641 Magnolia Street in Huntington Beach, California (Figure 1-1). The Site is at the southwestern corner of the intersection of Hamilton Avenue and Magnolia Street, approximately ½ mile north of the Huntington Beach State Park and the Pacific Ocean. The Site is enclosed by a perimeter chain link fence with three locked gates.
In the past, the Ascon Landfill Site was used as an industrial and oilfield waste disposal facility. The Site is no longer in operation. Site features currently consist of five visible impoundments (referred to as Lagoons 1 through 5), one covered pit (referred to as Pit F), and seven buried pits (Pits A through E, G and H) that are no longer visible.
1.3 Adjacent Land Uses
The Ascon Landfill is located in an area of residential, recreational, commercial, and industrial land use (Figure 1-1). The immediately adjacent land uses identified on Figure 1-1 are:
• North: Edison Community Center; • Northeast: Edison High School; • East: single family homes; • South: fuel oil storage tanks, green belt; • Southwest: Huntington Beach Flood Control Channel, fuel oil tanks, light
industry, AES Huntington Beach Power Generation Station; • West: light industry and the Huntington Beach Channel; and • Northwest: single family homes.
IRM Workplan 2 Air Monitoring Plan, May 2010
1.4 Interim Removal Measure Overview
The IRM will generally consist of excavation, recycling and/or disposal of lagoon tarry materials, and earth moving activities. The following elements will be conducted:
• Site preparation • Clearing and grubbing • Concrete and debris potential processing • Excavation and grading • Removal and recycling of recyclable material • Lagoon tarry waste removal and disposal.
IRM Workplan 3 Air Monitoring Plan, May 2010
2. TECHNICAL APPROACH
Several types of ambient air monitoring will be performed as a part of the IRM, including air monitoring conducted as a part of the Health and Safety program, to satisfy the anticipated South Coast Air Quality Management District (SCAQMD) permit conditions, and to address potential offsite impacts. The focus of this air monitoring plan is on the ambient air monitoring that will be conducted for potential offsite impacts and for the potential SCAQMD permit conditions. Air monitoring conducted for worker Health and Safety is addressed in a separate Health and Safety Plan (HASP).
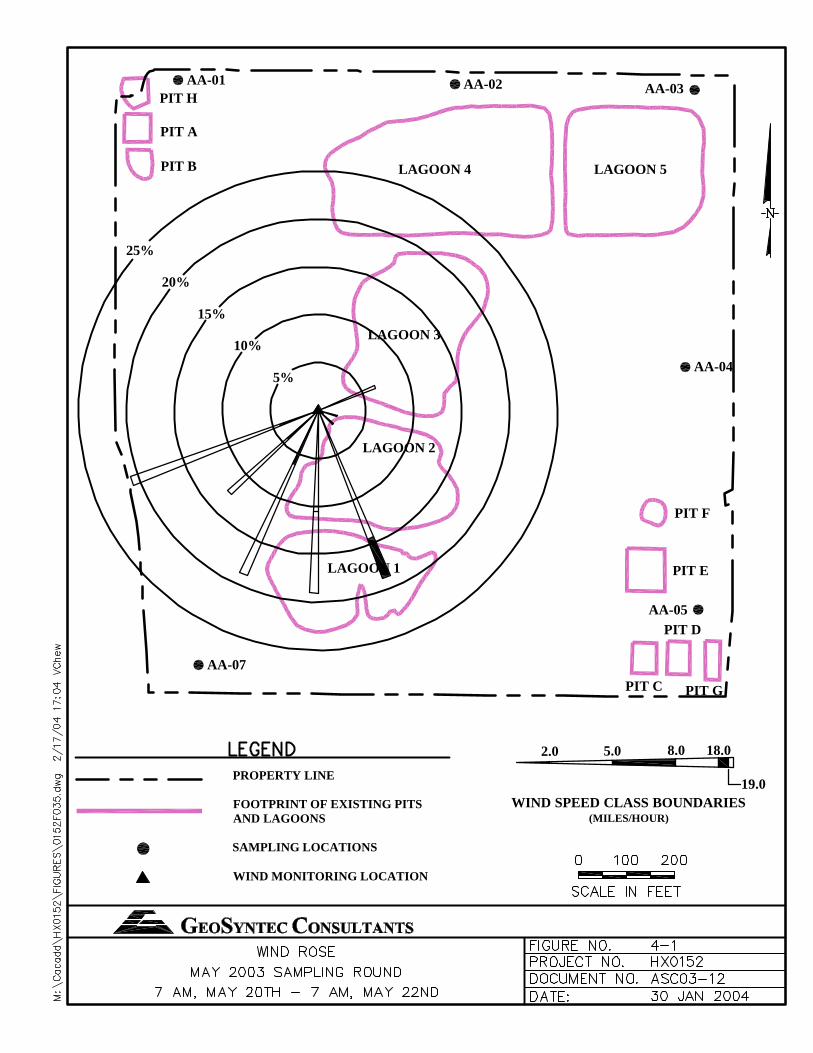
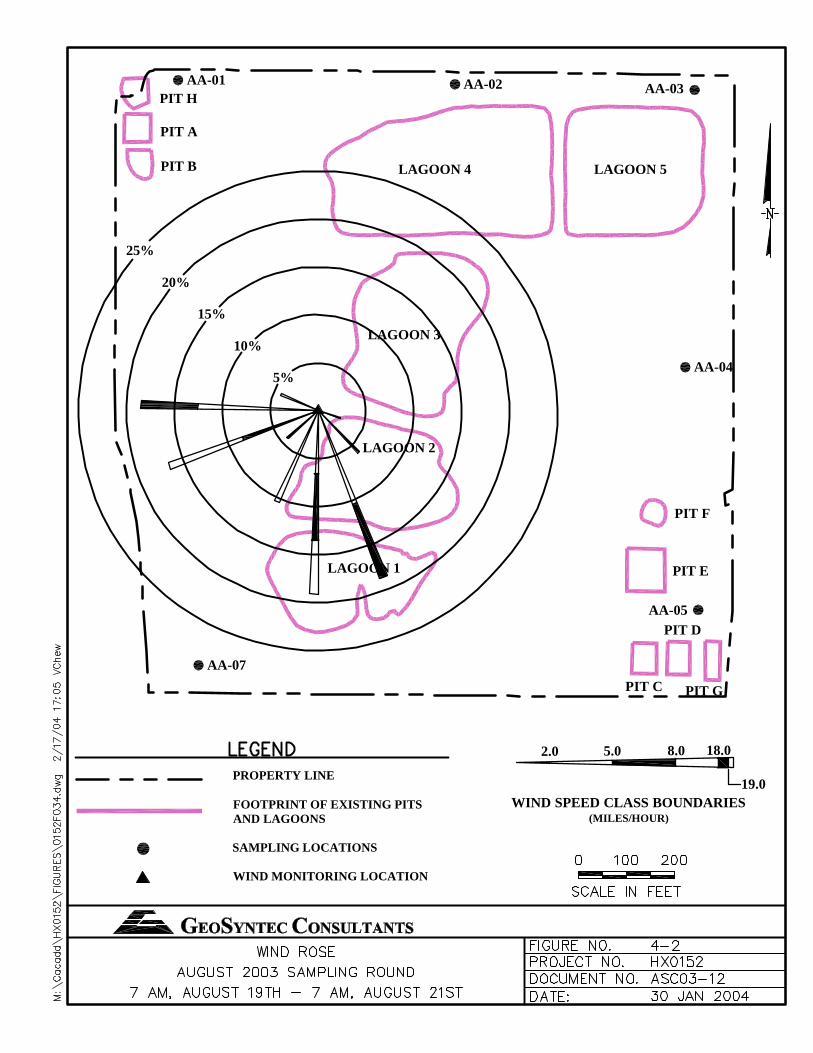
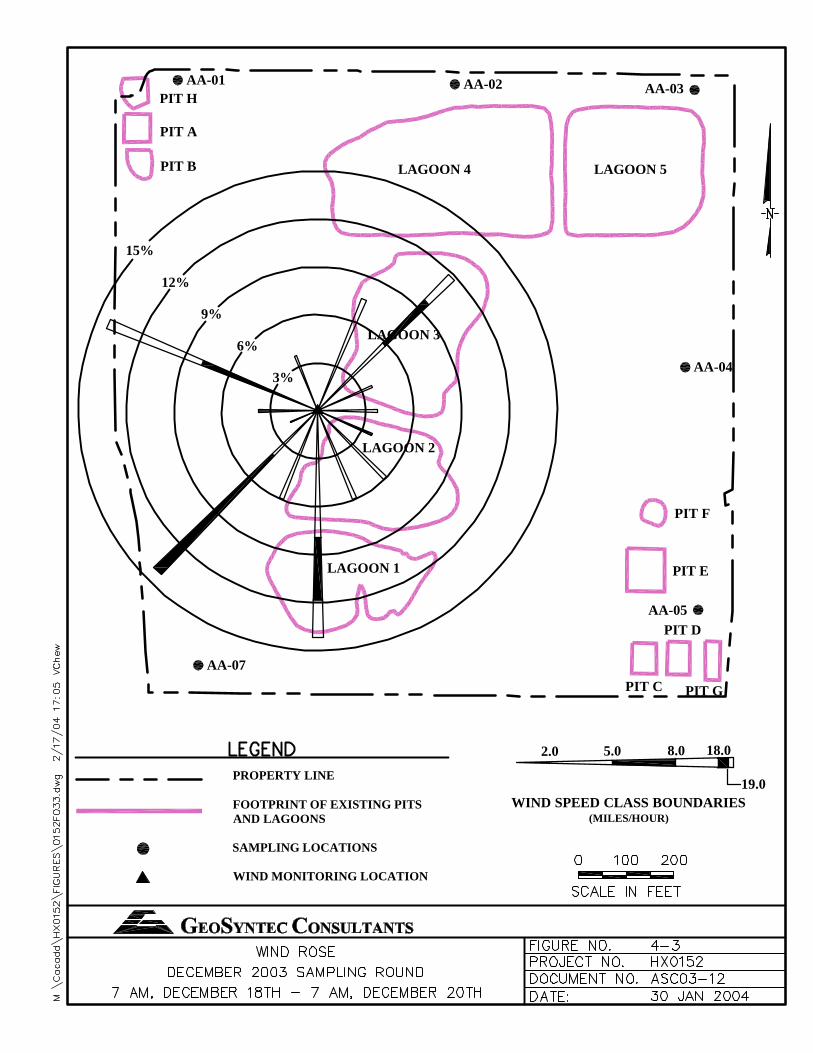
The air monitoring plan was developed in part based on information gathered during the Emergency Action conducted in 2005 through early 2006. Measured wind directions at the Site during the Emergency Action were found to be generally consistent with those recorded during previous perimeter air monitoring events (Geosyntec, 2002, 2003a, b, 2004). The southwestern corner monitoring location, EA-AA-06, (the same location as station AA-07 during previous work, including Pilot Study No. 3), is generally upwind of the Site and is considered a consistent background sampling location.
Air monitoring for the Emergency Action consisted of the collection of real-time perimeter air quality measurements and time-integrated perimeter air samples for laboratory testing at seven locations along the Site perimeter. Real-time perimeter air monitoring was conducted at each location using a “walk-around procedure” approximately every hour throughout each workday. Monitoring included measurements for volatile organic compounds (VOCs) using a photoionization detector (PID), particulate matter (i.e., dust) using a Dust Track monitor, and odors using worker perception (recorded according to the SCAQMD odor classification scale). Action levels, or thresholds, for real-time air measurements were established, above which the use of mitigative measures, such as the application of vapor suppressants or dust controls or to modification of work practices, were implemented, as needed. In addition, time-integrated samples were collected and sent to an offsite laboratory for VOCs, particulates as PM10, polynuclear aromatic hydrocarbons (PAHs) and metals analysis. Particulates, PAH and metals samples were collected from perimeter locations during the first week of excavation of Lagoons 4 and 5. The results of these samples indicated that significant emissions of these constituents were not occurring; therefore additional sampling was not required. Due to the potential for ongoing volatile emissions, VOC samples were collected for the duration of the project.
IRM Workplan 4 Air Monitoring Plan, May 2010
The results of the Emergency Action perimeter air monitoring indicated that the emissions of VOCs, PAHs, particulates and metals were controlled during excavation and waste handing activities. On only three occasions in the course of the Emergency Action, perimeter air measurements exceeded the action level of 5 ppm VOCs above background by the PID, resulting in temporary work stoppage and mitigation. Also, work was stopped during three other occasions due to PID measurements exceeding the work face action level of 1,000 ppm VOCs within three inches from the excavated material. Vapor suppressants such as foam, water, and misters were consistently used to mitigate odors during the excavation activities. Measured concentrations of individual VOCs, PAHs, and metals were similar to background or were below health-based comparison criteria, with the exception of five detections of naphthalene that exceeded only chronic comparison criteria. Daily exposure for an entire year at concentrations above the chronic comparison criteria would be needed before health effects might be observed. Findings from the Emergency Action are further documented in the Emergency Action Completion Report and Emergency Action Completion Report Addendum. (PNL, 2006a, 2006b)
It is anticipated that potential VOC air emissions from the IRM will be similar to the Emergency Action given that VOC content of Lagoons 1 and 2 is similar to materials that were handled during the Emergency Action (i.e., total VOC readings from field instruments registered similar VOC concentrations when monitoring Lagoon 4 materials and Lagoons 1 and 2 materials during 2004 field work). Chemicals detected in Lagoons 1, 2, and 3 are similar to the chemicals detected in the materials excavated from Lagoons 4 and 5 during the Emergency Action. Additionally, the average concentrations of chemicals detected in Lagoons 1, 2, and 3 are generally within a factor of 2 to 5 to the chemical concentration observed in Lagoons 4 and 5. Potential offsite impacts may be reduced, for the IRM, because the location of planned IRM work is interior to the Site as opposed to near the Site boundary as during the Emergency Action. The type, location, and frequency of air sampling presented in this plan have been developed based on this anticipated reduction in potential fence-line VOC detections. The focus of the chemical-specific monitoring will be on VOCs but at a reduced frequency based on the findings of the Emergency Action. In addition, particulate bound chemicals such as heavier organics (e.g., PAHs) and metals will be speciated, but at a reduced frequency.
Air monitoring will be conducted at the working areas and at designated upwind and downwind locations near the Site perimeter. Wind direction and velocity will be recorded throughout the duration of the field program with an onsite meteorological station. The air monitoring program will include monitoring and testing for:
IRM Workplan 5 Air Monitoring Plan, May 2010
• Wind speed and direction monitoring; • Continuous monitoring for particulates using a dust monitor; • Continuous monitoring for total volatile organic hydrocarbons (VOCs) using
photoionization detectors (PIDs); • Periodic ambient air sampling for VOCs using Summa canisters; • Periodic ambient air sampling for PAHs and select metals on particulates
using high volume air samplers; and • Odors using worker perception.
Four rounds of perimeter ambient air monitoring data for VOCs were collected at the Site over a year and a half period (2002 to 2004) during times of Site inactivity (i.e., no field activities, such as open excavations)(Geosyntec, 2002, 2003a, b, 2004). This monitoring has indicated that, in its present state, the Site does not significantly impact the air quality in the vicinity of the Site. The concentrations detected at the Site are generally within background concentrations observed in urban southern California. In addition, ambient air monitoring was conducted during Pilot Study No. 3 conducted in 2004 (PNL, 2007) and the Emergency Action conducted in 2005–2006 at the Site (PNL, 2006a, b), both of which included intrusive activities with open excavations. These existing perimeter air monitoring data are used along with the comparison criteria identified in subsequent sections to evaluate and address potential impacts that the field activities may have on ambient air quality.
2.1 Objectives
The ambient air monitoring program objectives are:
• Monitor potential onsite impacts to ambient air from excavation of tarry materials from Lagoons 1 and 2 and from grading at the Site;
• Determine if mitigation measures are necessary to meet SCAQMD permit conditions during the field work; and
• Monitor potential offsite impacts during the field activities and provide additional mitigation measures, as needed.
The air monitoring objectives work to verify that the field activities are conducted in a manner that is protective of the health of onsite workers and the public. To accomplish these objectives, it will be necessary to collect both real-time data using direct reading instruments and time-integrated ambient air samples. Real-time data will be collected at the excavation activities and at Site perimeter locations, whereas time-integrated
IRM Workplan 6 Air Monitoring Plan, May 2010
ambient air samples will be collected at the Site perimeter. Air measurements and sampling will need to be conducted at multiple locations on the Site and over the duration of the active field program. Because measured concentrations will be compared to comparison criteria and action levels to determine if and what specific mitigation measures are necessary, the selected sampling and analysis methods must be capable of detecting concentration levels at or below the established comparison criteria or action level values.
2.2 Target Chemical Selection
Chemicals of Potential Concern (COPCs) have been identified during previous studies conducted at the Site, including previous air monitoring. Chemical data from samples collected from soil and waste materials were used to conduct a baseline human health risk assessment (BHRA) [ESE, 1997b]. The results of the risk assessment indicated that the lagoon COPCs based on the inhalation pathway were primarily the VOCs: 1,2-dichloroethane, benzene, 1,1,1-trichloroethane, methylene chloride, 2,4,6-trichlorophenol, and 2,4-dichlorophenol. Therefore, the focus of the air monitoring program is on the more volatile compounds that have been detected at the Site. For VOCs, both total VOC measurements via direct reading instruments and speciated samples for individual VOCs will be collected.
For nonvolatile chemicals such as the semivolatile organic compounds (SVOCs) and metals, the primary mechanism of exposure via the air pathway is through inhalation of these chemicals adsorbed to particulates (dust particles). Therefore, the monitoring program focuses on real-time dust monitoring to address these classes of chemicals for the field activities identified in the Workplan and summarized in Section 3 of this plan. As was discussed above, chemical speciation of chemicals that may be adhered to dust (PAHs and metals) conducted during the Emergency Action indicated that the emissions of these chemicals were low. Therefore, because metals and PAH concentrations from Lagoons 1 and 2 compare similarly to those of Lagoons 4 and 5 (PNL 2007), the frequency of particulate collection and chemical speciation will be reduced when compared to the sampling frequency during excavation within Lagoons 4 and 5 during the Emergency Action.
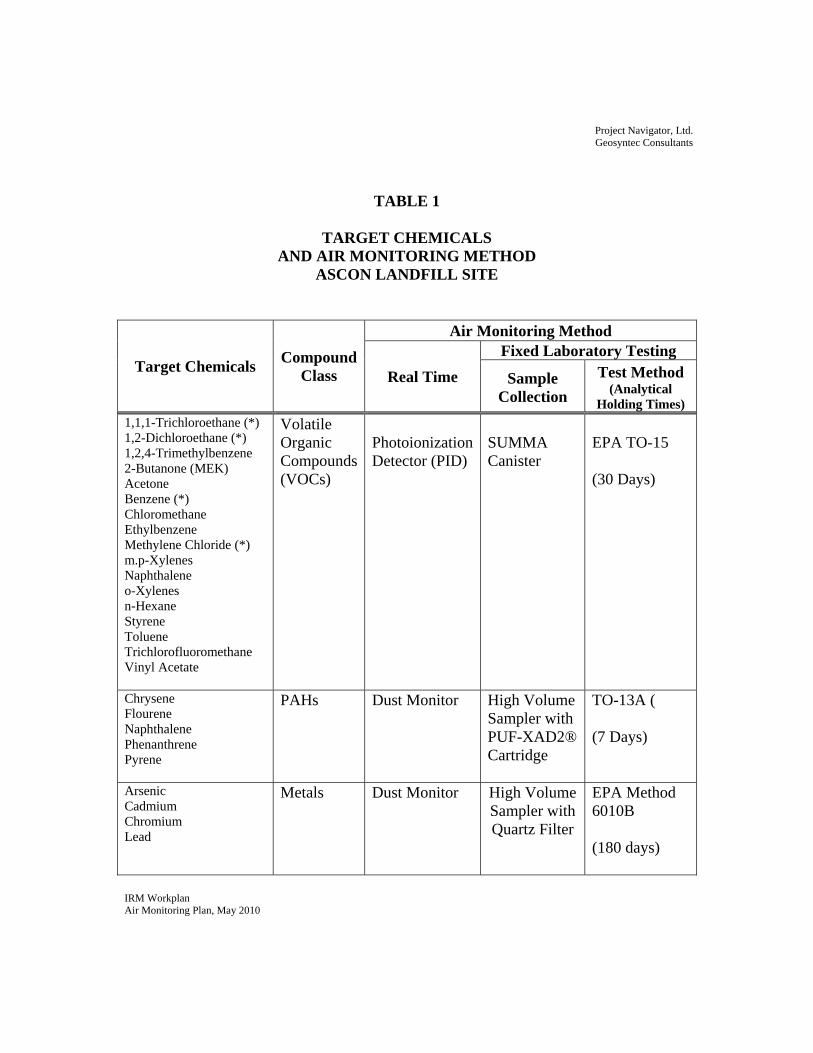
A summary of the air monitoring approaches that will be used for the different classes of chemicals is presented in Table 1. For VOCs, Table 1 presents the VOCs that were previously identified as COPCs in the risk assessment for the Site as well as the VOCs that were detected more frequently (>25%) during the Emergency Action. The standard TO-15 target analyte list will be used for the analysis during the IRM.
IRM Workplan 7 Air Monitoring Plan, May 2010
2.3 Comparison Criteria and Action Levels
Table 2 presents a summary of comparison criteria that will be used during this program to evaluate the ambient air TO-15 VOC and PAH and metals results. Table 2 presents values for the State of California Office of Environmental Health Hazard Assessment (OEHHA) reference exposure levels (RELs) and minimal risk levels (MRLs) from the Agency for Toxic Substances and Disease Registry (ATSDR) for chemicals that were detected at least once during the ambient air monitoring programs, including the Emergency Action. The table presents comparison criteria based on acute, intermediate and chronic exposure conditions. When acute or intermediate values were not available, chronic values are presented as conservative comparison criteria. The RELs and MRLs are concentrations that are likely to be without appreciable risk of adverse noncancer health effects over a specified duration of exposure and are set below levels that, based on current information, might cause adverse health effects in the people most sensitive to such substance-induced effects (ATSDR, 2005). As a result, exposure to a level above the MRL or REL does not necessarily mean that adverse health effects will occur. MRLs are derived for acute (1 to 14 days), intermediate (>14 to 364 days), and chronic (365 days and longer). RELs are derived for acute (1 to 8 hours) and chronic (365 days and longer). Acute criteria and, in particular, the ATSDR intermediate MRLs are the most appropriate values for comparisons given the anticipated duration of the planned IRM excavation activities of approximately 8 months.
For this project, action levels have been identified based on the SCAQMD Rule 1150/1166 rules, the permit requirements from the Emergency Action, and potential offsite impacts. These action levels are identified in Tables 3a – 3c. If significant concentrations of total VOCs are measured on the direct reading instruments at the property perimeter, the Summa canister sample results will be expedited to allow for review of the individual VOC concentrations. However, high readings are not expected at this time due to the type of planned field activities, and therefore the Summa data are expected to be used for documentation and reporting only.
2.4 Work Area Monitoring
Real-time air monitoring will be conducted at several areas within the work area. These areas include:
• Excavator and/or loader and/or bulldozer bucket • Downwind of the work area at perimeter; and
IRM Workplan 8 Air Monitoring Plan, May 2010
• An upwind location.
The purpose of the work area monitoring is to measure emissions from the potential source areas and to determine if mitigation measures are needed. Monitoring will be conducted for total non-methane VOCs using a PID within 3 inches of the excavator or loader buckets, according to the anticipated SCAQMD Rule 1150/1166 permit, and downwind of the work area. In addition, dust will be monitored downwind of the work area. If action levels are exceeded in these areas, response actions will be undertaken such as stopping work and/or applying suppressants to reduce potential VOC and dust emissions to acceptable levels.
2.5 Monitoring for Perimeter Impacts
Real-time and time-integrated monitoring is planned at five locations, including four downwind locations at the project perimeter between proposed working areas and sensitive offsite locations, and one upwind location.
The purpose of the perimeter monitoring is to verify that elevated concentrations of VOCs and dust are not leaving the Site, as well as to mitigate unacceptable odors. The perimeter monitoring program includes odor monitoring, monitoring for total VOCs using a PID, monitoring for dust using a mini-ram dust monitor, or equivalent, and periodic ambient air monitoring for VOCs using Summa canisters and PAHs and select metals using particulate samplers. If action levels based on real-time monitoring are exceeded at the perimeter, response actions will be undertaken such as stopping work, mitigating VOCs and dust in the work area, and expediting the VOC analysis using Summa canisters. It is anticipated that the expedited sample results will be available within four days of collection including laboratory analysis and data validation. The work processes will be re-evaluated, and work will not re-commence until levels are below the action levels specified in Tables 3a, 3b, and 3c.
IRM Workplan 9 Air Monitoring Plan, May 2010
3. MONITORING PROGRAM DESCRIPTION
The monitoring program will include two different types of ambient air quality measurements: (1) real time monitoring using direct reading instruments and (2) periodic time-integrated sampling using fixed laboratory measurements for VOCs, particulate PAHs, and select metals. The real time monitoring will include monitoring for comparison to action levels as defined in the anticipated SCAQMD permit and the Health and Safety Plan (Appendix B of the IRM Workplan). The time-integrated sampling will be used primarily for assessment of potential offsite impacts, including comparison to the criteria identified in Table 2. Real time air monitoring using direct reading instruments will be conducted during the field program whenever materials are being exposed or disturbed.
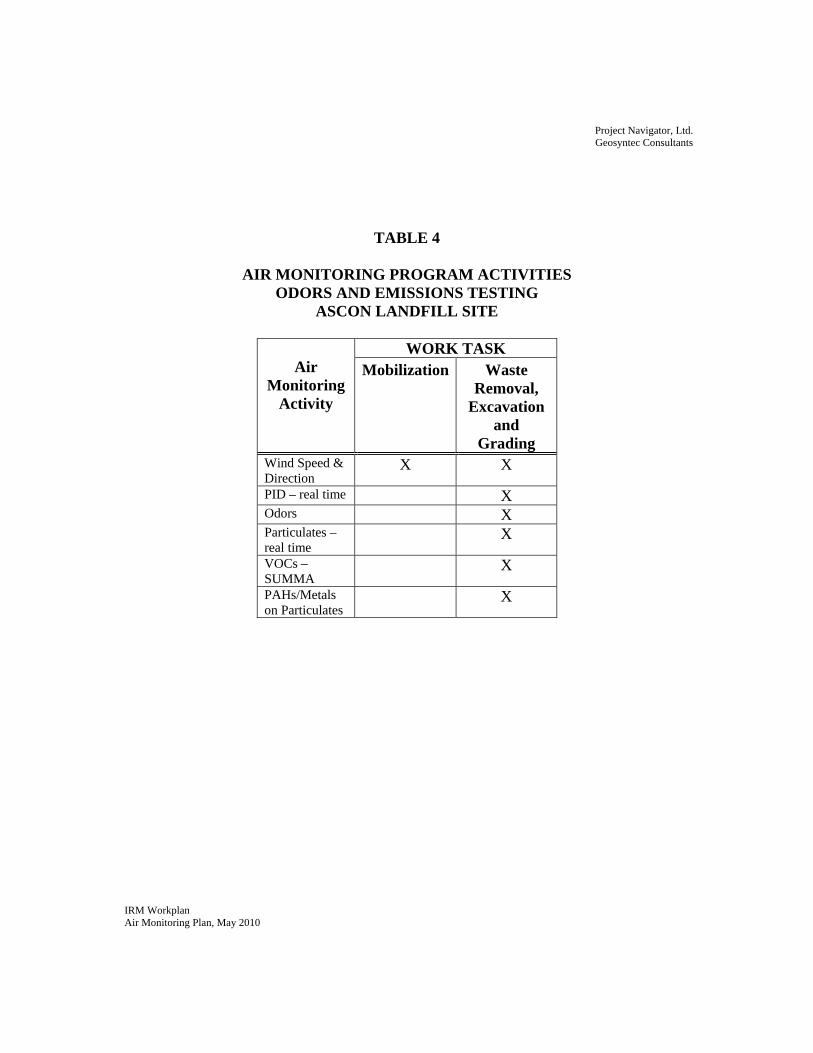
A summary of air monitoring and sampling activities and the work tasks they are associated with is presented in Table 4. The key elements of the program are described in more detail in the following subsections.
3.1 Real-Time Monitoring
The real-time monitoring will consist of the following:
• Air Quality – Air quality monitoring will consist of real-time measurements with hand-held instruments of total VOCs and total particulate matter, or dust, to measure airborne SVOCs and metals
• Odor – Odor monitoring will consist of real-time assessments of “odor intensity” by worker perception.
The monitoring will be performed as close to the excavation work face as possible (i.e., approximately 3 inches from material in the excavator or loader bucket) and at five locations (4 downwind and 1 upwind/background) along the perimeter of the Site. The monitoring locations and their basis for selection and measurement frequencies are further described in Section 3.3.
3.2 Time-Integrated Sampling
The time-integrated Site perimeter sampling will consist of 8-hour time-integrated measurements of VOCs, one from each of 5 locations per sampling day, during tarry liquid removal and excavation/grading work. For the first full week of each major phase of the project (tarry liquids removal, firming or mixing of waste for handling
IRM Workplan 10 Air Monitoring Plan, May 2010
purposes, as needed, prior to loading), VOC samples will be collected 5 days per week for one week. The sample collection duration (e.g., 8 hours) will be adjusted to accommodate the time in which active excavation/grading is being conducted, if needed. After the first week of a new phase of work and if sampling results indicate that concentrations are consistent with background or are below comparison criteria, the sampling frequency for VOCs will be reduced to 2 days per week. In addition, one upwind and two downwind samples will be collected for PM-10, metals, and PAHs using high volume samplers. The particulate samples will be collected twice during the first week at the start of waste material excavation from the lagoons. The need for weekly sampling and analysis for PM-10, metals, and PAHs will be reevaluated after data have been analyzed. These samples will be used for assessing the potential for offsite exposures. The upwind and downwind sampling locations and their basis for selection are further described below in Section 3.3. The collected samples will be sent offsite for laboratory analysis of the target compounds. 3.3 Measurement Locations
Real-time air monitoring measurements will be collected at active excavation and grading locations. The real-time monitoring will include as close to the excavation working face as possible (i.e., within 3 inches of the materials in the excavator or loader bucket).
In addition, both real-time and time-integrated samples will be collected at the Site perimeter. Figure 3-1 presents the perimeter air sampling locations. Time-integrated samples for VOCs will be collected at five locations that represent the primary upwind and downwind locations along the perimeter of the Site, based on previous ambient air studies. Time-integrated particulate (PM-10) samples for metals and PAH analysis will be collected at one upwind and two downwind locations in the vicinity of sample locations IRM-AA-06, IRM-AA-02 and IRM-AA-05. Due to the need to use generators to power the particulate samplers, the locations of the particulate samplers will be a sufficient distance away from the Summa canisters to reduce introduction of VOCs from the generator emissions. The perimeter measurement locations will also generally be used for real-time monitoring. The primary objective of the perimeter samples is to monitor potential offsite impacts. Three factors were considered in selecting the monitoring locations: (1) the overall program objectives, (2) the proximity to sensitive offsite areas, and (3) the prevailing winds expected to occur during the field activities. The expected winds (typically onshore from the west-southwest to east-northeast) were used to determine the specific
IRM Workplan 11 Air Monitoring Plan, May 2010
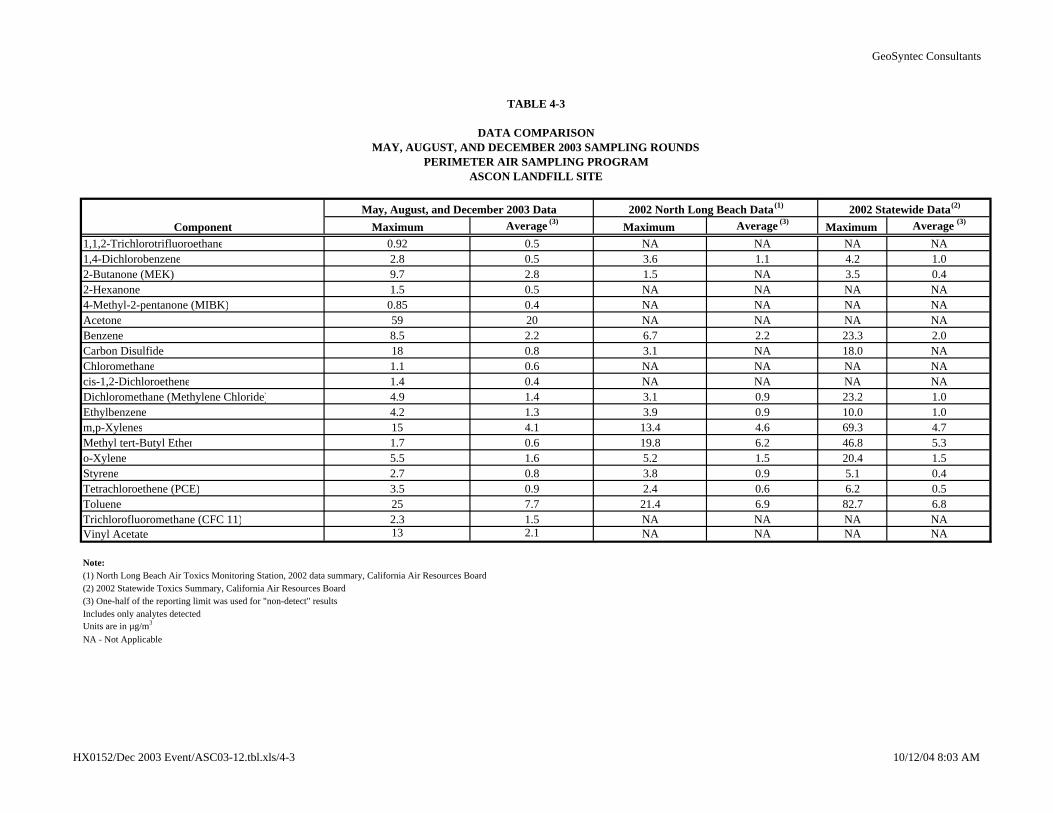
locations of the perimeter measurement locations. Attachment A presents the wind roses for the previous perimeter air monitoring conducted at the Site. This information, coupled with the meteorological station data, will allow for upwind and downwind contributions to be evaluated.
3.4 Wind Monitoring
Concurrent meteorological monitoring will be continuously performed during the work program for wind speed and direction. Wind speed and direction data will be collected with a single wind station installed in a relatively open area consistent with previous ambient air studies conducted for the Site and as shown in Figure 3-1. The wind station will consist of a Climatronix wind speed sensor, or equivalent, and a 360-degree directional wind vane installed on a tower at a height of approximately 19-feet above ground surface. The wind data will be recorded with a Handar electronic data logger, or equivalent, and a dual channel paper chart for backup purposes. The data loggers and system battery will be installed in a Nema enclosure at the base of the tower.
Wind monitoring data will also be used to satisfy the anticipated SCAQMD permit requirements. No excavation will occur if the wind speed is greater than 15 mph (averaged over 15 minutes) or the instantaneous wind speed exceeds 25 mph. DTSC will be notified if these conditions occur.
3.5 Laboratory Testing
All time-integrated air samples will be transported to the analytical laboratory under chain-of-custody protocol. EPA Method TO-15 will be run on samples collected in Summa canisters. EPA Method TO-13A for PAHs and EPA Method 6010B for metals will be run from samples collected from the high volume particulate samplers. The specific PAHs and metals to be analyzed are listed in Table 1. It is anticipated that Columbia Analytical Services of Simi Valley, California, will perform the offsite laboratory analysis for VOCs and PAHs. Columbia is the laboratory that has performed the laboratory testing of samples collected as part of the ambient air monitoring program performed at the Site, as well as during the Emergency Action. Metals analyses will likely be performed by Calscience Laboratories of Garden Grove, California, or another approved laboratory. The sample hold time for EPA Method TO-15 is 30 days when using a standard 6-liter canister. The effective detection limit (i.e., the reporting limit) of this method is generally 1.0 part per billion volume (ppbv) or less. The sample hold time for EPA Method TO-13A is 7 days and for EPA Method 6010 for metals is 180 days.
IRM Workplan 12 Air Monitoring Plan, May 2010
3.6 Sampling Methodologies
3.6.1 Real-Time Monitoring
3.6.1.1 VOCs
Excavation work face (i.e., excavator and/or loader bucket) monitoring will be conducted using a PID with an 11.7 ev lamp and calibrated using isobutylene, with results correlated to and expressed as if calibrated using hexane1. Mitigation measures will be applied in the working area as needed. If PID measurements within three inches of the excavator/loader bucket reach 50 ppm or greater for a sustained period of 15 seconds, then SCAQMD will be notified within 24 hours of the first detection of VOC-contaminated soil encountered, and the VOC-contaminated soil will be immediately sprayed with water and/or a vapor suppressant. The excavated VOC-contaminated soil/refuse will be stockpiled and covered using a soil sealant or, per anticipated Site-specific Rule 1150/1166 permit conditions. If PID measurements at the excavator/loader bucket exceed 1,000 ppm for a sustained period of 15 seconds, then the VOC-contaminated materials will be placed in a sealed container or will be directly loaded into trucks, moistened with additional water, covered, and transported offsite to an approved disposal facility, or be stored by alternative storage methods with approval from the SCAQMD.
VOC monitoring will also be conducted approximately every 60 minutes throughout the workday at each perimeter monitoring station and work area downwind location. In other words, a reading will be recorded approximately every 12 minutes at some location along the project perimeter. This will be accomplished via a “walk-around” procedure performed by a member of the team of field technicians. If sustained concentrations of VOCs are measured above 0.5 ppm above background at the Site perimeter, mitigation measures at the work area will be implemented and the VOC analysis using Summa canisters will be expedited. If concentrations are measured above 5 ppm above background at the perimeter, work will be stopped, mitigation measures will be applied and work will not continue until readings have returned to background levels.
1 Calibration using isobutylene is necessary to enable effective monitoring for 1,2-dichloroethane, a COPC at the Site. However, results need to be expressed as correlated to hexane calibration to meet anticipated SCAQMD requirements per Rule 1166. Alternatively, a separate PID that is calibrated using hexane may be used for air quality monitoring to satisfy Rule 1166.
IRM Workplan 13 Air Monitoring Plan, May 2010
The PID air monitoring instruments will be calibrated and operated according to manufacturer’s specifications. As noted above, the PID will be calibrated using isobutylene with results correlated to and expressed as if calibrated using hexane to accommodate both health and safety concerns and anticipated SCAQMD requirements. Calibration will be documented on a daily basis. The actual calibration procedures will be specific to the brand of instrument used.
3.6.1.2 Particulate Matter (Dust)
Particulate matter (dust) as PM10 will be monitored with Thermo Andersen (formerly MIE) DataRAM4 Aerosol Monitor Model DR4000, or equivalent. This instrument is an active device and monitors the air continuously and displays particulate concentrations expressed in either microgram per cubic meter (μg/m3) or milligrams per cubic meter (mg/m3). The measurement range of this monitor is 1 to 10,000 μg/m3 and the instrument accuracy is +/- 4 percent over the full detection range.
Dust monitoring will be conducted every 60 minutes throughout the workday at each perimeter monitoring station, both upwind and downwind. In other words, a reading will be recorded approximately every 12 minutes at some location along the project perimeter. This will be accomplished via a “walk-around” procedure performed by a member of the team of field technicians. Action levels for dust at perimeter monitoring locations are set at 0.05 mg/m3 above background, also the action level anticipated in a SCAQMD Rule 1150/1166 permit for the IRM activities. If this action level for dust is reached, dust control actions in the working area will be conducted. Mitigation measures for dust include water or suppressant spray or stopping work. The actual calibration and sampling procedures used for the dust monitoring will be specific to the brand of instrument used.
3.6.2 Odor
Odor monitoring will be ongoing throughout each of the phases of field activities at the air monitoring stations. Odors will be monitored by worker perception, and relative strength of odors at the monitoring stations and will be recorded in the designated field forms. This monitoring will be used to measure the odors emanating from the excavations at the specified locations with a focus on odors potentially reaching the local community.
Odors will be qualitatively and comparatively ranked by worker perception on a scale of 0 to 5 (See Table 5) and recorded on designated field forms. If a level three odor is
IRM Workplan 14 Air Monitoring Plan, May 2010
recorded at any property perimeter monitoring location, mitigation measures will be applied at the working area and a check for odors offsite will be performed.
A vapor suppressant, or another appropriate material, will be sprayed on impacted soils and waste as it is being excavated, as well as stockpiles of waste, as needed, if odors reach a significant level. Stockpiles that are not removed by the end of the work day shall be sprayed with water or vapor suppressant and/or covered with soil sealant before the end of the day.
3.6.3 Time-Integrated Sampling
Time-integrated samples for VOCs will be collected in 6-liter Summa canisters using a passive sample collection procedure during active excavation of waste material. Summa canisters will be provided pre-cleaned by Columbia Analytical Services located in Simi Valley, California, or another approved laboratory. Each Summa canister will be fitted with a dedicated flow control device. The flow control devices regulate the flow of ambient air into each canister at a controlled rate so that each canister will be approximately 85 percent full (maintaining a residual canister vacuum) at the end of the 8-hour sample collection periods. Calibration and cleaning of the flow control devices will be performed by Columbia Analytical, or another approved laboratory.
The sample intake for each Summa canister will be located at a height of approximately 3 feet (0.9 meter) above ground surface at each sampling location. Summa canisters will be secured to a metal pole driven into the ground at each location.
An analog vacuum gauge will be used to measure the vacuum of each Summa canister prior to sample collection. Following sample collection, a post-collection vacuum reading will be taken, and each Summa canister will be stored in cardboard boxes pending shipment to the laboratory under chain of custody protocol.
The PM-10 particulate samples for metals analysis will be collected using General Metals Works Model G1200 sampling systems, or equivalent. A five-point calibration of each sampler will be performed following initial mobilization and setup using a Sierra Anderson Model G28, or equivalent, variable resistance calibrator. Quartz filters will be provided pre-weighed by the laboratory. Samplers will be operated at a flow rate of 40 standard cubic feet per minute (SCFM). Samplers will be powered by portable generators. Collected samples will be returned to the laboratory under chain of custody protocol for analysis of particulate mass and metals concentrations.
IRM Workplan 15 Air Monitoring Plan, May 2010
Particulate samples for PAH analysis will be collected using General Metal Works Model GPS1 PUF samplers, or equivalent. Five point calibrations will also be performed on the PUF samplers following initial setup at the Site using certified model specific calibration equipment. Samples will be collected at flow rates of approximately 8 SCFM. PUF samplers will also be powered using portable generators. Samples will be collected on PUF cartridges with XAD-2® resin or equivalent. The PUF cartridges will be initially prepared by the laboratory. Following sample collection, samples will be placed in a cooler on ice and transported to the laboratory under chain of custody protocol. The results of the time-integrated samples will be compared to the criteria presented in Table 2 and previous air monitoring data (see Attachment A). If any concentration exceeds the acute REL or MRL, DTSC will be notified and work practices will be re-evaluated and implemented, as appropriate.
IRM Workplan 16 Air Monitoring Plan, May 2010
4. QUALITY ASSURANCE
4.1 General
Data quality will be maintained for the project through implementation of specific evaluations or activities. The following describes the specific measures that will be conducted in the field and by the contracted laboratory.
4.2 Field
Field activities will be documented with daily air monitoring logs. Field activities and conditions will also be documented with photographs. Sample integrity will be maintained by following the applicable sampling collection and handling procedures, specified in this workplan. Samples collected for laboratory testing will be shipped under chain of custody protocols. Field data quality will be maintained by calibrating PIDs on a daily basis. Calibration records will be recorded in daily field logs. Field documentation including daily logs, air monitoring logs and laboratory chain of custody forms will be peer reviewed for quality and compliance with project objectives and protocols.
4.3 Laboratory
Laboratory data quality assessment criteria will be used to evaluate the quality of the reported laboratory data. The data quality assessment criteria are expressed in terms of precision, accuracy, representativeness, completeness, and comparability. Procedures used to assess data precision and accuracy will be in accordance with the respective analytical methods from the USEPA’s Test Methods for Evaluating Solid Waste: Physical/Chemical Methods, SW 846. These are discussed in more detail below.
4.4 Data QA/QC
The data quality evaluation to be used on all elements of the data collected during the program includes:
• Precision • Accuracy • Representativeness • Completeness • Comparability
These elements are discussed in more detail below.
IRM Workplan 17 Air Monitoring Plan, May 2010
4.4.1 Precision
Precision is the measure of variability among individual sample measurements. The relative percent difference (RPD) between primary and field duplicate samples, laboratory sample duplicates, and matrix spike/matrix spike duplicates demonstrate the precision of the sample matrix. When the laboratory control sample (LCS) results meet the accuracy criteria, results are also believed to be precise and represent the precision of the laboratory independent from sample matrix. This is based on the LCS being within control limits in comparison to LCS results from previous analytical batches of similar methods and matrices. Precision is expressed in terms of RPD between the values resulting from duplicate sample analyses.
Acceptable levels of precision will vary according to the sample matrix, the specific analytical method, and the analytical concentration relative to the method detection limit (MDL). Precision criteria for the laboratory QC samples must be defined by historical control limits developed through the use of control charts. An RPD within the control limit indicates satisfactory precision in a measurement system.
4.4.2 Accuracy
Accuracy is a measure of the closeness of a reported concentration to the true value. Accuracy is expressed as a bias (high or low) and is determined by calculating percent recovery from MS/MSDs, LCSs, or surrogate spikes. MS/MSD and surrogate spike recoveries indicate accuracy relevant to a unique sample matrix. LCS recoveries indicate accuracy relevant to an analytical batch lot, and are strictly a measure of analytical accuracy conditions independent of samples and matrices. The percent recovery of an analyte, and the resulting degree of accuracy expected for the analysis of QC spiked samples, are dependent upon the sample matrix, method of analysis, and the compound or element being measured. The concentration of the analyte relative to the detection limit of the method also is a major factor in determining the accuracy of the measurement.

IRM Workplan 18 Air Monitoring Plan, May 2010
The degree of accuracy and the recovery of the analyte to be expected for the analysis of QC samples and spiked samples are dependent upon the matrix, method of analysis, and the compound or element being measured. The concentration of the analyte relative to the detection limit is also a factor in determining the accuracy of the measurement. Laboratory control charts will be used to determine acceptance criteria.
4.4.3 Representativeness
Representativeness expresses the extent to which collected data characterizes the chemical concentrations from the Site. Sample collection, handling, and analytical procedures are designed to obtain the most representative sample possible. Representative samples will be achieved by the following:
• Use of appropriate sampling procedures, including proper equipment and equipment decontamination.
• Use of appropriate analytical methods for the required parameters and project reporting limits.
• Analysis of samples within the required holding times.
4.4.4 Completeness
Completeness is defined as the percentage of laboratory measurements judged to be valid on a method-by-method basis. Valid data is defined as all data and/or qualified data considered to meet the DQOs for this project. Data completeness is expressed as percent complete (PC) and should be equal to 90 percent. The goal for meeting analytical holding times is 100 percent. At the end of each sampling event, the completeness of the data will be assessed. The laboratory results will be monitored as they become available to assess laboratory performance and its effect on data completeness requirements.
4.4.5 Comparability
Comparability expresses the confidence with which data from one sample, sampling round, Site, laboratory, or project can be compared to those from another. Comparability during sampling is dependent upon sampling program design and time periods. Comparability during analysis is dependent upon analytical methods, detection limits, laboratories, units of measure, and sample preparation procedures.
IRM Workplan 19 Air Monitoring Plan, May 2010
Comparability is determined on a qualitative rather than quantitative basis. For this project, comparability of data collected will be maintained by adherence to standard sample collection procedures, standard field measurement procedures, and standard reporting methods. In addition, to support the comparability of fixed-base laboratory analytical results with those obtained from previous or future testing, all samples will be analyzed by EPA-approved methods, where available. The EPA-recommended maximum permissible sample holding times for organic and inorganic parameters will not be exceeded. Analytical standards will be traceable to standard reference materials. Instrument calibrations will be performed in accordance with USEPA method specifications, and will be checked at the frequency specified for the methods.
IRM Workplan 20 Air Monitoring Plan, May 2010
5. REPORTING
Results from the IRM air monitoring program will be included in the IRM Completion Report. At a minimum, the report will also include the following air monitoring information:
• A summary of field activities; • Equipment calibration data; • A summary of wind monitoring data; • Summary tables of real-time monitoring; • Discussion of any action level exceedances and what mitigation actions were
undertaken; and • A discussion of time-integrated sample laboratory results and QA/QC data.
Individual VOC chemical concentrations will be compared to existing ambient air data and background concentrations based on a comparison between detected analyte concentrations from upgradient and downgradient time-integrated samples.
In addition, the significance of the measured concentrations from a health perspective will be evaluated by comparing the VOC, PAH, and metals data to the comparison criteria identified in Table 2 (MRLs from the ATSDR and OEHHA RELs).

TABLES
Project Navigator, Ltd. Geosyntec Consultants
IRM Workplan Air Monitoring Plan, May 2010
TABLE 1
TARGET CHEMICALS
AND AIR MONITORING METHOD ASCON LANDFILL SITE
Target Chemicals Compound Class
Air Monitoring Method
Real Time Fixed Laboratory Testing
Sample Collection
Test Method (Analytical
Holding Times) 1,1,1-Trichloroethane (*) 1,2-Dichloroethane (*) 1,2,4-Trimethylbenzene 2-Butanone (MEK) Acetone Benzene (*) Chloromethane Ethylbenzene Methylene Chloride (*) m.p-Xylenes Naphthalene o-Xylenes n-Hexane Styrene Toluene Trichlorofluoromethane Vinyl Acetate
Volatile Organic Compounds (VOCs)
Photoionization Detector (PID)
SUMMA Canister
EPA TO-15 (30 Days)
Chrysene Flourene Naphthalene Phenanthrene Pyrene
PAHs Dust Monitor High Volume Sampler with PUF-XAD2® Cartridge
TO-13A (
(7 Days)
Arsenic Cadmium Chromium Lead
Metals Dust Monitor High Volume Sampler with Quartz Filter
EPA Method 6010B (180 days)
Project Navigator, Ltd. Geosyntec Consultants
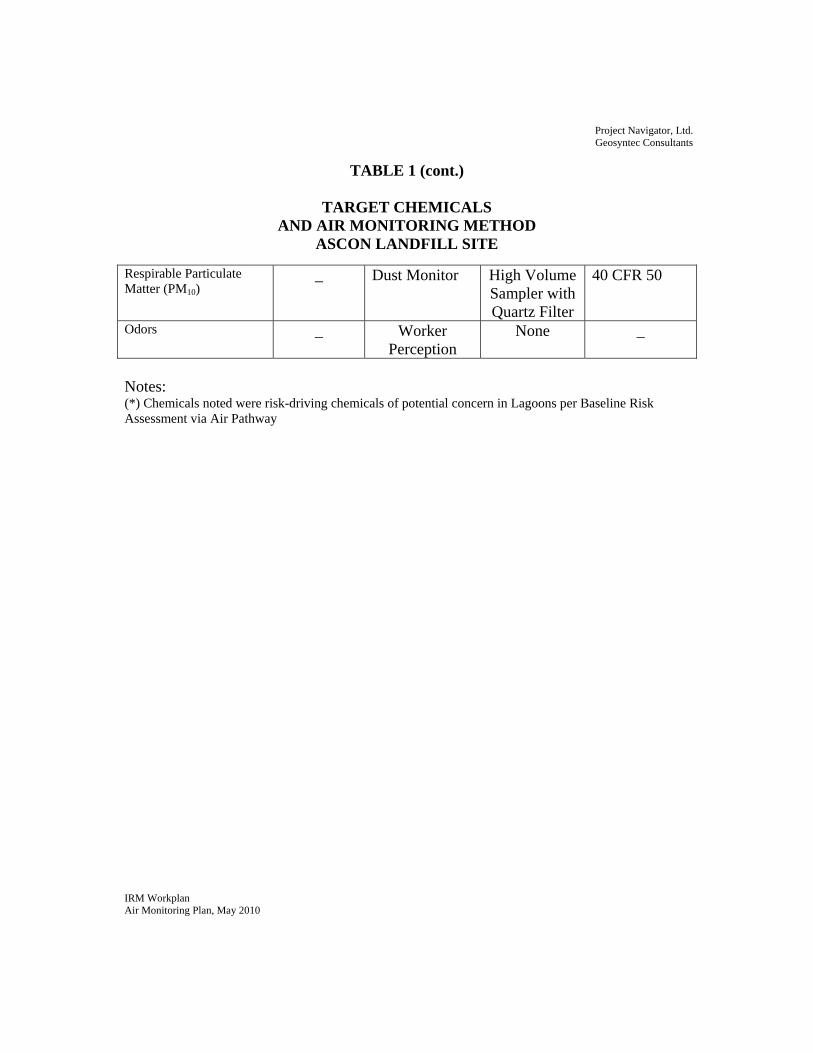
TABLE 1 (cont.)
TARGET CHEMICALS AND AIR MONITORING METHOD
ASCON LANDFILL SITE
IRM Workplan Air Monitoring Plan, May 2010
Respirable Particulate Matter (PM10)
_ Dust Monitor High Volume Sampler with Quartz Filter
40 CFR 50
Odors _ Worker Perception
None _
Notes: (*) Chemicals noted were risk-driving chemicals of potential concern in Lagoons per Baseline Risk Assessment via Air Pathway
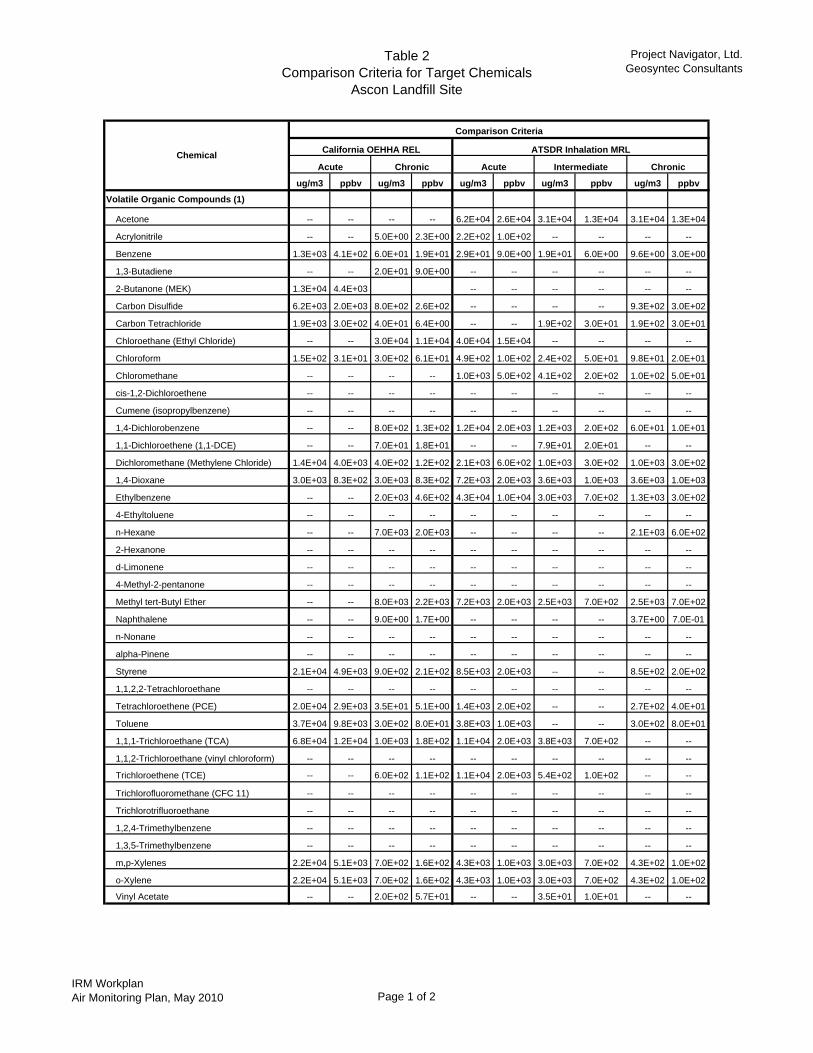
Table 2Comparison Criteria for Target Chemicals
Ascon Landfill Site
Project Navigator, Ltd.Geosyntec Consultants
ug/m3 ppbv ug/m3 ppbv ug/m3 ppbv ug/m3 ppbv ug/m3 ppbv
Volatile Organic Compounds (1)
Acetone -- -- -- -- 6.2E+04 2.6E+04 3.1E+04 1.3E+04 3.1E+04 1.3E+04
Acrylonitrile -- -- 5.0E+00 2.3E+00 2.2E+02 1.0E+02 -- -- -- --
Benzene 1.3E+03 4.1E+02 6.0E+01 1.9E+01 2.9E+01 9.0E+00 1.9E+01 6.0E+00 9.6E+00 3.0E+00
1,3-Butadiene -- -- 2.0E+01 9.0E+00 -- -- -- -- -- --
2-Butanone (MEK) 1.3E+04 4.4E+03 -- -- -- -- -- --
Carbon Disulfide 6.2E+03 2.0E+03 8.0E+02 2.6E+02 -- -- -- -- 9.3E+02 3.0E+02
Carbon Tetrachloride 1.9E+03 3.0E+02 4.0E+01 6.4E+00 -- -- 1.9E+02 3.0E+01 1.9E+02 3.0E+01
Chloroethane (Ethyl Chloride) -- -- 3.0E+04 1.1E+04 4.0E+04 1.5E+04 -- -- -- --
Chloroform 1.5E+02 3.1E+01 3.0E+02 6.1E+01 4.9E+02 1.0E+02 2.4E+02 5.0E+01 9.8E+01 2.0E+01
Chloromethane -- -- -- -- 1.0E+03 5.0E+02 4.1E+02 2.0E+02 1.0E+02 5.0E+01
cis-1,2-Dichloroethene -- -- -- -- -- -- -- -- -- --
Cumene (isopropylbenzene) -- -- -- -- -- -- -- -- -- --
1,4-Dichlorobenzene -- -- 8.0E+02 1.3E+02 1.2E+04 2.0E+03 1.2E+03 2.0E+02 6.0E+01 1.0E+01
1,1-Dichloroethene (1,1-DCE) -- -- 7.0E+01 1.8E+01 -- -- 7.9E+01 2.0E+01 -- --
Dichloromethane (Methylene Chloride) 1.4E+04 4.0E+03 4.0E+02 1.2E+02 2.1E+03 6.0E+02 1.0E+03 3.0E+02 1.0E+03 3.0E+02
1,4-Dioxane 3.0E+03 8.3E+02 3.0E+03 8.3E+02 7.2E+03 2.0E+03 3.6E+03 1.0E+03 3.6E+03 1.0E+03
Ethylbenzene -- -- 2.0E+03 4.6E+02 4.3E+04 1.0E+04 3.0E+03 7.0E+02 1.3E+03 3.0E+02
4-Ethyltoluene -- -- -- -- -- -- -- -- -- --
n-Hexane -- -- 7.0E+03 2.0E+03 -- -- -- -- 2.1E+03 6.0E+02
2-Hexanone -- -- -- -- -- -- -- -- -- --
d-Limonene -- -- -- -- -- -- -- -- -- --
4-Methyl-2-pentanone -- -- -- -- -- -- -- -- -- --
Methyl tert-Butyl Ether -- -- 8.0E+03 2.2E+03 7.2E+03 2.0E+03 2.5E+03 7.0E+02 2.5E+03 7.0E+02
Naphthalene -- -- 9.0E+00 1.7E+00 -- -- -- -- 3.7E+00 7.0E-01
n-Nonane -- -- -- -- -- -- -- -- -- --
alpha-Pinene -- -- -- -- -- -- -- -- -- --
Styrene 2.1E+04 4.9E+03 9.0E+02 2.1E+02 8.5E+03 2.0E+03 -- -- 8.5E+02 2.0E+02
1,1,2,2-Tetrachloroethane -- -- -- -- -- -- -- -- -- --
Tetrachloroethene (PCE) 2.0E+04 2.9E+03 3.5E+01 5.1E+00 1.4E+03 2.0E+02 -- -- 2.7E+02 4.0E+01
Toluene 3.7E+04 9.8E+03 3.0E+02 8.0E+01 3.8E+03 1.0E+03 -- -- 3.0E+02 8.0E+01
1,1,1-Trichloroethane (TCA) 6.8E+04 1.2E+04 1.0E+03 1.8E+02 1.1E+04 2.0E+03 3.8E+03 7.0E+02 -- --
1,1,2-Trichloroethane (vinyl chloroform) -- -- -- -- -- -- -- -- -- --
Trichloroethene (TCE) -- -- 6.0E+02 1.1E+02 1.1E+04 2.0E+03 5.4E+02 1.0E+02 -- --
Trichlorofluoromethane (CFC 11) -- -- -- -- -- -- -- -- -- --
Trichlorotrifluoroethane -- -- -- -- -- -- -- -- -- --
1,2,4-Trimethylbenzene -- -- -- -- -- -- -- -- -- --
1,3,5-Trimethylbenzene -- -- -- -- -- -- -- -- -- --
m,p-Xylenes 2.2E+04 5.1E+03 7.0E+02 1.6E+02 4.3E+03 1.0E+03 3.0E+03 7.0E+02 4.3E+02 1.0E+02
o-Xylene 2.2E+04 5.1E+03 7.0E+02 1.6E+02 4.3E+03 1.0E+03 3.0E+03 7.0E+02 4.3E+02 1.0E+02
Vinyl Acetate -- -- 2.0E+02 5.7E+01 -- -- 3.5E+01 1.0E+01 -- --
Intermediate Chronic
Comparison Criteria
Chemical California OEHHA REL
Acute Chronic
ATSDR Inhalation MRL
Acute
IRM WorkplanAir Monitoring Plan, May 2010 Page 1 of 2
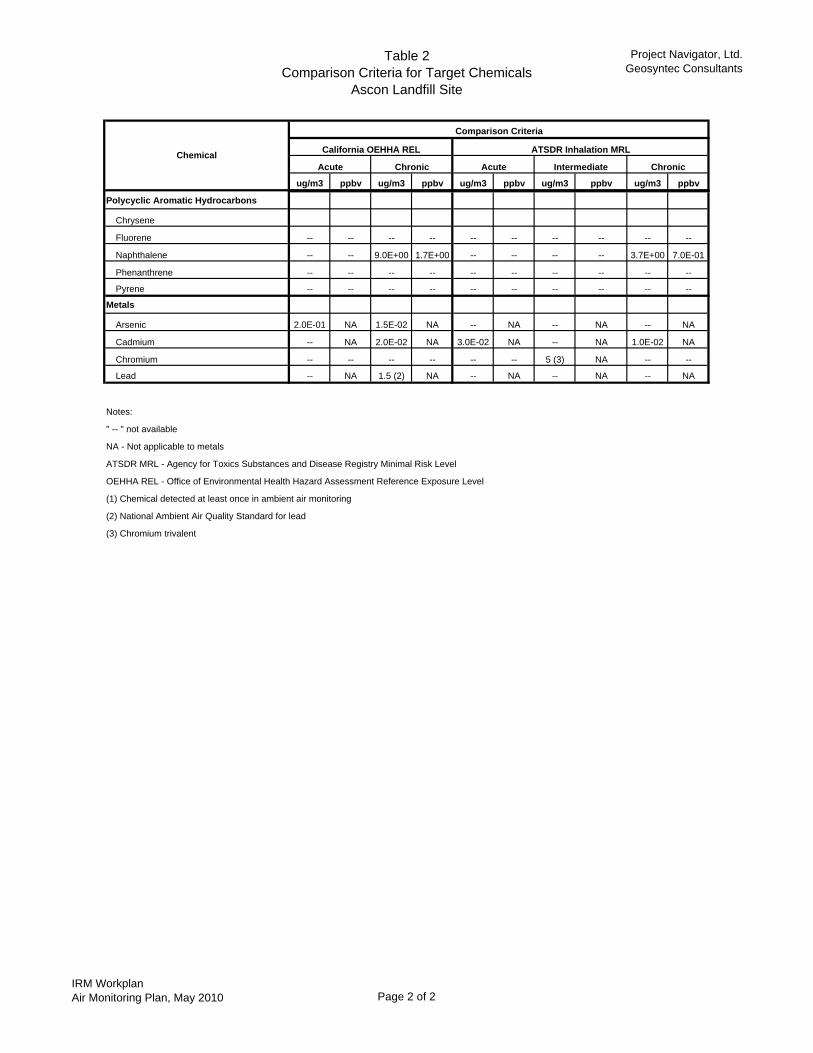
Table 2Comparison Criteria for Target Chemicals
Ascon Landfill Site
Project Navigator, Ltd.Geosyntec Consultants
ug/m3 ppbv ug/m3 ppbv ug/m3 ppbv ug/m3 ppbv ug/m3 ppbv
Intermediate Chronic
Comparison Criteria
Chemical California OEHHA REL
Acute Chronic
ATSDR Inhalation MRL
Acute
Polycyclic Aromatic Hydrocarbons
Chrysene
Fluorene -- -- -- -- -- -- -- -- -- --
Naphthalene -- -- 9.0E+00 1.7E+00 -- -- -- -- 3.7E+00 7.0E-01
Phenanthrene -- -- -- -- -- -- -- -- -- --
Pyrene -- -- -- -- -- -- -- -- -- --
Metals
Arsenic 2.0E-01 NA 1.5E-02 NA -- NA -- NA -- NA
Cadmium -- NA 2.0E-02 NA 3.0E-02 NA -- NA 1.0E-02 NA
Chromium -- -- -- -- -- -- 5 (3) NA -- --
Lead -- NA 1.5 (2) NA -- NA -- NA -- NA
Notes:
" -- " not available
NA - Not applicable to metals
ATSDR MRL - Agency for Toxics Substances and Disease Registry Minimal Risk Level
OEHHA REL - Office of Environmental Health Hazard Assessment Reference Exposure Level
(1) Chemical detected at least once in ambient air monitoring
(2) National Ambient Air Quality Standard for lead
(3) Chromium trivalent
IRM WorkplanAir Monitoring Plan, May 2010 Page 2 of 2

Project Navigator, Ltd. Geosyntec Consultants
IRM Workplan Air Monitoring Plan, May 2010
TABLE 3a
DIRECT-READING INSTRUMENT ACTION LEVELS AND REQUIRED ACTIONS
PID READINGS FOR TOTAL VOCS
Note: <Less than >Greater than
Location Action Levels (Readings in Parts Per
Million [ppm] above baseline)
Frequency/ Duration Required Action
Site Perimeter < 0.5 above baseline/background level
Every 60 min/ Sustained 1 minute measurement
Continue periodic monitoring
Site Perimeter > 0.5 above baseline/background level
Every 60 min/ Sustained 1 minute measurement
Apply vapor suppressant in work area; Expedite TO-15 sample analyses to identify specific VOC concentrations; If concentration above acute comparison criteria, notify DTSC.
Site Perimeter > 5 above baseline/background level
Every 60 min/ Sustained 1 minute measurement
Stop work; Apply vapor suppressant in work area; Evaluate work activities; Expedite TO-15 sample analyses to identify specific VOC concentrations; If concentration above acute comparison criteria, notify DTSC.
Excavator, loader, or dozer bucket
< 50
Every 15 min/ Maximum sustained reading
Continue periodic monitoring
Excavator, loader, or dozer bucket
> 50
Every 15 min/ Maximum sustained reading
Apply vapor suppressant, segregate to VOC-contaminated stockpile
Excavator, loader, or dozer bucket
> 1000 Every 15 min/ Maximum sustained reading
Apply vapor suppressant and place in sealed container or direct load into truck. Transport container within 30 days or truck within 15 minutes to appropriate disposal facility.
Project Navigator, Ltd. Geosyntec Consultants
IRM Workplan Air Monitoring Plan, May 2010
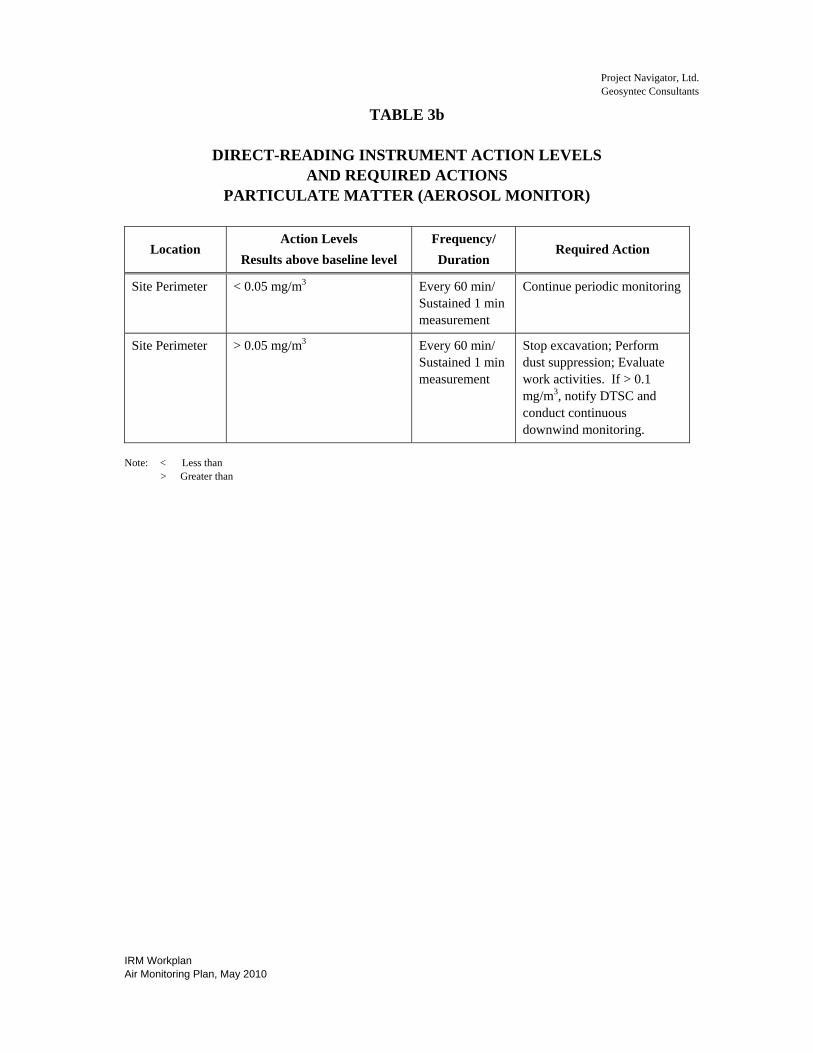
TABLE 3b
DIRECT-READING INSTRUMENT ACTION LEVELS AND REQUIRED ACTIONS
PARTICULATE MATTER (AEROSOL MONITOR)
Location Action Levels
Results above baseline level Frequency/ Duration
Required Action
Site Perimeter < 0.05 mg/m3
Every 60 min/ Sustained 1 min measurement
Continue periodic monitoring
Site Perimeter > 0.05 mg/m3
Every 60 min/ Sustained 1 min measurement
Stop excavation; Perform dust suppression; Evaluate work activities. If > 0.1 mg/m3, notify DTSC and conduct continuous downwind monitoring.
Note: < Less than
> Greater than
Project Navigator, Ltd. Geosyntec Consultants
IRM Workplan Air Monitoring Plan, May 2010
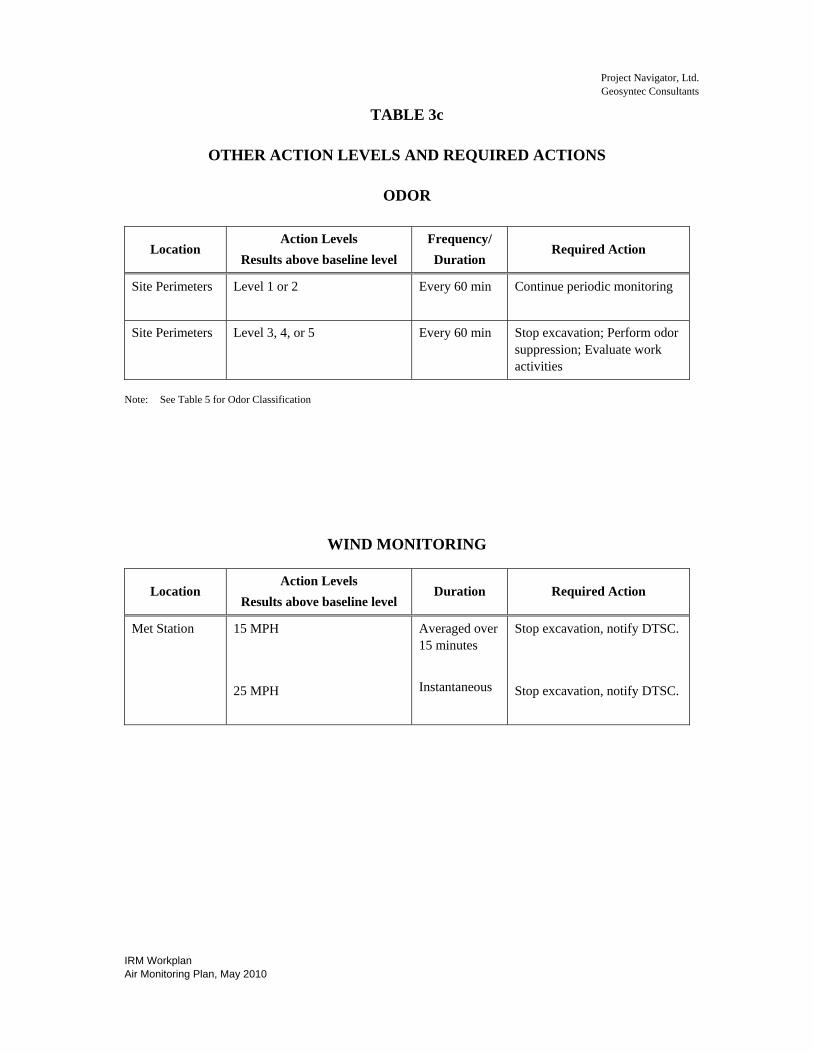
TABLE 3c
OTHER ACTION LEVELS AND REQUIRED ACTIONS
ODOR
Location Action Levels
Results above baseline level Frequency/ Duration
Required Action
Site Perimeters Level 1 or 2
Every 60 min Continue periodic monitoring
Site Perimeters Level 3, 4, or 5
Every 60 min Stop excavation; Perform odor suppression; Evaluate work activities
Note: See Table 5 for Odor Classification
WIND MONITORING
Location Action Levels
Results above baseline level Duration Required Action
Met Station 15 MPH 25 MPH
Averaged over 15 minutes Instantaneous
Stop excavation, notify DTSC. Stop excavation, notify DTSC.
Project Navigator, Ltd. Geosyntec Consultants
IRM Workplan Air Monitoring Plan, May 2010
TABLE 4
AIR MONITORING PROGRAM ACTIVITIES ODORS AND EMISSIONS TESTING
ASCON LANDFILL SITE
Air
Monitoring Activity
WORK TASK Mobilization Waste
Removal, Excavation
and Grading
Wind Speed & Direction
X X
PID – real time X Odors X Particulates – real time
X
VOCs – SUMMA
X
PAHs/Metals on Particulates
X
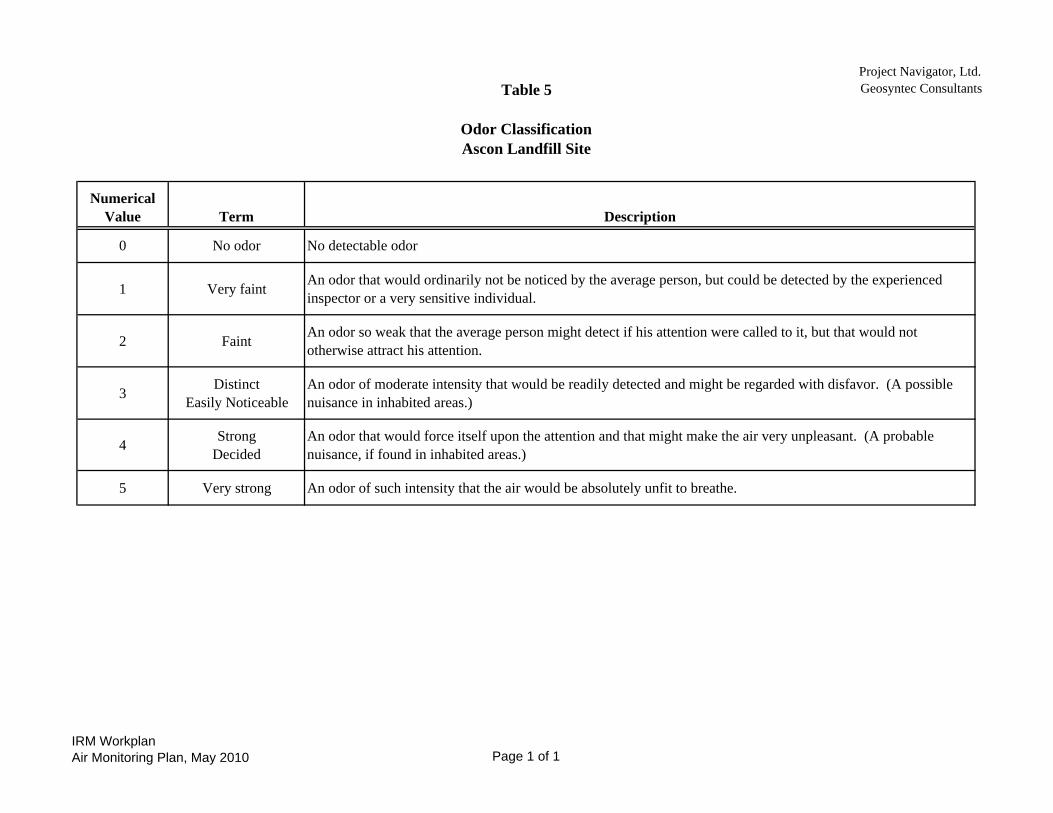
Table 5
Odor ClassificationAscon Landfill Site
Project Navigator, Ltd.Geosyntec Consultants
NumericalValue Term Description
0 No odor No detectable odor
1 Very faint An odor that would ordinarily not be noticed by the average person, but could be detected by the experienced inspector or a very sensitive individual.
2 Faint An odor so weak that the average person might detect if his attention were called to it, but that would not otherwise attract his attention.
3 DistinctEasily Noticeable
An odor of moderate intensity that would be readily detected and might be regarded with disfavor. (A possible nuisance in inhabited areas.)
4 StrongDecided
An odor that would force itself upon the attention and that might make the air very unpleasant. (A probable nuisance, if found in inhabited areas.)
5 Very strong An odor of such intensity that the air would be absolutely unfit to breathe.
IRM WorkplanAir Monitoring Plan, May 2010 Page 1 of 1

FIGURES
Hamilton Avenue
H
A
Edison Community ParkEdison High School
Residential
Ma
Lagoon 4 Lagoon 5BSingle-StoryCommercial
Buildings
agnolia Street
Lagoon 3
Lagoon 2Oil Wells
Residential
NORTH
0 110 220Lagoon 2
Lagoon 1
F
E
C D
Feet
Legend
Lagoons OutlineC D GAES Power
Plant Internal Fences
Site Gate
Trailer
Buried Pits
Plains All American Pipeline Property
Figure 1-1Site Location Map and Surrounding Land Use
IRM Workplan, Air Monitoring PlanAscon Landfill Site, Huntington Beach, California May 2010
Magn
H
A
NORTH
0 110 220
Feet
IRM-AA-03Hamilton Avenue IRM-AA-02
nolia Street
Lagoon 4 Lagoon 5B
Legend
Lagoons Outline
Internal Fences
Lagoon 3
Lagoon 2
e a e ces
Site Gate
Trailer
Buried Pits
Meteorological Monitoring Station
IRM-AA-05
Lagoon 2
Lagoon 1
F
E
C D
(to monitor wind conditions)
Air Monitoring and Sampling
Station (Approximate) for Real-
time and Time-integrated IRM-AA-07C D G Sampling
IRM-AA-06Note: 1. Sample location number designation used
from Emergency Action to maintain consistencyconsistency.
2. Locations shown are approximate and may be moved depending on Site conditions and moving equipment.
Figure 3-1Interim Removal Measure Air Monitoring Locations
May 2010IRM Workplan, Air Monitoring PlanAscon Landfill Site, Huntington Beach, California
ATTACHMENT A
PREVIOUS AMBIENT AIR MONITORING DATA
Baseline Perimeter Air Monitoring
GeoSyntec Consultants
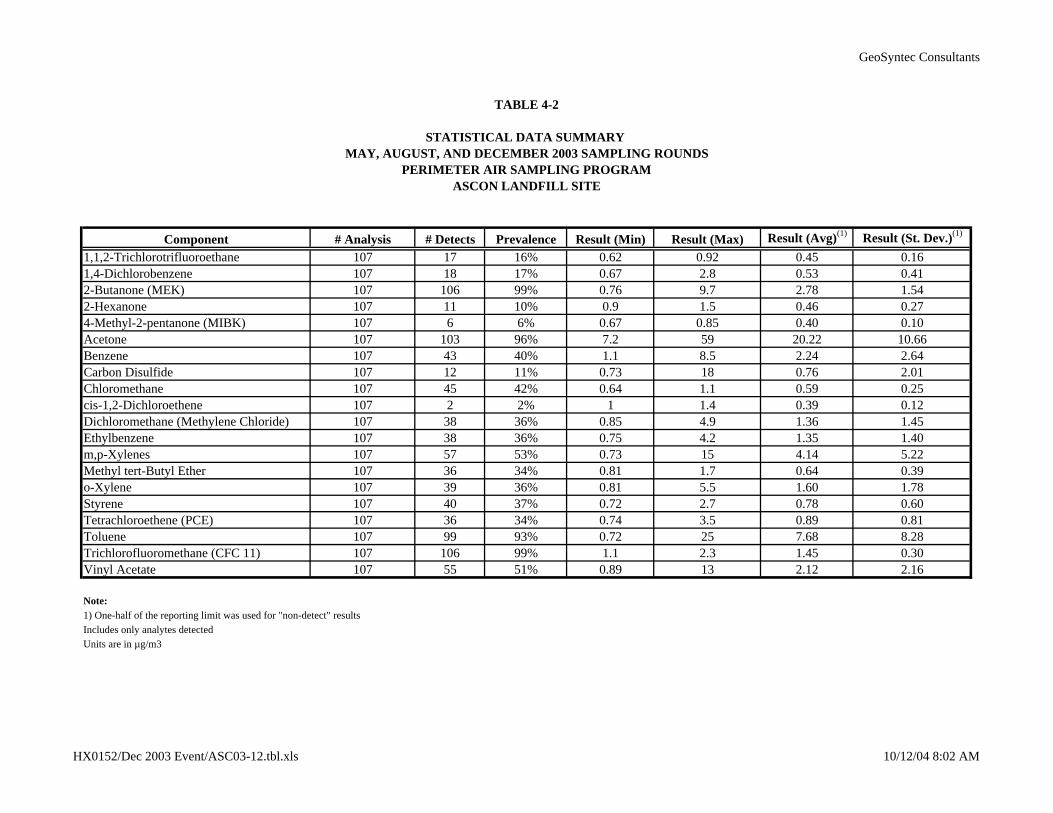
Component # Analysis # Detects Prevalence Result (Min) Result (Max) Result (Avg)(1) Result (St. Dev.)(1)
1,1,2-Trichlorotrifluoroethane 107 17 16% 0.62 0.92 0.45 0.161,4-Dichlorobenzene 107 18 17% 0.67 2.8 0.53 0.412-Butanone (MEK) 107 106 99% 0.76 9.7 2.78 1.542-Hexanone 107 11 10% 0.9 1.5 0.46 0.274-Methyl-2-pentanone (MIBK) 107 6 6% 0.67 0.85 0.40 0.10Acetone 107 103 96% 7.2 59 20.22 10.66Benzene 107 43 40% 1.1 8.5 2.24 2.64Carbon Disulfide 107 12 11% 0.73 18 0.76 2.01Chloromethane 107 45 42% 0.64 1.1 0.59 0.25cis-1,2-Dichloroethene 107 2 2% 1 1.4 0.39 0.12Dichloromethane (Methylene Chloride) 107 38 36% 0.85 4.9 1.36 1.45Ethylbenzene 107 38 36% 0.75 4.2 1.35 1.40m,p-Xylenes 107 57 53% 0.73 15 4.14 5.22Methyl tert-Butyl Ether 107 36 34% 0.81 1.7 0.64 0.39o-Xylene 107 39 36% 0.81 5.5 1.60 1.78Styrene 107 40 37% 0.72 2.7 0.78 0.60Tetrachloroethene (PCE) 107 36 34% 0.74 3.5 0.89 0.81Toluene 107 99 93% 0.72 25 7.68 8.28Trichlorofluoromethane (CFC 11) 107 106 99% 1.1 2.3 1.45 0.30Vinyl Acetate 107 55 51% 0.89 13 2.12 2.16
Note:1) One-half of the reporting limit was used for "non-detect" resultsIncludes only analytes detectedUnits are in µg/m3
TABLE 4-2
ASCON LANDFILL SITEPERIMETER AIR SAMPLING PROGRAM
MAY, AUGUST, AND DECEMBER 2003 SAMPLING ROUNDSSTATISTICAL DATA SUMMARY
HX0152/Dec 2003 Event/ASC03-12.tbl.xls 10/12/04 8:02 AM
GeoSyntec Consultants
Component Maximum Average (3) Maximum Average (3) Maximum Average (3)
1,1,2-Trichlorotrifluoroethane 0.92 0.5 NA NA NA NA1,4-Dichlorobenzene 2.8 0.5 3.6 1.1 4.2 1.02-Butanone (MEK) 9.7 2.8 1.5 NA 3.5 0.42-Hexanone 1.5 0.5 NA NA NA NA4-Methyl-2-pentanone (MIBK) 0.85 0.4 NA NA NA NAAcetone 59 20 NA NA NA NABenzene 8.5 2.2 6.7 2.2 23.3 2.0Carbon Disulfide 18 0.8 3.1 NA 18.0 NAChloromethane 1.1 0.6 NA NA NA NAcis-1,2-Dichloroethene 1.4 0.4 NA NA NA NADichloromethane (Methylene Chloride) 4.9 1.4 3.1 0.9 23.2 1.0Ethylbenzene 4.2 1.3 3.9 0.9 10.0 1.0m,p-Xylenes 15 4.1 13.4 4.6 69.3 4.7Methyl tert-Butyl Ether 1.7 0.6 19.8 6.2 46.8 5.3o-Xylene 5.5 1.6 5.2 1.5 20.4 1.5Styrene 2.7 0.8 3.8 0.9 5.1 0.4Tetrachloroethene (PCE) 3.5 0.9 2.4 0.6 6.2 0.5Toluene 25 7.7 21.4 6.9 82.7 6.8Trichlorofluoromethane (CFC 11) 2.3 1.5 NA NA NA NAVinyl Acetate 13 2.1 NA NA NA NA
Note:(1) North Long Beach Air Toxics Monitoring Station, 2002 data summary, California Air Resources Board(2) 2002 Statewide Toxics Summary, California Air Resources Board(3) One-half of the reporting limit was used for "non-detect" resultsIncludes only analytes detectedUnits are in µg/m3
NA - Not Applicable
PERIMETER AIR SAMPLING PROGRAMMAY, AUGUST, AND DECEMBER 2003 SAMPLING ROUNDS
DATA COMPARISON
TABLE 4-3
2002 Statewide Data(2)
ASCON LANDFILL SITE
May, August, and December 2003 Data 2002 North Long Beach Data(1)
HX0152/Dec 2003 Event/ASC03-12.tbl.xls/4-3 10/12/04 8:03 AM
LAGOON 4 LAGOON 5
LAGOON 3
LAGOON 2
LAGOON 1 PIT E
PIT C
PIT D
PIT G
PIT F
PIT H
PIT A
PIT B
AA-07
AA-05
AA-01 AA-02 AA-03
AA-045%
10%
15%
20%
25%
PROPERTY LINE
FOOTPRINT OF EXISTING PITS AND LAGOONS
SAMPLING LOCATIONS
WIND MONITORING LOCATION
2.0 5.0 8.0 18.0
19.0WIND SPEED CLASS BOUNDARIES
(MILES/HOUR)
LAGOON 4 LAGOON 5
LAGOON 3
LAGOON 2
LAGOON 1 PIT E
PIT C
PIT D
PIT G
PIT F
PIT H
PIT A
PIT B
AA-07
AA-05
AA-01 AA-02 AA-03
AA-043%
6%
9%
12%
15%
PROPERTY LINE
FOOTPRINT OF EXISTING PITS AND LAGOONS
SAMPLING LOCATIONS
WIND MONITORING LOCATION
2.0 5.0 8.0 18.0
19.0WIND SPEED CLASS BOUNDARIES
(MILES/HOUR)
Emergency Action Perimeter Air Monitoring
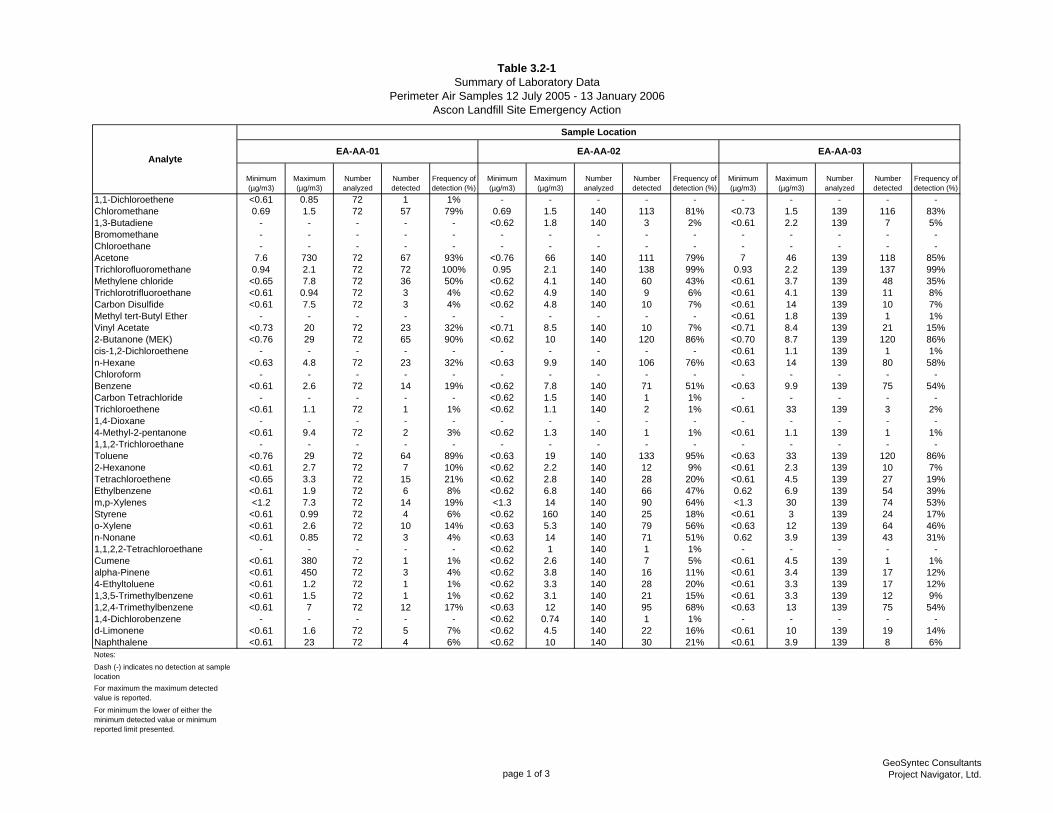
Table 3.2-1Summary of Laboratory Data
Perimeter Air Samples 12 July 2005 - 13 January 2006Ascon Landfill Site Emergency Action
Minimum (µg/m3)
Maximum (µg/m3)
Number analyzed
Number detected
Frequency of detection (%)
Minimum (µg/m3)
Maximum (µg/m3)
Number analyzed
Number detected
Frequency of detection (%)
Minimum (µg/m3)
Maximum (µg/m3)
Number analyzed
Number detected
Frequency of detection (%)
1,1-Dichloroethene <0.61 0.85 72 1 1% - - - - - - - - - -Chloromethane 0.69 1.5 72 57 79% 0.69 1.5 140 113 81% <0.73 1.5 139 116 83%1,3-Butadiene - - - - - <0.62 1.8 140 3 2% <0.61 2.2 139 7 5%Bromomethane - - - - - - - - - - - - - - -Chloroethane - - - - - - - - - - - - - - -Acetone 7.6 730 72 67 93% <0.76 66 140 111 79% 7 46 139 118 85%Trichlorofluoromethane 0.94 2.1 72 72 100% 0.95 2.1 140 138 99% 0.93 2.2 139 137 99%Methylene chloride <0.65 7.8 72 36 50% <0.62 4.1 140 60 43% <0.61 3.7 139 48 35%Trichlorotrifluoroethane <0.61 0.94 72 3 4% <0.62 4.9 140 9 6% <0.61 4.1 139 11 8%Carbon Disulfide <0.61 7.5 72 3 4% <0.62 4.8 140 10 7% <0.61 14 139 10 7%Methyl tert-Butyl Ether - - - - - - - - - - <0.61 1.8 139 1 1%Vinyl Acetate <0.73 20 72 23 32% <0.71 8.5 140 10 7% <0.71 8.4 139 21 15%2-Butanone (MEK) <0.76 29 72 65 90% <0.62 10 140 120 86% <0.70 8.7 139 120 86%cis-1,2-Dichloroethene - - - - - - - - - - <0.61 1.1 139 1 1%n-Hexane <0.63 4.8 72 23 32% <0.63 9.9 140 106 76% <0.63 14 139 80 58%Chloroform - - - - - - - - - - - - - - -Benzene <0.61 2.6 72 14 19% <0.62 7.8 140 71 51% <0.63 9.9 139 75 54%Carbon Tetrachloride - - - - - <0.62 1.5 140 1 1% - - - - -Trichloroethene <0.61 1.1 72 1 1% <0.62 1.1 140 2 1% <0.61 33 139 3 2%1,4-Dioxane - - - - - - - - - - - - - - -4-Methyl-2-pentanone <0.61 9.4 72 2 3% <0.62 1.3 140 1 1% <0.61 1.1 139 1 1%1,1,2-Trichloroethane - - - - - - - - - - - - - - -Toluene <0.76 29 72 64 89% <0.63 19 140 133 95% <0.63 33 139 120 86%2-Hexanone <0.61 2.7 72 7 10% <0.62 2.2 140 12 9% <0.61 2.3 139 10 7%Tetrachloroethene <0.65 3.3 72 15 21% <0.62 2.8 140 28 20% <0.61 4.5 139 27 19%Ethylbenzene <0.61 1.9 72 6 8% <0.62 6.8 140 66 47% 0.62 6.9 139 54 39%m,p-Xylenes <1.2 7.3 72 14 19% <1.3 14 140 90 64% <1.3 30 139 74 53%Styrene <0.61 0.99 72 4 6% <0.62 160 140 25 18% <0.61 3 139 24 17%o-Xylene <0.61 2.6 72 10 14% <0.63 5.3 140 79 56% <0.63 12 139 64 46%n-Nonane <0.61 0.85 72 3 4% <0.63 14 140 71 51% 0.62 3.9 139 43 31%1,1,2,2-Tetrachloroethane - - - - - <0.62 1 140 1 1% - - - - -Cumene <0.61 380 72 1 1% <0.62 2.6 140 7 5% <0.61 4.5 139 1 1%alpha-Pinene <0.61 450 72 3 4% <0.62 3.8 140 16 11% <0.61 3.4 139 17 12%4-Ethyltoluene <0.61 1.2 72 1 1% <0.62 3.3 140 28 20% <0.61 3.3 139 17 12%1,3,5-Trimethylbenzene <0.61 1.5 72 1 1% <0.62 3.1 140 21 15% <0.61 3.3 139 12 9%1,2,4-Trimethylbenzene <0.61 7 72 12 17% <0.63 12 140 95 68% <0.63 13 139 75 54%1,4-Dichlorobenzene - - - - - <0.62 0.74 140 1 1% - - - - -d-Limonene <0.61 1.6 72 5 7% <0.62 4.5 140 22 16% <0.61 10 139 19 14%Naphthalene <0.61 23 72 4 6% <0.62 10 140 30 21% <0.61 3.9 139 8 6%Notes:Dash (-) indicates no detection at sample locationFor maximum the maximum detected value is reported.For minimum the lower of either the minimum detected value or minimum reported limit presented.
EA-AA-01 Analyte
EA-AA-02 EA-AA-03
Sample Location
page 1 of 3GeoSyntec Consultants
Project Navigator, Ltd.
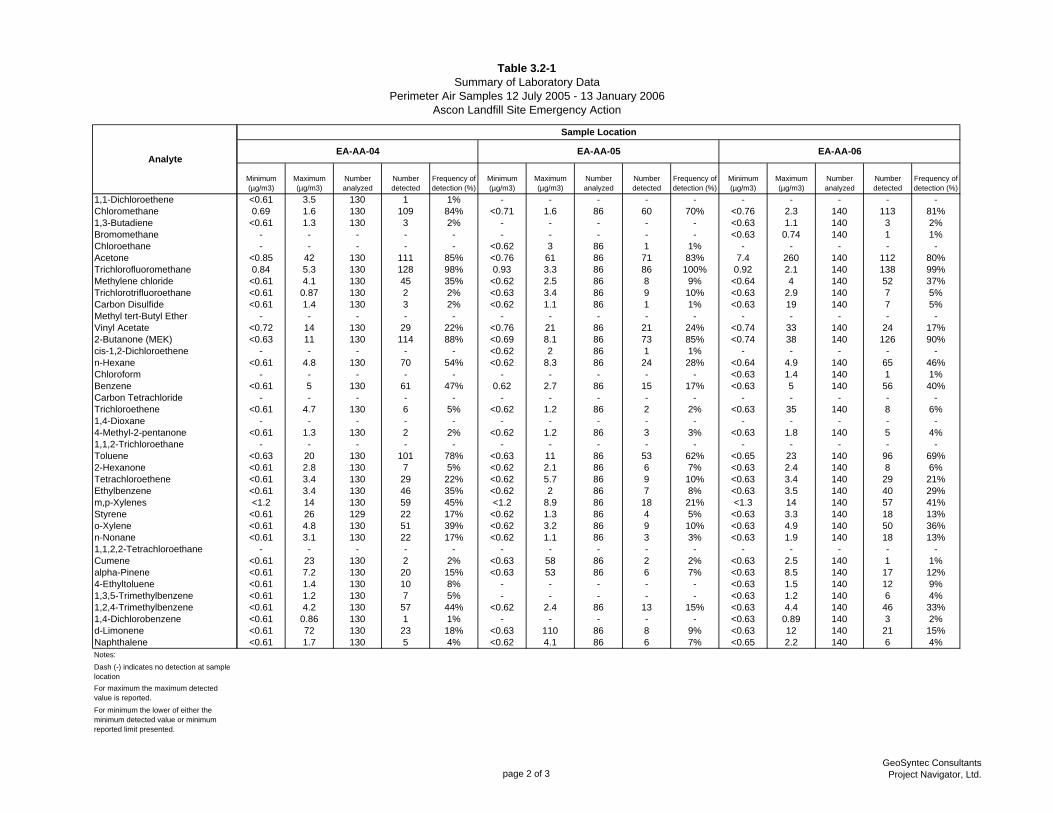
Table 3.2-1Summary of Laboratory Data
Perimeter Air Samples 12 July 2005 - 13 January 2006Ascon Landfill Site Emergency Action
1,1-DichloroetheneChloromethane1,3-ButadieneBromomethaneChloroethaneAcetoneTrichlorofluoromethaneMethylene chlorideTrichlorotrifluoroethaneCarbon DisulfideMethyl tert-Butyl EtherVinyl Acetate2-Butanone (MEK)cis-1,2-Dichloroethenen-HexaneChloroformBenzeneCarbon TetrachlorideTrichloroethene1,4-Dioxane4-Methyl-2-pentanone1,1,2-TrichloroethaneToluene2-HexanoneTetrachloroetheneEthylbenzenem,p-XylenesStyreneo-Xylenen-Nonane1,1,2,2-TetrachloroethaneCumenealpha-Pinene4-Ethyltoluene1,3,5-Trimethylbenzene1,2,4-Trimethylbenzene1,4-Dichlorobenzened-LimoneneNaphthaleneNotes:Dash (-) indicates no detection at sample locationFor maximum the maximum detected value is reported.For minimum the lower of either the minimum detected value or minimum reported limit presented.
Analyte
Minimum (µg/m3)
Maximum (µg/m3)
Number analyzed
Number detected
Frequency of detection (%)
Minimum (µg/m3)
Maximum (µg/m3)
Number analyzed
Number detected
Frequency of detection (%)
Minimum (µg/m3)
Maximum (µg/m3)
Number analyzed
Number detected
Frequency of detection (%)
<0.61 3.5 130 1 1% - - - - - - - - - -0.69 1.6 130 109 84% <0.71 1.6 86 60 70% <0.76 2.3 140 113 81%
<0.61 1.3 130 3 2% - - - - - <0.63 1.1 140 3 2%- - - - - - - - - - <0.63 0.74 140 1 1%- - - - - <0.62 3 86 1 1% - - - - -
<0.85 42 130 111 85% <0.76 61 86 71 83% 7.4 260 140 112 80%0.84 5.3 130 128 98% 0.93 3.3 86 86 100% 0.92 2.1 140 138 99%
<0.61 4.1 130 45 35% <0.62 2.5 86 8 9% <0.64 4 140 52 37%<0.61 0.87 130 2 2% <0.63 3.4 86 9 10% <0.63 2.9 140 7 5%<0.61 1.4 130 3 2% <0.62 1.1 86 1 1% <0.63 19 140 7 5%
- - - - - - - - - - - - - - -<0.72 14 130 29 22% <0.76 21 86 21 24% <0.74 33 140 24 17%<0.63 11 130 114 88% <0.69 8.1 86 73 85% <0.74 38 140 126 90%
- - - - - <0.62 2 86 1 1% - - - - -<0.61 4.8 130 70 54% <0.62 8.3 86 24 28% <0.64 4.9 140 65 46%
- - - - - - - - - - <0.63 1.4 140 1 1%<0.61 5 130 61 47% 0.62 2.7 86 15 17% <0.63 5 140 56 40%
- - - - - - - - - - - - - - -<0.61 4.7 130 6 5% <0.62 1.2 86 2 2% <0.63 35 140 8 6%
- - - - - - - - - - - - - - -<0.61 1.3 130 2 2% <0.62 1.2 86 3 3% <0.63 1.8 140 5 4%
- - - - - - - - - - - - - - -<0.63 20 130 101 78% <0.63 11 86 53 62% <0.65 23 140 96 69%<0.61 2.8 130 7 5% <0.62 2.1 86 6 7% <0.63 2.4 140 8 6%<0.61 3.4 130 29 22% <0.62 5.7 86 9 10% <0.63 3.4 140 29 21%<0.61 3.4 130 46 35% <0.62 2 86 7 8% <0.63 3.5 140 40 29%<1.2 14 130 59 45% <1.2 8.9 86 18 21% <1.3 14 140 57 41%
<0.61 26 129 22 17% <0.62 1.3 86 4 5% <0.63 3.3 140 18 13%<0.61 4.8 130 51 39% <0.62 3.2 86 9 10% <0.63 4.9 140 50 36%<0.61 3.1 130 22 17% <0.62 1.1 86 3 3% <0.63 1.9 140 18 13%
- - - - - - - - - - - - - - -<0.61 23 130 2 2% <0.63 58 86 2 2% <0.63 2.5 140 1 1%<0.61 7.2 130 20 15% <0.63 53 86 6 7% <0.63 8.5 140 17 12%<0.61 1.4 130 10 8% - - - - - <0.63 1.5 140 12 9%<0.61 1.2 130 7 5% - - - - - <0.63 1.2 140 6 4%<0.61 4.2 130 57 44% <0.62 2.4 86 13 15% <0.63 4.4 140 46 33%<0.61 0.86 130 1 1% - - - - - <0.63 0.89 140 3 2%<0.61 72 130 23 18% <0.63 110 86 8 9% <0.63 12 140 21 15%<0.61 1.7 130 5 4% <0.62 4.1 86 6 7% <0.65 2.2 140 6 4%
Sample Location
EA-AA-05 EA-AA-06 EA-AA-04
page 2 of 3GeoSyntec Consultants
Project Navigator, Ltd.
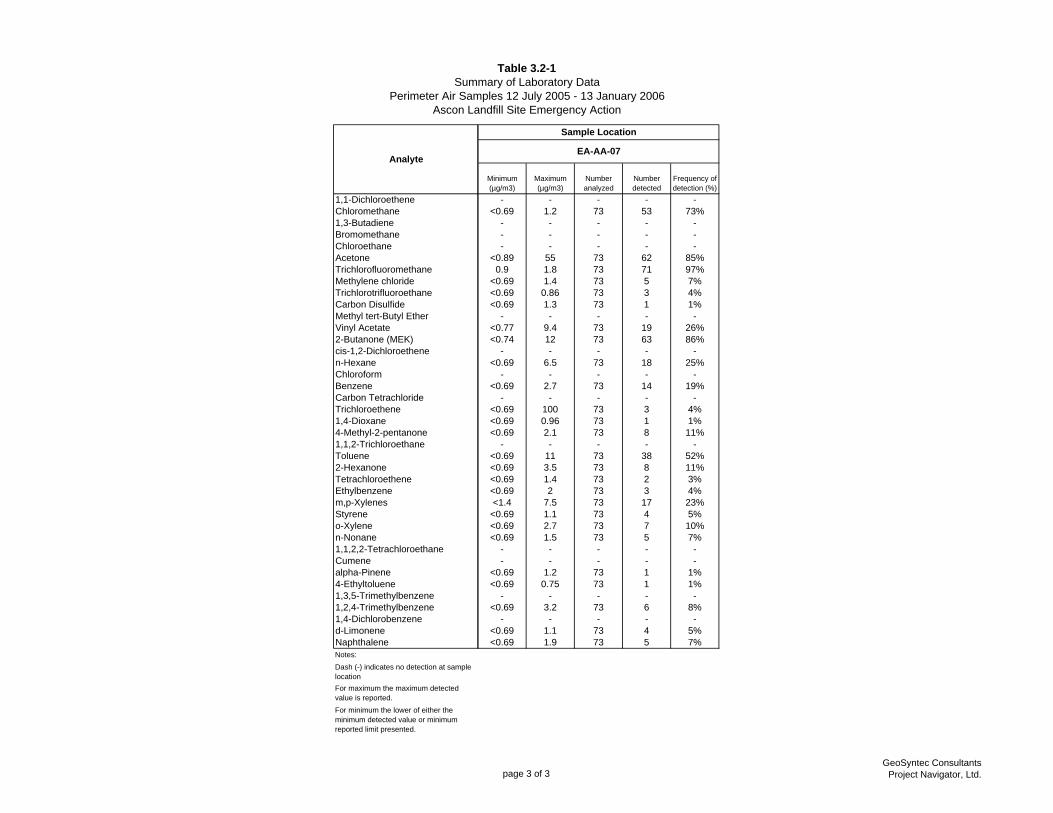
Table 3.2-1Summary of Laboratory Data
Perimeter Air Samples 12 July 2005 - 13 January 2006Ascon Landfill Site Emergency Action
1,1-DichloroetheneChloromethane1,3-ButadieneBromomethaneChloroethaneAcetoneTrichlorofluoromethaneMethylene chlorideTrichlorotrifluoroethaneCarbon DisulfideMethyl tert-Butyl EtherVinyl Acetate2-Butanone (MEK)cis-1,2-Dichloroethenen-HexaneChloroformBenzeneCarbon TetrachlorideTrichloroethene1,4-Dioxane4-Methyl-2-pentanone1,1,2-TrichloroethaneToluene2-HexanoneTetrachloroetheneEthylbenzenem,p-XylenesStyreneo-Xylenen-Nonane1,1,2,2-TetrachloroethaneCumenealpha-Pinene4-Ethyltoluene1,3,5-Trimethylbenzene1,2,4-Trimethylbenzene1,4-Dichlorobenzened-LimoneneNaphthaleneNotes:Dash (-) indicates no detection at sample locationFor maximum the maximum detected value is reported.For minimum the lower of either the minimum detected value or minimum reported limit presented.
Analyte
Minimum (µg/m3)
Maximum (µg/m3)
Number analyzed
Number detected
Frequency of detection (%)
- - - - -<0.69 1.2 73 53 73%
- - - - -- - - - -- - - - -
<0.89 55 73 62 85%0.9 1.8 73 71 97%
<0.69 1.4 73 5 7%<0.69 0.86 73 3 4%<0.69 1.3 73 1 1%
- - - - -<0.77 9.4 73 19 26%<0.74 12 73 63 86%
- - - - -<0.69 6.5 73 18 25%
- - - - -<0.69 2.7 73 14 19%
- - - - -<0.69 100 73 3 4%<0.69 0.96 73 1 1%<0.69 2.1 73 8 11%
- - - - -<0.69 11 73 38 52%<0.69 3.5 73 8 11%<0.69 1.4 73 2 3%<0.69 2 73 3 4%<1.4 7.5 73 17 23%
<0.69 1.1 73 4 5%<0.69 2.7 73 7 10%<0.69 1.5 73 5 7%
- - - - -- - - - -
<0.69 1.2 73 1 1%<0.69 0.75 73 1 1%
- - - - -<0.69 3.2 73 6 8%
- - - - -<0.69 1.1 73 4 5%<0.69 1.9 73 5 7%
Sample Location
EA-AA-07
page 3 of 3GeoSyntec Consultants
Project Navigator, Ltd.
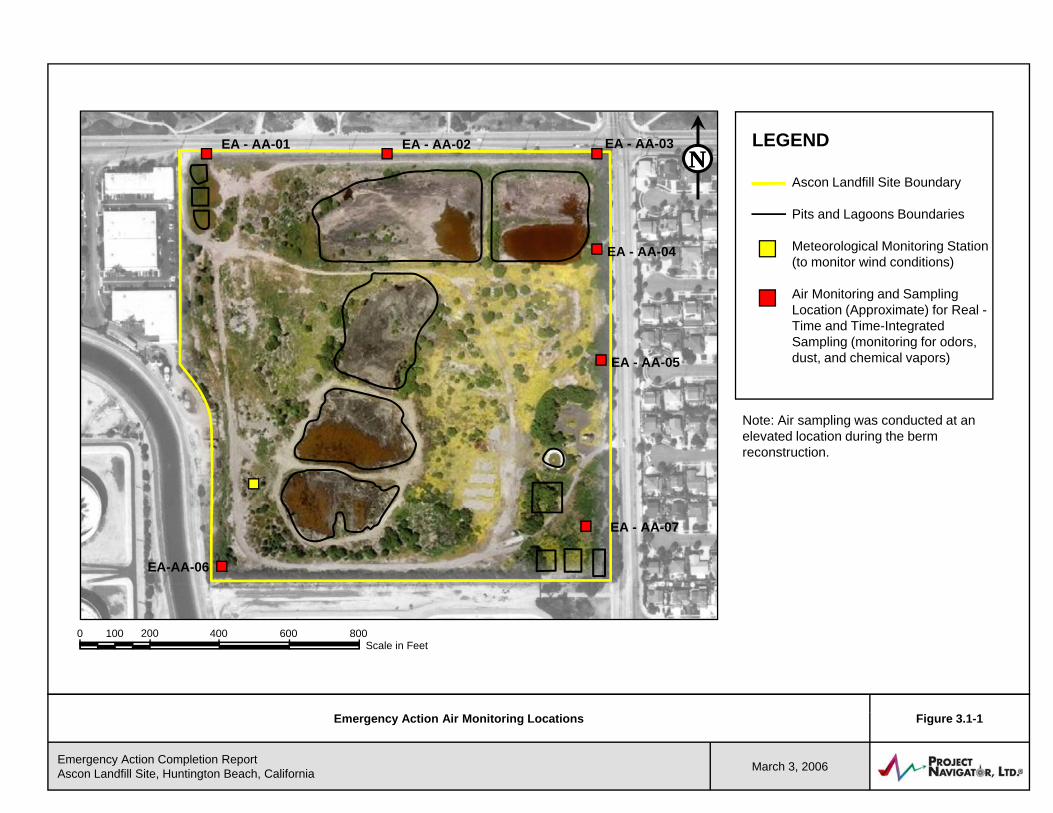
LEGEND
Ascon Landfill Site Boundary
EA - AA-01 EA - AA-03EA - AA-02NN
Pits and Lagoons Boundaries
Meteorological Monitoring Station(to monitor wind conditions)
Air Monitoring and Sampling L ti (A i t ) f R l
EA - AA-04
Location (Approximate) for Real -Time and Time-Integrated Sampling (monitoring for odors, dust, and chemical vapors)
-
EA - AA-05
Note: Air sampling was conducted at an elevated location during the berm reconstruction.
EA-AA-06
EA - AA-07
Scale in Feet0 100 400 600 800200
Emergency Action Completion ReportAscon Landfill Site, Huntington Beach, California March 3, 2006
Figure 3.1-1Emergency Action Air Monitoring Locations

WIND ROSE12 JULY 2005, 7:00 AM TO 13 JANUARY 2006, 7:00 PM
Ascon Landfill SiteHuntington Beach, California
N
S
W E
No observations were missing.Wind flow is FROM the directions shown.Rings drawn at 5% intervals.Calms excluded.
0.00 2.43
5.64
4.22
4.45
5.86
6.56
7.28
8.89 9.75
7.19 15.84
17.12
3.12
1.08
0.58
Wind Speed ( Miles Per Hour)0.1 3.5 6.9 11.5 18.4 24.2