5d – the cdm in the transport sector - world...
TRANSCRIPT

Division 44 Environment and Infrastructure
The CDM in the Transport SectorModule 5d
Sustainable Transport: A Sourcebook for Policy-makers in Developing Cities
Sector projectTransport Policy Advisory Service

OVERVIEW OF THE SOURCEBOOKSustainable Transport:A Sourcebook for Policy-Makers in Developing Cities
What is the Sourcebook?This Sourcebook on Sustainable Urban Transport addresses the key areas of a sustainable transport policy framework for a developing city. The Sourcebook consists of more than 25 modules mentioned on the following pages. It is also com-plemented by a series of training documents and other material available from http://www.sutp.org (and http://www.sutp.cn for Chinese users).
Who is it for?The Sourcebook is intended for policy-makers in developing cities, and their advisors. This target audience is reflected in the content, which provides policy tools appropriate for application in a range of developing cities. The academic sector (e.g., universities) has also benefited from this material.
How is it supposed to be used?The Sourcebook can be used in a number of ways. If printed, it should be kept in one location, and the different modules provided to officials involved in urban transport. The Sourcebook can be easily adapted to fit a formal short course training event, or can serve as a guide for developing a curriculum or other training program in the area of urban transport. GTZ is elaborating training packages for selected modules, all available since October 2004 from http://www.sutp.org or http://www.sutp.cn.
What are some of the key features?The key features of the Sourcebook include: A practical orientation, focusing on best
practices in planning and regulation and, where possible, successful experiences in developing cities.
Contributors are leading experts in their fields.
An attractive and easy-to-read, colour layout. Non-technical language (to the extent
possible), with technical terms explained. Updates via the Internet.
How do I get a copy?Electronic versions (pdf) of the modules are available at http://www.sutp.org or http://www.sutp.cn. Due to the constant updating of all modules print versions of the English language edition are no longer available. A print version of the first 20 modules in Chinese language is sold throughout China by Communication Press.Any questions regarding the use of the modules can be directed to [email protected] or [email protected].
Comments or feedback?We would welcome any of your comments or suggestions, on any aspect of the Sourcebook, by e-mail to [email protected] and [email protected], or by surface mail to:
Manfred Breithaupt GTZ, Division 44 P. O. Box 5180 65726 Eschborn, Germany
Further modules and resourcesFurther modules are anticipated in the areas of Financing Urban Transport, Reftrofit, and Induced Travel (among others). Additional resources are being developed, and Urban Transport Photo CD-ROMs and DVD are available (some photos have been uploaded in http://www.sutp.org – photo section). You will also find relevant links, bibliographical references and more than 400 documents and presentations under http://www.sutp.org (http://www.sutp.cn for Chinese users).

i
(i) Sourcebook Overview and Cross-cutting Issues of Urban Transport (GTZ)
Institutional and policy orientation1a. The Role of Transport in Urban Development
Policy (Enrique Peñalosa)1b. Urban Transport Institutions
(Richard Meakin)1c. Private Sector Participation in Urban Trans-
port Infrastructure Provision (Christopher Zegras, MIT)
1d. Economic Instruments (Manfred Breithaupt, GTZ)
1e. Raising Public Awareness about Sustainable Urban Transport (Carlos F. Pardo, GTZ)
Land use planning and demand management2a. Land Use Planning and Urban Transport
(Rudolf Petersen, Wuppertal Institute)2b. Mobility Management (Todd Litman, VTPI)
Transit, walking, and cycling3a. Mass Transit Options
(Lloyd Wright, University College London; Karl Fjellstrom, GTZ)
3b. Bus Rapid Transit (Lloyd Wright, University College London)
3c. Bus Regulation & Planning (Richard Meakin)
3d. Preserving and Expanding the Role of Non-motorised Transport (Walter Hook, ITDP)
3e. Car-Free Development (Lloyd Wright, University College London)
Vehicles and fuels4a. Cleaner Fuels and Vehicle Technologies
(Michael Walsh; Reinhard Kolke, Umweltbundesamt – UBA)
4b. Inspection & Maintenance and Roadworthi-ness (Reinhard Kolke, UBA)
4c. Two- and Three-Wheelers (Jitendra Shah, World Bank; N.V. Iyer, Bajaj Auto)
4d. Natural Gas Vehicles (MVV InnoTec)4e. Intelligent Transport Systems
(Phil Sayeg, TRA; Phil Charles, University of Queensland)
4f. EcoDriving (VTL; Manfred Breithaupt, Oliver Eberz, GTZ)
Environmental and health impacts5a. Air Quality Management (Dietrich Schwela,
World Health Organization)5b. Urban Road Safety (Jacqueline Lacroix,
DVR; David Silcock, GRSP)5c. Noise and its Abatement
(Civic Exchange Hong Kong; GTZ; UBA)5d. The CDM in the Transport Sector
(Jürg M. Grütter)
Resources6. Resources for Policy-makers (GTZ)
Social and cross-cutting issues on urban transport7a. Gender and Urban Transport: Fashionable
and Affordable (Mika Kunieda; Aimée Gauthier)
Modules and contributors
ii
About the authorDr Jürg M. Grütter is an economist special-ized on global environmental issues with a focus on GHG and transport. He holds a doctorate degree in economics from St. Gallen, Switzerland and a postgraduate in development affairs from the ETH Zürich, Switzerland. Dr. Grütter has worked on climate change projects in more than 30 countries worldwide and has also been involved in policy advice for climate change negotiations. He is working since 1991 on transport and climate change issues. Grütter is the founder and owner of grütter consult-ing, established in 1996 with offices in Bolivia and Switzerland. Grütter has developed on behalf of the Swiss private sector energy agency EnAW methodologies for domestic transport measures in Switzerland and has coached more than 80 leading transport enterprises in Switzerland. Grütter has realized for these firms among other the GHG documentation and the monitoring software. In 2006 Grütter negotiated jointly with EnAW an agreement to sell GHG reductions of these transport firms from 2006–2012 to a private Swiss entity for domestic compliance purposes. These were the first GHG reduction sales of transport firms used for Kyoto compliance purposes worldwide. Grütter is also lead reviewer of methodologies for the UNFCCC and has commented on most transport methodologies. He is the author of the first approved large-scale CDM transport methodology (AM0031 for BRTs) as well as the author of the only registered CDM transport project (TransMilenio). Grütter consulting is managing a large portfolio of CDM transport projects of diverse nature and has also signed a contract with the World Bank to develop in the course of 2007 four new CDM transport meth-odologies. Strategic allies of grütter consulting include Carbotech AG, Thomas Bürki GmbH, and CAF. For further information see http://www.transport-ghg.com or contact the author at [email protected]
� � � � �� �����������

iii
Author: Jürg M. Grütter – grütter consulting –
Editor: Deutsche Gesellschaft fürTechnische Zusammenarbeit (GTZ) GmbHP. O. Box 518065726 Eschborn, Germanyhttp://www.gtz.de
Division 44, Environment and InfrastructureSector Project "Transport Policy Advisory Service"
Commissioned byBundesministerium für wirtschaftliche Zusammenarbeit und Entwicklung (BMZ)Friedrich-Ebert-Allee 4053113 Bonn, Germanyhttp://www.bmz.de
Manager: Manfred Breithaupt
Editing: Sascha Thielmann
Cover photo: Carlos F. PardoBRT lane,Jakarta, 2006
Layout: Klaus Neumann, SDS, G.C.
Eschborn, May 2007
Module 5d
The CDM in the Transport Sector
Findings, interpretations, and conclusions expressed in this document are based on infor-mation gathered by GTZ and its consultants, partners, and contributors from reliable sources. GTZ does not, however, guarantee the accuracy or completeness of information in this document, and cannot be held responsible for any errors, omissions, or losses which emerge from its use.
iv
1. Introduction 1
2. The CDM and the GHG market 2
2.1 The CDM 2
2.2 CDM project cycle 3
2.3 The GHG market 8
3. CDM transport projects 11
3.1 Projects reducing emissions per kilometre 11
3.2 Projects reducing emissions per unit transported 133.2.1 Passenger transport 133.2.2 Freight transport 14
3.3 Projects reducing trips 15
4. Core elements of a CDM transport methodology 15
4.1 Applicability conditions 15
4.2 Approach 16
4.3 Project owner 16
4.4 Additionality 17
4.5 Baseline 17
4.6 Project emissions 18
4.7 Leakage 18
4.8 Emission reductions 19
4.9 Sustainable development impact 19
4.10 Stakeholder involvement 19
4.11 Monitoring 19
5. Case study: The TransMilenio CDM project 20
5.1 TransMilenio 20
5.2 GHG reductions of TransMilenio 22
5.3 CDM benefits for TransMilenio 24
6. Outlook on CDM and transport 25
Methodologies 25
Projects 26

1
Module 5d: The CDM in the Transport Sector
1. Introduction
The Kyoto Protocol entered into force on February 16th 2005. The Protocol has as target to reduce Greenhouse Gas (GHG) emissions and includes binding emission reduction com-mitments for Annex I countries (industrialized economies). The Protocol establishes three inno-vative “mechanisms” known as Joint Implemen-tation, the Clean Development Mechanism and Emissions Trading. These are designed to help countries with reduction commitments cut the cost of meeting their emissions targets by taking advantage of opportunities to reduce emissions that cost less in other countries than at home. Any legal entity may participate in the mecha-nisms, albeit under the responsibility of their governments. The Clean Development Mecha-nism (CDM) is related to projects realized in
Fig. 1Urban traffic
contributes to local pollution and
climate change: Local bus in Bogotá.
Photo courtesy by Carlos F. Pardo
developing countries with GHG reductions sold to countries with reduction commitments (An-nex I parties in the United Nations Framework Convention on Climate Change terminology). The resulting emission reductions are called Certified Emission Reductions (CERs). The CDM also aims to help developing countries achieve sustainable development.Sustainable transport projects in general reduce GHG emissions. Such projects could thus qualify for the CDM and benefit from the sale of GHG offsets. This makes good projects eco-nomically more attractive and reduces barriers towards their successful implementation. The CDM can constitute an important additional revenue source for sustainable transport projects next to traditional income sources including the GEF (Global Environmental Facility).This module contains the following chapters:1. The CDM and the GHG market: The rules,
regulations and procedures governing the CDM are outlined and core aspects of the GHG market are explained.
2. CDM transport projects: The CDM potential of different types of transport projects are analyzed and the scope of approved CDM transport methodologies is presented.
3. Core elements of a transport methodology: The major components that have to be covered when preparing a CDM methodology are preseanted.
4. Case Study: The TransMilenio CDM project: TransMilenio is the first officially registered CDM transport project. The path towards reg-istration, results, costs and benefits are detailed.
5. Outlook on CDM and transport.
AbbreviationsAM Approved MethodologyBRT Bus Rapid Transit CDM Clean Development MechanismCER Certified Emission ReductionCNG Compressed Natural GasDOE Designated Operational EntityDNA Designated National AuthorityEB Executive Board of the CDMERPA Emission Reduction Purchase
AgreementEUA European Union Emission
AllowancesEU ETS European Union Emission Trading
SystemGEF Global Environment FacilityGHG Greenhouse GasesIETA International Emissions Trading
AssociationLDR Light Duty RailLPG Liquefied Petroleum GasNMT Non-Motorized TransportPDD Project Design DocumentPIN Project Identification NotePP Project ProponentUNFCCC United Nations Framework
Convention on Climate ChangeVER Voluntary Emission Reduction
2
Sustainable Transport: A Sourcebook for Policy-makers in Developing Cities
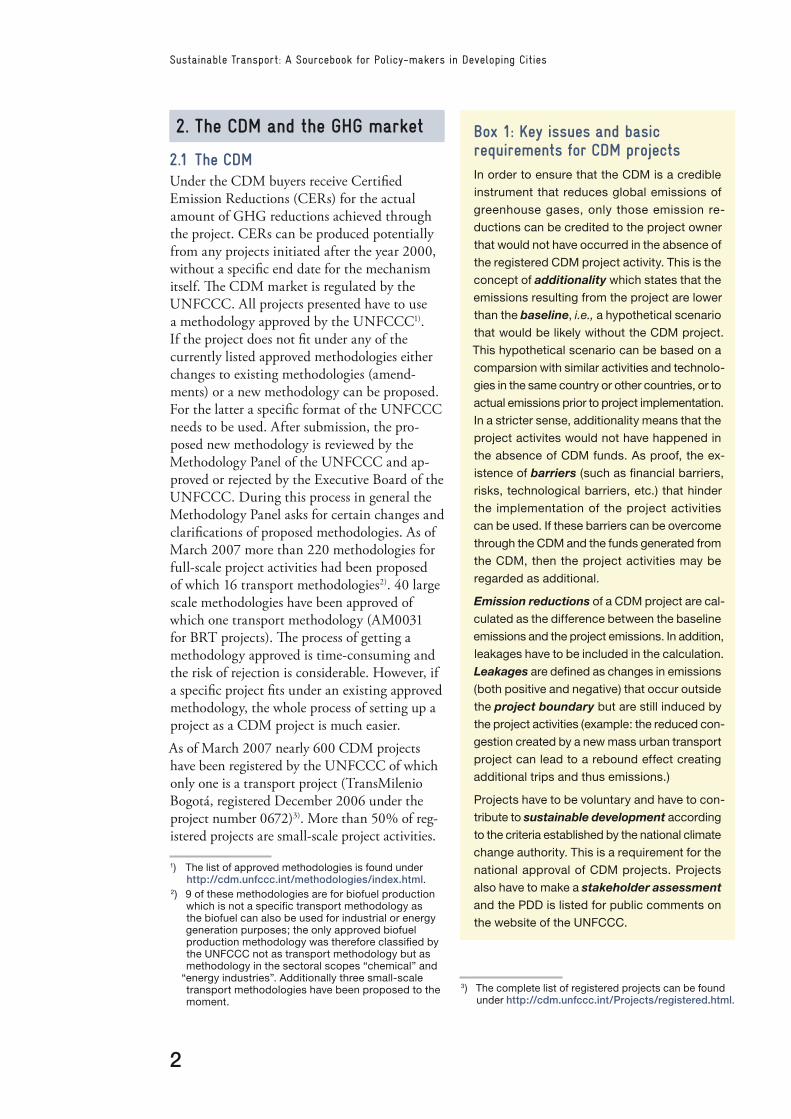
2. The CDM and the GHG market
2.1 The CDMUnder the CDM buyers receive Certified Emission Reductions (CERs) for the actual amount of GHG reductions achieved through the project. CERs can be produced potentially from any projects initiated after the year 2000, without a specific end date for the mechanism itself. The CDM market is regulated by the UNFCCC. All projects presented have to use a methodology approved by the UNFCCC1). If the project does not fit under any of the currently listed approved methodologies either changes to existing methodologies (amend-ments) or a new methodology can be proposed. For the latter a specific format of the UNFCCC needs to be used. After submission, the pro-posed new methodology is reviewed by the Methodology Panel of the UNFCCC and ap-proved or rejected by the Executive Board of the UNFCCC. During this process in general the Methodology Panel asks for certain changes and clarifications of proposed methodologies. As of March 2007 more than 220 methodologies for full-scale project activities had been proposed of which 16 transport methodologies2). 40 large scale methodologies have been approved of which one transport methodology (AM0031 for BRT projects). The process of getting a methodology approved is time-consuming and the risk of rejection is considerable. However, if a specific project fits under an existing approved methodology, the whole process of setting up a project as a CDM project is much easier.As of March 2007 nearly 600 CDM projects have been registered by the UNFCCC of which only one is a transport project (TransMilenio Bogotá, registered December 2006 under the project number 0672)3). More than 50% of reg-istered projects are small-scale project activities.
Box 1: Key issues and basic requirements for CDM projectsIn order to ensure that the CDM is a credible
instrument that reduces global emissions of
greenhouse gases, only those emission re-
ductions can be credited to the project owner
that would not have occurred in the absence of
the registered CDM project activity. This is the
concept of additionality which states that the
emissions resulting from the project are lower
than the baseline, i.e., a hypothetical scenario
that would be likely without the CDM project.
This hypothetical scenario can be based on a
comparsion with similar activities and technolo-
gies in the same country or other countries, or to
actual emissions prior to project implementation.
In a stricter sense, additionality means that the
project activites would not have happened in
the absence of CDM funds. As proof, the ex-
istence of barriers (such as financial barriers,
risks, technological barriers, etc.) that hinder
the implementation of the project activities
can be used. If these barriers can be overcome
through the CDM and the funds generated from
the CDM, then the project activities may be
regarded as additional.
Emission reductions of a CDM project are cal-
culated as the difference between the baseline
emissions and the project emissions. In addition,
leakages have to be included in the calculation.
Leakages are defined as changes in emissions
(both positive and negative) that occur outside
the project boundary but are still induced by
the project activities (example: the reduced con-
gestion created by a new mass urban transport
project can lead to a rebound effect creating
additional trips and thus emissions.)
Projects have to be voluntary and have to con-
tribute to sustainable development according
to the criteria established by the national climate
change authority. This is a requirement for the
national approval of CDM projects. Projects
also have to make a stakeholder assessment and the PDD is listed for public comments on
the website of the UNFCCC.
1) The list of approved methodologies is found under http://cdm.unfccc.int/methodologies/index.html.
2) 9 of these methodologies are for biofuel production which is not a specific transport methodology as the biofuel can also be used for industrial or energy generation purposes; the only approved biofuel production methodology was therefore classified by the UNFCCC not as transport methodology but as methodology in the sectoral scopes “chemical” and
“energy industries”. Additionally three small-scale transport methodologies have been proposed to the moment.
3) The complete list of registered projects can be found under http://cdm.unfccc.int/Projects/registered.html.

3
Module 5d: The CDM in the Transport Sector
The term “small-scale CDM project” is defined by the UNFCCC. No general definition is made but in general transport projects which reduce less than 60,000 tons of CO2eq per year are considered as small-scale projects. Small-scale projects can use simplified baseline and moni-toring methodologies, have a shorter approval process and pay less registration fees thus reduc-ing their transaction costs. Projects have been registered from numerous countries worldwide4). The number and variety of projects registered shows clearly that the CDM is a feasible and workable option for additional project finance.The key issues and basic requirements for a project to qualify as a CDM project are pre-sented in Chapter 2. A brief summary is given in the Box on “Key issues and basic require-ments for CDM projects”.
2.2 CDM project cycleThe CDM project cycle is determined at least partially by the UNFCCC. Figure 2 shows the CDM project cycle up to getting the first CERs.
Project identification phaseIn general CDM projects are not designed as stand-alone projects. The normal procedure is to assess the GHG reduction potential of conventional transport projects e.g., public transport projects. If they have a reduction potential then they are identified as a potential CDM project. The CDM is thus a component of a conventional transport project and not “the project” itself 5). The “conventional” transport project must have merits of its own and be feasible but potentially not attractive enough from a technical and financial viewpoint with-out CDM. CDM improves the financial terms of sustainable transport projects and reduces barriers towards its implementation. CDM can thus make conventional transport projects more attractive and more feasible. Before entering the CDM stage the usual project (not CDM) specific technical and financial feasibility studies are required. Most projects start their actual CDM phase with a Project Identification
Note (PIN). Such a PIN could, for example, be initiated by a city administration that wishes to implement a Bus Rapid Transit (BRT) system and is trying to assess the option of additional CDM funding. The PIN is not compulsory on behalf of the UNFCCC but it gives prospective buyers or CDM project developers an indica-tion of the magnitude of the project in terms of GHG reductions, potential risks and benefits. It is used as a selling document for attracting interest of potential buyers and investors in the CDM part of the project. In general the PIN
���������������������
��������������
�����������������������
����������
������������������������
��������
���� ��������������������������������� ����������������������������������� ���������������������������������� �������������������������������� ����������������������������� ������������������������������� �������������������
���
���
���
��
��
���
��
���
���
�������������������
���������������������������������
Fig. 2CDM project cycle.
Source: UNFCCC, adapted by Grütter
Fig. 3The rules for the CDM
are set at the UNFCCC conferences: A session
at the COP 11 in Montreal 2005.
Photo courtesy of Holger Liptow, 2005
4) For project locations see http://cdm.unfccc.int/Projects/MapApp/index.html.
5) This is equal to most other projects e.g., the main pur-pose of a windmill project is electricity generation and not GHG reduction (which is the CDM component).
4
Sustainable Transport: A Sourcebook for Policy-makers in Developing Cities
is formulated by a specialized CDM project developer using a standard format, e.g., that of the World Bank.
Project design phaseThe project design phase is under control of the project owner or project proponent (PP) (e.g., a municipality for a BRT). The project has to be formulated in a specific format given by the UNFCCC, called the Project Design Document PDD. The PDD is formulated in English. It has to use an UNFCCC approved methodology. The newest version of the PDD including guidelines how to complete the PDD are available at the UNFCCC website6). The PDD for full-scale projects is different (more extensive) than the PDD for small-scale projects. In general the PDD is formulated by a special-ized CDM project developer7). Projects may opt for a crediting period of 10 years non-renewable or 7 years renewable up to twice. However project activities under the CDM can in no case be longer than the expected operational lifetime of the project.
Validation/registration phaseThe validation of the PDD is done by a UN-FCCC approved Designated Operational Entity DOE. The project owner selects, contracts and pays the DOE. He can choose any DOE ap-proved by the UNFCCC for the specific sectoral scope. The list of approved DOEs is available at the UNFCCC website8). As of February 2007
DOEs approved for the transport sector were Japan Quality Assurance Organization (JQA), Det Norske Veritas Certification (DNV), TÜV SÜD Industrie Service (TÜV SÜD), SGS United Kingdom (SGS), and TÜV NORD CERT (RWTUV). All PDDs in the validation/registration phase are posted on the UNFCCC website for public comment for a duration of 1 month9). Project owners have to respond to public enquiries and to comments made by the DOE to pass successfully validation. During or after validation the project has to receive the approval of the host country (country in which the project is being realized). The approval is given by the Designated National Author-ity DNA. The respective DNA can be found on the UNFCCC website10). The criteria for national approval are determined by each DNA but include as minimum an assessment of the contribution of the project towards sustainable development11). After receiving the DNA ap-proval and after a positive validation report the DOE makes a request for registration for the proposed CDM project. The registration will be considered valid after 8 weeks (4 weeks for small-scale projects) if no request for review was made by minimum 3 members of the Executive Board EB of the CDM. Registration is the for-mal acceptance by the EB of a validated project as a CDM project activity and is the prerequisite for the issuance of CERs related to that project activity. All registered project including the full documentation (PDD, validation report, ap-provals) are listed on the UNFCCC website12). If the EB requests a review, the project owner can respond to enquiries made. Eventually he will have to change parts of the project. The pos-sibility also exists that the EB rejects approval of the proposed project. Projects can only create
6) http://cdm.unfccc.int/Reference/PDDs_Forms/PDDs/index.html
7) The project developer is listed in the PDD as person/organisation responsible for the formulation of the baseline. Project owners interested in identifying or contracting project developers with relevant experi-ence could thus review registered PDDs of compara-ble projects.
8) http://cdm.unfccc.int/DOE/list/index.html9) http://cdm.unfccc.int/Projects/Validation/index.html10) http://cdm.unfccc.int/DNA/index.html11) Criteria and methodology to assess the contribution
to sustainable development are determined by each DNA individually.
12) http://cdm.unfccc.int/Projects/registered.html
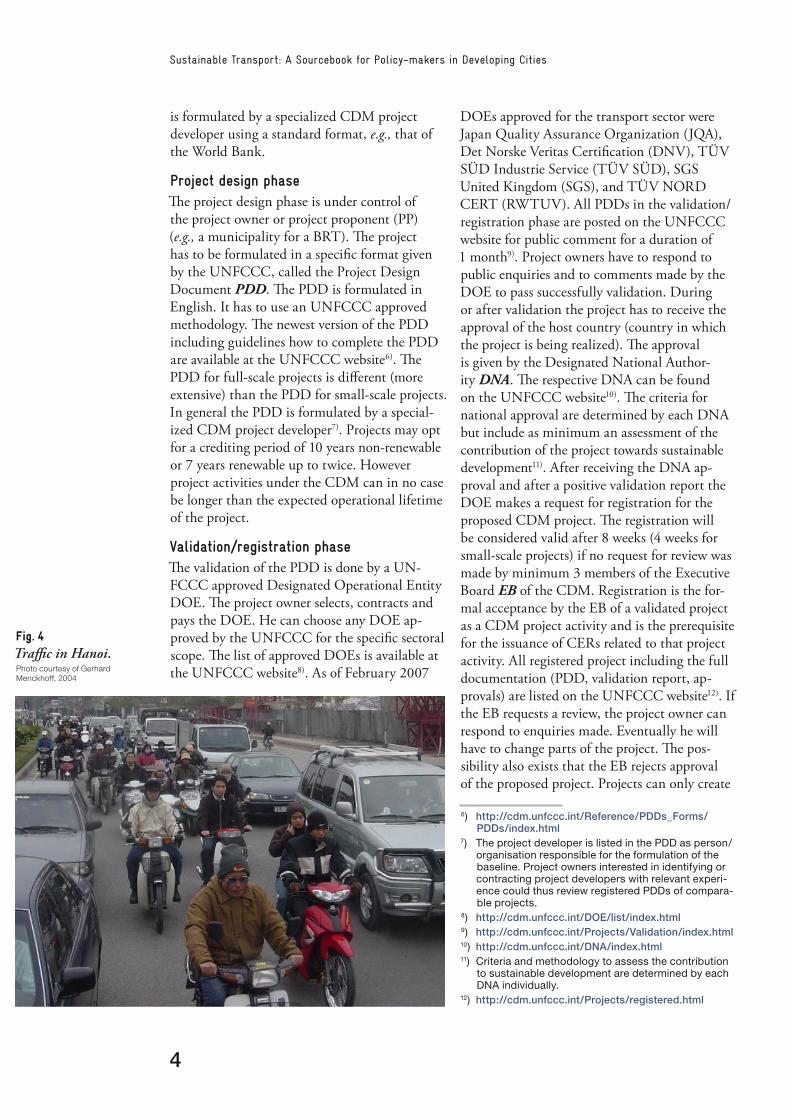
Fig. 4Traffic in Hanoi.Photo courtesy of Gerhard Menckhoff, 2004

5
Module 5d: The CDM in the Transport Sector
Certified Emission Reductions CERs after reg-istration. The window for claiming retroactively emission reductions was closed end 2006.
MonitoringAfter the project has been registered and is operating successfully, the project owner has to monitor the emission reductions achieved by the project. To this end, the specific monitoring pro-cedures—defined beforehand in the monitoring methodology that forms part of the PDD—have to be followed. The monitoring process estab-lished in the PDD specifies, among others, the parameters to be monitored, the monitoring method and the monitoring frequency. The monitoring period is determined by the project owner, e.g., 1 year. The emission reductions achieved during that period are summarized in a monitoring report and can then be verified, certified and sold (see below). CERs can only be sold at the end of each monitoring period and after successful completion of the verification/certification process. Therefore, the first revenues from the CDM will only be available some time after the project has started. A very large project may opt for a shorter monitoring period to receive CERs and thus payment from the buyer more quickly while a smaller project might opt for a longer monitoring period to reduce the (fixed) cost of verification of each report.
Verification and certificationThe monitoring report is verified by a DOE. In the case of small-scale projects the same DOE can be used as for project validation while for large-scale projects the DOE used for verification has to be distinct from the DOE used for validation. The list of UNFCCC approved DOEs for verification for each sectoral scope can be found at the UNFCCC website13). The monitoring reports are also published on the website of the UNFCCC for public comments14). The DOE verifies emission reductions of the registered project, certifies as appropriate and requests the EB to issue Certified Emission Reductions CERs accord-ingly. The issuance will be considered final 15 days after the request is made unless a request of review is made by minimum 3 members of the EB in which case explanations or changes may be required or eventually the claim for issuance of CERs may be rejected.
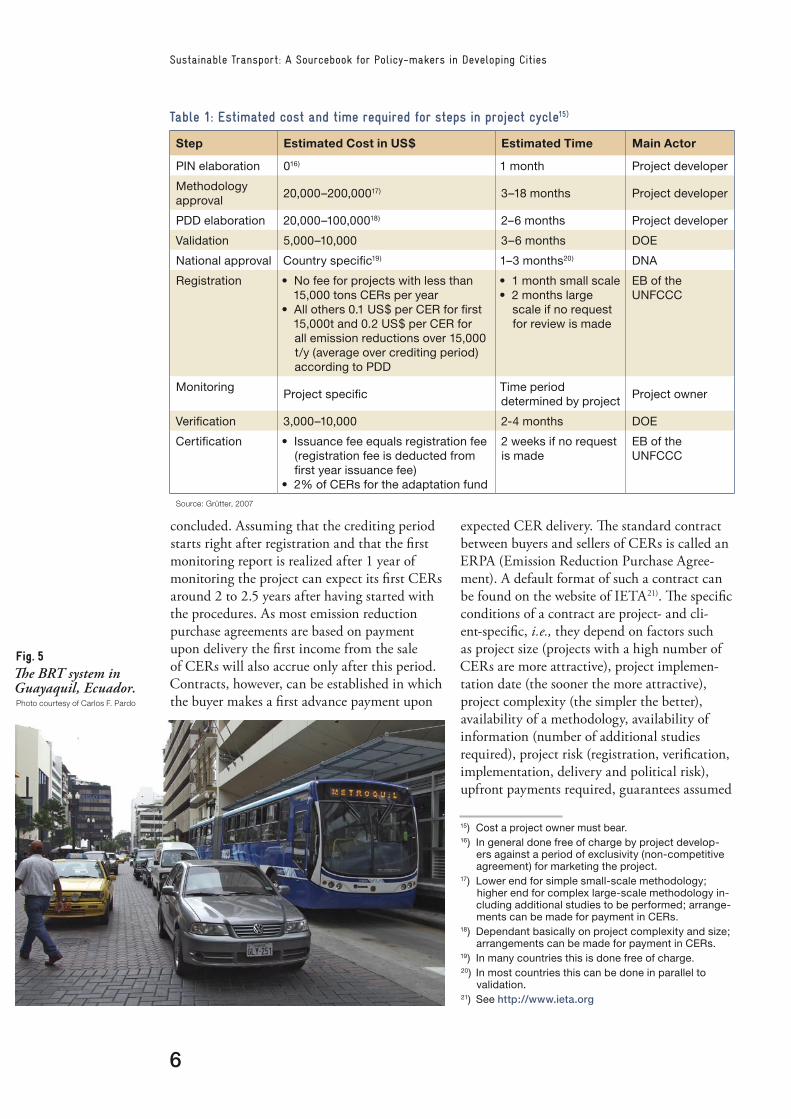
Cost and time involvedThe estimated costs and time needed for the various steps of the CDM project cycle are summarized in the table below. No standard arrangements exist between project owners and project developers. In general, project developers do not charge for realizing a PIN if receiving a period of exclusivity for project development and marketing. The majority of contracts established currently include no upfront disbursements of project owners i.e., the project developer often together with the buyer of CERs pays for the PDD development, validation, registration and first verification costs. These costs are then either subtracted from the payments of CERs or the project developer participates in the shares of CERs or shares of revenues. Project developers can thus burden part of the risk of the project (validation, registration as well as partially implementation risk). No standard time required for writing a PDD can be given as this depends basically on the project complexity, involvement of the project owner and the arrangement made with the project developer. Note: Cost and time required are estimates and may vary between projects considerably. Cost estimates refer to transport projects which tend to have a significantly higher complexity compared to average CDM projects in the field of energy or industry.Additional costs can arise from the sale of emission reductions (contract costs, brokerage fees). Contracts can be closed in which the project developer or the buyer of CERs covers all upfront costs with payment in CERs thus reducing the financial exposure of the project owner as well as his risk in case of non approval of the project.The total time from taking the decision to formulate a CDM project until successful registration is between 6 and 12 months for projects using an approved CDM methodol-ogy. A project’s CERs are available for sale only after the project’s crediting period has started, a monitoring report has been realized and verification as well as certification have been
13) http://cdm.unfccc.int/DOE/list/index.html14) http://cdm.unfccc.int/Issuance/MonitoringReports/
index.html
6
Sustainable Transport: A Sourcebook for Policy-makers in Developing Cities
concluded. Assuming that the crediting period starts right after registration and that the first monitoring report is realized after 1 year of monitoring the project can expect its first CERs around 2 to 2.5 years after having started with the procedures. As most emission reduction purchase agreements are based on payment upon delivery the first income from the sale of CERs will also accrue only after this period. Contracts, however, can be established in which the buyer makes a first advance payment upon
15) Cost a project owner must bear.16) In general done free of charge by project develop-
ers against a period of exclusivity (non-competitive agreement) for marketing the project.
17) Lower end for simple small-scale methodology; higher end for complex large-scale methodology in-cluding additional studies to be performed; arrange-ments can be made for payment in CERs.
18) Dependant basically on project complexity and size; arrangements can be made for payment in CERs.
19) In many countries this is done free of charge.20) In most countries this can be done in parallel to
validation.21) See http://www.ieta.org
Table 1: Estimated cost and time required for steps in project cycle15)
Step Estimated Cost in US$ Estimated Time Main Actor
PIN elaboration 016) 1 month Project developer
Methodology approval
20,000–200,00017) 3–18 months Project developer
PDD elaboration 20,000–100,00018) 2–6 months Project developer
Validation 5,000–10,000 3–6 months DOE
National approval Country specific19) 1–3 months20) DNA
Registration • No fee for projects with less than 15,000 tons CERs per year
• All others 0.1 US$ per CER for first 15,000t and 0.2 US$ per CER for all emission reductions over 15,000 t/y (average over crediting period) according to PDD
• 1 month small scale• 2 months large
scale if no request for review is made
EB of the UNFCCC
MonitoringProject specific
Time period determined by project
Project owner
Verification 3,000–10,000 2-4 months DOE
Certification • Issuance fee equals registration fee (registration fee is deducted from first year issuance fee)
• 2% of CERs for the adaptation fund
2 weeks if no request is made
EB of the UNFCCC
Source: Grütter, 2007
expected CER delivery. The standard contract between buyers and sellers of CERs is called an ERPA (Emission Reduction Purchase Agree-ment). A default format of such a contract can be found on the website of IETA21). The specific conditions of a contract are project- and cli-ent-specific, i.e., they depend on factors such as project size (projects with a high number of CERs are more attractive), project implemen-tation date (the sooner the more attractive), project complexity (the simpler the better), availability of a methodology, availability of information (number of additional studies required), project risk (registration, verification, implementation, delivery and political risk), upfront payments required, guarantees assumed
Fig. 5The BRT system in Guayaquil, Ecuador.Photo courtesy of Carlos F. Pardo

7
Module 5d: The CDM in the Transport Sector
by seller (delivery guarantees), involvement of the project developer (e.g., only PDD or also assistance in monitoring and verification), risk sharing agreements made etc. Contracts exist basically which specify a fixed price or which index the price to the EU ETS. Contracts for PDD elaboration given to project developers should include as minimum follow-ing components:n PDD completion according to the format of
the UNFCCC (in English only);n Accompany client in the validation process
and respond to all inquiries and changes re-quired;
n Accompany client in the national approval process and respond to all inquiries and changes required;
n Accompany client in the UNFCCC approval process and respond to all inquiries and changes required;
n Train project staff in monitoring.Payment should be conditioned at least partially upon successful CDM project registration or be established in percentage of CERs to ensure the required quality of work.
Development of a new methodologyIf the project does not fit under an existing ap-proved methodology, the process of project prepa-ration will be more complex, more expensive and more time-consuming. The process for establish-ing a new methodology is outlined in Figure 6.As presented, the whole sequence takes at least 8 months. However, immediate approval of a methodology is highly improbable. Normally a methodology receives technical clarifications,
Proposal of New Methodology
Initial review by member of Meth Panel
Public comments phase Expert review
Methodology Panel assessment
Executive Board
Approved methodology
rejected
Recommendation to EB:A: for approvalB: resubmission requiredC: rejection
rejected
Fig. 6CDM methodology
approval process (large-scale projects)22)..
Source: Jürg M. Grütter
22) For small-scale methodologies the procedures are simplified. Methodologies are not open for public comments and no external review is conducted. The small-scale panel directly assesses the proposed new small-scale methodology and gives comments. Also the format used for small-scale methodologies is simpler and much shorter than for large-scale methodologies.
23) The more complex the longer.
Table 2: Time involved to develop a new methodology
Step Estimated time Remark
Development of a new methodology
2-6 months23)
Methodology must be accompanied by a draft PDD of a concrete project; normally done by the project developer
Initial review < 1 month Done by a member of the Meth Panel
Public comment 1 month
Expert review 1 month2 experts are assigned by UNFCCC to review in detail the methodology; parallel to public comment
Meth Panel assessment 3-6 monthsTime required depends on pipeline of methodologies presented
EB approval 1 monthEB meetings are normally 2-4 weeks after Meth Panel meetings; EB only decides on “C” or “A” cases
thereafter a “B” and then it is assessed again by the Meth Panel (and can again receive technical clarifications before either receiving an “A” or a “C”). The Methodology Panel basically gives a feedback to the methodology proponent including which elements are non-acceptable or require changes. The Methodology Panel in general does not suggest a solution to the high-lighted problems.

8
Sustainable Transport: A Sourcebook for Policy-makers in Developing Cities
On average the time required for the whole process from methodology development to EB approval is in the range of 12–24 months. For example, the methodology for BRT systems (registered as approved methodology AM0031) was contracted by the CAF December 2004, was entered as methodology to the UNFCCC in May 2005 and was approved by the EB June 2006.Up to mid-March 2007 a total of 223 meth-odologies had been presented, of which 40 had been approved24). The approval rate is thus around 25%. 7 large-scale transport and 9 biofuel production methodologies had been presented of which 1 transport25) and 1 biofuel methodology26) was approved. Transport meth-odologies proposed and their status as of March 2007 is visible in Table 3. The success rate for transport methodologies has thus been significantly lower than the aver-age success rate for methodologies. The reason
for this low success rate basically lies in the methodological complexity of transport projects, especially concerning determination of baseline emissions, monitoring requirements and leakage effects. It is understandable that first method-ologies and projects were developed for simple projects or “low-hanging fruits” such as landfill projects, renewable energy generation, industrial energy efficiency or HFC and N2O abatement projects. In the future more proposals in the field of transport projects can be expected as the CDM market grows in maturity.
2.3 The GHG marketThe carbon market can be divided in three large segments:n The allowance-based market in which the
European Union Emissions Trading Scheme EU ETS is by far the most important;
n The project-based market for compliance with the Kyoto Protocol in which the CDM is the largest part;
n The voluntary market trading Voluntary Emission Reductions (VERs).
24) Various are still under consideration.25) AM0031 for BRT.26) Methodology for biofuel production based on waste
vegetable cooking oil, AM0047.27) Excludes biofuel methodologies.
Table 3: Transport CDM methodologies proposed27)
Number Name Scope Status
NM 052 Urban Mass Transportation System, Bogotá, Colombia
BRT Rejected (C)
NM 083 Auto LPG in India Fuel-switch Rejected (C)
NM 105 Methodology for BRT Projects BRT Approved (A) and published as AM0031
NM 128 Modal shifting in industry for transport of product/feedstocks
Mode shift road to ship Rejected (C)
NM 158 Mexico Insurgentes Avenue BRT Pilot Project
BRT and general infrastructure changes
Rejected (C)
NM 201 Cosipar Transport Modal Shift Project Mode shift road to ship Retired by project participants
NM 205 Improving the fuel efficiency of vehicle fleets
Vehicle fleet efficiency Not yet reviewed
Small-scale transport methodologies proposed
n.a. Behavior-oriented demand-side energy efficiency programmes in the transport sector
EcoDrive Rejected
n.a. Amendment to AMSIIIC Mode shift road to pipeline
Rejected
n.a. Introduction of low-emission vehicles to commercial fleets
Vehicle fleet efficiency Not yet reviewed
n.a. GHG efficient bus fleets Bus fleet efficiency Not yet reviewed
Status March 2007

9
Module 5d: The CDM in the Transport Sector
Regular market information is published by Point Carbon28) and by IETA29) (International Emissions Trading Association) in cooperation with the World Bank. Latter publish in regular intervals “State and Trends of the Carbon Market” free of charge. The website of IETA is also an excellent source for information on upcoming carbon events.
EU ETSThe EU ETS, in which EU emission allowances (EUA) are traded, was created by the European Union as a core element to meet its Kyoto com-mitments. It is currently by volume and value by far the largest carbon market. It has a first phase until end 2007 and a 2nd phase commensurate with the Kyoto Protocol between 2008 and 2012. Prices in the EU ETS, especially those of the 2nd phase, have a strong influence on prices paid in the project-based market. Price volatility in the EU ETS has been high as shows Figure 3. The figure also shows a certain downward trend of EUA prices paid since 2006 after having reached a peak of €32 per ton of CO2.Current trading prices for phase 1 contracts (2007) and more important phase 2 contracts
2008, 2009 until 2012 are listed e.g., in EEX (European Energy Exchange)30) or in the ECX (European Climate Exchange)31). CERs—gener-ated by CDM projects—can be exchanged into EUAs at a 1:1 ratio. EUA prices paid, however, will be higher than CER prices paid as the former are allowances without risk and can be used fully for compliance, while CERs can only be used partially for compliance purposes32). However the EU ETS serves as a reference price for CERs and contracts can also be established in which payment for CER is based on the price for EU ETS (with a discount of 20–40%).
Project-based marketThe CDM is by far the largest part in the project-based market, followed by Joint Imple-mentation (JI). In 2005 around 400 million
Fig. 7EU ETS price for contracts 2008 in € per tCO2.Source: EEX, April 2007
28) http://www.pointcarbon.com29) http://www.ieta.org30) http://www.eex.de31) http://www.europeanclimateexchange.com32) Companies and governments can only use CERs to
a certain extent, e.g., up to 20% of their emission reduction targets. The remaining reductions have to be achieved domestically. CERs are thus not completely fungible reducing their value relative to EU-ETS credits.
10
Sustainable Transport: A Sourcebook for Policy-makers in Developing Cities
offer the seller a choice either between fixed forward or indexed forward contracts or mix-tures between the two options.
Voluntary marketOutside the regulated CDM market a signifi-cant voluntary market exist e.g., in the US or due to the demand of companies which wish to neutralize part of their emissions on a voluntary basis. While certain standards exist in the voluntary market it is far less regulated than the CDM market. This has the advantage of sim-plicity and thus lower transaction costs and of direct agreements between the buyer and seller. The voluntary market also allows for GHG projects which would not qualify for the CDM e.g., due to methodological or additionality problems. The downturn is that due to lack of regulation the integrity or quality of Voluntary Emission Reductions (VERs) also varies greatly. This in turn leads to a large price variation and significantly lower prices being paid for VERs than for CERs. Prices at the high end for VERs tend to ask for conditions comparable to CERs thus provoking also comparable transaction costs. The price range paid for VERs in 2006 was between US$4 and 10 per ton of VER.
tons of CERs were contracted for future delivery at an average price of US$8 per ton (source: Pointcarbon, 2006). Prices of 2006 were on average around US$10 per ton (source: World Bank) with a slight decline (around 10%) comparing the second and third quarter with the first quarter. Buyers are basically purchasing funds, private entities and to a minor degree governments. Prices vary greatly from contract to contract, mainly based on the distribution of risk between buyer and seller. Risks include re-jection of the new methodology (if a new meth-odology is required), non-approval of registra-tion, implementation risk (failure, delay or only partial implementation) and non-approval of CER issuance. Also GHG reductions might be significantly less than expected due to difficult ex-ante estimations (e.g., in a public transport project number of passengers to be transported or potential mode-switch). Especially the imple-mentation risk can be considerable in transport projects. Contracts are basically for payment upon delivery of CERs to the buyers account. A small number of contracts offer a limited advance payment. However, many contracts include payment of upfront transaction cost by the buyer or the project developer. Most buyers
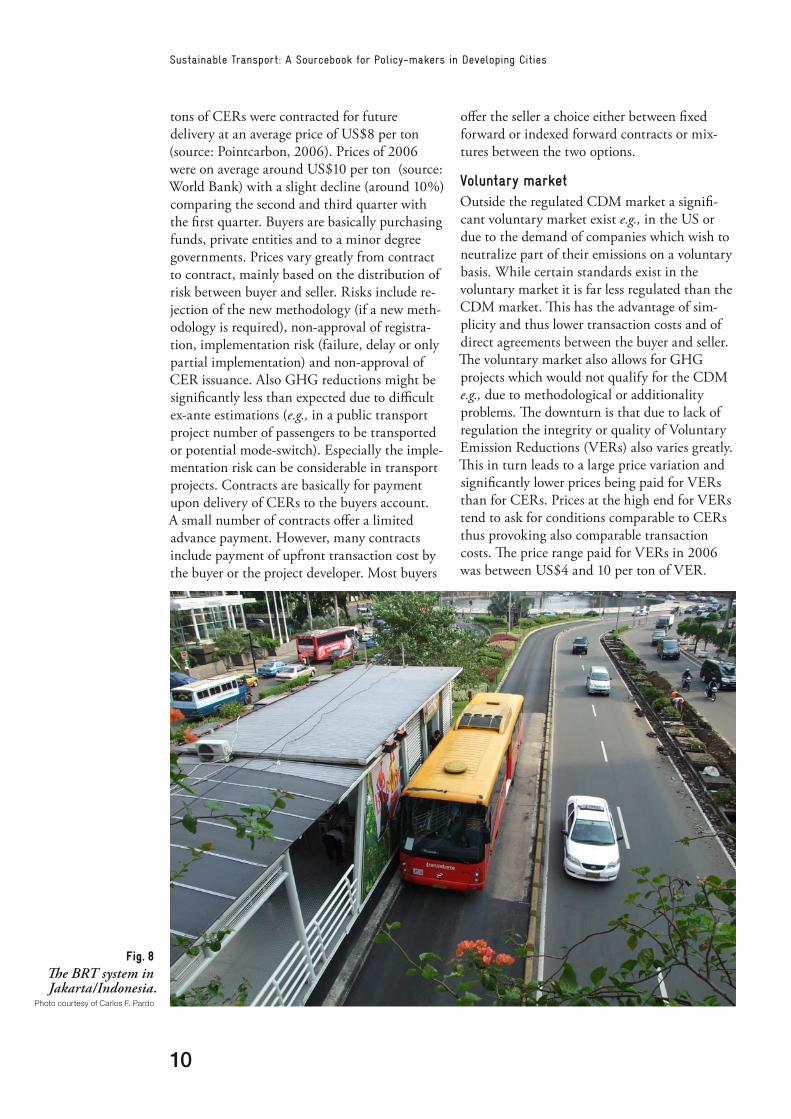
Fig. 8The BRT system in Jakarta/Indonesia.
Photo courtesy of Carlos F. Pardo

11
Module 5d: The CDM in the Transport Sector
Behavioural change including improved fleet management Projects in this area could include e.g., improved maintenance practice of fleets, usage of low emission tyres and oils or driver training to reduce emissions per distance driven. A wide range of behavioural change projects exist potentially. A methodology for driver training had been proposed but was rejected by the EB basically due to methodological deficiencies in its formulation. Stand-alone projects using individual components of improved fleet man-agement tend to be small thus reducing their attractiveness as a CDM project.
Fuel-switchGHG emissions per distance driven can be reduced by switching from high to low carbon fuels. Currently this includes a switch from liq-uid to gaseous fuels (CNG or LPG), the usage of biofuels or the usage of electric energy. The latter is combined with a technology change e.g., using trolleybuses instead of diesel buses. In many countries CNG and to a decreasing part LPG is used for transport. The GHG reduction po-tential is limited (10-20% compared to diesel or gasoline powered units) thus limiting the size of a potential stand-alone fuel-switch CDM project. For CNG/LPG as well as biofuel projects not only consumers could claim CERs but also producers or distributors of low carbon fuels (e.g., in the case of gaseous fuel in combination with companies offering vehicle conversion). Making a CDM biofuel project from the production site is much simpler and leads to larger projects.
Actual projects may also combine these three possibilities.
3.1 Projects reducing emissions per kilometre
Projects in the transport sector reduce emis-sions per kilometre driven either by increased efficiency (new technology or improved fleet management), by infrastructure improvements or by switching to low carbon fuels.
Technology/vehicle changeThis includes faster than “business as usual” vehicle replacement or acquiring low-emission vehicles e.g., hybrids. A normal fleet replace-ment33) could not be considered as a CDM project as this would also occur in absence of the CDM. There exists a small-scale method-ology that could be used for projects which acquire vehicles with low GHG emissions e.g., hybrids or electric units. However, no CDM project has been forwarded in this area to the moment. The cost of changing large fleets to low-emission vehicles is high and can only be covered to a small extent by CDM revenues thus making such projects economically unfea-sible without significant other funding sources. Technology change may be a component of a larger project, e.g., a BRT project including new vehicles, or a project realizing various measures to reduce total fleet emissions including, e.g., a partial change to low emission vehicles.
33) Normal refers to “business as usual”, e.g., buses, in absence of the CDM, are renewed every 10 years by a specific company.
Reduce emissions per kilometre
Reduce emissions per unit transported
Reduce distances or number of trips
3. CDM transport projects
Three ways exist to reduce GHG emissions in transport:
Fig. 9Informal transport can
be very unattractive.Photo by Sascha Thielmann, 2007

12
Sustainable Transport: A Sourcebook for Policy-makers in Developing Cities
BOX 2: Types of biofuelsA distinction of biofuels related to the GHG effect can be made between:
n Biofuels from waste vegetable cooking oils. As these oils were already used for other pur-poses no additional upstream emissions result thus making them attractive from a GHG per-spective. The available offer of used vegetable cooking oil is limited, its collection can be costly, processing can be challenging and in general alternative usage for energy purposes (e.g., foundries) is already in place thus limiting the CDM potential for this kind of biofuel for transport purposes. A CDM methodology for waste vegetable cooking oil has been approved by the EB of the UNFCCC February 2007.
n Biofuels from “energy” crops to produce biofuel which can be blended with gasoline or diesel. Various CDM methodologies have been presented for claiming CERs from producing
biofuels including ethanol production, biofuel from palm-oil, soya as well as other crops. None of these methodologies has been approved to the moment basically due to problems concern-ing possible double-counting of emission reduc-tions, assurance of non-export of biofuels and upstream emissions associated with biofuels (see Box on “GHG Emissions of Biofuels”).
n Biogas. The usage of biogas in transport is not yet wide-spread. However, it is technically of no problem to reach normal gas quality and use the biogas e.g., in vehicles. Migros, a large Swiss retailer has, for example, a fleet of distribution trucks using biogas produced from biomass waste collected from its super-markets and restaurants. No methodology on usage of biogas for transport purposes has yet been proposed, although this would not be of a major difficulty. Biogas could be produced e.g., from waste biomass, from landfills or from waste-water treatment facilities.
BOX 3: GHG emissions of biofuelsBiofuels are by no means neutral in their GHG emissions. The plant takes up CO2 during its growth which is again released when burning the biofuel, e.g., in a vehicle. CO2 plant uptake and fuel burning neutralize each other. However, the process of planting, harvesting, transport and transformation leads to GHG emissions in
the life-cycle of producing biofuels. These need to be compared with the life-cycle emissions of conventional fuels to establish the GHG reduction due to usage of biofuels (well-to-wheel analysis). GHG life-cycle emissions of biofuels are crop, lo-cation and case specific. CDM methodologies for biofuels thus need to take into account localized life-cycle emissions.
Figure 10: Biofuel GHG Emissions
Emissions related to crop production include:n Emissions due to energy usage in crop cultiva-
tion and harvesting;n Emissions due to fertilizer usage (N2O) includ-
ing potentially upstream emissions associated with chemical fertilizer production;
n Emissions related to land-use change leading to changes in carbon stocks in carbon pools (e.g., energy crops are planted on areas for-merly covered by forests). This is one of the unresolved methodological issues.
Transport emissions include those associated with the transport of the agricultural input to the biofuel refinery and the transport of the (blended) biofuel to the gas-station.
Biofuel production related emissions include:n Energy used for the refinery of the biofuel (elec-
tricity and fossil fuel);n Methane emissions resulting from waste-water
treatment facilities of the refinery;n Upstream emissions resulting from the usage
of methanol.

13
Module 5d: The CDM in the Transport Sector
However the Executive Board has insisted to the moment that the project boundary and monitor-ing of a production based biofuel project needs to include final consumers basically to prevent problems of double-counting and potential problems of biofuel exports to Annex I countries. Fuel-switch could be a component of more integral projects e.g., efficient fleet management or in mass public transport projects using alter-native fuels and capturing the GHG reduction and corresponding CERs from this component along with other reductions.
Infrastructure projectsInfrastructure projects potentially include a wide array of different projects such as bridges, fly-overs, intelligent traffic signals, toll-roads, improved road maintenance etc. While some infrastructure changes lead to reduced trip lengths (e.g., tunnels or traffic guidance systems), most potentially lead to reduced emissions per
kilometre due basically to less congestion and thus a higher and more constant average vehicle speed. One CDM methodology proposed potentially included infrastructure projects. However, the proposal was rejected basically due to problems of separating the project-induced effect from other changes occurring simultane-ously, monitoring deficiencies and problems with the project boundary leading to a possible underestimation of negative leakage effects caused e.g., by induced traffic and downstream congestion. The methodological complexity of such projects is high especially due to having to prove that emission reductions are due to the project and not to other changes outside the project influence (force majeur). In addition the estimation and monitoring of the rebound effect including induced traffic caused, for example, by less congestion tends to be difficult and costly.
3.2 Projects reducing emissions per unit transported
GHG reduction projects in this area can be real-ized in freight or passenger transport.
3.2.1 Passenger transportBasically emissions per passenger trip can be reduced through:n Mode switch;n Usage of larger units;n Improved occupation rates.Mode switch leads to less GHG emissions if a switch occurs from a mode of transport with high emissions per transported passenger to one of low emissions. Typical examples include re-duced usage of private cars and increased usage of public transport or projects favouring bikes.Larger units (maintaining a comparable occu-pation rate) in public transport lead to reduced emissions per passenger transported. Examples are e.g., changing to a public transport system using large buses (e.g., articulated buses for 160 passengers) instead of microbuses34). Large buses use more fuel per kilometre but by far not proportional to their carrying capacity thus
34) Of course the unit size must be matched to the respective demand. In many cities, especially of Latin America, the privatization and deregulation of public transport has provoked the usage of small units com-peting for passengers.
BOX 4: GHG efficient fleetsVarious measures to reduce GHG emissions per kilometre driven could be taken simultane-ously by fleet operators (buses, trucks, taxis). Measures could include the usage of (blended) biofuels, advanced fleet replacement, improved maintenance of units, training of drivers, usage of devices to reduce fuel consumption such as water injection etc. Currently a CDM small scale methodology to capture these effects under the heading of “GHG efficient bus fleets” developed by grütter consulting on behalf of the World Bank is under discussion at the UNFCCC. The project for which this methodology will be ap-plied are two large bus fleets of a municipality in India, with expected emission reductions in the order of 30,000–40,000 tons of CO2 an-nually. The methodology, which is expected to be approved in the first semester of 2007 could be used by large fleet operators using buses which want to modernize their fleet and which are willing to take steps to reduce GHG emissions beyond business as usual (BAU is basically determined by the methodology as a 1% improvement per year of GHG emissions occurring also in absence of the project due e.g., to normal vehicle replacement). A similar approach could also be used for large taxi or truck fleets.

14
Sustainable Transport: A Sourcebook for Policy-makers in Developing Cities
resulting in a significant reduction of emissions per passenger-kilometre.Improved occupation rates of units also lead to reduced emissions. Possible projects in this field include car-pooling projects or organizational improvements in managing public transport optimizing the load factor of buses.
Public transport projects Numerous cities worldwide are modernizing their urban public transport systems. The most prominent measures taken include the establish-ment of Bus Rapid Transit Systems (BRTs) and investment in rail-based systems such as Light Duty Rail or metro lines. The GHG reductions achieved by such investments can be captured through the CDM thus making these invest-ments economically more viable and reducing barriers towards their implementation. BRT Projects: There is no precise definition of what constitutes a BRT system. Features of BRT systems include exclusive right-of-way lanes, rapid boarding and alighting, free transfers between lines, pre-board fare collection and fare verification, enclosed stations, clear route maps, real-time information displays, automatic vehi-cle location technology to manage vehicle move-ments, modal integration at stations, effective reform of the existing institutional structures for public transit, clean vehicle technologies and excellence in marketing and customer service. There exists an approved CDM methodology
for BRTs (AM0031) and also a registered CDM BRT project (TransMilenio Bogotá). Further CDM BRT projects are under development including Pereira and Cali in Colombia and Quito, Ecuador with expected registration in 2007. BRTs are being implemented in many cit-ies worldwide and the potential for this type of CDM project is considered as very large due to the fact of many projects and of relatively large emission reductions per project. The Bus Rapid Transit methodology developed by grütter con-sulting and approved by the UNFCCC includes among others mode-switch, usage of larger units as well as improved occupation rates as measures to reduce GHG emissions. Combining various measures in one project reduces transaction costs and makes monitoring simpler35).Rail based public transport: Projects in this area include metro, LDR (Light Duty Rail), trams or cableways such as the cableway es-tablished in Medellín, Colombia to transport people to a metro-station. Compared to a conventional public transport system based on buses rail projects have significant GHG reductions. However, the actual magnitude of GHG reductions depends considerably on the efficient management of operations (occupation rate of units basically), technology used and the carbon factor of electricity of the respective country. If electricity is produced mainly by coal, electric based transport systems will have fewer advantages than in countries where elec-tricity production is largely based on renewables. No methodology has yet been approved for rail based public transport. However a new method-ology is under preparation and approval can be expected for the year 2007.
3.2.2 Freight transportIn freight transport similar to passenger trans-port emission reductions per unit transported can be achieved either by mode-switch, usage of larger units or improved load factors. In practice, however, projects will be basically about mode-switch e.g., from road to rail or road to ship as monitoring of improved load factors is extremely complex and difficult to separate from ”business as usual”. Three CDM methodologies have been proposed in this area
35) All effects are cumulatively monitored.
Fig. 11The minibus system in Dar es Salaam.PhPhoto by GTZ, 2005
15
Module 5d: The CDM in the Transport Sector
to the moment but none has been approved. One of the major difficulties is that additional trips on the low-emission mode need to be proved. If company “A” decides to move its goods by train instead of truck but total rail-road capacity remains constant then the overall GHG balance does not change. The freight of company “A” will simply replace the freight of company “B” which formerly used train but was then “crowded out” by company “A”. Projects for mode-switch in the freight area would thus have more success if they were formulated from the supply-side i.e., owners of ports, ships, or railroad companies which increase the supply of low GHG modes of freight transport e.g., a new railway is constructed for freight purposes.
3.3 Projects reducing tripsProjects in this area are basically through behav-ioural change inducing, for example, people to reduce usage of their cars or projects in the area of spatial planning reducing trip distances, e.g., from home to work. The methodological com-plexity of such projects is very high, especially in the field of separating the project effects from other effects (to avoid giving CERs for force majeur). The determination of leakage36) and of an acceptable baseline is also a challenge.
4. Core elements of a CDM transport methodology
Any CDM project proposed to the UNFCCC needs to use an approved methodology and be written in the format prescribed by the UNFCCC. This chapter gives an overview of the core parts of the PDD (Project Design Document). To illustrate the specific require-ments strong reference is made to one particular case, i.e., the approved BRT methodology AM0031 “Methodology for BRT Projects”37). As of March 2007 it is the only approved CDM transport methodology for large-scale projects. The methodology has been used successfully by TransMilenio, Bogotá (see following chapter). The methodology can de downloaded from the UNFCCC website38).
4.1 Applicability conditionsThe applicability conditions describe elements with which the project needs to comply if it wants to use this methodology.The core applicability conditions of AM0031 are:n The BRT system as well as the baseline pub-
lic transport system are road-based, i.e., the methodology is not applicable in cities with a rail-based system. The complete trip has to be performed in the baseline as well as in the project case by road-based transport.
n The BRT system replaces a traditional public transport system in a given city, partially or fully. The BRT system can have partial cover-age in the city, however, in that case in the part of the city where the BRT is established it must be possible to complete entire trips on the BRT, i.e., the BRT must include feeder and main routes. If the BRT consists of a stand-alone trunk route and conventional buses not integrated into the BRT system provide for passengers then the methodol-ogy is not applicable as only a part of the trip would be realized in the project.
36) See Box on Key Issues CDM for a short definition of leakage.
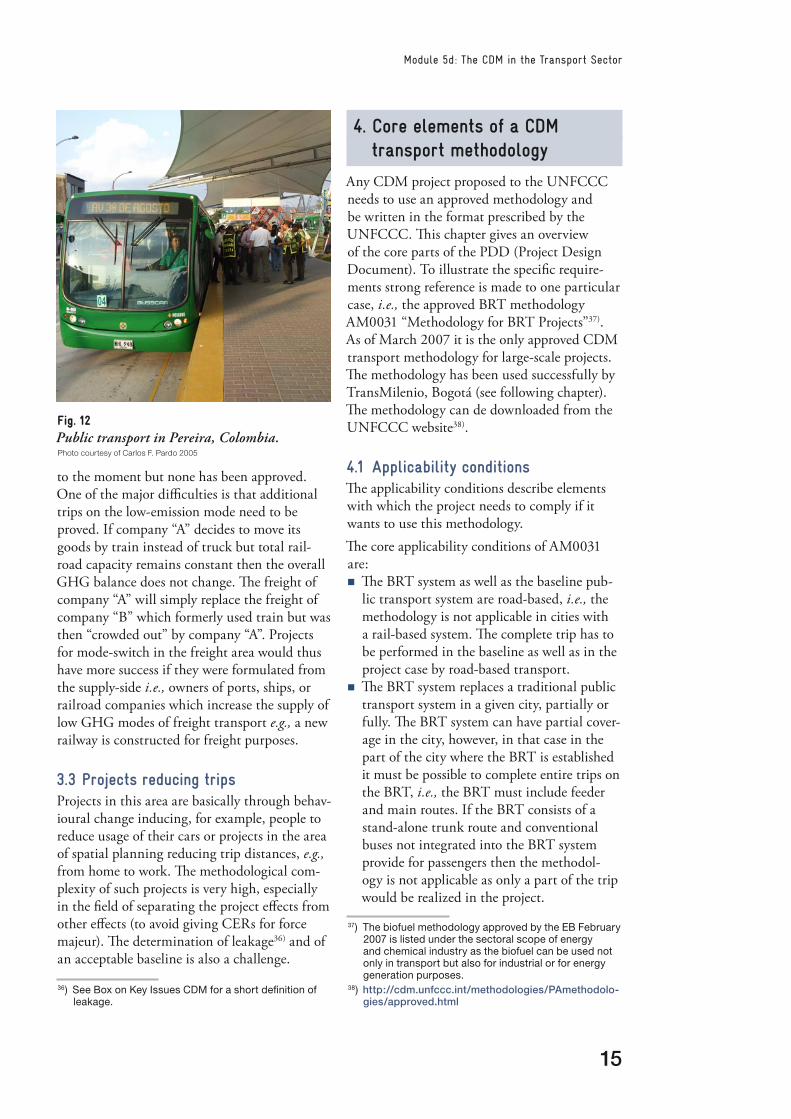
Fig. 12Public transport in Pereira, Colombia.Photo courtesy of Carlos F. Pardo 2005
37) The biofuel methodology approved by the EB February 2007 is listed under the sectoral scope of energy and chemical industry as the biofuel can be used not only in transport but also for industrial or for energy generation purposes.
38) http://cdm.unfccc.int/methodologies/PAmethodolo-gies/approved.html

16
Sustainable Transport: A Sourcebook for Policy-makers in Developing Cities
n The methodology is only applicable if no biofuels are used in the baseline as well as in the project case. This applicability condition might be reverted once biofuel methodologies get approved. The latter is required to deter-mine the emission factor of biofuels.
4.2 ApproachThe approach used to determine emission reductions in AM0031 is based upon compar-ing emissions per passenger trip in the project with those in absence of the project (baseline case). This means that total emissions per pas-senger trip need to be included in both cases. If passengers use in their trip, for example, three different buses then the methodology sums the emission of the three buses and counts this as one trip. This is the reason why the BRT system needs to encompass the total passenger trip and thus needs to be an integrated system with feeder units. The emissions per trip per passenger for each mode of transport for the baseline are determined ex-ante while emissions per passenger trip of the project are monitored. Emission reductions are the difference between The “emissions per trip” baseline versus project multiplied with the amount of passengers trans-ported by the project.
4.3 Project ownerThe project owner receives the CERs. It must be clarified ex-ante who is the owner of the emis-sion reductions (e.g., municipalities). Essentially
the project owner is the entity that induces the changes leading to emission reductions. How-ever, the project owner is not always apparent at first glance. In a BRT system e.g., following parties are basically involved:n Central government (in the case of Colombia
financing e.g., the infrastructure cost with up to 70%);
n The municipality which owns the system (in the case of Colombia it finances the infra-structure at minimum with 30%);
n System manager which in general is the local government (in the case of Bogotá Trans-Milenio is the system manager; TransMilenio is fully owned by the municipality);
n Financial institutions which provide loans to the municipality or the bus operators;
n Bus operators who invest in new buses and provide bus services (mostly contracted through public bidding processes);
n Clients who use the new system (e.g., instead of using their car).
The project propronent and thus receptor of CERs is the municipality who makes the final decision on implementing such a system and who puts up and owns the infrastructure. The national government as well as involved finan-cial intermediaries finance potentially part of the system or give loans – they are, however, not the bodies who take the decision, nor do they actually own the infrastructure. Bus operators, who often claim that emission reductions are due to their investment in new buses, oper-ate services based on licenses. They are thus simply providing a service and comply with the regulations for which they have obtained a licence. They are also paid for this service or obtain a share of revenues. Bus operators could claim credits if they go beyond providing the required service, e.g., by using hybrid buses although only diesel buses are asked for or by using biofuels although only conventional fuels are required. The additional emission reductions from these “additional” investments or changes could be demanded by bus operators.
Outside project boundary
Project boundary
Emissions caused by remaining
transport system (taxis, cars,
conventional public transport)
Emissions caused by freight, ship rail, and air transport
Upstream emissions included as leakage■ Construction emissions
caused by the project;■ Reduced life-span of buses
due to scrappage.
Direct project and baseline emissionsEmissions caused by passengers transported in the BRT project
Downstream emissions included as leakageCongestion change provoked by project resulting in (inter alia):
■ Increased vehicle speed;
n Rebound effect.
Other emissions included as leakageChange of baseline factors monitored during project and included as leakage:
n Change of load factors of taxis provoked indi-rectly by project;
■ Change of load factor of remain-ing conventional buses provoked indirectly by project.
Fig. 13Project boundary

17
Module 5d: The CDM in the Transport Sector
4.4 AdditionalityThe concept of additionality as used in the CDM is that the project must prove that the emission reductions are additional to any that would occur in the absence of the certified project activity (Kyoto Protocol, Art. 12, 5c). A stricter interpretation used (not always) by the CDM Executive Board is that the project must show that it would not have occurred in absence of the CDM, i.e., not only the emission reduc-tions are additional but the project itself. The proof of additionality is basically made by using the additionality tool provided for by the EB. This tool basically includes the following steps:1. Identification of all possible alternatives to
the project activity, including the project it-self without CDM;
2. Investment analysis to proof that the project is not the most financially attractive option and/or barrier analysis;
3. Common practice analysis to show that the project activity without CDM is not com-mon practice in comparable circumstances;
4. Impact of registration of the proposed project activity as a CDM project, i.e., it must be shown that due to the CDM the project over-comes the barriers identified and/or is finan-cially more attractive due to the CDM.
In the case of AM0031 possible alternatives to a BRT include a continuation of the current trans-port system, the establishment of a rail-based system, a re-organization of the current transport system or a BRT without CDM. The instrument used to proof additionality is based on barriers identified including investment barrier (lack of finance, other politically more interesting invest-ment opportunities, high investment level), po-litical resistance, resistance from the conventional transport sector, lack of experience with BRTs etc.
4.5 BaselineThe baseline for a CDM project activity is the scenario that reasonably represents the GHG emissions that would occur in the absence of the proposed project activity. Again possible alterna-tives to the project need to be identified and the most probable in absence of the project activity needs to be identified. One of the options which need to be assessed also is the project in absence of the CDM, i.e., the project itself could be
the baseline or the most probable scenario. If this is the case there are no additional emission reductions and thus there is no CDM project. The baseline is not simply the current or past situation. It is the situation we expect to have under business as usual circumstances in the future. In would be wrong to assume, for exam-ple, that the baseline would be simply current or past transport emissions as vehicles would be replaced also in absence of the project activity. The methodology determines how the baseline is identified. For the identified baseline thereafter baseline emissions need to be calculated39).
AM0031 identifies steps to determine the baseline. AM0031 is applicable if the baseline identified is a continuation of the current trans-port system. Baseline emissions are thereafter calculated using the following two main steps:1. Determine emissions per passenger trans-
ported per vehicle category. This emission fac-tor is calculated ex-ante project implementa-tion including the usage of a fixed technology change factor. The baseline emission factor is adapted to potential changes in trip distance and type of fuel used by passenger cars if the surveys indicate that changes in trip distance or fuel type used would lead to lower baseline emission factors. An example: The emissions per passenger-trip of a passenger car in Bo-gotá are for the year 2005 1,801 grammes of
39) Key factors and criteria including maximum age of data are defined in the methodology.
Fig. 14Fossil fuels used in the transport sector are a
major source of carbon dioxide emissions.
Photo courtesy of ConocoPhilips

18
Sustainable Transport: A Sourcebook for Policy-makers in Developing Cities
CO2 per passenger. The calculation is based on a fuel consumption of 11.7 l/100 km gasoline, an emission factor of 2,338 g CO2/l of gasoline, an occupation rate of 1.37 pas-sengers per car and an average distance driven of 9 km per trip. For the year 2006 the same factor is 1,783 g CO2 per passenger40).
2. Based on the passengers transported by the project and their modal split the total base-line emissions of the project are calculated ex-post. Core baseline parameters used for calculating the baseline emission factors are reviewed through an annual survey with changes only being applied if the baseline emissions factors would be lower than the original factor to ensure a conservative ap-proach. Passenger numbers are recorded by the system operator. An example: Trans-Milenio has emissions per passengers 2005 of 381 g CO2 per passenger. Based on the survey it can be calculated that TransMilenio
has transported in this year around 5 million passengers which in absence of TransMilenio would have used passenger cars. The emis-sion reductions for this part of mode-shift are thus 5*(2,338-381) = 9,785 tons of CO2.
For an example of an actual calculation please refer to the published PDD or TransMilenio (available on the website of the UNFCCC).
4.6 Project emissionsProject emissions are those that result due to the project activity, i.e., from the operation of the planned BRT system. In the case of AM0031 project emissions are based on the fuel and fuel type consumed by the project (feeder and trunk lane units).
4.7 LeakageLeakage is defined by the UNFCCC as the net change of GHG emissions, which occurs out-side the project boundary, and which is meas-urable and attributable to the CDM project activity. Leakage is an important issue in transport projects, e.g., additional infrastructure investments may cause reduced congestion and thus increased average vehicle speeds leading (at least in urban driving conditions) to reduced emissions while at the same time provoking additional trips (rebound effect) and a shift to private vehicles due to reduced trip time.The leakages incorporated in AM0031 are:n Upstream construction emissions based
on cement and asphalt used for trunk road construction. Especially the production of cement is energy and thus CO2 intensive. The corresponding emissions are attributed to the project as leakage.
n Emissions due to scrapping vehicles which would otherwise have continued to operate. The production of buses also requires energy. Reducing the normal life-span of vehicles thus leads to additional emissions (e.g., in-stead of 1 bus circulating for 20 years 2 buses are assembled for the same time period).
n Upstream emission reductions due to reduced fuel usage of the project versus the baseline. Fuel saved does not need to be refined nor
40) Due to the annual default improvement factor of 1% fixed in the methodology.
������������������������������
������������������������������
������������������������
������������������������������
������������������������������
�������������������������������
����������������������������������������������
����������������
���������������������
�������������������������
Fig. 15Path to determine baseline emissions of AM0031.

19
Module 5d: The CDM in the Transport Sector
transported. The saved well-to-tank emissions are thus attributed as negative leakage to the project (i.e., the project results in additional emission reductions beyond those captured directly).
n Leakage due to changes in the occupation rate of remaining conventional buses and taxis in the city. The BRT system might pro-voke that buses still remaining on the road loose passengers and continue operating thus leading to increased emissions per passenger transported.
n Leakage due to reduced congestion (due to a reduced number of buses basically) leading to reduced emissions due to increased vehicle speed and leakage due to the rebound effect (these two effects are in contrarian direction).
4.8 Emission reductionsEmission reductions equal baseline minus project minus leakage emissions.
4.9 Sustainable development impactThe project must show its impact on sustainable development. This includes the social and the local as well as the transboundary environmen-tal impact. Additional requirements concerning sustainable development might be asked for by the national authorities. Another important prerequisite is that all required environmental permits and studies are provided.The social impact of transport projects include more or less jobs created, less accidents, an im-proved livelihood, less time lost due to reduced congestion, improved health and less respira-tory diseases due to improved air quality. The environmental impact of transport projects next to the global impact include less local pollutants such as particle matter, NOX and other precur-sors of ozone, and SO2.
4.10 Stakeholder involvementThe project must also prove that the stakeholders who are affected by the project have been in-cluded, i.e., it must be demonstrated how their opinions or criticism was taken into account. Stakeholders of a public urban transport project include, for example, the affected transport sector, people living in the proximities of construction areas as well as the users of public
transport. In general, stakeholder assess-ments form part of an Environmental Impact Study required for most projects of this size and are thus not an additional burden for a CDM project. During the process of project validation the PDD is open for comments and posted on the website of the UNFCCC. The project owner must respond adequately to comments made during this 1 month consultation process.
4.11 MonitoringThe methodology describes what parameters, in what frequency and with what types of measurements need to be monitored. The PDD describes this thereafter in detail for the specific project. The PDD also needs to include a description of the organization and responsibilities for monitoring as well as quality assurance methods to be used. In the case of AM0031 the basic monitoring to be realized is fuel consumption of project buses, distance driven, passengers transported and a regular survey to determine which mode of transport (traditional buses, passenger cars, taxis, motorcycles, NMT or would not have made the trip) passengers would have used in absence of the project. The survey is based on a questionnaire fillid in by users of the project based on a representative sample. The core characteristics of the survey are included in the methodology. Additionally some parameters concerning leakage need to be monitored such as the exact number of buses actually scrapped or changes in the load factor of taxis and remaining buses realized through visual occupa-tion studies every 3 years. Again, the methodol-ogy describes the core elements of studies to be realize while the PDD contains all details.
Fig. 16Fossil based power
(lignite power station) side-by-side with agro-
power (rapeseed).Photo courtesy of Klaus Neumann,
Mehrum/Germany, 2007

20
Sustainable Transport: A Sourcebook for Policy-makers in Developing Cities
5. Case study: The TransMilenio CDM project
5.1 TransMilenioTransMilenio41) started operation with the first trunk routes end of the year 2000 in Bogotá, Colombia. Bogotá is the capital of Colombia and has as metropolitan area around 8 mil-lion inhabitants. It is situated at an altitude of around 2,600 msl. TransMilenio serves worldwide as example for a modern and efficient public transport system. TransMilenio is a public-private partnership, in which the public sector is responsible for the investment to deploy the required infrastructure (segregated lanes, stations, terminals, etc.), while the private sector is responsible for the investment of the bus fleet, the ticket selling and validating system, and for the operation of the trunk and feeder services.Features of the BRT system of TransMilenio include exclusive right-of-way lanes, rapid boarding and alighting, free transfers between lines, pre-board fare collection and fare verifica-tion, enclosed stations, clear route maps, real-time information displays, automatic vehicle location technology to manage vehicle move-ments, modal integration at stations, effective reform of the existing institutional structures for public transit, clean vehicle technologies and excellence in marketing and customer service. The BRT system of TransMilenio is considered
as a model-case for a modern mass urban transit system and is being replicated by various cities world-wide. TransMilenio replaces a chaotic system of many small independent enterprises competing at bus-to-bus level for passengers with a consolidated structure with formal enter-prises competing for concessions.The technology deployed has 4 main compo-nents: infrastructure, buses, transit manage-ment, and fare system.
InfrastructureTransMilenio will establish till 2015 around 350 km of dedicated bus lanes including new bus-sta-tions and integration stations located at the end of dedicated bus lanes to ensure a smooth transfer to feeder lines (140 km of the above mentioned 350 km correspond to trunk lanes of phase I not part of the CDM project). Each station has a modular design with obstacle-free waiting areas and elevated level-access to articulated buses with a high platform. Stations have access ramps for mobility-impaired passengers and selected stations have bicycle parking and storage facili-ties. As of end 2006 250 km of trunk lanes were already built and under operation.
Bus technologyBus technology used are to a minor extent Euro II buses (compulsory since model-year 2001) and to a majority Euro III units. Buses operat-ing on dedicated lanes are new articulated buses
41) http://www.transmilenio.gov.co
Fig. 17TransMilenio in the center of Bogotá.Photo by Jürg M. Grütter
Fig. 18Traditional bus transport in Bogotá.Photo by Jürg M. Grütter

21
Module 5d: The CDM in the Transport Sector
with a capacity of 160 persons with platform-level access including room for disabled persons. Feeder buses are new buses with a capacity of 70–90 passengers. As of end 2006 Trans-Milenio included around 850 articulated buses and 350 large feeder buses.
Transit managementThe operational fleet centre manages bus dispatch, informs passengers, produces reports and maintains records. All buses are equipped with a Global Positioning System (GPS) linked to the operation centre. The novelty of the operational fleet centre is that an efficient management of bus fleets can take place optimizing load factors through coordinated scheduling of service. The transit system oper-ates on concessions eliminating competition at bus-to-bus level. Also passengers have real-time information about the next available bus and are informed of potential transit problems.
Fare systemThe system is based on pre-board ticketing using magnetic ticketing. This streamlines the boarding process and optimizes operations. The fare system integrates feeder and main lines.
Fare collection is centralized and managed by a private company through a concession. The project contributes to sustainable develop-ment in a significant manner:n Improved environment through less GHG
and other air pollutant emissions, specifi-cally CO2, particle matter, and NOX. This is achieved through a more efficient transport system and through new buses;
n Improved social wellbeing as a result of less time lost in congestion, less respiratory dis-eases due to less particle matter pollution, less noise pollution and fewer accidents per pas-senger transported;
n Creation of more than 1,500 temporary con-struction jobs for unskilled workers of the surrounding communities for construction works of Phase II;
n Economic benefits mainly on a macroeco-nomic level. Bogotá can improve its competi-tive position by offering an attractive and modern transit system and can reduce the economic costs of congestion.
Fig. 19TransMilenio trunk routes as planned till 2030.Source: TransMilenio 2006
Fase I: In operation since 2001Fase II: In operation since 2006

22
Sustainable Transport: A Sourcebook for Policy-makers in Developing Cities
42) In a first instance another consulting company was contracted but the methodology proposed by this company was rejected by the UNFCCC.
5.2 GHG reductions of TransMilenioThe District of Bogotá signed in 2001 a contract with the Andean Development Corporation CAF including the TransMilenio CDM project42). CAF also finances a part of the infrastructure required for TransMilenio. CAF thereafter con-tracted in 2005 grütter consulting to develop the CDM project. The BRT methodology developed by grütter consulting was approved by the EB of the UNFCCC in July 2006 (AM0031) and TransMilenio was successfully registered as the first CDM transport project in December 2006 (project number 0672). The project owner is the District of Bogotá through TransMilenio. TransMilenio phase I was prepared by grütter consulting as a VER (Voluntary Emission Reduction) project, selling the emission reduc-tions from 2001–2012 on the voluntary market, while phase II onwards is registered as a CDM project. The TransMilenio CDM project has opted for a crediting period of 7 years renewable up to twice. The first crediting period started January 2006 and will end 2012. The first monitoring period covering the year 2006 has been realized and delivery of the first certified emission reductions CERs is due mid 2007.Emission reductions are caused by the following changes:n Renewal of bus fleet: TransMilenio uses new
buses with state-of-the-art technology while baseline buses are on average 15 years and older. The new units have an improved fuel efficiency and lower GHG and local emis-sions.
n Increased capacity of buses: TransMilenio uses larger units with a capacity of 160 pas-sengers per bus on trunk routes. Conven-tional buses are much smaller. Emissions per passenger-kilometre can thus be reduced.
n Improved operating conditions for buses: Confined, segregated bus lanes together with bus-priority traffic signals allow buses on the route to operate more efficiently and without interference from other traffic thus reducing fuel consumption and GHG emissions. The conventional system is based on competition for passengers between buses on the same
route without having segregated lanes for public transport.
n Centralized bus-fleet control: This allows for a coordinated scheduling of bus services that dynamically adjusts bus frequency with demand to result in fewer buses scheduled in off-peak hours. The load factor of buses is thus optimized leading to lower emissions per passenger transported. The conventional system is based on a large number of very small bus companies without schedule coor-dination operating with low load factors at off-peak hours. The reason is that individual owners continue operating as long as variable costs are covered while a centrally controlled system optimizes total cost resulting in an optimal load factor of buses all the time.
n Mode shift: The BRT system is more at-tractive to clients thus inducing a switch from high-emission transport modes such as passenger cars or taxis to a low-emission transport mode. The increased attractiveness of the BRT system is based on having a faster, more reliable, safer and more convenient transport system.
n Introduction of fare pre-payment technol-ogy helps streamline the boarding process and thus reduces bus-idle GHG emissions.
Indirectly TransMilenio also reduces GHG emissions of other vehicles circulating in the
Fig. 20Relative effect of measures on GHG emission reductions.Source: Grütter, based on monitored data of TransMilenio, 2007
����������������������
����������������������������������
������
���
���
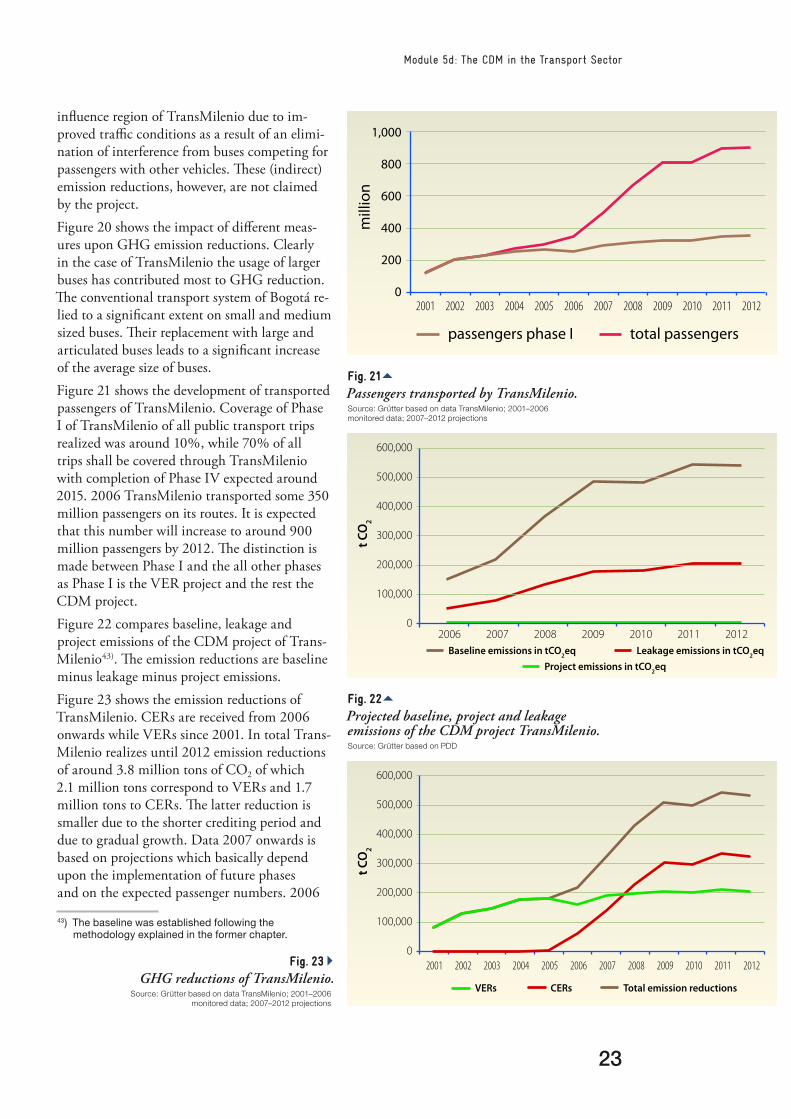
23
Module 5d: The CDM in the Transport Sector
43) The baseline was established following the methodology explained in the former chapter.
influence region of TransMilenio due to im-proved traffic conditions as a result of an elimi-nation of interference from buses competing for passengers with other vehicles. These (indirect) emission reductions, however, are not claimed by the project.Figure 20 shows the impact of different meas-ures upon GHG emission reductions. Clearly in the case of TransMilenio the usage of larger buses has contributed most to GHG reduction. The conventional transport system of Bogotá re-lied to a significant extent on small and medium sized buses. Their replacement with large and articulated buses leads to a significant increase of the average size of buses.Figure 21 shows the development of transported passengers of TransMilenio. Coverage of Phase I of TransMilenio of all public transport trips realized was around 10%, while 70% of all trips shall be covered through TransMilenio with completion of Phase IV expected around 2015. 2006 TransMilenio transported some 350 million passengers on its routes. It is expected that this number will increase to around 900 million passengers by 2012. The distinction is made between Phase I and the all other phases as Phase I is the VER project and the rest the CDM project.Figure 22 compares baseline, leakage and project emissions of the CDM project of Trans-Milenio43). The emission reductions are baseline minus leakage minus project emissions.Figure 23 shows the emission reductions of TransMilenio. CERs are received from 2006 onwards while VERs since 2001. In total Trans-Milenio realizes until 2012 emission reductions of around 3.8 million tons of CO2 of which 2.1 million tons correspond to VERs and 1.7 million tons to CERs. The latter reduction is smaller due to the shorter crediting period and due to gradual growth. Data 2007 onwards is based on projections which basically depend upon the implementation of future phases and on the expected passenger numbers. 2006
Fig. 215Passengers transported by TransMilenio.Source: Grütter based on data TransMilenio; 2001–2006 monitored data; 2007–2012 projections
Fig. 225Projected baseline, project and leakage emissions of the CDM project TransMilenio.Source: Grütter based on PDD
Fig. 234GHG reductions of TransMilenio.
Source: Grütter based on data TransMilenio; 2001–2006 monitored data; 2007–2012 projections
�������
�����
���
���
���
���
����� ���� ���� ���� ���� ���� ���� ���� ���� ���� ���� ����
������������������ ����������������
����
�
�������
�������
�������
�������
�������
�������
�
���������������������������� ������������������������
���
���������������������������
���� ���� ���� ���� ���� ���� ����
����
�
�������
�������
�������
�������
�������
�������
�
���� ���� �������������������������
���� ���� ���� ���� ���� ���� �������� ���� ���� ���� ����
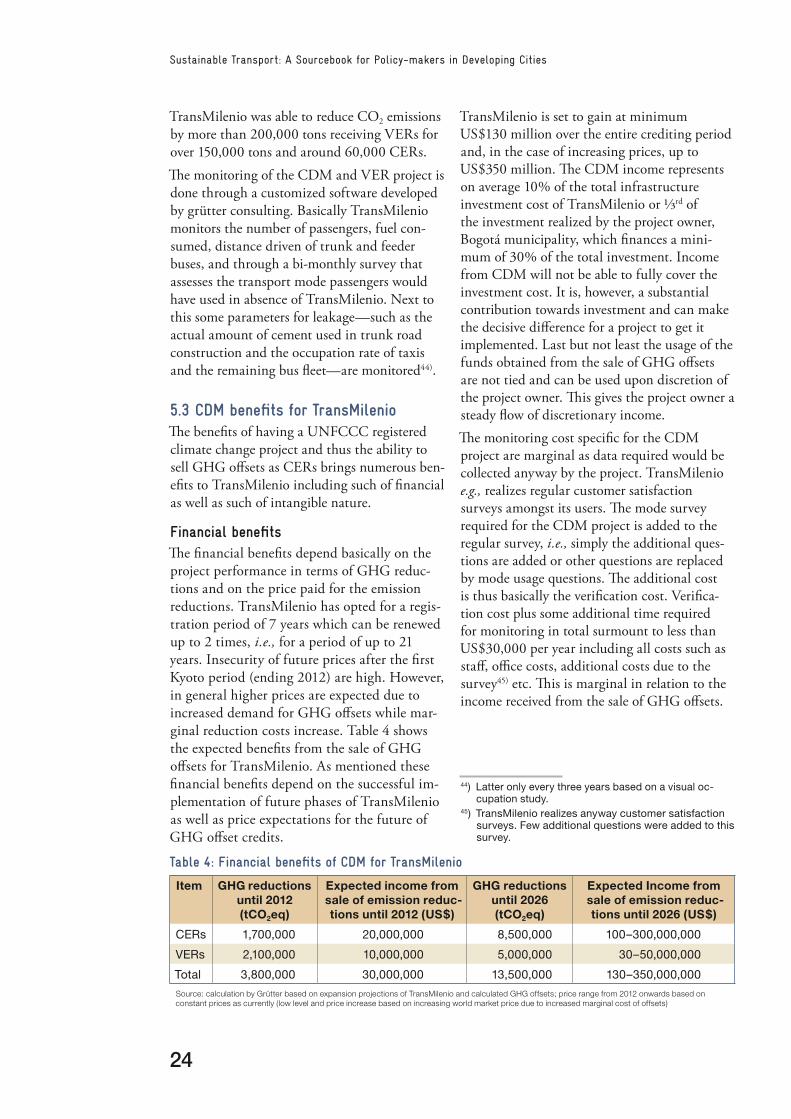
24
Sustainable Transport: A Sourcebook for Policy-makers in Developing Cities
44) Latter only every three years based on a visual oc-cupation study.
45) TransMilenio realizes anyway customer satisfaction surveys. Few additional questions were added to this survey.
TransMilenio was able to reduce CO2 emissions by more than 200,000 tons receiving VERs for over 150,000 tons and around 60,000 CERs. The monitoring of the CDM and VER project is done through a customized software developed by grütter consulting. Basically TransMilenio monitors the number of passengers, fuel con-sumed, distance driven of trunk and feeder buses, and through a bi-monthly survey that assesses the transport mode passengers would have used in absence of TransMilenio. Next to this some parameters for leakage—such as the actual amount of cement used in trunk road construction and the occupation rate of taxis and the remaining bus fleet—are monitored44).
5.3 CDM benefits for TransMilenioThe benefits of having a UNFCCC registered climate change project and thus the ability to sell GHG offsets as CERs brings numerous ben-efits to TransMilenio including such of financial as well as such of intangible nature.
Financial benefitsThe financial benefits depend basically on the project performance in terms of GHG reduc-tions and on the price paid for the emission reductions. TransMilenio has opted for a regis-tration period of 7 years which can be renewed up to 2 times, i.e., for a period of up to 21 years. Insecurity of future prices after the first Kyoto period (ending 2012) are high. However, in general higher prices are expected due to increased demand for GHG offsets while mar-ginal reduction costs increase. Table 4 shows the expected benefits from the sale of GHG offsets for TransMilenio. As mentioned these financial benefits depend on the successful im-plementation of future phases of TransMilenio as well as price expectations for the future of GHG offset credits.
TransMilenio is set to gain at minimum US$130 million over the entire crediting period and, in the case of increasing prices, up to US$350 million. The CDM income represents on average 10% of the total infrastructure investment cost of TransMilenio or ⅓rd of the investment realized by the project owner, Bogotá municipality, which finances a mini-mum of 30% of the total investment. Income from CDM will not be able to fully cover the investment cost. It is, however, a substantial contribution towards investment and can make the decisive difference for a project to get it implemented. Last but not least the usage of the funds obtained from the sale of GHG offsets are not tied and can be used upon discretion of the project owner. This gives the project owner a steady flow of discretionary income.The monitoring cost specific for the CDM project are marginal as data required would be collected anyway by the project. TransMilenio e.g., realizes regular customer satisfaction surveys amongst its users. The mode survey required for the CDM project is added to the regular survey, i.e., simply the additional ques-tions are added or other questions are replaced by mode usage questions. The additional cost is thus basically the verification cost. Verifica-tion cost plus some additional time required for monitoring in total surmount to less than US$30,000 per year including all costs such as staff, office costs, additional costs due to the survey45) etc. This is marginal in relation to the income received from the sale of GHG offsets.
Table 4: Financial benefits of CDM for TransMilenio
Item GHG reductions until 2012 (tCO2eq)
Expected income from sale of emission reduc-tions until 2012 (US$)
GHG reductions until 2026 (tCO2eq)
Expected Income from sale of emission reduc-tions until 2026 (US$)
CERs 1,700,000 20,000,000 8,500,000 100–300,000,000
VERs 2,100,000 10,000,000 5,000,000 30–50,000,000
Total 3,800,000 30,000,000 13,500,000 130–350,000,000
Source: calculation by Grütter based on expansion projections of TransMilenio and calculated GHG offsets; price range from 2012 onwards based on constant prices as currently (low level and price increase based on increasing world market price due to increased marginal cost of offsets)
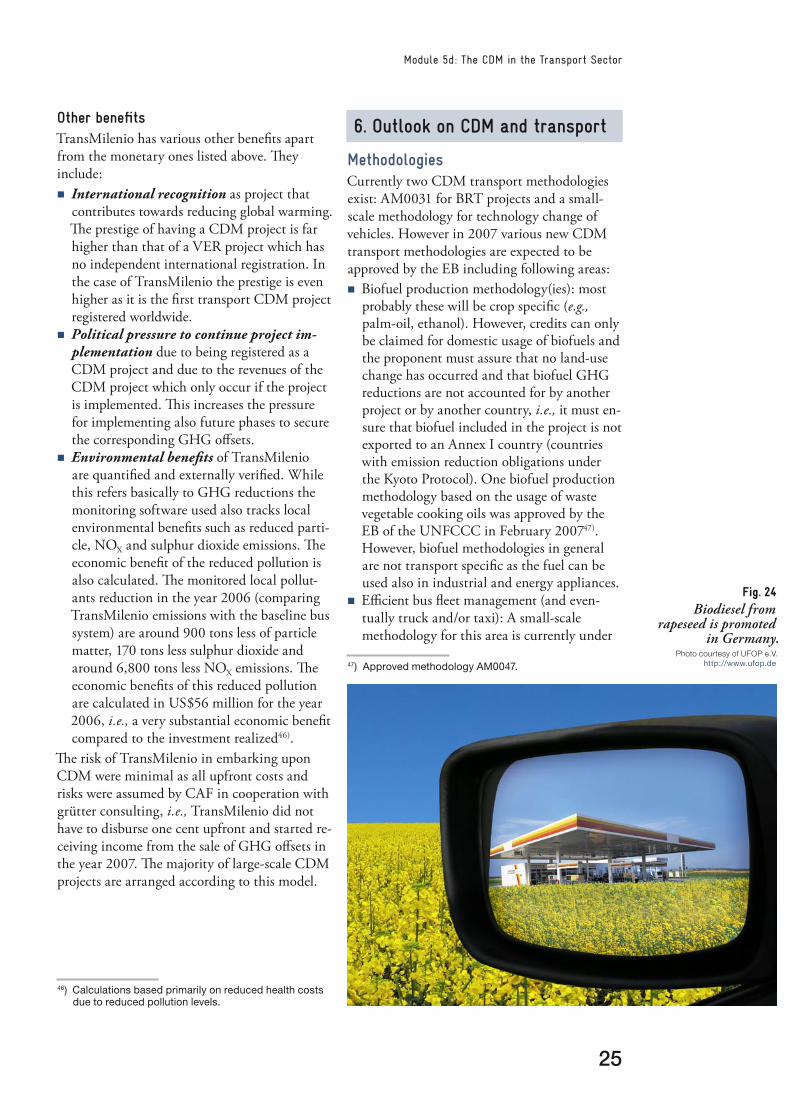
25
Module 5d: The CDM in the Transport Sector
46) Calculations based primarily on reduced health costs due to reduced pollution levels.
Other benefitsTransMilenio has various other benefits apart from the monetary ones listed above. They include:n International recognition as project that
contributes towards reducing global warming. The prestige of having a CDM project is far higher than that of a VER project which has no independent international registration. In the case of TransMilenio the prestige is even higher as it is the first transport CDM project registered worldwide.
n Political pressure to continue project im-plementation due to being registered as a CDM project and due to the revenues of the CDM project which only occur if the project is implemented. This increases the pressure for implementing also future phases to secure the corresponding GHG offsets.
n Environmental benefits of TransMilenio are quantified and externally verified. While this refers basically to GHG reductions the monitoring software used also tracks local environmental benefits such as reduced parti-cle, NOX and sulphur dioxide emissions. The economic benefit of the reduced pollution is also calculated. The monitored local pollut-ants reduction in the year 2006 (comparing TransMilenio emissions with the baseline bus system) are around 900 tons less of particle matter, 170 tons less sulphur dioxide and around 6,800 tons less NOX emissions. The economic benefits of this reduced pollution are calculated in US$56 million for the year 2006, i.e., a very substantial economic benefit compared to the investment realized46).
The risk of TransMilenio in embarking upon CDM were minimal as all upfront costs and risks were assumed by CAF in cooperation with grütter consulting, i.e., TransMilenio did not have to disburse one cent upfront and started re-ceiving income from the sale of GHG offsets in the year 2007. The majority of large-scale CDM projects are arranged according to this model.
6. Outlook on CDM and transport
MethodologiesCurrently two CDM transport methodologies exist: AM0031 for BRT projects and a small-scale methodology for technology change of vehicles. However in 2007 various new CDM transport methodologies are expected to be approved by the EB including following areas:n Biofuel production methodology(ies): most
probably these will be crop specific (e.g., palm-oil, ethanol). However, credits can only be claimed for domestic usage of biofuels and the proponent must assure that no land-use change has occurred and that biofuel GHG reductions are not accounted for by another project or by another country, i.e., it must en-sure that biofuel included in the project is not exported to an Annex I country (countries with emission reduction obligations under the Kyoto Protocol). One biofuel production methodology based on the usage of waste vegetable cooking oils was approved by the EB of the UNFCCC in February 200747). However, biofuel methodologies in general are not transport specific as the fuel can be used also in industrial and energy appliances.
n Efficient bus fleet management (and even-tually truck and/or taxi): A small-scale methodology for this area is currently under
47) Approved methodology AM0047.
Fig. 24Biodiesel from
rapeseed is promoted in Germany.
Photo courtesy of U F O P e. V. http://www.ufop.de
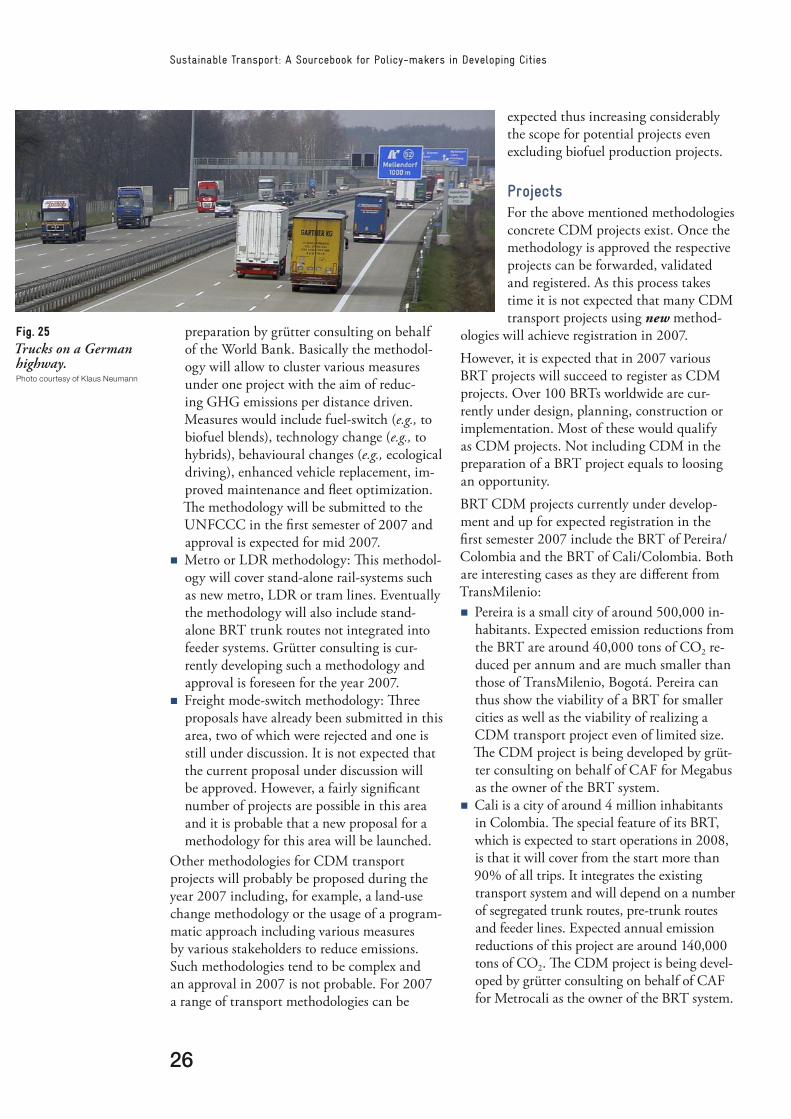
26
Sustainable Transport: A Sourcebook for Policy-makers in Developing Cities
preparation by grütter consulting on behalf of the World Bank. Basically the methodol-ogy will allow to cluster various measures under one project with the aim of reduc-ing GHG emissions per distance driven. Measures would include fuel-switch (e.g., to biofuel blends), technology change (e.g., to hybrids), behavioural changes (e.g., ecological driving), enhanced vehicle replacement, im-proved maintenance and fleet optimization. The methodology will be submitted to the UNFCCC in the first semester of 2007 and approval is expected for mid 2007.
n Metro or LDR methodology: This methodol-ogy will cover stand-alone rail-systems such as new metro, LDR or tram lines. Eventually the methodology will also include stand-alone BRT trunk routes not integrated into feeder systems. Grütter consulting is cur-rently developing such a methodology and approval is foreseen for the year 2007.
n Freight mode-switch methodology: Three proposals have already been submitted in this area, two of which were rejected and one is still under discussion. It is not expected that the current proposal under discussion will be approved. However, a fairly significant number of projects are possible in this area and it is probable that a new proposal for a methodology for this area will be launched.
Other methodologies for CDM transport projects will probably be proposed during the year 2007 including, for example, a land-use change methodology or the usage of a program-matic approach including various measures by various stakeholders to reduce emissions. Such methodologies tend to be complex and an approval in 2007 is not probable. For 2007 a range of transport methodologies can be
expected thus increasing considerably the scope for potential projects even excluding biofuel production projects.
ProjectsFor the above mentioned methodologies concrete CDM projects exist. Once the methodology is approved the respective projects can be forwarded, validated and registered. As this process takes time it is not expected that many CDM transport projects using new method-
ologies will achieve registration in 2007. However, it is expected that in 2007 various BRT projects will succeed to register as CDM projects. Over 100 BRTs worldwide are cur-rently under design, planning, construction or implementation. Most of these would qualify as CDM projects. Not including CDM in the preparation of a BRT project equals to loosing an opportunity.BRT CDM projects currently under develop-ment and up for expected registration in the first semester 2007 include the BRT of Pereira/Colombia and the BRT of Cali/Colombia. Both are interesting cases as they are different from TransMilenio:n Pereira is a small city of around 500,000 in-
habitants. Expected emission reductions from the BRT are around 40,000 tons of CO2 re-duced per annum and are much smaller than those of TransMilenio, Bogotá. Pereira can thus show the viability of a BRT for smaller cities as well as the viability of realizing a CDM transport project even of limited size. The CDM project is being developed by grüt-ter consulting on behalf of CAF for Megabus as the owner of the BRT system.
n Cali is a city of around 4 million inhabitants in Colombia. The special feature of its BRT, which is expected to start operations in 2008, is that it will cover from the start more than 90% of all trips. It integrates the existing transport system and will depend on a number of segregated trunk routes, pre-trunk routes and feeder lines. Expected annual emission reductions of this project are around 140,000 tons of CO2. The CDM project is being devel-oped by grütter consulting on behalf of CAF for Metrocali as the owner of the BRT system.
Fig. 25Trucks on a German highway.Photo courtesy of Klaus Neumann

Deutsche Gesellschaft fürTechnische Zusammenarbeit (GTZ) GmbH
– German Technical Cooperation –
P. O. Box 518065726 ESCHBORN / GERMANYT +49-6196-79-1357F +49-6196-79-7194E [email protected] http://www.gtz.de