5th siks/benais conference on enterprise information ... proceedings. boudewijn f. van dongen . 5th...
TRANSCRIPT

5th SIKS/BENAIS Conference on
Enterprise Information Systems 2010
Eindhoven, The Netherlands, November 2010 Proceedings
Boudewijn F. van Dongen Hajo A. Reijers (Eds.)

Copyright © for the individual papers by the papers' authors. Copying permitted only for private and academic purposes. This volume is published and copyrighted by its editors.
Volume Editors:
Boudewijn F. van Dongen Eindhoven University of Technology PO Box 513, 5600 MB Eindhoven, The Netherlands E-mail: [email protected]
Hajo A. Reijers Eindhoven University of Technology PO Box 513, 5600 MB Eindhoven, The Netherlands E-mail: [email protected]
The papers and extended abstracts in this book comprise the proceedings of the 5th Conference on Enterprise Information Systems (EIS 2010), held on November 16th 2010 at the Eindhoven University of Technology (TU/e).
EIS 2010 is organized by SIKS (School for Information and Knowledge Systems) in cooperation with LOIS (strategic initiative for Logistics, Operations and Information Systems), BENAIS (Benelux Chapter of the Association for Information Systems) and NIRICT (Netherlands Institute for Research on ICT).
The conference offers a unique opportunity for research groups from both the Computer Science-side and the Management-side to report on research, meet and interact. We also welcome practitioners with an interest in research and innovation, as well as doctoral students in the early stages of their careers.
These proceedings also appear online at http://ceur-ws.org/
SIKS BENAIS NIRICT TU/e
http://www.cs.uu.nl/siks/ http://www.benais.nl/ http://nirict.3tu.nl/ http://www.tue.nl/lois/

Proceedings of the
5th SIKS/BENAIS Conference on
Enterprise Information Systems 2010
Eindhoven, The Netherlands,
16th November 2010
Boudewijn F. van Dongen Hajo A. Reijers (Eds.)


Preface
In follow-up to the four previous conferences, which were held in Utrecht, Groningen, Tilburg and Ravenstein, the fifth edition of the SIKS/BENAIS Conference on Enterprise Information Systems (EIS 2010) is held in Eindhoven this year. The purpose of the conference series is to bring together Dutch and Belgian researchers interested in the advances in and the business applications of information systems. Against that backdrop, we are happy to have received contributions from almost all of the Dutch and Belgian research groups active in this field.
Overall, the program consists of 16 presentations of which six concern totally new work. Each of these was duly reviewed by at least three members of the program committee. The remaining 10 presentations relate to work already being published in a high-quality outlet and considered highly attractive to bring under the attention of the Dutch/Belgian EIS community.
On top of these presentations, we are very happy with the incorporation of two keynote presentations in the program. The opening keynote is to be given by Theodoor van Donge, CTO at Cordys and responsible for R&D. The closing keynote will be provided by prof. John Krogstie from the Norwegian University of Science and Technology.
At this occasion, we wish to express first and foremost our gratitude to the members of the EIS community who have fulfilled roles in the program committee for this conference. Their valuable feedback has helped the presenters to further improve their work. We also wish to thank SIKS, BENAIS, NIRICT, LOIS, and all involved local staff at Eindhoven University of Technology for their support in organizing this event.
It is our hope that the conference will stimulate discussions in our community, foster existing collaborations and lead to new ones. But most important of all, we hope that you will enjoy the conference day.
November 2010 Boudewijn van Dongen Hajo Reijers
i


Conference Organization
Organization Chair:
Wil van der Aalst
PC Co-chairs:
Boudewijn van Dongen
Hajo Reijers
Publicity Chair:
Jan Martijn van der Werf
Demo Chair:
Pieter van Gorp
Program committee:
Marco Aiello (RUG) Jos van Hillegersberg (UT) Hans Akkermans (VU) Stijn Hoppenbrouwers (RUN) Mehmet Akşit (UT) Geert-Jan Houben (TUD) Farhad Arbab (CWI) Patricia Lago (VU) Egon Berghout(RUG) Aldo de Moor (CommunitySense) Patrick van Bommel (RUN) Michaël Petit (UN) Harry Bouwman (TUD) Rinus Plasmeijer (RUN) Sjaak Brinkkemper (UU) Stephan Poelmans (HUB) Bert de Brock (RUG) Geert Poels (UGent) Walter Daelemans (UA) Erik Proper (RUN) Virginia Dignum (UU) Piet Ribbers (UvT) Remco Dijkman (TUE) Marten van Sinderen (UT) Pascal van Eck (UT) Monique Snoeck (KUL) Rik Eshuis (TUE) Yao-Hua Tan (TUD) George Fletcher (TUE) Jan Vanthienen (KUL) Jaap Gordijn (VU) Roel Wieringa (UT) Luuk Groenewegen (LEI) Hans Weigand (UvT) Remko Helms (UU) Niek Wijngaards (Thales) Willem-Jan van den Heuvel (UvT)
iii
5th SIKS/BENAIS Conference on Enterprise Information Systems


Program
Filmzaal Zaal L4 09:30 Reception with coffee & tea 09:50 Opening 10:00 Keynote: Theodoor van Donge
Our Journey from Packaged Applications towards SOA, BPM2.0 and Composite Applications Deployed in Cloud and OnPremise
11:00 Break 11:20 Maturity Models Requirements Analysis
Amy Van Looy, Manu De Backer and Geert Poels Tom Huysegoms, Monique Snoeck and Guido Dedene
Which Maturity Is Being Measured? A Classification of Business Process Maturity Models
Building a Requirements Engineering Methodology for Software Product Lines
Marlies Van Steenbergen, Rik Bos, Sjaak Brink-kemper, Inge van de Weerd and Willem Bekkers
Marco Aiello, Pavel Bulanov and Heerko Groefsema
The Design of Focus Area Maturity Models A Survey of Variability Management Requirements Marijn G.A. Plomp and Ronald S. Batenburg Bert de Brock, Tommi Tervonen, Hans Hillege and
Pieter de Graeff Measuring Chain Digitisation Maturity: An
Assessment of Dutch Retail branches Current Status and Future Perspectives of Drug Information Systems
12:20 Lunch break 13:50 Collaborative Modeling Architecture, Ontology & Model Engineering
Sietse Overbeek, Virginia Dignum and Yao-Hua Tan
Ralph Foorthuis, Marlies van Steenbergen, Nino Mushkudiani, Wiel Bruls, Sjaak Brinkkemper and Rik Bos
Value-Sensitive Design for Cross-Enterprise Regulation
On Enterprise Architecture Conformance and Benefits
Agnes Nakakawa, Patrick van Bommel and Erik Proper
Philip Huysmans, Kris Ven and Jan Verelst
Challenges of Involving Stakeholders When Creating Enterprise Architecture
Designing for Innovation: Using Enterprise Ontology Theory to Improve Business-IT Alignment
Denis Ssebuggwawo, Stijn Hoppenbrouwers and Erik Proper
Björn Kijl and Durk Boersma
Collaborative Modeling: Towards a Meta-model for Analysis and Evaluation
Developing a Business Model Engineering & Experimentation Tool - The Quest for Scalable 'Lollapalooza Confluence Patterns'
14:50 Break 15:10 Supply Chains Process Model Transformations
Romana Aziz, Jos van Hillegersberg and Kuldeep Kumar
Pieter Hens, Monique Snoeck, Manu De Backer and Geert Poels
Inter Organizational Relationships Performance in Third Party Logistics: Conceptual Framework and Case Study
Transforming Standard Process Models to Decentralized Autonomous Entities
Ricardo Seguel, Rik Eshuis and Paul Grefen Willem De Roover and Jan Vanthienen Architecture Support for Flexible Chain
Management Unified Patterns to Transform Business Rules into an Event Coordination Mechanism
15:50 Keynote: John Krogstie How Can Enterprise Information Systems Utilize the Future Internet?
16:50 Closure and drinks
v
5th SIKS/BENAIS Conference on Enterprise Information Systems


Table of Contents
Keynote Theodoor van Donge ......................................................... 1 Keynote John Krogstie ..................................................................... 3
Session 1: Maturity Models
Which Maturity Is Being Measured? A Classification of Business Process Maturity Models ..................................................... 7 Amy Van Looy, Manu De Backer, and Geert Poels
The Design of Focus Area Maturity Models ....................................... 17 Marlies Van Steenbergen, Rik Bos, Sjaak Brinkkemper, Inge van de Weerd, and Willem Bekkers
Measuring Chain Digitisation Maturity:An Assessment of Dutch Retail branches ........................................................................... 20 Marijn Plomp, and Ronald Batenburg
Session 2: Requirements Analysis
Building a Requirements Engineering Methodology for Software Product Lines ......................................................................... 25 Tom Huysegoms, Monique Snoeck, and Guido Dedene
A Survey of Variability Management Requirements ........................... 35 Marco Aiello, Pavel Bulanov, and Heerko Groefsema
Current Status and Future Perspectives of Drug Information Systems .................................................................... 37 Bert de Brock, Tommi Tervonen, Hans Hillege, and Pieter de Graeff
vii
5th SIKS/BENAIS Conference on Enterprise Information Systems

Session 3: Collaborative Modelling
Value-Sensitive Design for Cross-Enterprise Regulation ..................... 41 Sietse Overbeek, Virginia Dignum, and Yao-Hua Tan
Challenges of Involving Stakeholders When Creating Enterprise Architecture ......................................................................... 43 Agnes Nakakawa, Patrick van Bommel, and Erik Proper
Collaborative Modeling: Towards a Meta-model for Analysis and Evaluation ....................................................................... 56 Denis Ssebuggwawo, Stijn Hoppenbrouwers, and Erik Proper
Session 4: Architecture, Ontology & Model Engineering
On Enterprise Architecture Conformance and Benefits ....................... 73 Ralph Foorthuis, Marlies van Steenbergen, Nino Mushkudiani, Wiel Bruls, Sjaak Brinkkemper, and Rik Bos
Designing for Innovation: Using Enterprise Ontology Theory to Improve Business-IT Alignment .......................................... 76 Philip Huysmans, Kris Ven, and Jan Verelst
Developing a Business Model Engineering & Experimentation Tool - The Quest for Scalable 'Lollapalooza Confluence Patterns' ................. 78 Björn Kijl and Durk Boersma
viii
Proceedings

Session 5: Supply Chains
Inter Organizational Relationships Performance in Third Party Logistics: Conceptual Framework and Case Study .............................. 83 Romana Aziz, Jos van Hillegersberg, and Kuldeep Kumar
Architecture Support for Flexible Chain Management ........................ 85 Ricardo Seguel, Rik Eshuis and Paul Grefen
Session 6: Process Model Transformations
Transforming Standard Process Models to Decentralized Autonomous Entities ..................................................... 97 Pieter Hens, Monique Snoeck, Manu De Backer, and Geert Poels
Unified Patterns to Transform Business Rules into an Event Coordination Mechanism ......................................................... 107 Willem De Roover, and Jan Vanthienen
Papers of Interest
Abstracting Common Business Rules to Petri Nets ............................ 111 Kees van Hee, Jan Hidders, Geert-Jan Houben, Jan Paredaens, and Philippe Thiran
Towards Robust Conformance Checking ........................................... 113 Arya Adriansyah, Boudewijn van Dongen, and Wil van der Aalst
5th SIKS/BENAIS Conference on Enterprise Information Systems
ix
5th SIKS/BENAIS Conference on Enterprise Information Systems


Keynote: Theodoor van Donge
“Our journey from Packaged Applications towards
SOA, BPM2.0 and Composite Applications deployed
in Cloud and OnPremise”
BPM plays an important role in the area of Business Applications. Previously, we were used to a three-layer model for Business Applications. However, we have grown to a five-layer model, consisting of Databases, the Application server and the User interface, together with the new layers: Integration and BPM.
In his keynote, Theodoor van Donge presents the experiences with this new model he had with Cordys. Among other subjects, he will present the deployment models such as OnPremise and Cloud, but also different types of workflows such as BPMN and Case.
About the author: Theodoor van Donge has over 25 years of IT innovation and
leadership in the software sector. Theodoor played a key role in developing the pioneering ERP technology that saw The Baan Company achieve global recognition and become a Fortune 500 company in the 1990s. As the key architect behind the Cordys platform, Theodoor takes responsibility for all software development undertaken at the company.
With Cordys, Theodoor had a unique opportunity to develop an enterprise IT solution within an entirely green field environment. From 2001, Theodoor led the team that built Business Operations Platform, now widely recognized as the purest composite BPMS available on the market, and one that proves it is possible to support business-centric process design using SOA.
Theodoor’s fundamental approach to Cordys Business Operations Platforms’ underlying architecture is the direct result of his cumulative learnings throughout his career, from his early involvement with the The Baan Company, to experience gained through Jan Baan’s funding of Top Tier and WebEx Communications, as well as his commitment to always using the very latest Internet related technologies.
5th SIKS/BENAIS Conference on Enterprise Information Systems
1

Keynote: John Krogstie
“How can Enterprise Information Systems utilize
the Future Internet?” The "Internet of Things" (IoT) has come to describe a new
paradigm that enables the Internet to reach out into the real world of physical objects. Technologies like RFID, short-range wireless communication, real-time localization and sensor networks are becoming increasingly common and turning IoT into reality. It is expected to grow rapidly into a huge new market domain that may lead to disruptive changes in areas such as logistics, energy management and healthcare. Mobile and collaborative applications and services utilizing information processing and process support enabled by sensor data from a vast numbers of connected and cheap devices will change many markets when being made more easily available. New event-driven architectures (EDA) providing varied information to support collaborative decision-making enable more decisions to be made closer to the problem owner. The expected impacts of the combination of IoT and EDA on business and society are formidable. It also opens the possibility to take into account additional input from users to ensure shorter turnaround from ideas to new, personalized information systems support.
Future Enterprise Information Systems will need to take this situation into account, addressing both technological and conceptual challenges. This talk will focus on the latter, discussing in particular the potential role of model-based techniques and how to assess and improve the quality of models and modeling approaches in this setting.
About the author: John Krogstie holds a PhD (1995) and a MSc (1991) in information
systems from the Norwegian University of Science and Technology (NTNU), where he is currently a full professor in information systems. He is also the Vice Dean of the faculty, responsible for the thematic area ICT at NTNU coordinating multidisciplinary research involving ICT at the university. John Krogstie is the Norwegian representative for IFIP TC8 and chair of IFIP WG 8.1 on information system design and evaluations. His research interest are information systems modeling, quality of models and modeling languages, eGovernment and mobile information systems. He has published around 175 refereed papers in journals, books and archival proceedings since 1991.
5th SIKS/BENAIS Conference on Enterprise Information Systems
3


Session 1:
Maturity Models


Which Maturity Is Being Measured?
A Classification of Business Process Maturity Models
Amy Van Looy1,2, Manu De Backer1,2,3,4, Geert Poels2
1 University College Ghent, Department of Management & Informatics,
Voskenslaan 270, B-9000 Ghent, Belgium
{amy.vanlooy, manu.debacker}@hogent.be 2 Ghent University, Department of Management Information Science & Operations
Management, Tweekerkenstraat 2, B-9000 Ghent, Belgium
{Amy.VanLooy, Manu.DeBacker, Geert.Poels}@UGent.be 3 University of Antwerp, Department of Management Information Systems,
Prinsstraat 13, B-2000 Antwerp, Belgium
{Manu.DeBacker}@ua.ac.be 4 K.U.Leuven, Department of Management Informatics,
Naamsestraat 69, B-3000 Leuven, Belgium
{Manu.DeBacker}@econ.kuleuven.be
Abstract. Today‟s organizations face the challenge to excel due to demanding
customers. Hence, they are relying on their business processes to outperform
competitors. Maturity models have been proposed to gradually assess and
improve business processes. However, the proliferation of business process
maturity models has complicated the practitioner‟s choice. This article clarifies
the foundation of business process maturity and presents a classification of
maturity models. First, a literature study was conducted, based on the concepts
of business process (BP), business process management (BPM), and business
process orientation (BPO), to identify the different capabilities to be addressed
by a business process maturity model: (1) modeling, (2) deployment, (3)
optimization, (4) management, (5) culture, and (6) structure. Afterwards, these
capabilities were used to compare and classify 61 business process maturity
models. The main result is that we found six different types of maturity being
measured by the currently proposed maturity models.
Keywords: business process maturity, business process management, business
process orientation
1 Introduction
As the growing globalized market is characterized by demanding customers,
organizations are striving to excel in order to gain competitive advantage or to
outperform competitors in their societal obligations. Hence, organizations are
increasingly focusing on their business processes [1]. Business process management
is expected to contribute to both process excellence and business excellence by
assuring a uniform way of working and by continuously looking for optimizations [2].
5th SIKS/BENAIS Conference on Enterprise Information Systems
7

Nonetheless, the journey towards process excellence is challenging. As a result,
various authors have proposed step by step road maps with best practices, from which
organizations gradually benefit [3,4,5,6]. These road maps are called business process
maturity models (BPMMs). They are evolutionary models for measuring (AS-IS) and
improving (TO-BE) maturity, or „the extent to which an organization consistently
implements processes within a defined scope that contributes to the achievement of its
business goals‟ [7, p.2]. Maturity aims at systematically increasing the capabilities of
a business process and the organization to deliver higher performance over time [6,8].
Given the importance of mature business processes, a proliferation of maturity
models was realized during the recent decades [9]. It started with frameworks to deal
with the software crisis during the 1970s-1980s, and which have been adapted to all
types of business processes afterwards. At present, maturity models for specific
business processes are integrated into single models [7,10,11], and new models have
been designed for generic business processes [12]. Consequently, this proliferation of
BPMMs prompts us to evaluate their content. For this purpose, the present study aims
at providing a foundation for business process maturity, grounded in the business
process literature, instead of rebuilding on existing BPMMs. We theoretically explore
the capabilities to be addressed by a generic BPMM in the first research question:
(1) which capabilities, i.e., theoretical model components, must be assessed and
improved to increase the maturity of a business process?
However, we do not assume that every BPMM actually has a model component for
each capability found by the previous question. This leads us to the second research
question:
(2) can the BPMMs be classified by the capabilities they actually address? If so,
are there different types of maturity being measured?
Both research questions contribute to the BPMM literature, without presenting a new
model. They clarify the BPMM fundamentals and a classification to support
practitioners while choosing a model that best fits the organizational needs.
The subsequent section deals with the methodology. Next, the research results are
presented (section 3) and discussed (section 4). Afterwards, section 5 explains the
plans for future work. The last section concludes by summarizing the BPMM
components and the resulting BPMM classification with possible maturity types.
2 Methodology
The research approach was twofold: (1) a literature study to identify the capabilities to
be addressed, and (2) a comparative study to classify the existing BPMMs.
2.1 Identification of Theoretical BPMM Components: Literature Study
A BPMM assesses and improves a business process throughout its lifecycle by
focusing on the necessary capabilities to perform. Hence, the model components of a
BPMM must affect business process performance. In order to identify the theoretical
model components, we relied on the extensive literature concerning business
processes, which findings have been repeatedly corroborated by evidence.
Proceedings
8
It resulted in three comprehensive concepts, which are closely linked to the
traditional business process lifecycles [13]: (1) business process (BP), (2) business
process management (BPM), and (3) business process orientation (BPO). Their
respective definitions clarified the differences between the concepts and indicated the
theoretical BPMM components, i.e., the capabilities to be addressed. These
components are also supported by theories on critical success factors for BP, e.g. [14].
2.2 BPMM Classification: Comparative Study
The theoretical components, previously found, were validated by collecting existing
BPMMs. After mapping their content to the components, a classification was derived
to determine the type of maturity being measured per model.
The research scope was set to generic business processes. It excludes BPMMs
addressing specific process types, such as in the initial software engineering maturity
models. However, models that integrate various specific BPMMs were withheld to
represent those specific topics. Also supply chain maturity models were selected to
study cross-organizational value chains.
Data was collected during the second quarter of 2010. First, we searched for
articles in academic databases and search engines on the Internet by using the
combined keywords of „process‟ and „maturity‟. Secondly, we traced the references in
the identified articles to get access to other relevant sources.
We acknowledge some restrictions regarding the accessibility of articles (in Ghent
University engines), the language (English, Dutch, French or German), and the
keywords. Notwithstanding these limitations, the technique turned out to be fruitful in
terms of the number of maturity models identified.
3 Results
The research results are discussed by following the same structure as the methodology
section. Each subsection deals with a distinct research question.
3.1 Identification of Theoretical BPMM Components
Most definitions of BP refer to a transformation taking place, also illustrated as a
value chain. They frequently mention: (1) predictable and definable inputs, (2) a
linear, logical sequence or flow, (3) a set of definable and interrelated activities, (4)
predictable and desired outputs, (5) horizontal or cross-departmental, (6) performed
by resources, (7) repeatable, and (8) adding value for customers [15,16]. For instance,
Harrington‟s definition sounds: ‘a process is a series of interconnected activities that
takes input, adds value to it, and produces output. It’s how organizations work their
day-to-day routines. Your organization’s processes define how it operates’ [1, p.xxii].
This transformational view originates from manufacturing, and is less clear in service
delivery. Hence, other definitions exist which rather emphasize a coordination of
activities, instead of value-adding transformations, e.g. in [17]. Despite these different
5th SIKS/BENAIS Conference on Enterprise Information Systems
9
emphases, all BP definitions focus on business process modeling and deployment. As
a result, both aspects will be used as theoretical model components for BPMMs.
Secondly, BPM involves continuously managing and improving business
processes, guided by process owners. Depending on their background, authors
underline more the IT benefits [18], or the management aspects [19]. Gillot [17],
Gulledge Jr. and Sommer [20] summarize four BPM components: (1) modeling, (2)
deployment, with automation where possible, (3) optimization, or improving business
processes based on real metrics to evaluate business process performance, and (4) the
management of business processes, each with a process owner and a cross-
departmental process team. Similarly to BP, these four components are selected as
theoretical BPMM components. The difference with BP, is that BPM also addresses
managerial aspects and optimization efforts with regard to one or more business
processes.
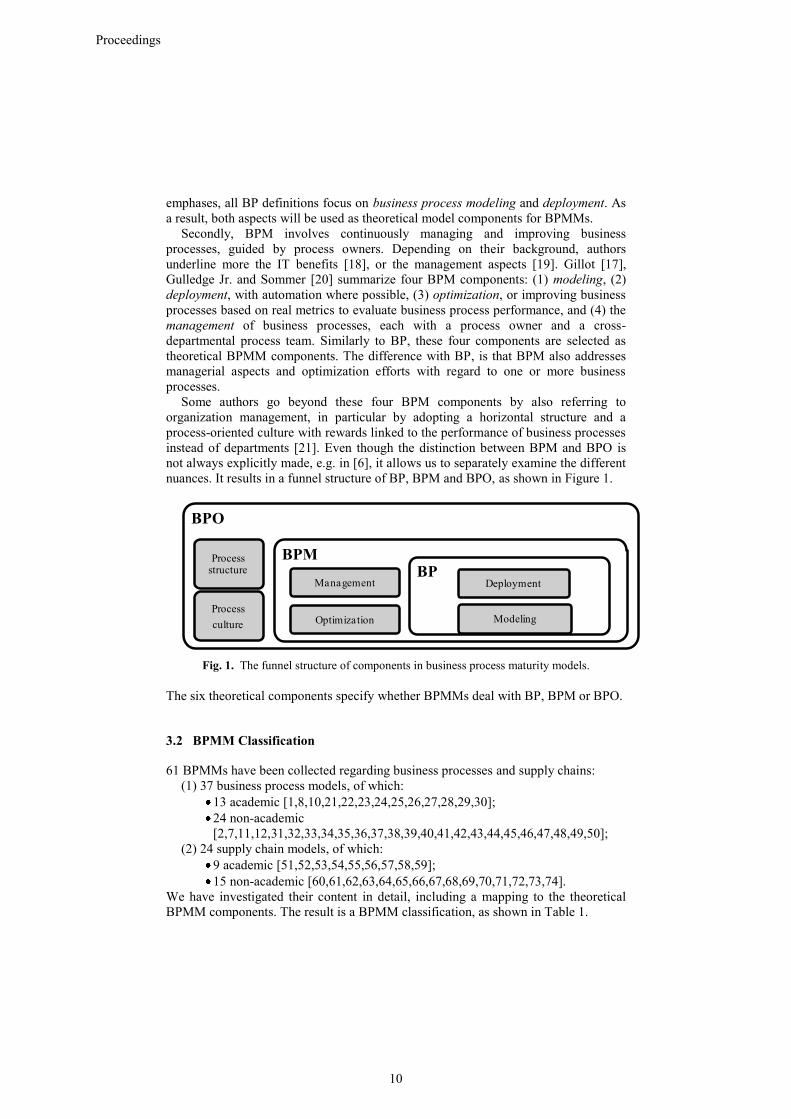
Some authors go beyond these four BPM components by also referring to
organization management, in particular by adopting a horizontal structure and a
process-oriented culture with rewards linked to the performance of business processes
instead of departments [21]. Even though the distinction between BPM and BPO is
not always explicitly made, e.g. in [6], it allows us to separately examine the different
nuances. It results in a funnel structure of BP, BPM and BPO, as shown in Figure 1.
BPO
Process structure
Process
culture
BPM
Management
Optimization
BPDeployment
Modeling
Fig. 1. The funnel structure of components in business process maturity models.
The six theoretical components specify whether BPMMs deal with BP, BPM or BPO.
3.2 BPMM Classification
61 BPMMs have been collected regarding business processes and supply chains:
(1) 37 business process models, of which:
13 academic [1,8,10,21,22,23,24,25,26,27,28,29,30];
24 non-academic
[2,7,11,12,31,32,33,34,35,36,37,38,39,40,41,42,43,44,45,46,47,48,49,50];
(2) 24 supply chain models, of which:
9 academic [51,52,53,54,55,56,57,58,59];
15 non-academic [60,61,62,63,64,65,66,67,68,69,70,71,72,73,74].
We have investigated their content in detail, including a mapping to the theoretical
BPMM components. The result is a BPMM classification, as shown in Table 1.
Proceedings
10

Table 1. A classification of business process maturity models.
BPM
for one BP
(N=3)
BPM
for more BPs
(N=11)
BPM
for all BPs
(N=4)
BP academic: [1,24]
BP non-academic:
[40]
BP academic: [22]
BP non-academic:
[7]
SC academic: [55,58]
SC non-academic:
[60,61,67,68,70,71,
72]
BP academic:
[21,27,29]
BP non-academic:
[31]
BPO
for one BP
(N=3)
BPO
for more BPs
(N=20)
BPO
for all BPs
(N=22)
BP academic: [8]
BP non-academic:
[36,47]
BP academic: [10,25]
BP non-academic:
[11,12,38]
SC academic:
[51,52,53,54,56,57,
59]
SC non-academic:
[62,63,64,65,66,69,
73,74]
BP academic:
[8,23,26,28,30]
BP non-academic:
[2,32,33,34,35,36,37,
39,41,42,43,44,45,
46,48,49,50]
In theory, all BP components are contained in BPM, and all BPM components in
BPO. However, in practice, the lower components are not always present. BPMMs
are classified as BPO if they address “process structure” or “process culture”, and as
BPM if they involve “management” or “optimization” without BPO components.
First, it turned out that no model merely addresses the BP components of
“modeling” and “deployment”. Instead, if present, they are supplemented by at least
one BPM component. Secondly, the models strongly vary on the kind and number of
business processes taken into account. As a result, a refinement in the classification
was made to distinguish three BPMM foci: (1) a focus on one BP, (2) a focus on more
than one, but not necessarily all BPs, and (3) a focus on all BPs in the involved
organization(s) or supply chain (see Table 1). The result is a BPMM classification
with six different types of maturity. It should be noted that some BPMMs offer
multiple maturity types of which a practitioner can choose according to the
organizational needs, for instance limited to a single BP or comprising all BPs [8,36].
4 Discussion
Six findings are drawn from the literature study and the comparative study. The first
three concern the theoretical BPMM components (first research question), whereas
the last three deal with the BPMM classification (second research question).
(1) Component validation. The six theoretical BPMM components, derived from
the business process literature on BP, BPM and BPO, have been empirically validated
5th SIKS/BENAIS Conference on Enterprise Information Systems
11

by comparing existing BPMMs. All actual model components were successfully
mapped to a theoretical equivalent, without detecting new components.
(2) Component coverage. Most BPMMs do not cover all theoretical components,
but three to five of them. All models address both “optimization” and “management”,
except for four models, with [24,72] ignoring “management” and [37,51]
underestimating “optimization”. The “structure” component is often neglected.
(3) IT-enabled components. Although IT is not a prerequisite, the majority
prescribe IT to enable the three lowest components: “modeling” < “optimization” <
“deployment”. The degree varies from general IT, such as mentionning hard- and
software, to specific IT, e.g. EDI, ERP, SOA, SaaS, BPMS, and specific vendor tools.
(4) No BP maturity type. The collected BPMMs demonstrate that merely
improving “modeling” and “deployment” are insufficient to achieve higher maturity
regarding generic business processes, and that “optimization” and “management” are
paramount. For instance, not all business processes need to be fully modeled in
advance, e.g. semi-structured process flows in service delivery. Nonetheless, such a
BPMM may theoretically exist, but restricted to specific business processes, e.g. by
focussing on the workflows of manufacturing processes.
(5) BPM and BPO maturity types. The majority of collected BPMMs measure BPO
maturity, mainly because of process-oriented values, e.g. a client focus, innovation,
empowerment or trust, and the rewards to ensure their realization. Although an
organization-wide perspective fosters higher maturity, it is not included in all models.
Organizations can limit maturity to BPM by assigning a process owner to manage and
statistically track a business process, possibly restricted to a department. Nonetheless,
they won‟t gain all benefits if the process owner has no cross-departmental authority
nor if collaborating departments distrust each other.
(6) Number of BPs. BPMMs can be used to cope with one, more or all business
processes. However, the models for a single business process are less numerous. More
often, they are used in a single business domain with multiple business
(sub)processes, such as software engineering or the supply chain. For instance, the
latter has business processes for buying, producing, selling and planning products and
services. This finding is conform to the idea of a large cross-departmental or cross-
organizational business process, or horizontal value chain, with subprocesses in each
department. Also frequent are BPMMs involving all business processes, which rather
take a management perspective instead of focusing on particular business processes.
5 Future Work
All BPMMs will be further compared with regard to other elements in the assessment
(AS-IS) and improvement (TO-BE) method, such as the lifecycle levels and the road
map. Case studies will be conducted for the most comprehensive models. Above all,
we will explore additional theories on the critical success factors for BP to obtain an
operationalization of each component. Afterwards, we will be able to evaluate
whether a new model design is appropriate for cross-organizational processes, and
what the IT impact may be per component. Interestingly, different tracks may be
identified depending on the organization size, type (products or services) and sector.
Proceedings
12

6 Conclusion
A business process maturity model (BPMM) addresses the capabilities of a business
process and the entire organization, expressed as overall maturity, to deliver higher
performance over time. These capabilities are represented by the BPMM components,
which are systematically assessed and improved. The present study has elaborated on
the theoretical model components to specify what is being measured by a BPMM. It
has compared 61 BPMMs on six theoretical components, found in the business
process literature. The components are linked to the traditional lifecycle of a business
process, supplemented by organizational aspects: (1) modeling, (2) deployment, (3)
optimization, (4) management, (5) culture, and (6) structure. In pairs, they form a
funnel structure, starting from a business process (BP), which is a subset of business
process management (BPM), and which is part of business process orientation (BPO).
However, in practice, BPMMs do not necessarily address all theoretical BPMM
components. Above all, given the proliferation of BPMMs, practitioners may
experience difficulties in choosing a model that best fits the organizational needs. In
order to facilitate this choice, we present a BPMM classification based on two
decisions: (1) which BPMM components are important for the organization (does a
business process management perspective suffice or is an organizational perspective
required?), and (2) which business processes to assess and improve (is there a focus
on one, more or all BPs?). It results in six possible types of maturity: BPM maturity
for one, more or all business processes, and BPO maturity for one, more or all
business processes in the involved organization(s). Evidence has shown that a BP
maturity type, centered around modeling and deployment, does not exist for generic
business processes, as management and optimization are paramount.
In summary, the present study has reached its aim of providing a BPMM
foundation in the BP literature. The six capabilities to be addressed in a generic
BPMM have been identified and validated, as queried by the first research question.
Regarding the second research question, the concept of maturity has been refined by
specifying different maturity types. The resulting BPMM classification is relevant for
both practitioners and academics, and contributes to the rather scarce BPMM
literature. It allows clear communication, with scholars being able to clarify which
dimension of maturity they investigate. New BPMMs may be designed based on the
six theoretical BPMM components. Furthermore, the study challenges the maturity of
maturity models by highlighting different designs, e.g. are BPO models for all BPs
more complete and thus necessarily better than BPM models for one BP? Future
research will focus on the operationalization by organization size, type and sector.
References
1. Harrington, H.J.: Process Management Excellence. The Art of Excelling in Process
Management. Paton Press, California (2006)
2. Tolsma, J., de Wit, D.: Effectief Procesmanagement. Procesgericht Sturen met het BPM
Model. Eburon, Delft (2009)
3. Hüffner, T.: The BPM Maturity Model - Towards a Framework for Assessing the Business
Process Management Maturity of Organizations. GRIN, Munich (2004)
5th SIKS/BENAIS Conference on Enterprise Information Systems
13

4. Lee, J., Lee, D., Kang, S.: An Overview of the Business Process Maturity Model (BPMM).
In: Advances in Web and Network Technologies, and Information Management, June 16-
18, Huang Shan, China, pp. 279--288. Springer: Heidelberg (2007)
5. Maier, A.M., Moultrie, J., Clarkson, P.J.: A Review of Maturity Grid based Approaches to
Assessing Organizational Capabilities. In: Academy of Management Annual Meeting, 8-13
August. Academy of Management, California (2008)
6. Rosemann, M., de Bruin, T.: Application of a Holistic Model for Determining BPM
Maturity. BPTrends (February 2005)
7. ISO/IEC: Information Technology - Process Assessment - Part 7: Assessment of
Organizational Maturity - ISO/IEC TR 15504-7:2008(E). ISO/IEC, Geneva (2008)
8. Hammer, M.: The Process Audit. Harvard Business Review (April), 111--123 (2007)
9. Sheard, S.A.: Evolution of the Frameworks Quagmire. IEEEComputer 34(7), 96--98 (2001)
10. SEI: CMMI for Services, Version 1.2. Software Engineering Institute (February 2009),
Online available, http://www.sei.cmu.edu/reports/09tr001.pdf
11. FAA: FAA-iCMM, Version 2.0, An Integrated Capability Maturity Model for Enterprise-
wide Improvement (2001), Online available, http://www.faa.gov/about/office_org/headquarters_offices/aio/
12. OMG: Business Process Maturity Model (BPMM) - Version 1.0 (1 June 2008), Online
available, http://www.omg.org/spec/BPMM/1.0/PDF
13. Houy, C., Fettke, P., Loos, P.: Empirical Research in BPM – Analysis of an Emerging Field
of Research. Business Process Management Journal 16(4), 619--661 (2010)
14. Armistead, C., Machin, S.: Implications of BPM for Operations Management. International
Journal of Operations & Production Management 17(9), 886--898 (1997)
15. Zairi, M.: Business Process Management: a Bounderyless Approach to Modern
Competitiveness. Business Process Management Journal 3(1), 64--80 (1997)
16. Palmberg, K.: Exploring Process Management: Are There any Widespread Models and
Definitions?. The TQM Journal 21(2), 203--215 (2009)
17. Gillot, J.-N.: The Complete Guide to Business Process Management. Booksurge
Publishing, South Carolina (2008)
18. Smith, H., Fingar, P.: Business Process Management: the Third Wave. Meghan-Kiffer
Press, Tampa (2002, 2006)
19. Lee, R.G., Dale, B.G.: Business Process Management: a Review and Evaluation. Business
Process Management Journal 4(3), 214--225 (1998)
20. Gulledge Jr, T.R., Sommer, R.A.: Business Process Management: Public Sector
Implications. Business Process Management Journal 8(4), 364--376 (2002)
21. McCormack, K., Johnson, W.C.: Business Process Orientation: Gaining the e-Business
Competitive Advantage. St. Lucie Press, Florida (2001)
22. Aouad, G., et al.: Technology Management of IT in Construction: a Driver or an Enabler?.
Logistics Information Management 12(1/2), 130--137 (1999)
23. Pritchard, J.-P., Armistead, C.: Business Process Management - Lessons from European
Business. Business Process Management Journal 5 (1), pp. 10-32 (1999)
24. DeToro, I., McCabe, T.: How to Stay Flexible and Elude Fads. Quality Progress (March),
55--60 (1997)
25. Lee, J., Lee, D., Kang, S.: vPMM: a value based Process Maturity Model. In: Roger, L.,
Gonzu, H., Huaikou, M. (eds) Computer and Information Science 2009, pp. 193--213.
Springer, Heidelberg (2009)
26. Maull, R.S., Tranfield, D.R., Maull, W.: Factors Characterizing the Maturity of BPR
Programmes. International Journal of Operations & Production Management 23(6), 596--
624 (2003)
27. Rohloff, M.: Case Study and Maturity Model for BPM Implementation. In: 7th
International BPM Conference, September, pp. 128--142. Springer, Ulm (2009)
Proceedings
14

28. de Bruin, T., Rosemann, M.: Using the Delphi Technique to Identify BPM Capability
Areas. In: 18th Australasian Conference on Information Systems, 5-7 December, pp. 642--
653. Toowoomba (2007)
29. Skrinjar, R., Bosilj-Vuksic, V., Stemberger, M.I.: The Impact of Business Process
Orientation on Financial and Non-financial Performance. Business Process Management
Journal 14(5), 738--754 (2008)
30. Willaert, P., et al.: The Process-Oriented Organization: a Holistic View. Developing a
Framework for Business Process Orientation Maturity. In: 5th International Conference on
Business Process Management, 24-28 September, pp. 15. Springer: Brisbane (2007)
31. Bisnez Management: Business Process Management Onderzoek (2010), Online available, http://www.bisnez.org/
32. BPMInstitute: 2010 BPM Market Assessment Survey (2010), Online available, http://2010stateofbpm.surveyconsole.com/
33. BPT Group: Welcome to 8 Omega v2.0. BP Transformations Group (March 2008), Online
available, http://bptg.seniordev.co.uk/8omega.aspx
34. Dowdle, P., et al.: The Process-based Management Loop. The Journal of Corporate
Accounting & Finance (January), 55--60 (2005)
35. Dowdle, P., Stevens, J., Daly, D.: Process-based Management at Work in an Organization
(2007), Online available, http://www.cam-i.org/docs/PBM_at_Work_in_an_organization.pdf
36. Champlin, B.: Dimensions of Business Process Change (25 June 2008), Online available, https://www.bpminstitute.org
37. Deloitte: Het Business Maturity Model (2010), Online available, http://www.deloitte.com/view/nl_NL/nl/diensten/consulting/
38. Ostolaza, E., Garcia, A.B.: EFQM/SPICE Integrated Model. In: International Conference
on Product Focused Software Improvement, June 22-24, pp. 437--452. Oulu (1999)
39. Fisher, D.M.: The Business Process Maturity Model. A Practical Approach for Identifying
Opportunities for Optimization. BPTrends (September 2004)
40. Gardner, R.A.: The Process-Focused Organization. A Transition Strategy for Success.
ASQ, Quality Press, Milwaukee (2004)
41. Melenovsky, M.J., Sinur, J.: BPM Maturity Model Identifies Six Phases for Successful
BPM Adoption. Gartner Research, Stamford (2006)
42. Harmon, P.: Evaluating an Organization's Business Process Maturity. BPTrends Newsletter
2(3), 1--11 (2004)
43. IDS Scheer: BPM Maturity Check (2010), Online available, http://www.bpmmaturity.com/
44. Oracle: BPM Lifecycle Assessment (2008), Online available, http://bpmready.nvishweb.com/
45. Remoreras, G.: Achieving the Highest Level of Process Culture Maturity (23 August 2009),
Online available, http://mysimpleprocesses.com/
46. Rummler-Brache Group: Business Process Management in U.S. Firms Today (March
2004), Online available, http://rummler-
brache.com/upload/files/PPI_Research_Results.pdf
47. Scavillo, M.: Business Process Transformation in the Software Industry (30 June 2008),
Online available, http://www.sdn.sap.com/irj/scn/
48. Scheer, A.-W.: BPM =Business Process Management =Business Performance Management
(2007), Online available, http://www.professor-scheer-bpm.com/
49. Smith, H., Fingar, P.: Process Management Maturity Models. BPTrends (July 2004)
50. Spanyi, A.: Beyond Process Maturity to Process Competence. BPTrends (June 2004)
51. Ayree, G., Naim, M.M., Lalwani, C.: Supply Chain Integration Using A Maturity Scale.
Journal of Manufacturing Technology Management 19(5), 559--575 (2008)
5th SIKS/BENAIS Conference on Enterprise Information Systems
15

52. Böhme, T.: Supply Chain Integration: A Case-based Investigation of Status, Barriers, and
Paths to Enhancement. The University of Waikato, Waikato (2008)
53. Campbell, J., Sankaran, J.: An Inductive Framework for Enhancing Supply Chain
Integration. International Journal of Production Research 43(16), 3321--3351 (2005)
54. Lockamy III, A., McCormack, K.: Supply Chain Maturity and Performance. In:
McCormack, K. (ed.) Business Process Maturity. Theory and Application, pp. 105--135.
Booksurge Publishing, South Carolina (2007)
55. McClaren, T.: A Measurement Model for Web-enabled Supply Chain Integration. In:
Proceedings of the 19th Bled eConference eValues, pp. 1--13. Bled (2006)
56. Closs, D.J., Mollenkopf, D.A.: A Global Supply Chain Framework. Industrial Marketing
Management 33, 37--44 (2004)
57. Netland, T.H., Alfnes, E., Fauske, H.: How Mature is your Supply Chain? Supply Chain
Maturity Assessment Test. In: Proceedings of the 14th EurOMA Conference, pp. 1--10.
EurOMA, Ankara (2007)
58. Riverola, J.: A General Approach to the Case Gathering Phase (2001), Online available, http://catalcatel.iese.edu/WEBSCM/Archivos/MaturityModel.pdf
59. Enkawa, T.: Logistics Scorecard (LSC) in Japan (May 2005), Online available, http://transportal.fi/Hankkeet/eglo/.383.pdf
60. AberdeenGroup: Global Supply Chain Benchmark Report (June, 2006), Online available, https://www-935.ibm.com/services/us/igs/pdf/aberdeen-
benchmark-report.pdf
61. Anderson, D.L., Lee, H.L.: The Internet-Enabled Supply Chain: from the "First Click" to
the "Last Mile". In: Anderson, D.L. (ed.) Achieving Supply Chain Excellence Through
Technology, vol. 2, pp. 15--20. Montgomery Research (2000)
62. CGF: The Global Scorecard (2010), Online available, http://www.globalscorecard.net/
63. Ayers, J.B.: Supply Chain Project Management. A Structured Collaborative and
Measurable Approach (2nd ed.). Taylor and Francis Group, Boca Raton (2010)
64. Chicago Consulting: Supply Chain Maturity. A Self-Assessment (2010), Online available, http://www.chicago-consulting.com/
65. Poirier, C.C., Quinn, F.J., Swink, M.L.: Diagnosing Greatness. Ten Traits of the Best
Supply Chains. J. Ross Publishing, Fort Lauderdale (2010)
66. eKNOWtion: Supply Chain Maturity Monitor (2009), Online available, http://www.eknowtion.com/phpQ/fillsurvey.php?sid=8
67. IBM: The IBM Global Business Services 2007 Mainland China Value Chain Study (17
October 2007), Online available, http://www-
935.ibm.com/services/us/gbs/thoughtleadership/#Next
68. van den Bergh, J.: Supply Chain Maturity Scan (2010), Online available, http://www.jvdbconsulting.com/supply-chain-maturity-scan.html
69. Boone, L.M., et al.: The GAIA Supply Chain Sustainability Maturity Model (2009), Online
available, http://www.lmi.org/logistics/logistics.aspx
70. Holmes, J.: Building Supply Chain Communities (1997). Online available, http://criticalcomputing.com/
71. Cohen, S., Roussel, J.: Strategic Supply Chain Management. The 5 Disciplines for Top
Performance. McGraw-Hill, New York (2005)
72. APQC: Supply-Chain Council SCOR-mark Survey (2007), Online available, http://www.apqc.org/scc
73. Schoenfeldt, T.I.: A Practical Application of Supply Chain Management Principles. ASQ,
Milwaukee (2008)
74. Stevens, G.C. Integrating the Supply Chain. International Journal of Physical Distribution
& Logistics Management 19(8), 3--8 (1989)
Proceedings
16

The Design of Focus Area Maturity Models
Marlies van Steenbergen1, Rik Bos2, Sjaak Brinkkemper2, Inge van de Weerd2, Willem Bekkers2
1 Sogeti Netherlands, Wildenborch 3, 1112 XB Diemen, The Netherlands
[email protected] 2 Department of Information and Computing Sciences,
Utrecht University, Padualaan 14, 3584 CH Utrecht, The Netherlands {R.Bos, S.Brinkkemper, I.vandeWeerd, Bekkers}@cs.uu.nl
Abstract. Maturity models are a well-known instrument to support the improvement of functional domains in IS, like software development or testing. In this paper we present a generic method for developing focus area maturity models based on both extensive industrial experience and scientific investigation. Focus area maturity models are distinguished from fixed-level maturity models, like CMM, in that they are especially suited to the incremental improvement of functional domains.
Keywords: Design Research Methodology, Design Science, Enterprise Architecture, Software Product Management, Maturity Model.
This paper has been published as: Steenbergen, M. van, Bos, R, Brinkkemper, S, Weerd, I, van de, Bekkers, W.: The Design of Focus Area Maturity Models. In: W R. Winter, J.L. Zhao, and S. Aier (eds.): DESRIST 2010, LNCS 6105, pp. 317–332, Springer-Verlag Berlin Heidelberg (2010).
Within the field of IS new functional domains, like enterprise architecture and software product management, are still emerging. Developing such functional domains is a complex matter. Decisions have to be made about how and in what order to develop new processes, deliverables and competences. Maturity models are a well-known instrument to support incremental development of functional domains, as they distinguish different maturity levels that an organization progresses through.
In this paper we present a generic method to develop a particular kind of maturity model, the focus area maturity model. The focus area maturity model is particularly well-suited to support incremental development of functional domains as it departs from the concept of having a limited fixed number of generic maturity levels as used in CMM. Instead it defines maturity levels, called capabilities, per focus area within the functional domain. By juxtaposing all capabilities of all focus areas of a domain relative to each other, a balanced, incremental development path is defined. This juxtaposition of capabilities is done by positioning the capabilities in a matrix as shown in figure 1, which gives an example of a focus area maturity model in the functional domain of enterprise architecture. The capabilities are depicted by the letters A to D. Each capability is associated with a number of checkpoints. An architecture profile of a specific organization can be depicted by coloring the cells up to the capability that has not been implemented yet. The architecture profile provides
5th SIKS/BENAIS Conference on Enterprise Information Systems
17

insight into the strengths and weaknesses of the domain and where to focus improvement actions.
Fig. 1. A focus area maturity model for the functional domain of enterprise architecture.
Applying design science research methodology [1], we developed a generic method for developing focus area maturity models, depicted in figure 2.
Fig. 2. The development method for focus area maturity models.
The development method is based on both literature review [2, 3, 4, 5] and
extensive industrial experience in applying the focus area maturity model concept [6, 7, 8, 9] . The concept of the maturity matrix is refined by building a mathematical formalization of the matrix.
Maturity Scale
Focus Area
0 1 2 3 4 5 6 7 8 9 10 11 12 13
Development of architecture A B C
Use of architecture A B C
Alignment with business A B C
Alignment with the development process A B C
Alignment with operations A B C
Relationship to the as-is state A B
Roles and responsibil ities A B C
Coordination of developments A B
Monitoring A B C D
Quality management A B C
Maintenance of the architectural process A B C
Maintenance of architectural deliverables A B C
Commitment and motivation A B C
Architectural roles and training A B C D
Use of an architectural method A B C
Consultation A B C
Architectural tools A B C
Budgeting and planning A B C
Proceedings
18

References
1. Peffers, K., Tuunanen, T., Rothenberger, M.A., Chatterjee, S.: A Design Science Research Methodology for Information Systems Research. Journal of Management Information Systems, vol.24 (3), pp. 45-78 (2008)
2. Bruin, T. de, Freeze, R., Kulkarni, U., Rosemann, M.: Understanding the Main Phases of Developing a Maturity Assessment Model. In: Proceedings of the 16th Australasian Conference on Information Systems. Sydney (2005)
3. Mettler, T., Rohner, P.: Situational Maturity Models as Instrumental Artifacts for Organizational Design. In: Proceedings of the 4th international Conference on Design Science Research in information Systems and Technology. Philadelphia (2009)
4. Maier, A.M., Moultrie, J., Clarkson, P.J.: Developing Maturity Grids for Assessing Organisational Capabilities: Practitioner Guidance. In: 4th International Conference on Management Consulting, Academy of Management (MCD'09). Vienna (2009)
5. Becker, J., Knackstedt, R., Pöppelbuß, P.: Developing Maturity Models for IT Management - A Procedure Model and its Application. Business & Information Systems Engineering 1(3), pp. 213-222 (2009)
6. Steenbergen, M. van, Berg, M. van den, Brinkkemper, S. A Balanced Approach to Developing the Enterprise Architecture Practice. In: Filipe, J., Cordeiro, J., Cardoso, J. (eds.) Enterprise Information Systems. LNBIP 12, pp. 240–253 (2007)
7. Steenbergen, M. van, Schipper J., Bos, R, Brinkkemper, S: The Dynamic Architecture Maturity Matrix: Instrument Analysis and Refinement. To appear in the proceedings of the 4th Workshop on Trends in Enterprise Architecture Research. Stockholm (2009)
8. Bekkers, W., Spruit, M., Weerd, I. v., Brinkkemper, S.: A Situational Assessment Method for Software Product Management. To appear in ECIS2010 proceedings (2010)
9. Weerd, I, van de, Bekkers, W., Brinkkemper, S.: Developing a Maturity Matrix for Software Product Management. To appear in Jansen, S., Tyrvainen, P. (eds.) Proceedings of the 1st International Conference on Software Business. LNBIP 51, Jyväskylä (2010)
5th SIKS/BENAIS Conference on Enterprise Information Systems
19
Measuring Chain Digitisation Maturity:
An Assessment of Dutch Retail branches
Marijn G.A. Plomp1,2 and Ronald S. Batenburg1,
1 Utrecht University, Information and Computing Sciences, Padualaan 14, P.O. Box 80115,
3508 TC Utrecht, The Netherlands 2 Dialogic Innovation & Interaction, Hooghiemstraplein 33-36, 3514 AX Utrecht, The
Netherlands
{m.g.a.plomp, r.s.batenburg}@cs.uu.nl
Originally appeared in: Supply Chain Management: An International Journal,
Vol. 15 No. 3 (2010), pp. 227–237
Keywords: Maturity model, Interorganisational information systems, Retail,
SMEs, The Netherlands
Extended Abstract
The purpose of this article is to develop a validated measurement model and typology
for chain digitisation maturity, defined as the degree of interorganisational
collaboration through ICT.
The advantages of interorganisational information systems (IOIS) seem to meet the
challenges currently facing the (Dutch) retail sector, as becomes clear from many
large-scale examples. It can be seen as an omission that there are fewer examples for
smaller organisations. There seems to be no clear insight into which factors drive
small businesses to adopt and deploy IOIS. We depart from the notion that without
considering the organisational dimension, the deployment of technology (i.e. ICT)
will be less useful and/or effective. The common notion is that technological and
organisational systems reinforce each other, as evidenced for example by theory on
business–IT alignment. At every scale and level, technology and management (or
‘organisation’) should be related.
Literature discussing the level of chain digitisation often focuses on one single
organisation. As chain digitisation exceeds the level of a single organisation, its
maturity actually should be measured at the chain level as well. In this paper, we
develop such a framework and validate the resulting measurement model at the level
of interorganisational chains within a number of branches (i.e. sub-sectors of an
industry).
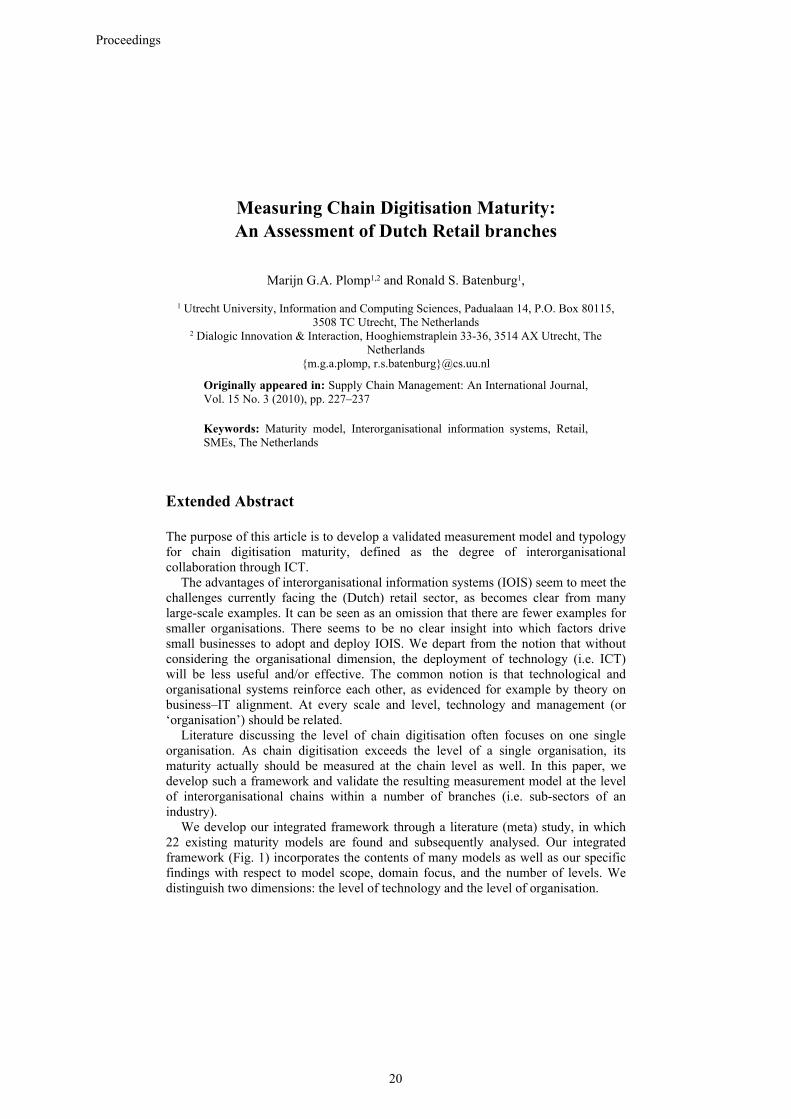
We develop our integrated framework through a literature (meta) study, in which
22 existing maturity models are found and subsequently analysed. Our integrated
framework (Fig. 1) incorporates the contents of many models as well as our specific
findings with respect to model scope, domain focus, and the number of levels. We
distinguish two dimensions: the level of technology and the level of organisation.
Proceedings
20

Fig. 1. A typology for chain digitisation.
We subsequently apply this typology to interorganisational collaboration within the
Dutch retail sector (i.e. retailers and their wholesalers, manufacturers, customers, and
trade organisations). The measurement model is tested by determining the chain
digitisation level of 24 different retail sub-sectors (branches) through desk research,
interviews, and surveys. Data are collected at the level of the branch, mainly through
representatives of trade organisations.
As a result, the model appears to be applicable to describing the Dutch retail sector
and comparing its branches, providing both expected and new insights. It is found that
in general the level of chain digitisation of this sector – as of 2007 – is low: most
branches are of the ‘limited chain digitisation’ type. Nevertheless, six branches are
positioned within the ‘relational proficiency’ type.
The empirical application provides an extended view of the current situation of the
(Dutch) retail sector with regard to chain digitisation. On this basis, a roadmap can be
derived to support the adoption and deployment of chain digitisation among retail
organisations.
Our framework for chain digitisation and the derived typology are of value to the
SCM research community, as they are specifically developed and tested at the level of
interorganisational chains. Here, the framework has been applied to the (Dutch) retail
sector only. It seems suitable for application to other sectors as well.
5th SIKS/BENAIS Conference on Enterprise Information Systems
21


Session 2:
Requirements Analysis


���������� �����������������������������������������������������
������������ �����������������������
������������������������������ ����������������������������� ��!"#"$�%��&���������'(��)***�$�%����������
+���"�������� �����"������������"���,-���"����%�".��
�������������/��� ������� ���� ����� �����/��� ��� ��0�%� ���.������/0���0�� ��� ��������� �� �����"� �0���� �.���� �0� ������� ���� �������� ��1�����2������������ ��������.���� �����������0������ ������������������� ����� ��� ����� ����"�3�� ���� ����� ����� ������� ��� �� ����� �����/��� ������������.�����0�����4�� ���0����������/���������0����������������������� �������� �0�����.����� ������ �� ������� ������������0�%����.�����"�5����.���������0���������������������������������� 0����� .� �������� �� ���� �� ��.�� ��� ���� ���/��� ��������� ��6��"��0����������0�����0�������%�� �����0�������������������2 ��1������/��0�%����.������������/��� �������������������������������������.������� �� ����/����.���2�������������0�� 0��������/�����������"��0���0��������/����.��%�� ��.��������1���������0�� �������� ������� �����������%���"� �������!�5����.����������������������������1���������0��0����1��7�����"�
"� #�����������
�0����������������0������������0����%�����������������"��0����/��� ��������������������8�9$�:� ������������������������0�%��0���������������������0��������������/�������������0����0��0��������������� ��������������1 ����"��9$��0���������.�������������%���/�����������/��� ������������������������������;((*�.��!��������"����� ��������0����<�=� �����������>;?"�=������ ���������� ��� �0�� ���/��� ������� ���� ���� �� ���� .� ������ ��� �0� /���� ���3����� �� ��"� >@?A� B=� ���/��� ������� ���� �� �� �� ��� ���/��1�����%� ����0�����������������������������������0����������0� �������������� ������1���������� ����� ��� ������ ���� �0��� ��� �%�� �� ����� �� ������� �� ��� ������������ ����.��/��C"��0��9$�� ����������������0�����/���������0��������.���� ���� �%�� ���� ��� �� ���� .�� ���� .��� �� ��� ������������ ���/��������������/�����0������������������%�� ������� �������������"�=� �������������� �� �� ��0�/� ������ ���� � ��� ���/��� ���"� �9$�� ����� ��� �0�
5th SIKS/BENAIS Conference on Enterprise Information Systems
25

���� �����������0��0�����������/���� ���������������0����� �����%����.���������������������0���������.�/���0����/���� ��������"�
5����.������ ���������0�������� ������9$�"�D��0����%����.��������0��9$�� �1�������/���������.��� �.�������0�%���0��0��%�����������������"��0�%����.����������0����/��� ���������������/��0� ��������������.����������������������0����������������2�"�=��0���0��0�2���� ������/�������������.���� ��������������������2����0��/�������������.� �������������"� �������0������0����1/��� ����/����� ���� ���� ��� ����2�� �������� ���� ����������� ������/����� .� �1�������������"�����0��/����0�����.�������0�%��.���0��������������� ����1�����/����.�8 �����:�����0������.���0��.� ���������������0����������� �����1���������0���������"��
� ����0�������0���%����.������������������� �����������0��������������0��9$�� ����������0��.������2 ���������������.����%����.�����������.��������0������/0�������/��� ����������� ��6����������� ������"��0���.�%������/����������0�2 �������������������� ��6����������������������.������������������� ���"��0� ����� ��� �� ����� ����� ��� %����.������ ������� �0� ����� 0�� ����9$���������0� ��6���%��.�����0��/���������� �����"��0������.0�����0�������0���%����.���������%���������� �������������������.����/�����.����%����1.���������� .� ������ ��� ����� ��� �� ��%� �0� ����� ��� ���� ������ �9$�� ��6��"��0����/0��/�/��������%�� �����0���������.�����0�%����.���������� ������9$������0���/0�������/��� �����������������������/����0�%����0�����������"��
�0� � ������������������� ���"��������@�������0� ��.���/�/�0������1���������%������������/���"����������)�/�������0�����0� ���������0��� � ��� ����0"� ��� �0� ������ E� ��� F� /� �0�� �.������� ���� �0� ��������� �������0�����/����/�/�0�����%�� �������0��������� ��"��������G���%���������������������������������/��0��0��������������0�����������0"�
$� ��������������������������%
D0��/����������0���������0��������������������/����������������������������������������������� �����������/���.��0� �0� ����� �0��� �0�� ���� ��1����� ��� ����� ��� �0����� �0��������� ������ ����0� ��� ��%������ �0� � �������/����>)?"��0��0���������� ���������.�������0�8����"�"�>E?:�����.��������0������/0�� ��� �� ������������ ������� ���� ��� �� ����� �0� �0�����%�� �� ������/�����������"���� ���������0�������0������������%����.���������� ����.��� �0� ����� �0��� ��� �� 8 ���%�:� ���������� ��� �� �0� �%�� �� �0���� ��� �������������������������������� ������/����/������������ ���������� ��6��������������������9$�� ��6��"��0���������������.������0���.���0�������0��������/����/������������ ��6����������������������%�������������.����0��"���� �0� �9$�� ������� ��� ��� ��� .� �%�� �� ���� �0�� ������ 2���� ���� �������� ��/0���.���������������0�%��/0���0���������������� ������8������������0������:"��0�.�����������������������������������0��������/0����0�������������������0��������� ����"�������.��������/��0��0�������0����0��%�1� �������� �� ���������� ��� �� ���/��� ������� ���� �� ���%��������������� ��1 ����������0�����������������.%�����0���"�
Proceedings
26

<����0�����������%������������������������0���� ��������������������0��9$�� ��������� �0� ������� ���� ����� �� ������ ���� �� �����"�=��� �0�� ��� ���������0��� ��.���/�������"��������0������������������� �������������������>H?�����>'?�����������0� ��.�������� �������� ��.���������������0�������������� �����������������/�����������"�D��0�������������������������������0�/���� ��%� ��������� ��.���� �0� �� ���������� ��� �0� ������� ���� �� 0�� ��� ���.�"�����0�/���������0� ��.����0������������0���� ���� ������� �����0������������� �������0��9$�� ������������������.��������0���������������1����� ����0"�<��������������0���.�����9$���������2��������������������0�����0�����.�����������/0������0��������������������������.��������������%���0����"��0������ ��0�/%���0����������� �����������������������/0����%��� �������������9$��������������0�/���0��/���������.�0�%���� ��.���/��0��9$������0������ ���"����� � ��/0������� �������������9$����� �������������������/��� ��������� ��� ������� �0� ��� ������� ������������ ���� ����� �� ����.������1��1����������/0��0�����������.�������0���������������0������� �.�����������0������2 ��"��
�0�����������������0������ ��%����0����0�����.�����.�/���0��0������� �9$�� ���� ��� �� ���������� ��� ������� >F?� .�� �������� �� ��0�������� �0��� ����.�������������� ���������0�����/0��0�%�����������9$�������������������.����������"�=���0����������0����0���������0�����0����� �����%����.���1���>G?�����0�����0�����������%���������������9$��>(?"���������.����%����1.������������.������/��0���������0�������� ���0��������0����/�������������"������������������7��0��� ��������� �������������������.�����������0���1���� �.���� %����.������ �� ����� �� ������� �0� ��������� ��������"��0����� �0���0��������/���� ����� ������������ ��� �0� ��������� ��������� 0�� ��� �0����/��� ��������� ���"� ��/� /� ��� �������� ��� ����� �0� ��0�������� ������������2 �����������������������0��2�������"�
&� ���������������'��
�������� ��� ���� �0� ��������������� ����5����.������ ��.���������/���9������� �������� I�������� ���������� �0�������� 85�9I� :� /� ����� 5�9I� �.������� �����������0�����0����������������"������������������0����������������������/����/0��0� ��%��� �0�.����������0������������ ���������.����%����.�������/������ ����0������/����.����������� ���������������������� �/�� ���/��� �����%� �������������"� �0� �������������� ��0�� �%�� � �0����/���������������������0���8�����������/��� ��%��������:�����%�� ����1/��� ��� ����� ��� ��� ��� ��� ��0�� ��� ���� 82������ ���/��� ��%��������:"� �0�����0�/������������������0������������/��� ��%����������.�����0�����2������0������������/��� ��%��������������������.��������������.���0����0����1�2������0�2���������/��� ��%��������"� �������0������0����0����������������������/��� ��%��������2�����/������/��/0�������0�2��������������������������������/�������������"��0��7�����0�������������������.�����1�� ������ ������������2��.���� �0����.����� ��.�� ������� �� ������� ��� �0����.�������������� �������/0������������������/������"��
5th SIKS/BENAIS Conference on Enterprise Information Systems
27

���������� ����0� >;*?���� ����� ����0� �� .������������������� � ��������� �������������� ����1������ ����0���0��"� ��� �� �����������%� ����0��1�0���� .��� ��� ���� ������"��0�.��� ��%������ ��� ��� ����� ����0� �� �0��� ��� ����/���.������ �0������������ ���� ������������ �������%���������� �0������0� �����/��0� ������� ������"�<�0�� ����0���0���� ���� ��������0����� 0���������0�%��0���������/��0����������.����0���������.�������������0����1�2��.�����0����������0������ ���������������.��������������������0��������������%������1�����8/0��0�/���:�/��0����������.������������������ ���� ��.��� �����%� ���� �� ����� ����0�"�=� ���/.���� ��� ��� ����� ����0� ������������.��0���������� ��.������ �������������%��������7��0����������0��1���0"��0������������������/����������0��%�� ��0� ��0������������/1.����� .��� �0����� ��.������ ������� �0�%�������� ��� �0� ����0"� ���� ��������������.�������������������������������������� ��������"�J���>;;?�����.��/����������� ��������A��������� ��������������0��������� ��������"�$������� ����1����� ������������������ �������� ��������0�� �0�����������������0������1��"��0��������� ��������� ��������0��������0����0�������������.��������0���/����0����0������������������ ���"������������0��������� ���������/����.�����.�� ���������������� �� ��� ����� ��� ��� �������� ���/��� ��%���� ����2���/0����0��������� ���������/����.�����.�������������������2���������/��� ��%��1������2��8���������������0������������/��� ��%��������2�:"�
��������/��0��������������0����������.��%�� ���������������0�%��0����0������������0���������>;;?"������������0���0�����������0���������0���������������/�����0���/�����0��.�����������������0��/��0� �0����������0������1��� ��� ����� ��� ����� �� ��� �����0�������"��0� �������� ����/���� �0���/�/���������������� ����������������0��� ���������0������/����������8������E����������F:"�������.����0�������������%�����2�������0������������0��������2 ��������� �.�%����������� ����� ������������������� .����������� �����������1 ���"��0�����/����� �����0�.��������������� ������.����%����.������ ����9$�� ����� ����� ���������� ���� 2���� �0��/��0� �������� ����� �0� �.�%���������������"��0� ��������� �����/���� ��%��� �.���������������� �������0� �0������/����/��0� �0� ������ ������� �� �0��� �0� ����/���� ���� ���/� �����������������������1��������0�������"�=���.������� �/���� �0������������%������������ �%�������������� �0������K2���������/���"����������������.���� ��� ��0����������%������������0�����0�/����.�������"��0��2�������������� �����0� ����������0�����/���A��0�������������0����� ������� ��%�������0� �������������0�������� ��������������%����.��������������������0�� ������������%����.������ ��� ������ ������ ���� ���0��������� ����������� ���� �0� ��������� ��������9$������/0��"��
(� �������)�����*����������+����#,
�9$�� ���� .� � ���� �������� ����2�"� �0���0��������/�/���� �%�� � ���� ����%�� ���� ��������� ������������ ���� ���� ���/��� �����%� ������7�����"��0����������%���������������������������"�"��%�� ������ ����������������1.�������/�����������������1 0��"��0��������%����.����������������0����1
Proceedings
28

�����������������1��%���������������1������������� �� ��������0�������7������8��L���1��1L�������7���������L�����1L���� ���:"����0�.���������0��%����������.����%�1�0������%��� ������������"�=��� ����� ��� �0��� �0� ���� ����������.��0��������7������������������7�����"��� 3��������������������������������.���������%�%�/�����0���������� ��������"��0���%�%�/����������� ����������������������.� ����"��0�� ������1��� ��������� .�� �� ����������� �%��� � ��� �������������� .�/�� �������� � ����1����"��0���%��� ���/0������������0������������������ �������������"��
�������������� �0� ��������7�� %�/� ��� �0� ��� � ������� �� ������� ��� �� �/��0��0�%����.������ ������ �0��9$�"����0�����0������ 0�������8������������:���1%����������0�� ����/�� ������ �� ��������������������� ���.���6���������������� ��� ����� ��� �.����� �� ��.�� �� ���������"� �0� ���.�������� ��� .��0��������7������������������7����������.���0�%�� ���/������0��� �0� ���� ���1�����������������������������0�.�� ���������.��.��/"��0� �� ���.�� �������.�������0����������=��0�����������/����8�=�:����3� �����������0�=�������������������/����8=��:����!�3��3����%�������������0�2 ����������������"��0� �� ������.�� �����������.��������"�;������ �����0��������������0�/0������� ���������������/��������%�L�����1L��� ���"�
�-���"���0�L�����1L���� �������� �������
<���0������������0�������/���0�0�����%���� �������8��������������1 ������:�/0��0������������0�/0������������������0������%�%�/��%�������0���� ��6�������0����������������%���� �������8������������� ������:"��0�������� ���������0� ��%������/��������0��� �������������8������� ������1����:"�� ����������0��� ����L�����1L���� ������0������������.���.�����������.�����������������������M����0�������� ����������0����� ���/��0��� ������8���� :"��0� ������� �0� ������ � ������� �� ��� ��%��� ������7�����1/������� ��� �0�������� �0��0�%�.�������� ��"��0���%�����.�/���0�������������0�������� �����������0�������������0���%�����.�/���0�������� �����������0���0��������.��0������� ����������������0�����.����������0�� ������"� ��� �0��������� �������� �0��������� ������� �0� ���� �������������������������������/����.������������������������0��7�����0����� ������"�
=��0���0� ��0�� ������7�������� .�� ����� ��� ��������� ��.��� /� � �� ���� �0�����������.������������.��.��0�2��������� ��������������.����������������"��0������� �������� �������0�.�� ���������0������������0���� ���.��1���"���� �0��2��������/�/������.�������������/����.�������0�������7�������������� �����0�"��
5th SIKS/BENAIS Conference on Enterprise Information Systems
29

.� /�����������������'������������ ���������
�0� ����� ���� ��� ���� ����/���� ������� �0� %����.��������� ���/��� ������� ������������"�=���������.�����%����.��������������������� ������9$�������0�1������������������������������/���"�I������������������.����%����.����������1�0�����0���������������.������������/�������9$�� ��6������0�%������0����������"��0������� ��� �0� ���/������������ �������� ��������.����%����.��������� ���� 2 ������� �0� ���� ����� �0�� /���� 0�%"� ��������� %����.������ ������0����������������0����� ����������������������������%����.�������������������"��0������������������/���.�� ������� �0�������� ��������.� ������������������� ��� %����.������ ������ 2 �������������/��0"����� �0� ����� �0���/��������1����/����.���������2��������/���������������������0�����������������0������� ���� ������� /���� ���� ��� ��� �0� ������ ��� ����� �������� ����� ��� ��� �0� ���"� 3��������� �0� ���0������� ��� �� ������� ��� .���� ��� �� ������ �� ���0��0� �� �0��� ���������� ���� �0� �� ���������� �0��� ��� ������� .����� � ��� �� ����������������� ������"�
<�����0��������/����� �������������������.����%����.������2 ��������������������� ��.�"���������0���������������������/��0��0������������0�������� �� ������� ����� ��� �� ��� ��� 2 �������� �������� �.���� %����.�����"� D0�� ����� �����0�����0�%���������������������������������0��������������������.��%�� ����0�������������.��������������������� ��"�I��������.����%����.��������������������������������� ����� �������/�� 0�"��
�0������ 0�����0� 0���������/0��0��������0�����������0����������������.�������0���������������������/0��0�������������������������������0�����8�0�����������������0���������:�����/0��0���������������8�0�%����.������ ��� �0� ��������:"� ������� �0�� ������� ���� �������� .�/���������������.������������������ ��������0����������0�������������0��/���� ������������������������%����.�����"��0����%������0��0������7������� ����0�������0����0������������� ��������.�����/��0�����������2�������"��
��������0������ 0�������������/0��0� ��������0�%����.�����������/����.� �� ������ ��� �0� ������� ��� �� %����.������ 8�0��� �� � ����� .�� �0� ���������:� ���� /0��0� %����.�� ��������� ��� ���� ��� �0� ������ �%��� � ������� ����� ����� �0��%�������������.���������.��"��� �����%����.�������1���� ��� �0�� ��������� �0��� �0� ������� 80���� �%��:� � ������� ���� ���� ���"� �0� 0���� �%��� � ������� �� ����� �0� %����.�� ��������� ��%��������� �����>G?�����0����0�����������0����������"��0�%��������� ���������.����������.����������0�%��������0������������.���0��������� ������"��0������������.������0����0�%����.������������0������� ���������0���������������%����.������%����� ����������������0����0��� ��������0�%����.��������0����.�������� ���������"� �0� ��0�� ���� ��� �0� %����.�� ��������� �� ������ ��� ������0����������0������0��������� �������������"��0����������� ���1���� ���%����.��������������� �� ������������������ ��������� �� �"��0� ����� 0�� �� ������ %����.���7������� .���� �0�� ���� ��� �0� ������� ���� ���������������� ����/0��� �����%����.��������� �����.���0�0�����%���� ������"�
Proceedings
30

�0������/����������8���"�@:�%�����7��0�%����.������������� ������������1����������������������� ����������"����0� 0����%�����7��.������ ���%�����/��2������0������������/0��0�� �����0����������������������������"�<���0������/��0�����/����.��;��/�0�%��0�0������7������ 0��/0��0����������0���������������������������%����.����������0���������"�<���0����0��/�0�%��0�%����.���7������ 0�����.������.��@"� �������������0�� 0��/������/0��0� ������� �0�%����.�� ��������� �� 0���� ��� �0� ��������%��������� ����� ��� �0����������������/0��0� ��������0�%����.������������� ��������������������0����������������.��� ������.���0��������%���� ������"�
����
�-���$��I��������0������7������8;:�����%����.���7������8@:�
0� /����������������'�����������
����0� �%����������/�����2 ��������������.����%����.�������.����0����������0��������������.�/��������/�"��������������������0������%����.������������������.��0������������������/��� ����������"��0������������01����� ���� � ���� %����.������ ��� �0��� �/�� /��"� �0� ��.��� 0�/%�� �� ���������0��������� ��������� �������������������� �0��� �0��� ���� �0����%�1���.�����"�3������ ��� �0� ��0����� �� �0������ �0��� �0�� � ����������������1��� ������� ��.������ ���� �0��� �0� %����.������ �� ����� ������ ��� ��"� D� ����� �������������������������� �0����� �0����� � ����� ������������������ ��01������������������������������"�
9��.�.��� �0� .�� ���/�� ������� ���� ��������� ��0����� �� �0� ������ �����>;@?"� =� ������ ����� %�����7� ���� ��.�� ������ ���.�������� ���� ��� ����������"�=����������������������� ����������������/0��0�� �������������� �����������/������"��0�%�����7��������� �0� ������ ������.���� ��������������>;@?"��0������������������ 0��������������0�����%����0�����0�������"�����������.������������������ ������������/��"�=�����������������������.�����.�������0���������������/0��0���� ����"�=������������ ���������� ���������1����/0��0������0�������������������1�����������>;)?"������������������������������� ������ �0� �%�� ���� ��� ��� �������������� ��� �0� ������������ ���"�&��1������������������������������� �����������0������������������ �1������������%����%���.���������������������������������"��
�0� ����������� ��� ������ ������������� ������ ��������� ��� �0� ����2�� ���
5th SIKS/BENAIS Conference on Enterprise Information Systems
31
%����.���������� ��.������ �0���������� �0������� ��� �������2�� ��� �0����/��� ����������"��0������0�������������������������������������������.������ �0��� �����A� ���������� ������� � ������� ������ ���� ��������%� �����"��0� �������� ����� ��� ������ ���� 0�%� �� �������� %�����7������ ��� �0� ������ ���1������� �0����0�������� ����������"��0�� ������������0���������%�����������0� ��� �0��� � ���� �0� %����.������ ��� �� ���/��� ������� ����� ���� �0� �����/��0�%����.��������2������/0���/���������������"�
�0��������0�����/0��0�������������������������������������������0�������������������������������������"�=������������%���$��/���>;E?��������� �� �� ���� ��%� ������� ��� ������ �0��� �0� ���� 0����� ������ �0����0� �0���� �����������������"�=���������0�����0�����0���������.���������.������������� ��� ����� ��� ����� ��� .� ��������"� =� ���� ��� ����� ���� .� �� 0�����������/��0��� ����������������/������ �����������������%���8"�"������:�M�5����.���������������������� �����.����������%��������"��
�0���������.�/���������������������������0������/���A���������������� ���� ��%���������0���������.��������.���0����/�������.�����%�1� ���������� ���� ���� ��%�������� �0�������.��������.�� ���� ������� �1���"����������0�������������������2��/0���0�����.�������0�����8�����0������������0����:� �����/0������������ ���� �0� ��.����������������0�����������������0����/�������/0��0�������.��%�� �"�������9$�� ��6��� .��0� ��������� ��0����� 0�%� �0��� ��%������� �� .��0� 0����� .� ��"�D0�� ����� .��0���������� ��0������ ��� 0����� .� ������� �0��� .��0� ��0������ �����0����%����.�����"�I���0��.��������������������������������������� �0�� ���� ��� ����� ��� ���� �0���/0�� %����.������ �� 2 �������� �����/��0�� ��� ��.����� �������������"��%��������������������.�������������������������.���������������������������������������������������0������������ �����0����0�����������������������������/���"�
1� �������'��������������������������+'�����2��������
�0� ���� �0�������� ������ ��� �0� �����������/���� ������� �0� ������ ��������� ������������/��� ����������"�����0� �%����������/������0��� �����������������������������.���������0�� 0�� ��� �0���������� ������� ����� � /��0� �0� ��������� %����.�����"� �� ������� �9$�� �� ��%���� ����� �/�� ���������� ������ ������� ��������� ���� � ��������� ��������� >;H?"� �0� ���������������� ����� �� �������� /��0� �0� �%�� ���� ��� ������� ��"� <��� �0���������������%�� ����0���������0��.���������0�� ������������1�������������0�������������������0� ��������������������.��%�� �"���0�5�9I� �����/�������0��������� �0�������������@�������%�� ����.��21����������/��0����2��������"��0��������������0�������0������������������������������/0��0��0��������%�� ��/��0� ���������������%�������%����1.�����"� �0� ����� ����� �� �0� � ��������� ������������� ����"� �0�� ����� ����0�������0� �0� ������������ � ��������� ��������� ����"� �0� %����.������ ����� ��� �0��������������.�����/��0� ������%������������0�������0��������7��8��� ��1 ������ ���������:������0�����������������"��0��0����������������������
Proceedings
32

�-���&��9�������������������������
���������������������������������0�������������.�1����� ����/0��0�����/��0��0�������� ������ 2������ ��� �0� ��/� ������7�� ��� .�� �0� ������ � ������"� ��������������� �9$�� �0�� ���� ����� �� 8�� �������:� ���� ��� �0� � ��������� ��������������� .���/� ������������ �0�� �����������.���� �0� 2������� ����%���� �������������������0�������7��������%���"�$�����7��������������0����/���/��0��0������ ��� ��.�� %������� ���� ���� ������� ������.���/0��� 2������ ��� �� ��������.�� �����"� ����� �������� ���� ���� ����� ���� � ��� ��� .��0� 0�� �0��0�����.� ����� ����������.������������������ ������������������� "�������"�)� �0� �0����������� �����.�����.�������/"�&��.��;� �� �0���1����� ��� ����� /0�� �0� ������� ���� ���� �0� � ����� %����.������ ���� �������������.��@� �� �0� ������7���������/0�� �0�� �����%����.������ �� ������ ���� ������ ��� �0� ����2�� ���� ���.�� )� � ���� �0� 2������ �����/0�� ��������������� ��� ���"� �0� ����� ��� �� �� ������� �0� ��� � ������� �������� ���������E������������0�/��0����������� ��������������0�����"�
3� /������!���������������%����������
����0� �%����������/�0�%�����.����0� �����������������/���"�=� �������� �0�� � ��� �0� ����/���� ����� �%� �� �� �������� ����� ���� �0� ��� �����/� �������������������.��������������2����������������.���� ��"�<�� ��.��2����������0�����/����/0��0�/����.���������������0������������0� ��1.������ ��� ����� �� ������� ��0��� ���� �������������� .�/�� ����� ����� ���� �1�������� ����"� =���0�� ��������� ��� �0� ����/���� ��������� ����� ����� �� �0�2������������������������9$����/������%���<������9�������$�������������8�<9$�:"�����0��2������/���������������������/0��/������� ������0��������������.������� �0�����/���"��0� �����������.6���%������������0� �� ����0��������������0�����/���������0����%��/��.������������������� �����0�1�����������������%����.��������������/��� ����������"�
=����� ����� .�� �0� 2 ��������� ��� �0� ������ ��� �0� ����/����� �0� �0���� ����������� �9$�� �� �%����.�� ��� ����0�� .��� �0� ����� ��/���� ������� ����� �����
5th SIKS/BENAIS Conference on Enterprise Information Systems
33

�����0�������0����/0��5�9I� �/�������������� ��%�����"�<����0���0�1������������ ������0������/����� �/����.�������������5�9I� ��������� �1��� ���� ��� �0��� /��� ����� �/� � ��������� ���� ����0�� 2 ��������� ��� � �����������0"�
��%�������������
D����������������/����!�3����.�����%���&5�8��.����� �0�!�3����� :��������������0������0��0����0��0�!�3�����0��0����N�%�� �������� ���������������%������0����=�N"�
����������
;"� !�����!"3"��3�0��� �"�"����� O"="��&�%����D"�"�� 9������="�"A� �����1<��������1�����=������8�<�=:A����.����������"�����/������������� ���������3������ �����#��%�����8;((*:�
@"� 3������9"��&���0�� ��$"A�����/��� ����������A� ����������� �����"�=�����1D���$�������9�.��0�����������8@**;:�
)"� =�%��5"��&����&"��=�%��3"��5���P����"A�I������������������������/��� ����������A�=��������� ����������%�/"���������������������/�����0�������H@�� "�G*'�11�G@*�8@*;*:�
E"� ��.��2�� ="�� ������� 9"�� ���%���� �"A� 5����.������ �������� 30������ ����� �0�����0�������< ��������9�������$���I1����������9��6��"���� �������������3���1�����������/���9�������$���� "�HH�11�'E�������3�� ������������$�������8@**G:�
H"� $�������"�O"����0����!"��I������"A�����/���9�������$������=�����A��0�����������1���9����������9�������$������������"�� �����15������������8@**F:�
'"� $��!"��!�����!"3"��$��O"A�3��� ����������������������� �����������9�������$�������/������������"�����������������3��������������/���I��� "�'@�Q�FF��� ���1��15������=�����8@**@:�
F"� 30���$"��=�����.���� "��=����&"A�5����.���������������������/��� ����������A�����1�������%�/"���A�9������������0�;)�0������������������/���9�������$���3�������� "�G;�11�(*��3������ �����#��%�������������������8@**(:�
G"� !�����"�"������O"�"��30������"�"A�=��0����������������������5����.���������3�� ����1�����%�� ���"���������������������/�����0������"�EF�� "�'')�11�'F)�8@**H:�
("� �%�0�.���� "��%������ ��O"�����0��O"A�=���2���������5����.������I���7��������0����"�����/���9�������R��2 �����)H��� "�F*H�Q�FHE�8@**H:�
;*"����%��� "A�S��������%�����0��0����0��������"�����9�.������������"��$��=�����8@**;:�
;;"�J����I"!"A�3��������I���0A���������� �0��"�����9�.������������"��$��=�����8@**(:�
;@"�37��������!"����������#"�D"A�������%�9����������A� �0��������������= ����1����"�=3 �9�K=�����1D���9�.��0����3�"��&/�J����8@***:�
;)"�I�.������ �"�I�.������ O"A� ������� �0� I�������� 9���"� =3 � 9�K=�����1D���9�.��0����3�"��&/�J����8;(((:�
;E"�%��� $��/���="A� I�������� ���������A� ����� ���������� ���# $� ���� �������/���� ����������"�D�����30��0���8@**(:�
;H"�9�0���!"���T������"��$�������"�O"A�����/���9�������$������������A�������������9���1�� ��������0����"�� �����15������&/�J����8@**H:�
Proceedings
34
A Survey of Variability ManagementRequirements
Marco Aiello, Pavel Bulanov, and Heerko Groefsema
Johann Bernoulli Institute for Mathematics and Computer ScienceUniversity of Groningen, Nijenborgh 9, 9747 AG Groningen, The Netherlands
{m.aiello, p.bulanov, h.groefsema}@rug.nl
Business process management (BPM) is impacting medium and large scale en-terprises enormously these days. Designed to support rigid and repetitive unitsof work like production processes, business process models offer little in the areaof flexibility and reuseability [1, 3]. By introducing variability to the world ofBPM, many new possibilities are introduced.
An example comes from eGovernment. In the Netherlands there are 430 mu-nicipalities that have to implement the same national laws, though, they aredifferent in size, business models, IT infrastructures and so on. Recently theWMO law (Wet maatschappelijke ondersteuning, Social Support Act, 2007) wasapproved that mandates, for instance, the rules for providing publicly subsi-dized wheel chairs to needing citizens. All municipalities have to implement thisprocess, each with slight but clearly noticeable differences related to their orga-nizational and IT structure [5]. The recurrence of the need to adapt processes toinstances and changes become concrete with the notion of variability [4], whichfirst emerged in software engineering. Variability in this case refers to the possi-bility of changes in software products and models.
In [2], of which this text is an abstract, we propose to use variability inorder to take full advantage of the obvious reusability opportunities in suchsituations. Variability in this context, namely that of BPM, indicates that partsof a business process remain variable, or not fully defined, in order to supportdifferent versions of the same process depending on the intended use or executioncontext. Such variability is often included through the introduction of so-calledvariation points, that is, elements of a business process where change may occur.A process in which variability is included is called a reference or generic process.Processes where choices have been made deriving from the reference process arecalled variants.
We introduce variability management as an extension of the typical activitiesinvolved in business process management. We give a general depiction in Fig-ure 1. On the left, we notice how requirements drive the definition of the designprocesses. Variability management complements these general BPM phases byintroducing a set of parallel stages, on the right in the figure. In this context,two main stages are introduced: design-time and run-time variability.
In [2], after defining variability in business process management, we considerthe requirements for explicit variation handling for (service based) business pro-cess systems. eGovernment serves as an illustrative example of reuse. Finally, an
5th SIKS/BENAIS Conference on Enterprise Information Systems
35

Fig. 1. Process lifecycle and variability management.
evaluation of existing tools for explicit variability management is provided withrespect to the requirements identified. A video illustrating a first prototype tomanage service-based business processes with explicit support for design timevariability is available at http://www.sas-leg.net/web/index.php?n=Main.Demo2010.
Acknowledgements
The research is supported by the NWO Jacquard program via the SaS-LeGproject, http://www.sas-leg.net contract 638.000.000.07N07. We thank P.Avgeriou, N. van Beest, F. van Blommestein, A. Lazovik, D. Tofan, and H.Wortmann for fruitful discussion.
References
1. van der Aalst, W., Jablonski, S.: Dealing with workflow change: Identification ofissues and solutions. International Journal of Computer Systems, Science, and En-gineering 15(5), 267–276 (2000)
2. Aiello, M., Bulanov, P., Groefsema, H.: Requirements and tools for variability man-agement. In: Requirement Engineering for Services (REFS 2010) at COMPSAC.IEEE (2010)
3. Rinderle, S., Reichert, M., Dadam, P.: Correctness criteria for dynamic changes inworkflow systems: A survey. Data and Knowledge Engineering 50(1), 9–34 (2004)
4. Sinnema, M., Deelstra, S., Hoekstra, P.: The covamof derivation process. In: ICSR.pp. 101–114 (2006)
5. Sun, C., Rossing, R., Sinnema, M., Bulanov, P., Aiello, M.: Modelling and manag-ing the variability of web service-based systems. Journal of Systems and Software,Elsevier 83, 502–516 (2010)
Proceedings
36

Current Status and Future Perspectives of Drug Information Systems
Tommi Tervonen1, Bert de Brock2, Pieter A de Graeff3,. Hans L Hillege4
1 Econometric Institute, Erasmus University Rotterdam, The Netherlands, [email protected]
2 Faculty of Economics and Business, University of Groningen, PO Box 800, 9700 AV Groningen, The Netherlands, [email protected]
3 Department of Internal Medicine/Clinical Pharmacology, University Medical Center Groningen, PO Box 30.001, 9700 RB Groningen, The Netherlands,
[email protected] 4 Department of Epidemiology/Cardiology, University Medical Center Groningen, PO Box
30.001, 9700 RB Groningen, The Netherlands, [email protected]
Extended Abstract We consider the current status and future perspectives of Drug Information
Systems (DISs) from an IS point of view. The information lifecycle of a drug starts already during the drug discovery phase and continues far into the future in prescription- and adverse-effect databases. The drug lifecycle consists of the disjunct phases of discovery, development, approval, and marketing.
Each phase is supported by various types of DISs. We distinguish the following types of DISs: compound databases (containing the physico-chemical structural data for the computational drug discovery methods), (pre-)clinical trial databases (containing the - raw or aggregate - data of (pre-) clinical trials), SmPC databases (containing Summary of Product Characteristics, the source of information visible to non-professionals through drug labelling and package inserts), ADR databases (containing data on Adverse Drug Reactions), and CPOE systems (Computerized Physician Order Entry systems, automating the human error-prone parts of the process of the prescribing physician, especially with regard to drug prescription).
In this paper, we describe the past literature and existing technology of Drug Information Systems. We develop a mapping of DISs to the phased drug lifecycle, taking into account the system information contents. The mapping shows that currently there is a lack of DISs providing efficacy- and safety-data in a suitable format. This lack severely hinders the possibility of physicians, researchers, as well as regulatory authorities and the pharmaceutical industry, to make quantitative analyses of efficacy and safety over a wide range of drugs.
Drug development, testing and administration are information-intensive areas with varying computing needs. These range from storing a single drug’s labeling information to complex algorithms for analyzing quantitative structure-activity relationships in the drug discovery process. We use the term Drug Information System (DIS) for any system that stores data related to some phase(s) of the drug
5th SIKS/BENAIS Conference on Enterprise Information Systems
37

lifecycle, and that processes it into user relevant information. DISs have various uses in, for example, recording clinical trial results, disseminating findings of adverse drug reactions, and operational support in a hospital environment. Although the amount of clinical health research is growing rapidly, the supporting operational systems have only recently received comparable effort in research.
The past few years have seen a rise in the amount of research in DISs, but the majority of health information systems literature seems to concentrate on DISs as a tool to improve drug prescription processes and focus on health care safety in a clinical environment. However, in order to support clinical pharmacological decision making and to access and aggregate information from the complete drug lifecycle, it is crucial to have an overview of existing DISs.
A clear overview of existing DISs enables processes dealing with information gaps between discovery, development, regulatory approval, and pharmacovigilance stages. The main motivation to fill these gaps is the need for a reform of the regulatory process recently brought into discussion by regulatory bodies, academia, and industry. In order to improve management of drug information, we need an overview of DISs nowadays available and contributing to the drug lifecycle. More structured information will lead to improved transparency in the decision making process of regulatory authorities. There exists evidence that even published clinical trial results have had statistical evidence interpreted incorrectly in order to appear positive. Transparency of the process could help to find such incorrect analyses as the original studies would be linked with the aggregated results, and finally, with the marketing authorization decisions that (in principle) take into account all relevant clinical data.
This survey considers the existing literature and DISs from a perspective that is, up to our best knowledge, new in the area. We review the existing technology and DISs from a functional point of view, providing an overview of the current state of the technology. Although we briefly present drug discovery systems, we concentrate on clinical data from drug development. The review is followed by a mapping of the existing systems to the various phases of the drug lifecycle. This mapping should be taken as a starting point for information integration across DISs. The mapping allows finding possible integration points between DISs of different phases, which can eventually lead to information re-use, to improved communication, and following this, to shortened drug development cycles.
The meta-analytical approach as applied in the Cochrane Library seems to be the most appropriate starting point for building the next generation DISs for regulatory uses. The future systems should store all required measurements in a numerical format with strict semantics. For aggregate clinical trial results, we are currently working on building such a system (see http://www.drugis.org).
• This study was performed in the context of the Escher project of the Dutch Top Institute Pharma.
• The full paper appeared in the proceedings of ECIS 2010 (Pretoria), see http://web.up.ac.za/ecis/ECIS2010PR/ECIS2010/Content/Papers/0004.R1.pdf.
Proceedings
38

Session 3:
Collaborative Modelling


Value-Sensitive Design forCross-Enterprise Regulation∗
Sietse Overbeek, Virginia Dignum, and Yao-Hua Tan
Faculty of Technology, Policy and Management, Delft University of Technology,Jaffalaan 5, 2600 GA Delft, The Netherlands, EU{S.J.Overbeek,M.V.Dignum,Y.Tan}@tudelft.nl
Over the past several years, the business community has devoted consider-able attention to corporate responsibility, in order to address significant socialand environmental questions with value for business and society. Organizationalactivities are expected to be transparent to governments, investors, and otherstakeholders. Enterprises, governmental institutions, and the public in generalbenefit from well-defined and well-enforced laws and legal guidelines, in order toprotect companies from manipulations of financial reporting data. Traditionally,control and enforcement were government tasks, however, the advent of sound ITsupport and the increasing cost and complexity of regulation are leading towardscollaborative regulation between enterprises and governments.
Regulation of organizational processes is based on the norms that organiza-tions have to comply with. A norm can be defined as standard behavior thatis acceptable for the regulating institutions, indicating desirable behaviors thatshould be carried out as well as undesirable behaviors that should be avoided [4].Norm enforcement mechanisms are used to determine if organizations have com-plied to the norms that they should satisfy [1]. If norms are to be enforced, thenthe institution should specify and handle sanctions for every possible violation ofthe norms. This means that enforcement mechanisms often require the introduc-tion of special ‘regulator actors’ that actively monitor the behavior of the otheragents [1]. Such agents are assigned to monitor the behavior of organizationsand sanction them in case of norm violations. Implementing self-regulation as acontrol mechanism results in a redistribution of control tasks among the actors.
Which enforcement mechanisms are effective and how sanctions are likelyto be followed is directly related to the values of an organization. Moral val-ues are the standards of good and evil that guide an individual’s behavior andchoices [5]. Individuals, groups, and societies develop own value systems usedfor the purpose of ethical integrity. The value notion and the two mentioneddifferent types of norm enforcement mechanisms can be combined to design avalue-sensitive system that supports agents in norm fulfillment and norm en-forcement. Value Sensitive Design (VSD) is a methodological design approachthat aims at making moral values part of technological design, research, and de-velopment [2]. Values are typically high-level abstract concepts that are difficult
∗Published as: Overbeek, S., Dignum, M., Tan, Y.H.: Value-sensitive design forcross-enterprise regulation. In: Proceedings of the 1st International Workshop on CrossEnterprise Collaboration, People, and Work (CEC-PAW10) held in conjunction withthe BPM 2010 Conference, Hoboken, New Jersey, USA, September 13, 2010.
5th SIKS/BENAIS Conference on Enterprise Information Systems
41

to incorporate in software design. In order to design systems that are able to dealwith moral values, norms must be operationalized while maintaining traceabilityof its originating values. This change calls for architectures that satisfy the fol-lowing principles: (1) coordination policies need to be described at a high levelof abstraction; (2) the enforcement needs to be negotiated between governmentsand enterprises; (3) coordination policies need to be formulated explicitly ratherthan being implicit in the interactions; and (4) it should be possible to deployand enforce a policy incrementally.
An increasingly important value in organizations is that of ethical and trans-parent business practices. The development of codes and standards for ethicaland transparent business practices can help limit corruption, ensure fair andopen competition, and encourage a better business environment. A formalismfor values must be able to describe and reason about social structures and in-teractions, facilitating analysis and verification through logical reasoning. More-over, in open systems where agents are assumed to be autonomous and rational,agents can, involuntarily or by deliberate choice, violate social norms and reg-ulations and therefore one must be able to deal with and reason about suchviolations. In normative systems, interactions between actors are regulated bynormative templates that describe desired behavior in terms of deontic conceptssuch as obligations, prohibitions, permissions, deadlines, violations and sanctions[3]. Deontic logic provides mechanisms to reason about violability of norms, thatis, about how to proceed when norms are violated.
The results of our research provide the basis for a value-sensitive systemto support actor agents in norm fulfillment and regulating agents in norm en-forcement. This foundation has been laid by applying a value-sensitive systemdevelopment process and by incorporating the principles of the norm enforce-ment mechanisms of direct control and self regulation in the system design. Byfollowing this specific system development process, the value that is created forthe agents that apply the norm enforcement mechanisms of direct control andself regulation is explicitly incorporated in the development of the system.
References
1. Burgemeestre, B., Hulsteijn, J., Tan, Y.H.: Towards an architecture for self-regulating agents: a case study in international trade. In: Proc. 2nd Multi-AgentLogics, Languages, and Organisations Federated Workshops, Italy. CEUR Work-shop Proceedings, vol. 494 (2009)
2. van den Hoven, M.: Design for values and values for design. Information Age +,Journal of the Australian Computer Society 7(2), 4–7 (2005)
3. Jones, A., Sergot, M.: A formal characterisation of institutionalised power. Journalof the IGPL 4(3), 429–445 (1996)
4. Meneguzzi, F., Luck, M.: Norm-based behaviour modification in bdi agents. In:Sierra, C.e.a. (ed.) Proc. 8th International Joint Conference on Autonomous Agentsand Multiagent Systems (AAMAS 2009), Hungary. vol. 1, pp. 177–184 (2009)
5. Scott, E.: Organizational moral values. Business Ethics Quarterly 12(1), 33–55(2002)
Proceedings
42

Challenges of Involving Stakeholders WhenCreating Enterprise Architecture
A. (Agnes) Nakakawa1, P. (Patrick) van Bommel1, and H.A. (Erik) Proper1,2
1ICIS, Radboud University NijmegenP. O. BOX 9010 6500, GL Nijmegen, The Netherlands2CITI, CRP Henri Tudor Luxembourg, Luxembourg
[email protected], [email protected], [email protected]
Abstract. Although researchers report challenges that occur during en-terprise architecture development (in general), there is lack of an elab-orate description of those that occur during enterprise architecture cre-ation – particularly if organizational stakeholders are to be deeply in-volved. Yet understanding challenges of involving organizational stake-holders when creating enterprise architecture is a prerequisite for devis-ing a relevant solution to enterprise architects. An exploratory surveywas therefore conducted with the aim of investigating challenges thatenterprise architects face when they involve organizational stakeholdersduring enterprise architecture creation. This paper presents and discussesfindings from the survey. The survey results generally indicate why 90%of enterprise architects face challenges when delivering products of enter-prise architecture creation, although 96% of architects closely collaboratewith organizational stakeholders during enterprise architecture creation.Keywords: Enterprise Architecture Creation, Stakeholder Involvement.
1 Introduction
Since architecture “is the normative restriction of design freedom”[2], enterprisearchitecture can be conceived as a normative instrument (in the form of prin-ciples, views, and models) that directs and informs a given transformation inan organization [11]. Enterprise architecture can be used for: decision makingregarding an intended business transformation; formulating business strategy im-pact; specifying (business) requirements; and informing and contracting serviceproviders [13]. The main threats in enterprise architecture development include:choosing an ineffective leader as the lead enterprise architect; and not involvingbusiness (or organizational) stakeholders in the architecture program [3]. How-ever, involving stakeholders in the architecture development process tends toresult in several challenges. In [15] it is was reported that collaboration betweenstakeholders and enterprise architects is often challenging. However, there is lackof an elaborate description of the problematic nature of this collaboration, orof the challenges that arise if organizational stakeholders are to be involved inenterprise architecture development. Yet such a description is a prerequisite fordeveloping a relevant solution to practitioners (in this case enterprise architects).
5th SIKS/BENAIS Conference on Enterprise Information Systems
43

Therefore, there was need to investigate the challenges architects face whenthey involve organizational stakeholders in enterprise architecture development.Since developing enterprise architecture involves creating (designing/specifying);applying (implementing); and maintaining the architecture to support an organi-zation’s business goals [13], investigations of these challenges were limited to cre-ating architecture. To investigate challenges that enterprise architects face whenthey involve stakeholders in creating an enterprise architecture, an exploratorysurvey was conducted. The survey specifically investigated: factors that hindereffective collaboration among organizational stakeholders and enterprise archi-tects; challenges architects face when evaluating enterprise architecture designalternatives; methods architects use to manage collaboration with stakeholders;strengths and weaknesses of the methods used to support collaboration betweenstakeholders and architects; challenges architects face when delivering architec-ture products; and key determinants for successful enterprise architecture cre-ation. A sample of 70 enterprise architects participated in this survey.
This paper discusses findings from this survey. The findings generally indi-cate the practical relevance of devising an artifact that will improve enterprisearchitecture creation by offering support for effective and efficient stakeholderinvolvement in the enterprise architecture creation process. The survey was con-ducted as part of an ongoing research (reported in [10,11,12]) that generally aimsat developing a standard (but flexible) approach that can support effective andefficient collaborative problem solving and decision making during enterprise ar-chitecture creation. The survey findings serve as a motivation for this research.Section 2 discusses the rationale for undertaking an exploratory survey, section3 explains the survey design, section 4 discusses the survey results, and section5 gives the conclusion and ongoing work.
2 Rationale for an Exploratory Survey
According to [8,9], activity theory articulates that: artifacts (i.e. tools, symbols)mediate between the subject (i.e. the important actor(s) in an activity) and theobject (i.e. the objective of an activity); there are rules that influence or governthe execution of an activity; the execution of an activity involves a community ofactors; and the execution of an activity requires division of labour. The process ofcreating an enterprise architecture can be conceived as an activity (or collectionof sub activities that contribute to completion of the main activity). Thus, table1 shows how the notions in the activity theory have been interpreted and adaptedin this research.
All aspects of the activity theory (see column 2 of table 1) are explicitly in-terpreted in the context of enterprise architecture creation (see column 3 of table1), except item 6 (i.e. the division of labour). According to [19], during enterprisearchitecture development, an enterprise architect must identify all stakeholders’concerns, and then develop architecture views that reflect how all concerns willbe addressed in the architecture and the intended tradeoffs. This implies (asshown in step 6 of table 1) that in enterprise architecture creation, there are: (1)
Proceedings
44
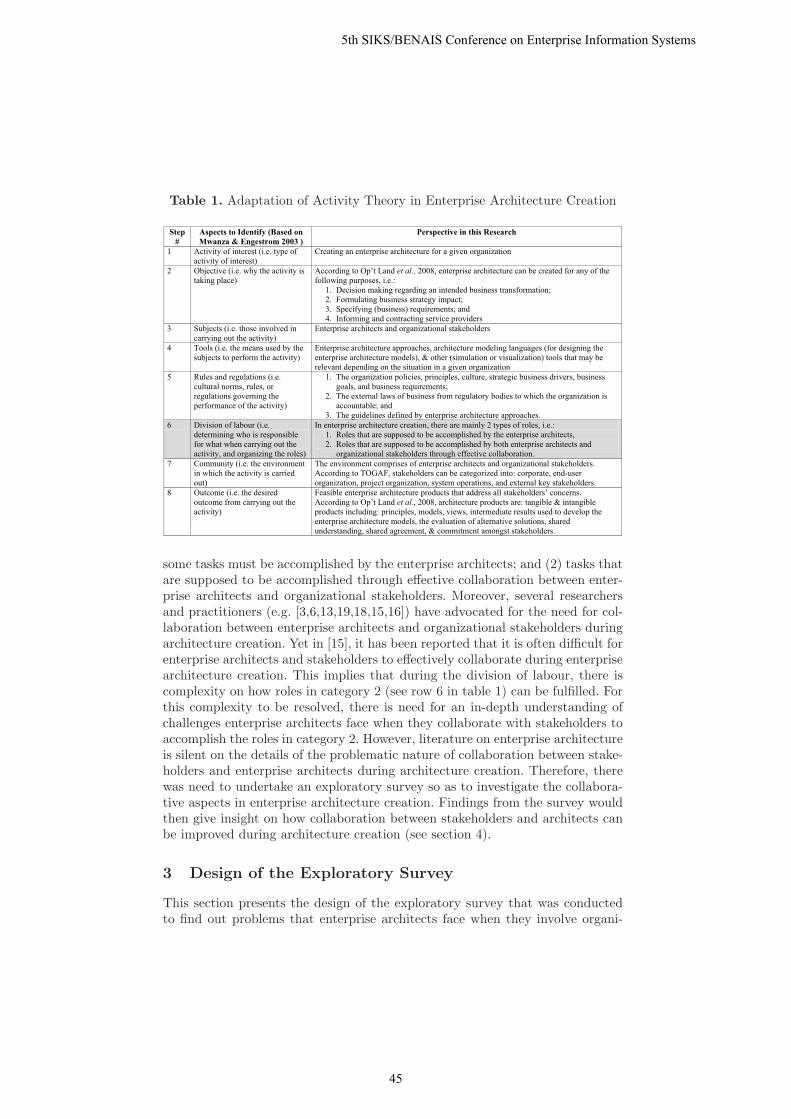
Table 1. Adaptation of Activity Theory in Enterprise Architecture Creation
Step #
Aspects to Identify (Based on Mwanza & Engestrom 2003 )
Perspective in this Research
1 Activity of interest (i.e. type ofactivity of interest)
Creating an enterprise architecture for a given organization
2 Objective (i.e. why the activity is taking place)
According to Op’t Land et al., 2008, enterprise architecture can be created for any of the following purposes, i.e.:
1. Decision making regarding an intended business transformation; 2. Formulating business strategy impact; 3. Specifying (business) requirements; and4. Informing and contracting service providers
3 Subjects (i.e. those involved in carrying out the activity)
Enterprise architects and organizational stakeholders
4 Tools (i.e. the means used by the subjects to perform the activity)
Enterprise architecture approaches, architecture modeling languages (for designing the enterprise architecture models), & other (simulation or visualization) tools that may be relevant depending on the situation in a given organization
5 Rules and regulations (i.e.cultural norms, rules, or regulations governing the performance of the activity)
1. The organization policies, principles, culture, strategic business drivers, business goals, and business requirements;
2. The external laws of business from regulatory bodies to which the organization is accountable; and
3. The guidelines defined by enterprise architecture approaches.6 Division of labour (i.e.
determining who is responsible for what when carrying out the activity, and organizing the roles)
In enterprise architecture creation, there are mainly 2 types of roles, i.e.:1. Roles that are supposed to be accomplished by the enterprise architects, 2. Roles that are supposed to be accomplished by both enterprise architects and
organizational stakeholders through effective collaboration. 7 Community (i.e. the environment
in which the activity is carried out)
The environment comprises of enterprise architects and organizational stakeholders. According to TOGAF, stakeholders can be categorized into: corporate, end-user organization, project organization, system operations, and external key stakeholders.
8 Outcome (i.e. the desired outcome from carrying out the activity)
Feasible enterprise architecture products that address all stakeholders’ concerns. According to Op’t Land et al., 2008, architecture products are: tangible & intangible products including: principles, models, views, intermediate results used to develop the enterprise architecture models, the evaluation of alternative solutions, shared understanding, shared agreement, & commitment amongst stakeholders.
some tasks must be accomplished by the enterprise architects; and (2) tasks thatare supposed to be accomplished through effective collaboration between enter-prise architects and organizational stakeholders. Moreover, several researchersand practitioners (e.g. [3,6,13,19,18,15,16]) have advocated for the need for col-laboration between enterprise architects and organizational stakeholders duringarchitecture creation. Yet in [15], it has been reported that it is often difficult forenterprise architects and stakeholders to effectively collaborate during enterprisearchitecture creation. This implies that during the division of labour, there iscomplexity on how roles in category 2 (see row 6 in table 1) can be fulfilled. Forthis complexity to be resolved, there is need for an in-depth understanding ofchallenges enterprise architects face when they collaborate with stakeholders toaccomplish the roles in category 2. However, literature on enterprise architectureis silent on the details of the problematic nature of collaboration between stake-holders and enterprise architects during architecture creation. Therefore, therewas need to undertake an exploratory survey so as to investigate the collabora-tive aspects in enterprise architecture creation. Findings from the survey wouldthen give insight on how collaboration between stakeholders and architects canbe improved during architecture creation (see section 4).
3 Design of the Exploratory Survey
This section presents the design of the exploratory survey that was conductedto find out problems that enterprise architects face when they involve organi-
5th SIKS/BENAIS Conference on Enterprise Information Systems
45
zational stakeholders in the enterprise architecture creation process. The targetrespondents in this survey were enterprise architects. Self administered question-naires were used (see Fig. 1 in appendix), and were pretested using 10 enterprisearchitects. Prior to the survey, the suitable sample size and sampling methodhad to be determined. According to [7,17], the appropriate sample size to use ina survey depends on: (1) the acceptable sampling error, i.e. the error that oc-curs in survey results due to studying a sample instead of the whole population;(2) the size of the population and its heterogeneity with respect to the featuresof interest; (3) the desired level of accuracy (or confidence); (4) the researchbudget; and (5) the desired statistical value, i.e. population mean or populationproportion – the percentage of individuals who fall into a given category. Forthis survey the desired level of accuracy was at least a 95% confidence interval,and acceptable sampling error was ± 10%. The statistical values required fromthe survey were percentages of the target population (i.e. enterprise architects)who experience or do not experience the aspects this research was investigating.Therefore, the following formula, as defined in [5,7,17], was used to calculate therequired sample size in this survey:
s =z2(p(1 − p))
e2
Here s represents the required sample size, z represents the number equivalentto the desired level of confidence, p represents the estimate of the proportion ofpeople (i.e. enterprise architects) falling into the whole population of the targetrespondents, and e represents the acceptable sampling error. The self adminis-tered questionnaires were to be posted on international, national, and corporatemailing lists of enterprise architects. Thus, it was assumed that at least 90%of the population or subscribers to these mailing lists are enterprise architects.Hence the value of p is 90%. Moreover, since the desired level of confidence was95%, then from the z statistical tables z = 1.96. Since the acceptable samplingerror was ± 10%, then e = 0.1. Inserting these values in the equation above, s =35. Therefore, the required sample size was at least 35 enterprise architects. Inother words, assuming 90% of subscribers on mailing lists of enterprise architectsare real architects, then for us to be at least 95% confident that the conclusionswe draw from the survey results have a sampling error of ± 10%, at least 35enterprise architects were required to participate in this survey.
The next step was to determine the appropriate method for selecting therequired sample of architects. Sampling methods are divided into two categoriesi.e. probability sampling methods (which are used when the list of the wholepopulation of study is available and it is possible to determine the likelihoodof selecting any of the population units) and non probability sampling methods(which are used when the list of the population of study is not available and isdifficult to obtain) [5,14,17]. In this survey the list of the target population (i.e.all enterprise architects) was not available and was difficult to obtain. Therefore,a non probability sampling method was used, i.e. purposive (or purposeful) sam-pling. Purposeful sampling is used when there is need to study and understandsomething about, or features of, a specific group of people [14]. The survey was
Proceedings
46

conducted online (i.e. via http://www.thesistools.com/), where the targetrespondents received the questionnaires through the mailing lists of enterprisearchitects. A maximum of 70 enterprise architects participated in this onlinesurvey. This response doubled the earlier required sample size of 35 participantsand consequently lowered the sampling error to ± 7%. This implies that weare 95% confident that the findings, or conclusions drawn, from the survey (seesection 4) have a sampling error of ± 7%.
4 Survey Results and Discussion
In this section results from the exploratory survey are presented. These include:the problems architects face when collaborating and evaluating architecturedesign alternatives with stakeholders during architecture creation; challengesencountered when delivering enterprise architecture products; insights on howproblems encountered during enterprise architecture creation can be overcome;and methods enterprise architects use to manage collaborative tasks during ar-chitecture creation. Aspects presented in sections 4.1 – 4.6 can be perceivedas (research) requirements that must be fulfilled in order to improve enterprisearchitecture creation through effective and efficient stakeholder involvement.
4.1 Factors Hindering Effective Collaboration
Since collaboration (between stakeholders and enterprise architects) is a corethread in enterprise architecture creation [12], it was vital to investigate thehindrances of its effectiveness and efficiency during architecture creation. Thefollowing were reported as the factors affecting it. The percentage of enterprisearchitects that experience each hindrance is given in brackets.
1. Time constraints i.e. unavailability of key stakeholders because they haveno time or priority to collaborate, and yet project time schedules are taut(77%).
2. Organization politics, hidden agendas of stakeholders (which cause them toblock a long term vision due to their short term needs), prima donna be-haviors (i.e. self-centeredness) of some stakeholders, and cases where peoplein the organization do not want clear decision making due to selfish reasons(56%).
3. Difficulty in truly understanding and communicating with stakeholders be-cause architects mainly talk about abstract concepts and are unable to ex-plain the true value of architecture in a language that the key decision makersunderstand, while stakeholders use words that do not have the same meaningfor everyone (50%).
4. Lack of a well founded and shared vision on the business itself, its futuredevelopment, its enterprise architecture, and the consequences of the archi-tecture on the organization’s sub levels. This is because some people find itdifficult to imagine a new situation (47%).
5th SIKS/BENAIS Conference on Enterprise Information Systems
47
5. Lack of architecture governance and a strong decision making process whichleads to stakeholders not taking responsibility for their decisions (47%).
6. Limited awareness of (infrastructure) architecture or the need for architec-ture, stakeholders’ perception about architecture (e.g. architecture is per-ceived to be about only technology), and the gap between (business) opera-tions and enterprise architecture (44%).
7. Lack of long term planning e.g. long term effects may not be consideredas part of the business case or project goal, members of the architectureproject (i.e. business and IT staff) may be unknown, project managers maybe assigned late when projects are already on critical path (42%).
8. Social complexity of an organization, conflicting agendas or interests of stake-holders, differences in stakeholders’ perception about ambition levels, andthe ladder of inference - i.e. stakeholders overreacting or quickly drawingconclusions based on personal beliefs, insecurities (40%).
9. Lack of documentation of knowledge in the organization (31%); the old fash-ioned distinction between business and IT (30%); and the “not inventedhere” syndrome of stakeholders (27%).
10. Lack of methods, tools, and techniques for supporting collaboration (17%).11. Constrained project budgets (24%) and the “100% syndrome” of the archi-
tect (16%). Other factors include cases where stakeholders are unqualifiedfor tasks assigned to them, or have an attitude of “the outsider is the expertbut the outsider does not understand our situation” (3%).
Hindrances 3 – 9 and 11 above arise due to lack of a shared understanding(among stakeholders) of the aspects pertaining to the problem or challenge theorganization is facing, and aspects pertaining to the (possible) solutions to ad-dress the problem. Where enterprise architecture development is the appropriateway of synergizing the formulation and implementation of the possible solutions.A shared understanding among stakeholders can be created through effective andefficient collaboration between stakeholders and architects, and as the level ofshared understanding increases, stakeholders are motivated to effectively collab-orate so as to achieve a successful architecture process [12]. Consequently, issueshighlighted in hindrances 1, 3 – 9, and 11 will be (hopefully) overcome, sincethe value of architecture will have become explicit to the stakeholders. There-fore, the key requirement for addressing hindrances 1, 3 – 9, and 11 above, isto deploy into the architecture creation process, techniques (or approaches) thatenhance a shared understanding of critical aspects among actors. Hindrance 2however is beyond the scope of this research, and discussions on how to overcomeorganization politics are given in [18]. Hindrance 10 is what this research aimsto address through devising an approach that will minimize occurrences of theissues reported above.
4.2 Methods Used in Practice to Support Collaborative Tasks
To address collaborative issues in enterprise architecture creation, there was needto first find out the methods currently used in practice, so as to identify their
Proceedings
48

strengths and weaknesses. The following are the methods enterprise architectscurrently use when executing tasks that require involvement of organizationalstakeholders during architecture creation. The percentage of enterprise architectsthat use a given method is given in brackets.
– Interviews (90%), traditional facilitated workshops (83%), desk research andmodeling (53%)
– Rapid design workshops (24%), Accelerated Solutions Environment (ASE),and Innovate (13%). Accelerated Solutions Environment (ASE) is a genericapproach used to create commitment, agreement, and approval by aligning alarge group of critical stakeholders at the start of a business transformationstrategy [1].
– Group Support Systems (13%), gaming (9%)– Other methods (16%): These other methods include massive emailing, Gen-
eral Enterprise Architecturing (GEA), thematic work groups, peer reviews,elaborate-review sessions, crowd sourcing or co-creation methodologies. GEAis a tool that helps directors to underpin strategic decisions, connect severalsolutions within the organization, increase the cohesion between the organi-zation’s units and entities, and effectively achieve business objectives [20].
The use of interviews in architecture creation is discussed in [18], while thesuccessful use of workshops during architecture creation remains ad hoc andin the hands of professional facilitators. Since workshops are widely used (asindicated above) to support collaboration between stakeholders and enterprisearchitects, there is need for a standard approach of effectively using them duringarchitecture creation (see weaknesses of workshops in section 4.3). Standard inthis context implies successful use of the approach without overdependence orreliance on the presence of professional facilitators, yet with minimal occurrencesof the problematic issues reported in sections 4.1, 4.3, 4.4, and 4.5.
4.3 Strengths and Weaknesses of Methods Currently Used
The strengths and weaknesses of the methods currently used in practice givesinsights into what needs to be done in order to improve collaboration betweenstakeholders and architects. For example, knowing weaknesses that need to beaddressed in a particular method helps to improve the method through refiningit or supplementing it with other methods. Architects revealed the following asthe strengths and weaknesses of methods given in section 4.2.
Strengths and Weaknesses of Using Workshops. On the one hand, thestrengths of using workshops are: (1) Workshops are suitable for ensuring en-gagement of stakeholders, enforcing group decision making, achieving commonagreement on future states, and increasing acceptance and ownership of results.(2) They yield multiple stakeholder views, and make it possible to identify po-tential conflicts and then develop a common (or shared and supported) view. (3)They enable stakeholders to undergo the collaboration experience, where there
5th SIKS/BENAIS Conference on Enterprise Information Systems
49

is intensive communication and mutual understanding, and this builds stake-holders’ commitment and support. Architects also reported that if workshopsare prepared and conducted properly, they are the efficient way of managingcollaborative tasks during enterprise architecture creation.
On the other hand, the following are the weaknesses of using workshops: (1)Results of workshops are of an informal character. (2) The quality of outputfrom a workshop depends on the skills of the facilitator(s) and also on the skillsand knowledge of workshop participants (stakeholders). (3) Information fromworkshops is not sufficiently detailed. (4) Workshops lack anonymity. (5) It istime consuming to prepare and conduct workshops, and to process their results.(6) In workshops it is difficult to stay focused on the agenda. (7) When not allkey stakeholders are available, workshops slow down decision making, and thisnegatively affects the momentum of the architecture development process. (8)Workshops are often not very structured and allow interpretation freedom to alarge degree. Architects also reported that if GSSs are used within a workshop,they help in sharing and storing content during the workshop, although usingGSS requires a lot of preparation time.
Strengths and Weaknesses of Using Only Interviews. On the one hand,the strengths of using interviews are: (1) Interviews are necessary if awarenessis low, since they provide detailed information in a little time, and help the ar-chitect to get a good understanding of the interviewee’s situation. (2) Interviewsare more useful for investigating individual needs and obstacles since they areprivate, focused, and flexible to get ideas. They enable the architect to ask veryspecific questions and stakeholders to give true and less socially wanted answers.They prompt introvert persons to disclose their opinions. (3) They are easy toprepare and schedule, and are suitable for stakeholders who have limited timefor collaborative activities or sessions. (4) Interviews have, by nature, an activeparty (the party answering questions) and a passive party (the party asking thequestions) – hence they do not involve non participating parties or stakehold-ers. (5) They help to manage stakeholders’ expectations, and to get buy-in andcommitment from stakeholders.
Weaknesses of using only interviews include the following: (1) Conductinginterviews with all key stakeholders and processing results from the interviewsis time consuming. Hence a limited number of people can be reached. It is alsooften difficult to get the right person or time or right mindset of a stakeholder.(2) Interviews give single stakeholder view(s), hence several different opinionsor views and there is lack of agreement (on matters) between stakeholders. Itis therefore very difficult to create a shared, well documented, understandable,prioritizable, referenceable, discussable, and evolutionary architecture. (3) Thelack of interaction between stakeholders leads to insufficient understanding ofeach others concerns and issues. (4) Interviews offer limited opportunities forcreativity among stakeholders.
Proceedings
50

Strengths and Weaknesses of Desk Research and Modeling. Desk re-search is required in all cases to get a deeper understanding of the issues andobjectives involved in a given organization situation. Weaknesses of desk researchand modeling are: (1) division of work between architects is often difficult; and(2) preparation and processing of results from desk research is time consuming.
Strengths and Weaknesses of ASE and Rapid Design Workshops. Thespeed at which things are done when using ASE and rapid design workshopsis good, and they enable thorough discussion with all stakeholders. Weaknessesof ASE and rapid design workshops are: (1) ASE is sometimes too fixed onachieving a specific task; and (2) the depth of problem solving and detailing ofan ASE (as well as a rapid design workshop) is also limited.
4.4 Evaluation of Enterprise Architecture Design Alternatives
In enterprise architecture creation there is need to evaluate enterprise architec-ture design alternatives i.e. alternative ways in which stakeholders’ concerns canbe addressed in the architecture [10]. Survey findings show that 96% of enter-prise architects involve organizational stakeholders when evaluating architecturedesign alternatives, and the problems these architects face are given below. Thepercentage of architects who face each problem is given in brackets.
1. Lack of a truly shared vision and strategy by all stakeholders (53%).2. Organization politics (40%).3. Lack of shared agreement, i.e. it is hard to reach a compromise or to get
everyone to agree with the same result due to conflicting agendas (36%). Bi-ased scores due to personal preferences, agendas, and visions; or not inventedhere syndrome (34%).
4. Lack of a clear decision making unit in the organization (36%). It is diffi-cult to make a very good presentation that leads to decision making; andis very clear, only containing the essentials and alternatives, and preventsdiscussions of too much detail (39%).
5. Stakeholders have limited knowledge of the content, the goals of the archi-tecture, or how to read an architecture document or view (32%).
6. Bridging the gap between the abstract long term consequences and the moreconcrete examples that stakeholders can understand (31%).
7. Time or budget constraints rarely allow sufficient interactions with stake-holders, so as to break the complexity in evaluating alternatives (24%).
8. It is hard to quantify advantages and disadvantages of alternatives (23%).
Issues 1 and 3 – 7 above can be addressed through creating a shared un-derstanding (among stakeholders) of the problem and solution aspects of theorganization (as discussed in section 4.1).
5th SIKS/BENAIS Conference on Enterprise Information Systems
51

4.5 Acceptance–Related Challenges Faced by Architects
Successful architecture creation is perceived as designing an architecture, gain-ing stakeholders’ acceptance of the architecture, and being able to implementit with their support and commitment [13]. It is reported in [12] that although96% of enterprise architects closely collaborate with organizational stakeholdersduring enterprise architecture creation, 90% of them face challenges when de-livering products of enterprise architecture creation. From the survey, architectsreported the following as the challenges they face when delivering the architec-tural products. In brackets, the percentage of architects who face each challengeis indicated.
1. Some organizations lack a clear decision making unit, leading to a loud ap-plause but no action (44%). In other cases architecture may be too complexfor the decision making unit or organization maturity level (29%).
2. Since architecture is often perceived to be about only technology, some or-ganizations lack a governance process for ensuring architecture compliancy(44%).
3. Architecture conclusions may sometimes conflict with personal ambitions oragendas (37%).
4. The client organization may change its business plans (37%).5. Using the right language such that every stakeholder understands the archi-
tecture (34%), and making a short and clear description of the architectureto all stakeholders within a short time (13%).
6. Lack of commitment from people who were not earlier involved in the archi-tecture process (24%). In other cases concerns arise from other stakeholderswho were not seen as stakeholders before (21%).
7. Difficulty in translating enterprise architecture products to program startarchitectures (17%).
8. Architecture products do not often deliver what has been promised or whatwas required (11%).
9. Other issues include cases where stakeholders do not want to (or are not ableto) follow the advised architecture, or where the created architecture showsthat the impact of the business strategy is higher than anticipated (3%).
Challenge 4 can be addressed using guidelines in the architecture require-ments management phase of TOGAF ADM [19]. In our view, other challengeslisted above are byproducts of the quality of, and the preparations for, stake-holders’ involvement (i.e. collaboration between enterprise architects and orga-nizational stakeholders) during architecture creation. For example, delivery ofmodels that are too complex often indicates that the architecture function is notproperly integrated in the organization and this is due to, among other factors,the problematic nature of collaboration between architects and stakeholders [15].
4.6 Success Factors For Enterprise Architecture Creation
Since successful enterprise architecture creation is a key motivation for this re-search, it was vital to find out practitioners’ views on its determinants. At least
Proceedings
52

72% of architects recommend that it is vital to first get the business goals cleari.e. to know the reasons for creating the architecture or which organization prob-lems should be solved by creating the enterprise architecture. In addition, 51% ofarchitects agree that there should be an effective (i.e. understood by, and visibleto, all stakeholders) translation of these business goals and concerns into theactual architecture because enterprise architecture is purely a means by whichan organization can achieve its goals. Moreover, according to [4,13], translationof strategy into architecture or desired business operations is perceived as archi-tecture creation.
According to 71% of architects, it is vital to select the right stakeholders andget involved with them early in the process. Moreover, 66% of the architectsagree that architects need to have good collaboration with these stakeholders(e.g. owners or subject matter experts) through regular communication in orderto keep everyone on track and create a strong sense of cooperation and sharedobjectives. At least 24% of architects further advise that it is important to createa situation that enables all stakeholders to experience the development processthrough, e.g., scheduling short group sessions that fit in the schedules of keystakeholders early in the architecture process. At least 48% of architects agreethat it is vital for an organization to have a clear and strong decision makingunit or architecture board which can make decisions and give a clear mandatefor architects to make decisions within agreed boundaries. This is because ar-chitecture concerns assessment of governorship, guidance, and growth. Lastly,34% of architects recommend that architects, project manager(s), and businessexecutive(s) need to respect each others’ roles during the architecture process.
5 Conclusions and Ongoing Work
Findings from the exploratory survey on enterprise architects generally indicatethat although involving organizational stakeholders in enterprise architecturecreation is vital, it results in several issues. These issues indicate the problematicnature of involving stakeholders in enterprise architecture creation. They alsojustify the need for supplementing existing enterprise architecture approacheswith support for collaborative problem solving techniques, so as to create ashared understanding of the organizational problem and solution aspects amongstakeholders. Findings from the survey give insight on how collaboration betweenstakeholders and architects can be improved during architecture creation. There-fore, survey findings are currently being used as a basis for developing a theoryand a method that will (hopefully to a large extent) address the challenges incollaborative architecture creation.
References
1. Holland ASE Team. The power of group dialog: Accelerated Solutions Environment.Utrecht, The Netherlands. (2005)
5th SIKS/BENAIS Conference on Enterprise Information Systems
53

2. Dietz, J.: Architecture Building Strategy into Design (Netherlands ArchitectureForum, Academic Service SDU, The Hague, The Netherlands, 2008). ISBN-13:9789012580861, http://www.naf.nl.
3. Gartner, Inc.: Gartner Identifies Ten Enterprise Architecture Pitfalls. GartnerEnterprise Architecture Summit 2009 http://www.gartner.com/it/page.jsp?id=
1159617. Accessed on August 15th 2010.4. Jonkers, H., Lankhorst, M. M., Doest, H.W. ter, Arbab, F., Bosma, H., Wieringa,
R. J.: Enterprise architecture: Management tool and blueprint for the organisation.Information Systems Frontiers 8(2) 63–66, (2006)
5. Kish, L.: Survey Sampling. John Wiley and Sons Inc. New York (1965).6. Lankhorst, M. et al.: Enterprise Architecture at Work: Modelling, Communication,
and Analysis. Springer Verlag Berlin, Heidelberg (2005)7. Lomax, R. G.: An Introduction to Statistical Concepts for Education and Behavioral
Sciences. Lawrence erlbaum associates. Mahwah, New Jersey. (2001).8. Mwanza, D., Engestrom, Y.: Managing content in e-learning environments. Britisch
Journal of Educational Technology, 36(3), 453 – 463.9. Nardi, B.: Context and Consciousness: Activity theory and Human Computer In-
teraction. MIT Press Cambridge, Massachusetts (1996).10. Nakakawa, A., Bommel, van P., Proper, H. A.: Quality Enhancement in Creating
Enterprise Architecture: Relevance of Academic Models in Practice. In E. Proper,F. Harmsen, and J.L.G. Dietz (Eds.): PRET 2009, LNBIP 28, 109 - 133, 2009.
11. Nakakawa, A., Bommel, van P., Proper, H. A.: Requirements for CollaborativeDecision Making in Enterprise Architecture. Proceedings of the 4th SIKS/BENAISConference on Enterprise Information Systems. Nijmegen: The Netherlands. (2009)
12. Nakakawa, A., Bommel, van P., Proper, H. A.: Towards a Theory on CollaborativeDecision Making in Enterprise Architecture. Global Perspectives on Design ScienceResearch. LNCS 6105, 538 – 541, Springer (2010).
13. Op ‘t Land, M., Proper, H.A., Waage, M., Cloo, J., Steghuis, C.: Enterprise Ar-chitecture - Creating Value by Informed Governance. Berlin, Springer. (2008).
14. Patton, M. Q.: Qualitative evaluation and research methods. SAGE Publications.Beverly Hills. (1980)
15. Raadt, B. van der, Schouten, S., Vliet, H. van: Stakeholder Perspective of Enter-prise Architecture. In: Morrison, R., Balasubramaniam, D., and Falkner, K. (eds.)ECSA 2008. LNCS, vol. 5292, 19–34. Springer, Heidelberg (2008)
16. T. W. Rehkopf, N. Wybolt, Top 10 Architecture Land Mines. IT Professional 5(6) pp. 36 - 43 (2003). doi:10.1109/MITP.2003.1254967
17. Sallant, P., Dillman d. A.: How to Conduct your Own Survey. John Wiley & Sons,Inc. New York. ISBN 0471012734 (1994).
18. Spewak, S. H.: Enterprise Architecture Planning: Developing a Blue Print for Data,Applications, and Technology. New York, John Wiley & Sons Inc (1992)
19. The Open Group Architecture Forum. (2009). TOGAF Version 9. Zaltbommel,The Netherlands: Van Haren Publishing. ISBN: 978-90-8753-230-7
20. Wagter, R.: Focus on consistency, excel with GEA. http://www.ordina.nl/Visie%20en%20Ervaring/Themas/Organisatiebesturing/GEA.aspx. Accessed on August20th 2010
Appendix
Proceedings
54

Radboud University Nijmegen, The NetherlandsAn Exploratory Survey on Collaborative Aspects in Enterprise Architecture Creation
Introduction: The aim of this survey is to investigate aspects concerning collaboration between stakeholders and enterprise architects during enterprise architecture development. Results from this survey will be used to determine the practical relevance of developing an approach that enterprise architects can use to effectively and efficiently execute enterprise architecting guidelines that are “collaboration dependent”. Collaboration dependent architecting guidelines are architecture creation tasks, whose successful completion requires enterprise architects to successfully collaborate with organizational stakeholders.
1. Which architecture method(s) are you currently using? (please mark all options that apply, and specify on option “other”)[due to space limitations the bullet options have been removed]
2. Do you consider the architecture development process to be collaborative in nature?1. YES 2. NO
3. If YES to question (2) above, which method do you use to manage collaborative tasks during architecture creation? (please mark all options that apply, and specify on option “other”) [due to space limitations the bullet options have been removed]
4. Please give a strength and/or weakness of the method(s) you use to manage collaboration during architecture creation.………………………………………………………………………………………………………………………………………………………………………………………………………….......……………………………………………………………….
5. Which factors hinder effective collaboration between architects and key stakeholders during architecture creation? (please mark all options that apply, and specify on option “other”) [due to space limitations the bullet options have been removed]
6. Do you also engage organisation stakeholders during the evaluation of architecture design alternatives?1. YES 2. NO
7. If YES to question (6) above, which type of organisation stakeholders do you engage in the evaluation of architecture design alternatives? (please mark all options that apply, and specify on option “other”) [due to space limitations the bullet options have been removed]
8. Which method do you use to evaluate architecture design alternatives with stakeholders? (please mark all options that apply, and specify on option “other”) [due to space limitations the bullet options have been removed]
9. Which challenges do you face during the evaluation of architecture design alternatives? (please mark all options that apply, and specify on option “other”) [due to space limitations the bullet options have been removed]
10. Do you face any challenges related to acceptance of the products you deliver after architecture creation?1. YES 2. NO
11. If YES to question (10) above, which of the following are examples of such challenges? (please mark all options that apply, and specify on option “other”) [due to space limitations the bullet options have been removed]
12. From your experience, which of the following do you consider as success factors for architecture creation? (please mark all options that apply, and specify on option “other”) [due to space limitations the bullet options have been removed]
13. We are developing a method to manage collaborative tasks in enterprise architecture. We will be conducting another questionnaire survey with the aim of validating the design of the method. Would you be interested in participating in that survey?
a. NO b. YES (please give your contact) ………………………………….14. We will also carry out an experiment on the designed method, would you be interested in participating in the validation
experiment of such a method?a. NO b. YES (please give your contact) …………………………………
Fig. 1. Exploratory Questionnaire Survey
5th SIKS/BENAIS Conference on Enterprise Information Systems
55

Collaborative Modeling: Towards a Meta-modelfor Analysis and Evaluation ?
D. (Denis) Ssebuggwawo1, S.J.B.A. (Stijn) Hoppenbrouwers1, andH.A. (Erik) Proper1,2
1 Institute of Computing and Information Sciences, Radboud University NijmegenHeyendaalseweg 135, 6525 AJ Nijmegen, The Netherlands, EU.
[email protected], [email protected] Public Research Centre – Henri Tudor, Luxembourg, EU.
Abstract. In this paper we discuss a meta-model for the analysis andevaluation of collaborative modeling sessions. In the first part of themeta-model, we use an analysis framework which reveals a triad of rules,interactions and models. This framework, which is central in driving themodeling process, helps us look inside the modeling process with the aimof understanding it better. The second part of the meta-model is based onan evaluation framework using a multi-criteria decision analysis (MCDA)method. Central to this framework, is how modelers’ quality prioritiesand preferences can, through a group decision-making and negotiationprocess, be traced back to the interactions and rules in the analysisframework.
Key words: Collaborative Modeling, Modeling Process Quality, Mod-eling Process Analysis, Modeling Process Evaluation, Group SupportTools
1 Introduction
A number of studies have, over the years, looked at collaborative modeling [1,2,3].There have also been attempts to understand the modeling process [4,5]. Suchmodeling is driven by participants’ communication. Human communication [6],in collaborative modeling, involves argumentation, negotiation and decision mak-ing. Often, participants need to agree, through negotiation and decision making,on what constitutes, for example, “quality” for the different modeling artifactsand how such quality should be assessed. However, how to assess the qualityof the collaborative modeling process, especially with respect to the modelingartifacts, remains a largely unexplored area.
The current paper tries to develop a meta-model which can be used for boththe analysis and evaluation of a collaborative modeling process and the relation
? This paper first appeared as a Working Paper on Information Systems in Sprouts.http://sprouts.aisnet.org/10-36/
Proceedings
56

between events in the process and the resulting artifacts. The meta-model linksthe modeling artifacts and the evaluation framework to the rules, interactionsand models (RIM) framework [7] through the interactions which are governedby rules. The interactions, rules and models are a result of the communicativeprocess, mainly through modelers’negotiation. Negotiation plays a key role incollaborative modeling. It is through negotiation that modelers reach agreementand possibly consensus. In this paper we limit our discussion to negotiationdialogues from argumentation theory.
Negotiation dialogue has been widely studied, see for example [8,9,10]. Itspractical applications include multi-agent systems (MAS) [11,12,13,14] with wideapplications in electronic commerce [15,16,17]. Negotiation dialogues start froma position of conflict and the goal is to establish some consensus or compromisefor all the parties involved. Usually, participants have conflicting objectives, in-terests, preference and priorities. Through the process of negotiation, they geta compromise position that everyone is comfortable with. This is what happensin a multi-actor (collaborative and interactive) modeling process. Modelers haveconflicting views, priorities and preferences and they engage in an argumentationprocess, that involves, propositions, (dis)agreements, acceptances and rejections,supports and withdraws, etc, to reach a compromise.
It should be noted that, although there are a number of factors that onemay be interested in looking at in the analysis and evaluation of the modelingprocess, which in fact may influence the quality of the modeling process, e.g.,power struggle, leadership and the unspoken message or body language, etc., (seefor example, [18]), our interest at the moment is in what we call “drivers” of themodeling process. Rules and/or goals, interactions, and models are hypothesizedto be drivers of the modeling process. In this paper we concentrate on only these.
2 Modeling Process Analysis: The RIM Framework
Stakeholders, in a collaborative modeling process, interact and communicatetheir ideas and opinions to other members through the communication process.Three key items concerning this communication are the rules, the interactionsand the models. The rules, interactions and models (RIM) framework is basedon these items and helps us look into the collaborative modeling process. Thisframework is depicted in Fig. 1. Details of the RIM framework are found in [7].The RIM framework is a three-tier framework that examines the communicativeacts (interactions) in a modeling session, the rules/goals set, and the modelsproduced as a result of the interaction and collaboration. The different collab-orative modeling players work under a set of rules and goals. The rules/goals,interactions and models are all time-stamped to help us track and identify heinterplay between any pair. The interplay of rules, interactions and models isexplained in Table 1.
5th SIKS/BENAIS Conference on Enterprise Information Systems
57

Fig. 1. A framework for analyzing interactions, rules and models.
Table 1. RIM framework features
Path Interplay
IM-MI The interactions lead to the generation of models and generated (inter-mediate) models drive further interaction.
RM-MR Some rules/goals of modeling apply to (intermediate) models and thesemodels may lead to the setting of new rules/goals.
RI-IR Rules guide and restrict interactions and some interactions may changethe rules of play.
2.1 Interaction Analysis: The Structure
In order to analyze the interactive conversations and determine the structureof the speech-acts that result thereof, we need to apply a discourse analysis orconversation analysis technique. There are a number of methods which can beused, notably, speech-act theory by Searle [19]. Searle’s aim in his “Theory ofSpeech Acts” [19] was to show that: “speaking a language is performing acts(· · · ) in accordance with certain rules for the use of the linguistic elements”,and to formulate these rules. He argues that the minimal unit of an utteranceis not a word or sentence but a “speech act”. Two types of speech acts wereidentified in his theory: propositional act - which is the act of uttering wordsand illocutionary act - which is a complete speech act. An illocutionary acthas two components: propositional content which describes what an utteranceis about and illocutionary force describes the way it (utterance) is uttered. Inaddition, each illocutionary act has an illocutionary point which characterizesthat particular type of speech act. Searle classifies utterances according to theillocutionary point and proposes five classes of speech acts shown in Table 2.
However, as argued in [20], speech-acts are individual statements in the wholeconversation and cannot be analyzed outside the whole conversation in whichthey occur. The language-action perspective (LAP) [21] is, therefore, a candi-date in analysing the whole conversation in which the speech-acts are just com-ponents. We base our analysis of the communicative process on LAP to identifythe conversational interactions that occur in a collaborative modeling process.
Proceedings
58

Table 2. Illocutionary speech act types .
Speech-ActType
Explanation
Assertive represent facts of the world of utterance or common experiences,e.g., reports or statements
Directives represent the speaker’s attempt to get the hearer perform theaction indicated in the propositional content, e.g., requests
Commissives represent the speaker’s intention to perform the action indi-cated in the propositional content, e.g., promises
Expressives say something about the speaker’s feeling or psychological at-titudes regarding the state of affairs represented by the propo-sitional content, e.g., apologies
Declaratives change the world through the utterance of a speech act
Fig. 2 shows the structure of the interactions. We use Object Role Modeling(ORM) method [22] to represent analysis and evaluation concepts in this paper.Table 3 shows the elements of the interaction component.
Interaction(.name)
SpeechAct(.name)
contains exchange of
Topic(.name)
has
responds to
InteractionNr
TopicNr
Actor(.name)
has
Category(.name)
has
Time(.hms)
Rule(.name)
is guided by
ModelProposition(.name)
generates
GroupNegotiation GroupDecisionMaking
has
has
begins at
ends at
Fig. 2. Elements of an interaction
2.2 Rule Analysis: The Structure
Rules govern the interactions and production of the models. They guide col-laborative modelers during the modeling process and can be set for (before) orin (during) the modeling process. They link the product of the conversations -the model to the conversations and they are intended to guarantee both process
5th SIKS/BENAIS Conference on Enterprise Information Systems
59
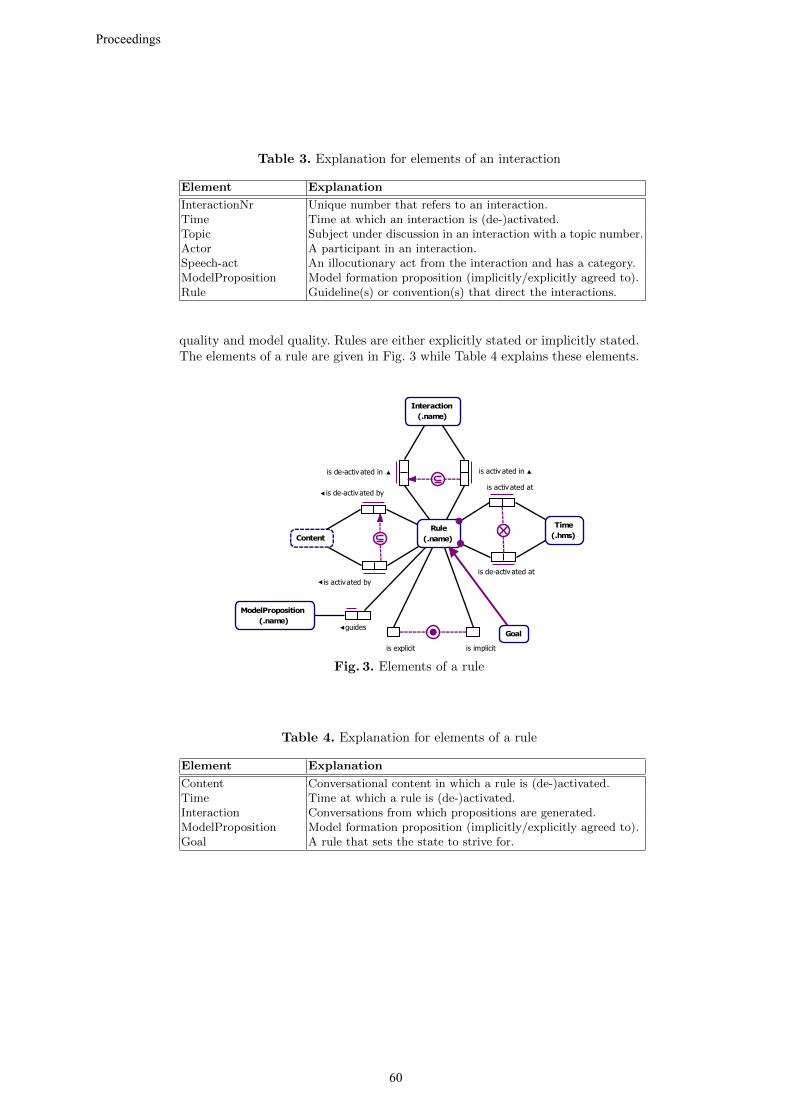
Table 3. Explanation for elements of an interaction
Element Explanation
InteractionNr Unique number that refers to an interaction.Time Time at which an interaction is (de-)activated.Topic Subject under discussion in an interaction with a topic number.Actor A participant in an interaction.Speech-act An illocutionary act from the interaction and has a category.ModelProposition Model formation proposition (implicitly/explicitly agreed to).Rule Guideline(s) or convention(s) that direct the interactions.
quality and model quality. Rules are either explicitly stated or implicitly stated.The elements of a rule are given in Fig. 3 while Table 4 explains these elements.
Rule(.name)
Time(.hms)
is activ ated at
is de-activ ated at
Interaction(.name)
is activ ated in
Content
is de-activ ated by
is activated by
Goal
is explicit is implicit
ModelProposition(.name)
guides
is de-activ ated in
Fig. 3. Elements of a rule
Table 4. Explanation for elements of a rule
Element Explanation
Content Conversational content in which a rule is (de-)activated.Time Time at which a rule is (de-)activated.Interaction Conversations from which propositions are generated.ModelProposition Model formation proposition (implicitly/explicitly agreed to).Goal A rule that sets the state to strive for.
Proceedings
60

2.3 Model Analysis: The structure
Models (intermediate or final) are lists of propositions up to time t, i.e. conversa-tional statements commonly agreed upon and shared by all the modelers. Thesemodel propositions are subject to selection criteria in order to determine whichone makes it to the group (shared) model. In collaborative modeling a modelproposition is either explicitly agreed with or implicitly not disagreed with. Thestructure of a model proposition component is shown in Fig. 4 while its elementsare explained in Table 5.
ModelProposition(.name)
Time(.hms)
Rule(.name)
is guided by
Interaction(.name)
is generated from
SelectionCriteria
is de-activ ated at
is activ ated at
is selected by
Fig. 4. Elements of a model proposition
Table 5. Explanation for elements of a model proposition
Element Explanation
Rule Guidelines that direct the selection of a model-proposition.Time Time at which a model-proposition is (de-)activated.SelectionCriteria A set of evaluation criteria used to select a model-proposition.Interaction Interaction from which a model-proposition is generated.
3 Modeling Process Evaluation: An MCDA Framework
In collaborative modeling a number of artifacts are used in, and produced dur-ing, the modeling process. These include the modeling language, the methodsor approaches used to solve the problem, the intermediate and end-productsproduced and the medium or support tool that may be used to aid the collab-oration, see for example [23]. The priorities of the individual decision makers
5th SIKS/BENAIS Conference on Enterprise Information Systems
61
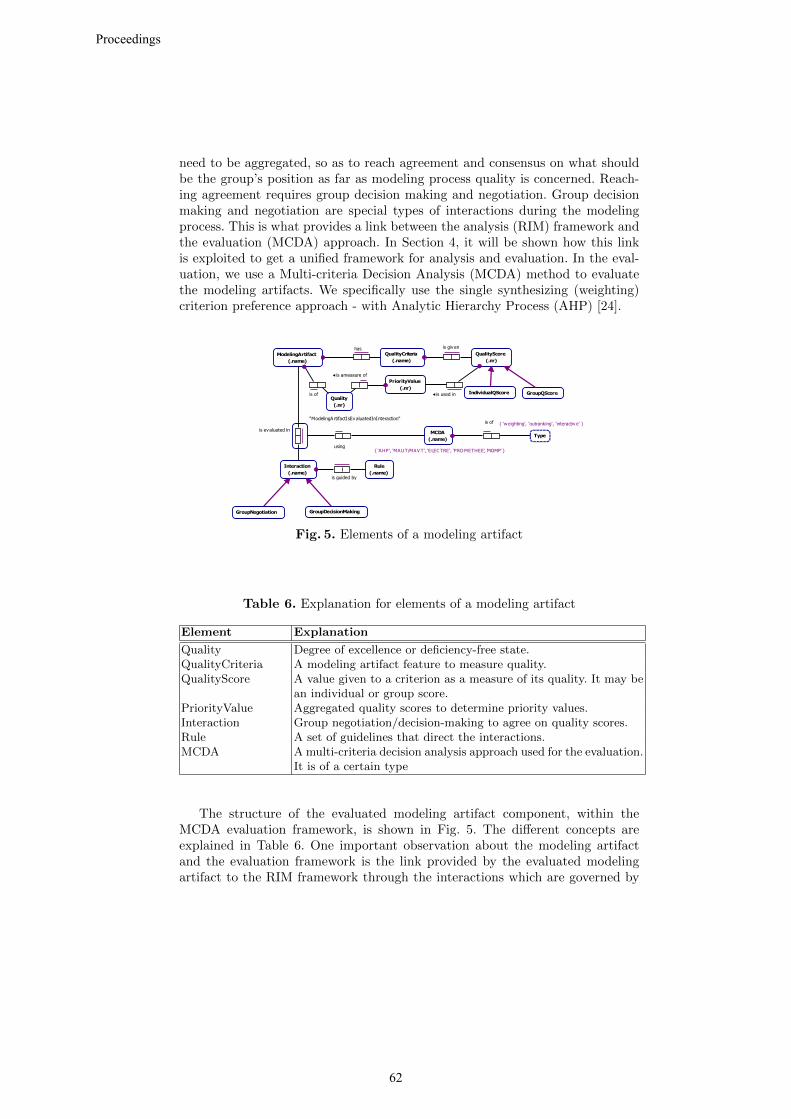
need to be aggregated, so as to reach agreement and consensus on what shouldbe the group’s position as far as modeling process quality is concerned. Reach-ing agreement requires group decision making and negotiation. Group decisionmaking and negotiation are special types of interactions during the modelingprocess. This is what provides a link between the analysis (RIM) framework andthe evaluation (MCDA) approach. In Section 4, it will be shown how this linkis exploited to get a unified framework for analysis and evaluation. In the eval-uation, we use a Multi-criteria Decision Analysis (MCDA) method to evaluatethe modeling artifacts. We specifically use the single synthesizing (weighting)criterion preference approach - with Analytic Hierarchy Process (AHP) [24].
ModelingArtifact(.name)
QualityCriteria(.name)
has
Quality(.nr)
is of
Interaction(.name)
GroupNegotiation GroupDecisionMaking
Rule(.name)
is guided by
is giv enQualityScore
(.nr)
IndividualQScore GroupQScoreis used in
PriorityValue(.nr)
is ameasure of
is ev aluated in
"ModelingA rtifactIsEv aluatedInInteraction"
MCDA(.name)
{ 'A HP', 'MAUT/MAV T', 'ELEC TRE', 'PRO METHEE', 'MOMP' }using
Type
{ 'weighting', 'outranking', 'interactiv e' }is of
Fig. 5. Elements of a modeling artifact
Table 6. Explanation for elements of a modeling artifact
Element Explanation
Quality Degree of excellence or deficiency-free state.QualityCriteria A modeling artifact feature to measure quality.QualityScore A value given to a criterion as a measure of its quality. It may be
an individual or group score.PriorityValue Aggregated quality scores to determine priority values.Interaction Group negotiation/decision-making to agree on quality scores.Rule A set of guidelines that direct the interactions.MCDA A multi-criteria decision analysis approach used for the evaluation.
It is of a certain type
The structure of the evaluated modeling artifact component, within theMCDA evaluation framework, is shown in Fig. 5. The different concepts areexplained in Table 6. One important observation about the modeling artifactand the evaluation framework is the link provided by the evaluated modelingartifact to the RIM framework through the interactions which are governed by
Proceedings
62

rules. This is an important observation since it helps us to unify the two frame-works.
4 The Analysis and Evaluation Meta-model
In this section we combine the components to form a unified model for the inte-grated analysis and evaluation (of process and results) of collaborative modeling.The aim of having a unified framework is twofold: 1) to trace the flaws in themodeling process using the evaluation framework back to the analysis framework,2) to automate the analysis and evaluation by a having support tool which canbe used to both analyze and evaluate the modeling process. Although the anal-ysis and evaluation frameworks can stand on their own, having a tool-supportthat can help modelers to analyze and evaluate the process and trace flaws in theentire modeling process is more attractive than the individual frameworks. Thecomponents of the integrated frameworks are linked together in a meta-modelshown in Fig. 6. The novelty of the meta-model is that it combines the analysisand evaluation frameworks, i.e., the RIM framework and the MCDA framework.This is easily visible in the meta-model where the triage of the rules (R), inter-actions (I) and models (M) in Fig. 1 is depicted through the rules, interactionsand model proposition entities.
Rule(.name)Content
is de-activ ated by
is activ ated by
Time(.hms)
is activ ated at is de-activ ated at
Goal
ModelProposition(.name)
SelectionCriteria
is selected by
starts atstops at
is guided by
Interaction(.name)
SpeechAct(.name)
contains exchange of
Category(.name)
has
Actor(.name)
has
InteractionNr
has
Topic(.name)
has
TopicNr
has
responds to
guides
GroupNegotiatipon GroupDecisionMaking
is generated from
ModelingArtifact(.name)
QualityCriteria(.name)
hasQualityScore
(.nr)
is given
Quality(.nr)
is ofPriorityValue(.nr)
is used in
is a measure of
IndividualQScore GroupQScore
is explicit is implicit
is evaluated in
"ModelingA rtifactIsEvaluatedInInteraction"
MCDA(.name)
{ 'A HP', 'MA UT/MA V T', 'ELEC TREE', 'PROMETHEE', 'MOMP' }
using
Type
{ 'weighting', 'outranking', 'interactiv e' }
is of
begins at
ends at
Fig. 6. An integrated meta-model for collaborative modeling analysis and eval-uation
5th SIKS/BENAIS Conference on Enterprise Information Systems
63

5 Meta-Model in Use: Illustrative Examples
To demonstrate the theoretical importance and practical significance of themodel we provide below some illustrative examples. The examples are drawnfrom recorded communication/conversations that took place during a modelingsession.
5.1 Application of the Meta-Model: The Analysis
Example 1. Interaction analysis in Fig. 2 is based on the following excerpt.Table 7 shows the elements of an interaction.
Time Actor Speech Act02:00 M1 So, where does Ordering start?02:03 M2 First we have to decide who takes part in it. So we can set
that on top of the diagram?02:10 M1 There are numbers, so that’s easy, so probably the purchasing
officer is involved?02:18 M2 Eh ... I guess so.02:21 M1 So he needs ordering one second ... ”draws 2”.
Table 7. Extracted elements of interaction from the coded meta-data
Int. # Int. Name Top. # Top. Name Speech Act Type/Category Rsp. to Time Actor 1 INFORMATION
SEEKING 1 SET CONTENT QUESTION
[Where does ordering start?] 02:00 M1
2 DECISION MAKING
2a
2b
SET CONTENT SET GRAMMAR GOAL
PROPOSITION [First we have to decide who takes part in Ordering] QUESTION [Can we set who takes part in Ordering on top of the diagram?]
02:03 M2
3 INQUIRY
3a
3b
SET GRAMMAR GOAL SET CONTENT
PROPOSITION-QUESTION [There are numbers, so that’s easy, so probably the purchasing officer is involved?] PROPOSITION [Purchasing Officer is involved in Ordering]
2b
2a
02:10 M1
4 NEGOTIATION 4 SET CONTENT AGEEMENT WITH [Eh… I guess so]
3b 02:18 M2
5 DELIBERATION 5 SET CONTENT DRAWING [So he needs ordering … one second … “draws 2”,i.e., number 2 (purchasing officer) on top of first swim lane
02:21 M1
KEY: Int.: Interaction Top.: Topic Rsp.: Response.
Example 2. Rule analysis for Fig. 3 is based on the following excerpt ofmodeling session conversations. Extracted elements of a rule from the codedmeta-data are given in Table 8.
Proceedings
64

Time Actor Speech Act01:25 M1 Let’s create 5 swim lane diagrams.01:30 M2 Yes, isn’t that what I just proposed?08:43 M1 Sequences are started with the START symbol ...08:45 M2 Yes ...08:48 M2 Use blocks to indicate activities.15:18 M1 So no decision diamonds in UML activity diagrams?15:19 M2 No; well; maybe.
Table 8. Extracted elements of a rule from the coded meta-data
Rule Int. Name[A] Content[A] Time[A] Int. Name[D] Content[D] Time[D] M.P VALIDATION
GOAL DELIBERATION All participants should
agree on the model.
[Proposed and
activated in the
Assignment.]
All t DELIBERATION De-activated when all or
the majority have agreed
on the model, i.e.
reached consensus.
End t
CREATION GOAL
PERSUASION Let’s create 5 swim
lane diagrams - [14]
PROPOSITION
01:25 PERSUASION Yes, isn’t that what I
just proposed?-[15]
ARGUMENT FOR 14
01:30 A.C [14]
GRAMMAR RULE
INFORMATION SEEKING
Sequences are started
with the START
symbol …- [148]
CLARIFICATION
08:43 INFORMATION SEEKING
Yes…[149]
AGREEMENT WITH
148
08:45 A.C [148]
GRAMMAR GOAL
NEGOTIATION Use blocks to indicate
activities - [151]
PROPOSITION
08:48 - - - A.C [151]
GRAMMAR GOAL
INQUIRY So no decision
diamonds in UML
activity
diagrams?[248]
QUESTION
15:18 INQUIRY No; well; maybe-[249]
ANSWER 248 15:19
KEY: Int.: Interaction A.C.: Activation Content M.P.: Model Proposition[A/D]: Activated/De-activated
Some explanation is in order for some of the concepts shown in Tables 7 and8. The categories for coding the modeling conversations, i.e., the interactionnames in both tables correspond to the dialogue types of Walton and Krable[25] whereas the topic names and rule categories, in Table 8, are explained in [7].The validation goal is an example of an explicitly stated rule. This is activated atthe start of the modeling session and remains so until de-activated at the end ofthe modeling session. The others are all implicitly stated and are (de-)activatedduring the interactions as shown by the (de-)activation content. It should be benoted that we use the terms “activation” and “de-activation” in the sensethat modeler M1 starts the argument and modeler M2 concludes it in the senseof reaching a final agreement. For each we identify, respectively, the interaction,content and time in (by, at) which the argument was started and concluded.
Example 3. Model proposition analysis in Fig. 4 is based on the followingexcerpt. Extracted elements of a model proposition from the coded meta-dataare given in Table 9.
5th SIKS/BENAIS Conference on Enterprise Information Systems
65

Time Actor Speech Act14:41 M1 If there is no place, he can’t order or there is no availability.14:45 M2 Yeah, true...14:50 M2 You cannot do decision diamonds in UML activity diagrams.14:57 M2 You can only have splits and joins of some sort, not the
decisions as such.16:46 M1 We can also say that if the form isn’t filled in well then it is
rejected but...16:55 M2 Yeah ...17:07 M1 No-route and terminal point from ”accept” in swim lane 7,
with ”no order” ...17:14 M2 OK..., Yes
Table 9. Extracted elements of a model proposition from the coded meta-data
Model Proposition Time Rule Name Int. Name Selection Criterion
Act. De-act. If there is no place, he cannot order or there is no availability. Yeah, true...
14:41
14:45
CREATION NEGOTIATION Explicitly agreed with
You cannot do decision diamonds in UML activity diagrams. You can only have splits and joins of some sort, not the decisions as such.
14:50
14:57
- -
GRAMMAR PERSUASION Not explicitly disagreed with.
We can also say that if the form isn't filled in well then it is rejected but... Yeah ...
16:46
16:55
CREATION NEGOTIATION Explicitly agreed with.
No-route and terminal point from "accept" in swim lane 7, with "no order" ... OK..., Yes
17:07
17:14
GRAMMAR NEGOTIATION Explicitly agreed with.
KEY: Act.: Activated De-act.: De-activated Int.: Interaction
5.2 Application of the Meta-Model: The Evaluation
Example 4. Evaluation analysis in Fig. 5 is based on an evaluation instrumentpart of which is shown in Fig. 7. This instrument is used, first by individualmodelers, and then second by a team of modelers, to evaluate the modeling ar-tifact (modeling language, modeling procedure, modeling products-the modelsand the support tool). The instrument shows, for example, how a modeling pro-cedure is evaluated (using its selected quality criteria). These are assigned scoresusing the fundamental scale [24]. The quality criteria (quality dimensions of themodeling artifacts) are defined in [23] and the process of assigning these qualitycriteria scores is explained therein. Upon reaching consensus through negotiationand decision making processes, modelers use these scores in the computation ofpriorities and the overall quality for the modeling artifacts as shown in Table.10.
Proceedings
66

Model Name: COME
Numerical Assessment
Efficiency Effectiveness
9 8 7 6 5 4 3 2 1 2 3 4 5 6 7 8 9
Compare the relative importance with respect to: Modeling Procedure
Efficiency EffectivenesSatisfaction Commitmen Efficiency 2.0 6.0 3.0Effectiveness 5.0 6.0Satisfaction 1.0Commitment & Shared Understanding Incon: 0.07
Page 1 of 17/2/2010 3:01:18 PM
MSDMSD
Fig. 7. Evaluating a modeling artifact in collaborative modeling
Table 10. Elements of a modeling artifact
Modeling Artifact
Quality Priority value
Overall Quality
MCDA Int. Name Rule
Criterion Score Name Type
Modeling Procedure
- Efficiency - Effectiveness - Satisfaction - Commitment &
Shared
Understanding
6 5
1 1
0.464 0.368 0.077 0.092
0.359
AHP
Weighting
NEGOTIATION/ DECISION MAKING
VALIDATION GOALS/ CREATION GOALS
Int.: Interaction
5.3 Discussion
The examples given, do illustrate how the analysis and evaluation frameworkscan be used to, respectively, analyze and evaluate the modeling sessions. Theinteractions provide a driving force through the argumentations, negotiations,etc., for the modeling process while the rules and/or goals are a part and parcelof the structuring process during the modeling process, especially, when there isno facilitator. It has been observed in [7] that modelers structure the modelingprocess into pro-active rule and goal setting procedures and ad-hoc reactiverule and goal setting procedures. With this kind of structuring, it is possible tosee how the rules are set for, and set in, the modeling session. Analysing thedata from such a well-structured process helps us to pin-point to the types andcategories of these rules and goals, the interaction types and it enables us to seehow the modeling session unfolds and progresses and how models are createdfrom (implicitly or explicitly) agreed upon statements. Identifying the driversof the collaborative process in terms of rules, interactions and models is likely
5th SIKS/BENAIS Conference on Enterprise Information Systems
67
to enable development of guidelines that can be used in the development of anautomated support tool for the analysis.
Figure 7 and Table 10 show, respectively, how the evaluation of the modelingprocess and the associated artifacts can be done and how the modelers’ prioritiescan be aggregated. There are a number of modeling artifacts that are used in anddeveloped during a collaborative modeling session. These include the modelinglanguage, the modeling procedure, the models, and the support tool or medium.Analyzing what takes place during the modeling process, and what drives themodeling process won’t be complete unless we assess and evaluate the quality ofall these modeling artifacts. Evaluation is quite important since it gives assuranceabout the quality of these artifacts and through the meta-model we can tracethe flaws in the modeling process back to the analysis. One key observation isthat the modeling artifacts’ quality dimensions can be assigned quality scoresduring a negotiation and decision making (interactive) process using a multi-criteria decision analysis technique, e.g., AHP [24], where the modelers’ differentpriorities, preferences are reconciled and aggregated, and the overall quality isfinally obtained by synthesizing the priorities. Rules and/or goals play a rolesince they direct and guide the modeling process.
6 Conclusion and Future Research
The contribution of the paper is twofold. First, it shows how the collaborativemodeling process can be analyzed through the RIM framework and how it canbe evaluated through the MCDA evaluation framework. Second, it develops ameta-model which unifies the analysis framework and the evaluation framework.To test the soundness of the meta-model, we provided illustrative examples fromreal modeling sessions. Though simple in description, these examples bring outwell the concepts discussed for the meta-model. One key observation is that thetypes or names of the identified interactions are similar to those identified byWalton and Krabbe [25][26] in “Argumentation Theory”, with the exception ofthe “eristic” dialogue.
Future Research Direction. For future research, we intend to apply the meta-model to modeling sessions, especially empirical tests with experts in industry tofurther test the theoretical significance and practical relevance and importanceof the meta-model. More specifically, we intend to further study and analyze themodeling process using a number of other factors other than those concentratedon in this paper, e.g., dialogue games and argumentation process through negoti-ation from a number of perspective, e.g., multi-agents, (see for example, [27,28]).We further intend to test our a priori hypothesis about the interdependenciesof the modeling artifacts and how the quality of one affects the quality of theother. We hypothesize that the the modeling language and the support tool areindependent whereas the modeling products (models) and the modeling proce-dure are dependent variables in a multi-actor multi-criteria modeling session.Our intention is to empirically study this interdependency. Establishing this re-
Proceedings
68

lationship is key in helping develop guidelines for a support tool that automatesthe analysis and evaluation of the modeling process.
References
1. Gjersvik, R., Krogstie, J., Følstad, A.: Participatory Development of EnterpriseProcess Models. In: Krogstie, J., Halpin, T., Siau, K.(eds.), Information ModelingMethods and Methodologies, pp. 195–215. IGI Global (2005)
2. Stirna, J., Persson, A.: Ten Years Plus with EKD: Reflections from Using an En-terprise Modeling Method in Practice. In: Proper, H.A., Halpin, T.A., Krogstie, J.(eds.), Proceedings of the EMMSAD 2007, held in conjunctiun with CAiSE’07, pp.97–106. Tapir Academic Press, Trondheim, Norway (2007)
3. Barjis, J., Kolfschoten, G.L., Verbraeck, A.: Collaborative Enterprise Modeling. InE. Proper, F. Harmsen, and J.L.G Dietz (eds.): PRET 2009, LNBIP 28, pp. 50–62.Springer Heidelberg (2009)
4. Veldhuijzen van Zanten, G., Hoppenbrouwers, S.J.B.A., Proper, H.A.: System De-velopment as a Rational Communicative Process. J. of Systemics, Cybernetics andInformatics 2(4), 47-51 (2004)
5. Rittgen, P.: Negotiating Models. In Krogstie, J., Opdahl, A.L., Sindre, G. (eds.)CAiSE 2007. LNCS 4495, pp. 561-573. Springer Heidelberg (2007)
6. Clark, H.H., Brennan, S.E.: Grounding in Communication. In: Resnick, L.B., Levin,J.M., Teasley, S.D. (eds.) Perspectives on Socially Shared Cognition, pp. 127–149.American Psychology Association, Washington (1991)
7. Ssebuggwawo, D., Hoppenbrouwers, S.J.B.A., Proper, H.A.: Interactions, Goals andRules in a Collaborative Modeling Session. In: Persson, A., Stirna, J. (eds.) PoEM2009. LNBIP 39, pp. 54-68. Springer Berlin Heidelberg (2009)
8. Pruit, D.G.: Negotiation Behaviour. Academic Press NewYork (1981)9. Raiffa, H.: The Art and Science of Negotiation. Havard University Press, Cambridge,
MA (1982)10. Rosenschien, J., Zlotkin, G.: Designing Conventions for Automated Negotiations
among Computers. MIT Press, (1994)11. Amgoud, L., Prade, H.: Generation of Different Types of Arguments in Negotiation.
In: Delgrande, J.P.,Schaub, T. (eds.), Proceedings of the 10th International Workshopon Non-Montonic Reasoning, Whistler, Canada, June 2-5, 2004, pp. 10–15 (2004)
12. McBurney, P., van Eijk, R.M., Parsons, S, Amgoud, L.: A Dialogue-game Protocolfor Agent Purchase Negotiations. J. of Auto. Agents and Multi-agents Sys 7(3), 235–273 (2003)
13. Parsons, S, Jennings, N.R.: Negotiation Through Argumentation: A PreliminaryReport. Proceedings of the 2nd International Conference on Multiagent Systems,Kyoto Japan, pp. 267–274 (1996)
14. Parsons, S., Sierra, C., Jennings, N.: Agents that Reason and Negotaiate by Argu-ing. J. Logic Comput. 8(3), 261–292 (1998)
15. Laasri, B., Laasri, H., Lander, S., Lesser, V.: A Generic Model for Intelligent Ne-gotiating Agents. Int. J. of Cooperative Information Systems 1, 291–317 (1992)
16. Sandholm, T., Lesser, V.: Issue in Automated Negotiation and E-Commerce. Ex-tending the Contract Net Protocol. In Proceedings of the 1st International Conferenceon Muti-agent Systems, AAAIPress: Menlo Park, CA, USA, pp. 328–335 (1995)
17. Sierra, C., Dignum, F.: Agent Mediated Electronic Commerce: Scientific and Tech-nological Road-map. In Dignum, F. and sierra, C. (eds.), Agent Mediated ElectronicCommerce 1991. LNAI 1991, pp. 1–18. Springer-Verlag-Berlin (2001)
5th SIKS/BENAIS Conference on Enterprise Information Systems
69

18. Sackler, M.L.: The Unspoken Message. Modern Psychoanalysis 23, 53–62 (1998)19. Searle, J.R.: Speech Acts. an Essay in the Philosophy of Language. London, Cam-
bridge University Press (1969)20. Winograd, T., Flores, F.: Understanding Computers and Cognition. A New Foun-
dation for Design. Norwood, Ablex (1986)21. Goldkuhl, G.: Conversational Analysis as a Theoretical Foundation for Language
Action Approaches? In: Weigand, H., Goldkuhl, G., de Moor, A. (eds.). In: 8th Inter-national Working Conference on the Language Action Perspective on CommunicationModelling (LAP 2003), pp. 51–69. Tilburg, The Netherlands (2003)
22. Halpin, T.: Information Modeling and Relational Databases: From ConceptualAnalysis to Logical Design. Morgan Kaufmann Pub (2001)
23. Ssebuggwawo, D., Stijn Hoppenbrouwers, S.J.B.A., Proper, H.A. (2009). Evaluat-ing Modeling Sessions Using the Analytic Hierarchy Process. In: Persson, A., Stirna,J. (eds.) PoEM 2009. LNBIP 39, pp. 69-83. Springer Berlin Heidelberg (2009)
24. Saaty, T.L.: The Analytic hierarchy Process. McGraw-Hill, New York (1980)25. Walton, D., Krabbe, E.C.W.: Commitment in Dialogue: Basic Concepts of Inter-
personal Reasoning. State University of New York Press, Albany, N.Y. (1995)26. Reed, C., Norman, T.J.: Argumentation Machines: New Frontiers in Argument and
Computation.Kluwer Academic Publishers, Dordrecht, The Netherlands (2004)27. Hindricks, K., Jonker, C.M., Tykhnov, D.: Negotiation Dynamics: Analysis, Con-
cessions Tactics and Outcome.In: Proceedings of the 2007 IEEE/WIC/ACM Inter-national Conference on Multi Agent Technology, pp. 427–433 (2007)
28. Markus, M.G., Gerhard, W.: A Generic Framework for Argumentation Based Ne-gotiation. In: Cooperative Multi Agents. LNCS 4676, pp. 209–233 (2007)
Proceedings
70

Session 4:
Architecture, Ontology & Model Engineering


�������������� ��� �������������� ��������������
���������� ������ �������������������� ��������� �� ��� ���������������� ������������� �����
����� ���� �������� !����"��#��� �$�����%���&'&�(#�)����������
*�������������������+,��� �-�$�+���.����� ����������� ��(,������$���/��0�1��2�� ���������
*������������������ ��+���+����������-���� +���3����� �� !��������������(�� ��������,�3�.��.'4.�52�*���(�������
*����������������+������� �� -!��+���'�6��������������� ��7�� ��� !��������.8'���&%%�5��)����������
*���������������$ ��9����-��+ ��+!��/����!����� ��� �:��6��� �����,�6�,��� ������;���� ����! ��!�����
2����������'��3/0'�;(����!����*��������������<�+� ����������+��=-!�+��+���
������ ���*� ������8������!������ ����������!��,����������>?��;������������*����@��A�B���� ���)!� ��!����;�,���!����������, ��� ���:������7���������C�� $� !�� �� �!!������ ,� �������� �� ��� ���� *� �:� � ��� 6���8��� ����;�,���!����6�,��� ���:������D6;6��.&�&E����+�"� ���� ��� ����)+��
����������6��2��!����B���� ���)!� ��!�����7���� ������,�;�,���!�������, ��+�
������� ����
�:� �� � ��� �� �� !� ��� �$�� ���� � ��8������ !���� ����� �� ��� ���� ���� �� !��B���� ��� )!� ��!���� DB)E� � ��� �� �!� ���� !������ ���� ���8 ������ ��� F�8� ���� �!������� ���!������ �,��� �� �� � �� ���� ��!����:+� � ��� !�� ���������������������� ����������� !�� �������,,�!� �������,�B)���:��!���� !��������!� � ������ ��+�)������������,�����������������������,��G�����������, ��� ���������!� ��,�!����G �:�������� F�� ��,���� ����H6*��� �����������������!�� ���+�)�� ���� ������ ,� ���� ����� ���������� !���� ���� ���� ��� �� �� �� ��� ���!��� $����!���: ���$ ���D +�+�!�,� ����E�B)+�� �!��B)�!�,���!�� ��!�! ���,��� � ������� �,����� ���� ����, ���� �� ��� ��!�� I���� ,� �� ����� ��� ���!�� !��� ��!��$ ���B)�������������� ������� ������+�*� ������:�� �����! � !���:�������� !���:��� ,:��� ���!�� ������� ���B)�����, �������!�,���!�+�*�������!��I���� ������,�� �A����������������������������������������������������������������������� ��������������������� ���������������*�������!��������,� ���� ��� �����:�������� ������� �������:� D�J.43E����������I����� ���� �� !�������:� ��D� �� ����������!� 8�I��������������� �� ����� ��������� �E+�
���������� ������� �����������������.��� ��������� �� 3��� �������'��������� �������/������ ����/�
5th SIKS/BENAIS Conference on Enterprise Information Systems
73

��������
6�� ��������$�� !��� !�!����� ��������� ,� ���� ���� , ��� ����������� ,� ��!��� ���!��� ��!��$ ���B)���������������:����!�����!��� ��!��������������,����!��������������� ������ �� ,� B)�� 2��!�� ����� )!� ��!����� D +�+� �!� ��!���� !�8��!��E�� �!� ��!��� �� � ��� ��� ����!�� �� � ��� ! ��� ��� �� ���!���� ��� F�����$�������G!������������ ��������,��!������ ���������+�K� ���������� �� ���� ,�!�������, ���! ��� �!��� ��������� � �!��� ��������������:���:����:+��6�������,� �����������������������������������, ���!��������� ��������B)+�
($����� �� ������ ��������� �� � ��� ��!��� ��� ��� ����� ���� ��� ���� ���8������$������ ���� ��� ����� ����� ��� ��� �� ��� ������� ��� �� � ���:+� B)�� ,� �G������������ �� ��� �� ��� ��������� �� �� ��� �� ���� ��� ���� !����G �:� ,� ������� F�� ���$������ �� ��������� ������,��!�����:�!���� ��� �+� 6����� � ���B)� ������,,�!� �������������� !����!���� �����,�������� ���,������ ���� ����������� ��������� �� ������� F��� �������� � �� � ����� ��������� �!������ ���� �:�����+�($�����B)����������������������� �����������!����!���+�B)� ������������ ���:��,,�!� ���������,��!� �� ������ ����H6*��� ������+������� ��� ��������, ��� ,� ���� ���������������B)� � ���:�������� ����� ��,,��
���!�����:���!�� �� ����$�:�,� � �������!������ ��������� ������!����:� �!�������� ����� I��� �:+� 6�� ��� � ��� B)� ,,��� ������ ����������� ,� ���!�� ���� ����!����G �:+�������������!���!�,� �����B)���������� � � �� F���,�������������!��� ��������������� ��!�,�+� 6��,�!��� ����� �:�,� �������������� �� !������������!����!�����:���������D��!�E���$����������!������!�,� �����B)+�*� �� �������:�������������� � ����!�� �����������B)�� ���������������!���D��!����� ���� ��� �!I�� ����� $ ��� �!� ��!����� ��������� ���� �����! ��� ��� ���� !�,� !������$�����!������������ ��8$ ��� �������E+�)����� ������ ���, �� ��� �������B)�!�����D�+�+������ ����!� ��!��E��������:�
����� �� ����� ��� �� � ��� ��!��� ��� ���� ��� B)� ����� B)� ����� D�+�+� ���!��������E+�*� ��!��������:������� �������� ��� � ��������������!�� �����+�6����� � ����� B)� ����� !��� ��� � �$� ���� ������ � !���� ���� �� ��� � �!��� ,!��+����������:�������������$ ��������� � �����,,��$����!�,� �����B)��$� !����:� ������ ��� � ������ ���� ���� ���B)+� *���,��� �� ��� �� ����� �� �����!���� �$�� �� �� ,� �������� �����!�� ����� B)� ����!�� ������ ���� �����!� ���� ����!!���+����� ������� �� ����� ��������� ���$������ ��������,,�!���,�������!�� I����,�
�� ����� ��� !��� ��!�� �� ���!�� !�,���!��� ��� $���� ��� ���� �,,�!��� ,� ���!��!�,���!�� �� �!� �� ��� ���� ����, ��� ,� ���� ��� F�� �� ���� �� � ����� ���!��+�� ������������������,��������� ������ ���, �� ����D�G!��� ����������� �� !�E+��*���� ��!�� I���� ���� �� ��� ������� ����� ������ ,� ���!�� !�,���!�A�
!��� ��!��������������,����!��������������������� ��,�B)��������� ����!�������!��+� 6���������$�������� ����� ��������� ��!�� I��� �� ������ ����� ���� ���������� ,�!�,���!���!� ����+��� ��������������!��� ��!������ ���� ��������,,�!����$���������!���$ ��� �!�����:� !�,�+�*��� ,�!�� ����� �� ���!��$ ��� ��� �G�� ! ��:�!�,�����$ ��� ��� ��!�,���!�� ��������:� �� �������� ����� �� !���:�$ ��� �������+�*� ��!�����������������,�!�������!�: ������!��� ��!�������������� ����� �� !�� ��,����� �����!��,�!�,� ������������ ���:��� ���:����������!�L���
Proceedings
74

�
�
!��"��*������ !��������,�B)�!�,���!����������, ��+�
��� ������ ��!�,���� �+������������������ ��,����� �����!��,�B)�����������!���������� �,����!�+�*� �� ������ ���� � ������ ����!�����������!���$��������: �������B)L������������� ��� ���+�6�� ��� ����� !�,���!�� ���� � �� , !���� �,����!�� �� �������B)8�����������, ��+�
��������������������!���������� ��������!�,���!��������:���� �� ������,�������� ���,��!� ��� �:�����I��� �:�����������������������,�!����G �:����� ���+�6,������ ����� ���������,�!�,���!�����������!���!�,� �����B)�M�!����������8!�,� ������!���M����� ���:����!� ����� �����������,�����������, ��+��2��!�� !�,���!�� �� ���� �� � ���:� ���! ����� $ ��� ���������� ����� ��������+�
*��� �������� ���� ��� ��� $��� ,���� ,� �!!��� �� ��� ����� ��8$ ��� �������!� �� ��� ��� �� ���� , �� ���$���� 6*� ���� ��� ����� �!������� ���� ���� ������ ����������� F ��� � �� � ��� ��� �������!:� ,�� ������� �!������ ���� �:�����+�*�����������������,�������:�� ���,�B���� ���)!� ��!����������!� ��������,�$� !�� �� ���� ���������L� �G�� ��!�� �� ���������� �� ���!�� !��� ��!�� $ ��� B)+�B���! ���:�,�����������$�����, ������� ����������,����!��� ������ ,, !���������A���� ����H6*� �� ������� �� �!������ ���� ������ ��� ������� �� � ����� �:������ ����:� !���:�B)8������� ����������� ������� F�� �� �� � ���:����������������!��� ,��!����� ���������� �+� 6�� �� ����,�� ��� ��� ��:� ���G��!���� �� , ��� ����� ���8� ��� ��� $ ��� ���!�� !�,���!�� ���+� ������� ���� �� ��� ���� �� !���:� � �� , !�������! �� ���$��� ,���� ,� ���� ������� ������ ��!�� ��� �!� �� ��� ��� F�� ������ � �:������� � ��� �� ���� �������!���� �������!����G �:�,�������� F�� �+���������,���������,������� �$�,������ �� , !�����,,�!��+�2�� !���� ������ ��� �� ���� ,�!�� ����� ���!�� !�,���!�� ������ �� ����� ���
���!�� �� ��� F�� �8$ ��� ����, ��� ����� �� ���!�8������ ����, ��+� *� �� ����8������� ����� D���!�� !�,���!�� �E�B)� �� ������ ��� ������� ,�!�� �� �!� �� �������� ��8$ ��� ����, ��� ���� ����+� ;���G����� ,�!���� ��!�� ��� ���� �!�� !� ��!��������� F�� ����� F�������������D������E� �,����!�+�*�!�!�������� ������:�������$�� ����� B)� ,,��� � ,,����� � ���� ,� ������� ���� ����� ��� � ���� �,,�� �� �I� ���,������6��!���� �:���,��, ������,� ����� ��������� ��+�
5th SIKS/BENAIS Conference on Enterprise Information Systems
75
Designing for Innovation: Using EnterpriseOntology Theory to Improve Business-IT
Alignment
Philip Huysmans, Kris Ven, and Jan Verelst
University of Antwerp, Belgium{philip.huysmans,kris.ven,jan.verelst}@ua.ac.be
In today’s economy, innovation plays an increasingly important role in thestrategy of organizations. Managers therefore need to understand and be ableto manage the innovation process. It has been noted that “[a]t a time when somuch attention is given to innovation and entrepreneurship, it is rather patheticthat a deep understanding of the process is lacking. It is no wonder that firmsand governments have difficulty trying to stimulate (and manage) innovationwhen its fundamental processes are so poorly understood.” [2, p. 3].
In our research, we aim to contribute to a more effective innovation processby focusing on the structure of organizational artefacts which allows the realiza-tion of innovations. This research direction is framed in the emerging scientificarea called Enterprise Engineering. Enterprise Engineering builds on existingapproaches including organizational theory and information systems sciences inorder to purposefully design organizations. The ability to adopt innovations de-pends largely on the ability to realize changes to the organizational artefacts.There is consensus in literature that information technology (IT) is an impor-tant enabler for the implementation of innovations. Most enterprise architectureframeworks acknowledge the importance of aligning the information technol-ogy (IT) infrastructure with the enterprise architecture. Therefore, the recentresearch efforts in the enterprise architecture domain are very relevant for inno-vation research in enterprise engineering.
This paper, which was originally presented at the ICITIE conference [1],contributes to insights regarding three important issues in the enterprise ar-chitecture domain. First, organizations are competing in increasingly volatileenvironments. In such environments, no long-term competitive advantages canbe obtained, and organizations need to strive towards realizing a succession ofshort-term competitive advantages. Therefore, the enterprise and its supportingIT architecture should be well-aligned, in order to be able to quickly adapt tochanging environments.
Second, many enterprise architecture frameworks have a descriptive, ratherthan prescriptive nature. Although such frameworks are able to describe theoriginal and the revised structure of the organization, it remains unclear whythe applied changes resulted in a desirable outcome for the organization. Thisinsight is essential to be able to repeat the architectural process in the future.Consequently, using these frameworks does not contribute to the understandingof the innovation process.
Proceedings
76

Third, it has been observed that enterprise architecture frameworks consti-tute a heterogeneous collection without clear integration, and that their theoret-ical foundations are currently still limited. A common theoretical foundation atthe organizational and information systems level could improve alignment, andcould provide prescriptive rules for the architecture. In our research, we proposemodularity as a theoretical foundation. Modularity has already been used atboth the organizational and information systems level.
As argumented by Enterprise Engineering, a systematic and scientific ap-proach for constructing enterprise architectures should contribute to a solutionfor these three issues. Therefore, we analyze in this paper a case study of asuccessful enterprise architecture project with these issues in mind. In the casestudy, we focus on a European organization that is able to realize substantialimprovements in implementing innovations by aligning its IT and enterprise ar-chitecture. In both architectures, the same modular structure is used to createloosely coupled entities. At the IT level, the application portfolio consists ofloosely coupled applications which are based on high-level, stable business ac-tivities from the enterprise architecture. This approach allows business and ITstaff to implement changes more quickly, whereas IT used to be considered asa bottleneck in innovation projects. More specifically, we identify advantagesin the areas of alignment, change assessment, reuse, and improvements to thedevelopment process. Notwithstanding the successful outcome of this enterprisearchitecture project, the approach taken by the organization strongly relies onthe heuristic knowledge of employees: no guidelines or principles are used toidentify the appropriate granularity of the modules. As a result, the repeatabil-ity and reproducibility of their approach is limited, and no explicit knowledgeabout the alignment is gained. In order to develop a better understanding ofthe process elements which can lead to the identified results, a more systematicmethod is proposed.
Based on the insights from practice, we therefore attempt to contribute to amore systematic method to construct enterprise architectures. We take a designscience approach by repeating the enterprise architecture project using the En-terprise Ontology theory. Our results show that the model created by followingthe Enterprise Ontology theory was very similar to the model created by theorganization, which is a desirable result. The main advantage of Enterprise On-tology is that it provides a more repeatable and reproducible result and that theresulting models are more evolvable. This result shows that scientific research inEnterprise Engineering can be relevant and applicable.
References
1. Huysmans, P., Ven, K., Verelst, J.: Designing for innovation: Using enterprise on-tology theory to improve business-it alignment. In: Shishkov, B., Tsihrintzis, G.A.,Virvou, M. (eds.) Proceedings of the 1st International Conference on IT-enabledInnovation in Enterprise (ICITIE 2010). pp. 177–186. SciTePress (July 2010)
2. Teece, D.J. (ed.): The Competitive Challenge: Strategies for Industrial Innovationand Renewal. Ballinger Publishing Company, Cambridge, MA (1987)
5th SIKS/BENAIS Conference on Enterprise Information Systems
77

EXTENDED ABSTRACT
Developing a business model engineering & experimentation tool – the quest for scalable ‘lollapalooza
confluence patterns’1
Björn Kijl*, Durk Boersma*
* University of Twente, School of Management & Governance, PO Box 217, 7500 AE Enschede, The Netherlands
{b.kijl, d.boersma}@utwente.nl
Keywords: Business models, action design research, business model engineering, business model dynamics, business model experimentation, business model management, business model innovation, growth & deployment strategies, lollapalooza tendencies, Internet services, service innovation, entrepreneurship, startups.
1 The growing importance of business model innovation
In a globalizing world where consumer electronics (CE), information technology (IT), telecom, and media are converging, opportunities for new Internet services are emerging [1, 2]. With increasing marketplace dynamics, shorter time-to-market cycles and rapid technological developments, the ability to imagine and combine different, formerly separated, technological capabilities in order to facilitate new and useful value propositions for users and customers will be critical [3]. To be able to offer these value propositions with new Internet services in a sustainable manner, new viable business models need to be developed [4-6] – in the end, every service needs a viable business model. 2 Struggling with business models
Essentially, a business model can be seen as a definition of the way by which an organization or group of organizations delivers value to customers, entices them to
1 Recommended Citation:
Kijl, Björn and Boersma, Durk, "Developing a business model engineering & experimentation tool – the quest for scalable ‘lollapalooza confluence patterns’" (2010). AMCIS 2010 Proceedings. Paper 567. http://aisel.aisnet.org/amcis2010/567
Proceedings
78

pay for value and converts those payments to profit [6-8]. Business model research is a relatively new field of research – the concept of a business model has no established theoretical grounding yet in economics or business studies [7]. A business model supports simulating, analyzing and understanding current or new business concepts and exploiting these concepts [9, 10]. Business model design can be seen as a key decision for new firm entrepreneurs [11] and with increasing technological possibilities, more and more companies are struggling on the level of business model innovation instead of on the level of technological innovation [12].
A lot of high tech start-ups still fail by focusing too much on technology instead of
on business model aspects like value network structures, revenue models and value propositions – they just ‘forget’ to consciously think about the quality and logic of their underlying business model and directly start writing a business plan [13]. Having a great technology is no guarantee for success; a viable business model may even be more critical [12-15]. About 90% of the start-ups have to change their business model before going to market – for them it is critical to know as early as possible whether a business model design is viable or not [3, 8, 16].
3 An action design study of business model experimentation
Currently, most business model research is focused on business model design, whereas there is almost no attention for validation and implementation of business models [6, 8]. The goal of the research as described in this paper is to test a business model engineering method supporting business model experimentation as a continuous design, validation and implementation cycle. The method is applied to an online investment research start-up in the form of an in depth action design study [17, 18] – the author of this abstract co-founded and also still manages the company and its business model – of the companies’ business model evolution as a continuous design, validation and implementation cycle as well as the related experimentation and effectuation processes [15, 19] – from the establishment of the company in 2007 till the beginning of 2010. The start-up started with an easily scalable freemium business model [10] by offering a free weekly investment column to a small mailing list of about 100 Dutch and Belgian investors and a related paid monthly stock analysis service based on value investing principles [20]. Directly from the beginning, as many processes as possible were automated by making use of e.g. online payment systems, mailing systems, content protection systems and membership management systems. In about two years, related business model experimentation and effectuation actions – focusing on creating nonlinear, so called ‘lollapalooza’ growth patterns [21] – led to a strong underlying growth: the list size multiplied more than 300-fold, it led to a Dutch best seller on investing principles as well as the introduction of a new premium subscription service.
Based on the results of the action design study as described above, the business model engineering method as developed and tested in earlier research [see e.g. (Haaker and Kijl 2008) and (Kijl et al. 2010)] will be further discussed, improved and extended in the paper.
5th SIKS/BENAIS Conference on Enterprise Information Systems
79

References
1. Standage, T., Your television is ringing. The Economist: A Special Report on the Future of Telecoms, 2006: p. 14-20.
2. Klemettinen, M., Enabling technologies for mobile services: The MobiLife book. 2007: Wiley.
3. Kijl, B., et al., Developing a dynamic business model framework for emerging mobile services, in ITS 16th European Regional Conference. 2005: Porto, Portugal.
4. Haaker, T., et al. Challenges in designing viable business models for context-aware mobile services. in 3rd International CICT Conference (Mobile and Wireless Content, Services and Networks). 2006. Technical University of Denmark, Center for Information and Communication Technologies, Kongens Lyngby, Denmark.
5. Haaker, T., et al. Challenges in designing viable business models for context-aware mobile services. in CollECTeR Iberoamérica. 2007. Córdoba, Argentina.
6. Bouwman, H., et al., Conceptualizing the STOF Model, in Mobile Service Innovation and Business Models, H. Bouwman, T. Haaker, and H. De Vos, Editors. 2008, Springer Verlag: Berlin. p. 31-70.
7. Teece, D.J., Business Models, Business Strategy and Innovation. Long Range Planning. In Press, Corrected Proof.
8. Kijl, B. and L.J.M. Nieuwenhuis, Deploying a Telerehabilitation Service Innovation: An Early Stage Business Model Engineering Approach, in HICSS-43. 2010: Hawaii.
9. Osterwalder, A., Y. Pigneur, and C. Tucci, Clarifying business models: Origins, present, and future of the concept. Communications of the Association for Information Systems, 2005. 16(1): p. 1-25.
10. Osterwalder, A. and Y. Pigneur, Business Model Generation: A Handbook for Visionaries, Game Changers, and Challengers. 1st Edition ed. 2009: OSF.
11. Zott, C. and R. Amit, Business Model Design: An Activity System Perspective. Long Range Planning. In Press, Corrected Proof.
12. Chesbrough, H., Open business models: How to thrive in the new innovation landscape. 2006: Harvard Business School Press.
13. Allen, K., Growing and managing an entrepreneurial business. 1999. 14. Pieper, R., V. Kouwenhoven, and S. Hamminga, Beyond the Hype-e-Business
Strategy in Leading European Companies. 2002. 15. Chesbrough, H., Business Model Innovation: Opportunities and Barriers. Long Range
Planning. In Press, Corrected Proof. 16. Kalles, v., B., Subsidie aan starter werkt averechts. Het Financieele Dagblad, 2009. 17. Rossi, M. and M. Sein, Design research workshop: a proactive research approach.
Presentation delivered at IRIS, 2003. 26: p. 9–12. 18. Sein, M., et al., Action Design: Where Design Meets Action In Research. MIS
Quarterly, 2010. conditionally accepted for publication. 19. Sarasvathy, S., Effectuation: elements of entrepreneurial expertise. 2008: Edward
Elgar Publishing. 20. Oude Nijhuis, H. and B. Kijl, Leer beleggen als Warren Buffett - Zijn
beleggingsstrategie in theorie & praktijk. 2009, Arnhem: Sonsbeek Publishers. 160. 21. Bevelin, P., Seeking wisdom: from Darwin to Munger. 3rd edition ed. 2007: PCA
Publications L.L.C.
Proceedings
80

Session 5:
Supply Chains


Inter Organizational Relationships Performance in Third Party Logistics:
conceptual framework and case study
Romana Aziz1, Jos van Hillegersberg1, Kuldeep Kumar2
1 Department of Information Systems and Change Management, University of Twente
{r.aziz, , j.vanhillegersberg}@utwente.nl 2 Department of Decision Sciences and Information Systems, College of Business
Administration, Florida International University, USA [email protected]
Extended abstract: This paper presents some of the results of the Inter-organizational Supply-chain EAsing (ISEA) project which was targeted at improving control and coordination in buyer – supplier relationships between Shell Chemicals Europe (SCE) and their portfolio of logistic service providers (LSPs). ISEA project was embedded in the larger Transumo Diploma project which was funded by the Dutch Government (www.transumo.nl).
At the time of this research SCE was experiencing day-to-day firefighting, which occurred when unresolved issues bounced back from the LSPs to SCE’s staff. Moreover SCE was also facing difficulties in managing their relationships with the LSPs. SCE did not feel that they had enough leverage over their LSPs and they did not understand why some LSPs were causing more work relative to other LSPs. The senior SCE managers were wondering if they had contracted the right mix of LSPs.
ISEA project investigated the buyer supplier relationships in third party logistics from four related angles, i.e., why some LSPs perform better than others? how can we select an optimum LSP portfolio and how can we improve the performance of portfolio by reallocating volume levels among LSPs? what process and IT related issues negatively impact logistics process? and how can we solve issues that negatively impact logistics process?
This paper presents a part of our research conducted along the first theme, i.e., why some LSPs perform better than others? In this paper our main research question is how can we analyze and understand the relationship performance of a shipper with its network of LSPs? The main research question leads to three sub questions: 1) What are the main factors that affect inter organizational relationship performance in third party logistics? 2) How do these different factors affect performance in third party logistics? and 3) How do these factors affect relationship performance in a real life context? We developed a conceptual framework to answer the first two sub questions and this framework served as a conceptual lens for our empirical research in the form of a case study to answer the third sub question.
Based on review and integration of current literature and exploratory interviews with practitioners we propose a conceptual framework and propositions centered on inter organizational relationship performance factors in third party
5th SIKS/BENAIS Conference on Enterprise Information Systems
83

logistics. Five main dimensions of inter organizational relationships are identified which affect performance in third party logistics:
1. Commitment: Based on information sharing, goal congruence, power imbalance in favor of shipper and trust.
2. Adaptation: Based on supplier dependencies and learning orientation. 3. Conflict resolution: Based on control and relational norms. 4. Compatibility: Based on planning capabilities, IT use and management
structure. 5. Communication: Based on quality and formality.
In order to assess the validity of our conceptual model we include a case study in this paper. The case study is based on Shell Chemicals Europe and their portfolio of seventeen third party logistic service providers. The data for this case study was collected via observation, interviews, documents and questionnaires. The data collected during the case study generated insights that confirmed our proposed propositions.
The main contribution of this paper is in the form of an original framework describing the elements of relationships that affect performance in third party logistics. The findings presented in this paper are relevant for practitioners and academics. Practitioners can use these findings as a prescriptive resource while targeting their efforts for performance improvement in logistics outsourcing and use these insights to develop effective relationship management strategies. Our contribution for the academics is in the form of a conceptual framework and propositions for relationship performance factors in third party logistics and testing of propositions in a qualitative case study. The framework and the propositions can serve as a useful basis for the development of a more general theory for relationships development in third party logistics.
Keywords: Third party logistics, logistics performance factors, inter organizational relationships, logistics portfolio.
�Original Contribution: Romana Aziz, Jos van Hillegersberg, Kuldeep Kumar, (2010) Inter Organizational Relationships Performance in Third Party Logistics: conceptual framework and case study, In: Pioneering Solutions in Supply Chain Management. A Comprehensive Insight into Current Management Approaches (Kersten W., Blecker T., Luthje C.) Erich Schmidt Verlag GmbH &Co. KG, Berlin 2010, Vol.Operations and Technology Management Series Vol. 14 pp.105-126, ISBN:9783503126859
Proceedings
84

Architecture Support for Flexible ChainManagement
R. Seguel, R. Eshuis, and P. Grefen
Information Systems Group, School of Industrial Engineering,Eindhoven University of Technology, The Netherlands.{r.e.seguel,h.eshuis,p.w.p.j.grefen}@tue.nl
Abstract. In competitive markets, organizations collaborate in busi-ness chains using dynamic service outsourcing to deliver complex prod-ucts and services. To enable the flexible formation of business chains,organizations can use protocol adaptation to ensure that their businessprotocols are compatible. In this paper, we present three different soft-ware architectures that enable the flexible formation and enactment ofdifferent chain structures, in which the protocol adaptation component isa key enabler. We show the feasibility of the approach by extending soft-ware architecture definitions from the literature for each flexible chainformation case.
Keywords: Business Chains, Dynamic Service Outsourcing, InteractingServices, Protocol Adaptor, Service Adaptation, Software Architecture
1 Introduction
Nowadays, the production of complex products and services in competitive mar-kets involves a number of autonomous organizations [8] that collaborate in busi-ness chains. By locating the customer order decoupling point (CODP) in thebusiness chain we identify three chain structures: demand chain, supply chainand hybrid demand/supply chain [13]. The CODP indicates how deeply the cus-tomer order penetrates into a business chain. Due to the shorter life-cycles andincreasing complexity of products and services [6], the organizations in a businesschain collaborate in a just-in-time fashion, using dynamic service outsourcing.In dynamic service outsourcing, an organization outsources a part of its busi-ness process, for instance order fulfillment, to a partner that is selected at thelast possible moment from the marketplace [6]. This way, the organizations col-laborate by invoking functionalities from each other according to their businessprotocols in their public process view [2, 4]. Each public process view abstractsan underlying private business processes that is executed by the organization.
In current dynamic service outsourcing approaches [7,8], the tacit assumptionis made that interacting protocols are compatible: each sent message is receivedand processed by the other party, and thus no deadlocks occur. However, col-laborating organizations have their own protocol that specifies their own way ofworking and they may easily have incompatible protocols. Since organizations
5th SIKS/BENAIS Conference on Enterprise Information Systems
85

collaborate in a just-in-time fashion, incompatible business protocols hinder theflexible formation of business chains. To configure business chains in a flexibleway the organizations can use protocol adaptation to ensure that their businessprotocols are compatible [13].
The goal of this paper is to present a supporting software architecture foreach flexible chain formation case that we described in [13]. The software archi-tectures are an extension and integration of two software architectures from theliterature [7,8] that support the formation and enactment of supply and demandchain networks. The presented software architectures include business protocoladaptation as a key component to support the flexible configuration and en-actment of business chains. The protocol adaptation component constructs anadaptor to resolve (if possible) incompatibilities between interacting servicesduring chain formation, using any existing adaptation method [1, 10–12,14–16].
Although there is some work on cross-organizational workflow collaborationusing process views [2, 8, 9] they do not include adaptation in their architecturedefinitions. In this paper, we focus on adaptation of behavioral mismatches ratherthan interface mismatches. An interface mismatch is due to differences in theformats and specifications of messages exchanged that can be resolved usingschema mapping and transformation tools [11,15]. We will extend our approachadding interface adaptation in future work. However, we do not expect that thisactually impacts the presented software architectures.
The contributions of this paper are three software architectures to supportthe flexible formation of business chain [13], in which the protocol adaptationcomponent is a key enabler.
The remainder of this paper is organized as follows. Section 2 describes thethree flexible chain formation cases. Section 3 presents the architecture supportfor flexible formation of demand chains. Section 4 details the architecture toenable the flexible configuration of supply chains. Section 5 describes the archi-tecture for flexible hybrid demand/supply chain formation. Section 6 discusses athird-party adaptation factory and Section 7 presents the conclusions and futurework.
2 Flexible Business Chain Management
There are three scenarios for flexible formation of business chains [13]. Eachscenario defines the responsibility of a partner to construct a protocol adaptorto resolve (if possible) incompatibilities between their business protocols. Weshow in Figure 1 a business chain to illustrate the adaptation responsibilityfor each business chain formation scenario. The letters outside the services inFigure 1 represent the place where the protocol adaptor is constructed.
This way, in a flexible demand chain formation scenario [13], the serviceconsumer defines its business protocol according to the customer business re-quirements. Since the CODP is moved to the last provider in the demand chain,the responsibility of constructing an adaptor is always of the provider; see b©and d© in Figure 1. In a flexible supply chain formation scenario [13], the service
Proceedings
86
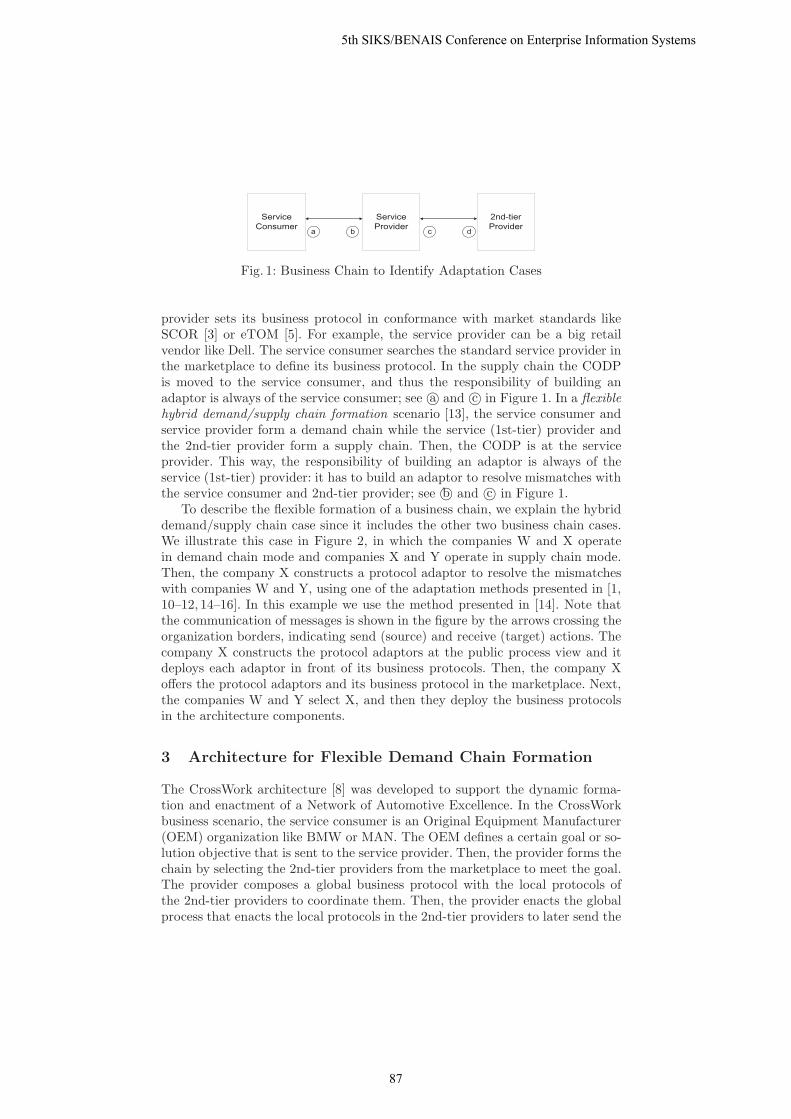
a b c d
Service
Consumer
2nd-tier
Provider
Service
Provider
Fig. 1: Business Chain to Identify Adaptation Cases
provider sets its business protocol in conformance with market standards likeSCOR [3] or eTOM [5]. For example, the service provider can be a big retailvendor like Dell. The service consumer searches the standard service provider inthe marketplace to define its business protocol. In the supply chain the CODPis moved to the service consumer, and thus the responsibility of building anadaptor is always of the service consumer; see a© and c© in Figure 1. In a flexiblehybrid demand/supply chain formation scenario [13], the service consumer andservice provider form a demand chain while the service (1st-tier) provider andthe 2nd-tier provider form a supply chain. Then, the CODP is at the serviceprovider. This way, the responsibility of building an adaptor is always of theservice (1st-tier) provider: it has to build an adaptor to resolve mismatches withthe service consumer and 2nd-tier provider; see b© and c© in Figure 1.
To describe the flexible formation of a business chain, we explain the hybriddemand/supply chain case since it includes the other two business chain cases.We illustrate this case in Figure 2, in which the companies W and X operatein demand chain mode and companies X and Y operate in supply chain mode.Then, the company X constructs a protocol adaptor to resolve the mismatcheswith companies W and Y, using one of the adaptation methods presented in [1,10–12, 14–16]. In this example we use the method presented in [14]. Note thatthe communication of messages is shown in the figure by the arrows crossing theorganization borders, indicating send (source) and receive (target) actions. Thecompany X constructs the protocol adaptors at the public process view and itdeploys each adaptor in front of its business protocols. Then, the company Xoffers the protocol adaptors and its business protocol in the marketplace. Next,the companies W and Y select X, and then they deploy the business protocolsin the architecture components.
3 Architecture for Flexible Demand Chain Formation
The CrossWork architecture [8] was developed to support the dynamic forma-tion and enactment of a Network of Automotive Excellence. In the CrossWorkbusiness scenario, the service consumer is an Original Equipment Manufacturer(OEM) organization like BMW or MAN. The OEM defines a certain goal or so-lution objective that is sent to the service provider. Then, the provider forms thechain by selecting the 2nd-tier providers from the marketplace to meet the goal.The provider composes a global business protocol with the local protocols ofthe 2nd-tier providers to coordinate them. Then, the provider enacts the globalprocess that enacts the local protocols in the 2nd-tier providers to later send the
5th SIKS/BENAIS Conference on Enterprise Information Systems
87

SendProduct
Order
SendDelivery
Details
RecItem
Shipment
Fulfillment Service
Consumer
Public Process View
Company W
Fulfillment Service Provider
RecDelivery
Details
RecProduct
Order
SendItem
Shipment
Public Process View
Receive
Order
Set
ItemList
Put
Items
Get
Items
Interna-
tional
Country-
side
Send
Items
Private Process View
Send
ItemList
Public Process View
Send
TxInfo
Public Process View
Company Y
Rec
TxInfo
Rec
Items
Company X
Deliver Items
Service Provider
RecTx
Info Put
Items
Rec
ItemList
RecProduct
Order
RecDelivery
Details
Public Process View
SendDelivery
Details
SendProduct
Order
Protocol Adaptor
Send
Items
Public Process View
Rec
Items
Protocol Adaptor
Rec
ItemList
Deliver Items
Service Consumer
Send
ItemList
Fig. 2: Adaptation Case for Flexible Hybrid Demand/Supply Chain Formation
result back to the OEM. We extend the CrossWork architecture by adding thearchitecture components to support protocol adaptation. In Figure 3, we illus-trate the CrossWork architecture (white boxes) plus the extension (grey boxes).The extended CrossWork architecture enables the flexible formation of a demandchain at design-time and at run-time.
At design-time, the extended CrossWork architecture is triggered by theservice consumer that defines the solution objective in the goal support mod-ule according to the customer business requirements. The consumer defines itsbusiness protocol according to the goal. Then, the consumer selects the ser-vice provider from the marketplace that meets the goal. The consumer sendsthe goal definition and its business protocol to the service provider. Then, theservice provider checks the compatibility between its business protocol and theconsumer protocol. If the protocols are incompatible, the adaptor factory mod-ule constructs a protocol adaptor to resolve mismatches. The adaptor factoryimplements the adaptation method for tightly and loosely coupled interactingservices [1, 10–12, 14–16]. Then, the provider deploys the business protocol inthe protocol enactment module and the protocol adaptor in the adaptor enact-ment module. Similarly, the service consumer deploys its business protocol inthe protocol enactment module.
Next, the service provider decomposes the goal into a required set of protocols(component services) in the goal support module. Then, the team formationmodule finds the 2nd-tier providers in the marketplace according to the set ofprotocols. Next, the composition module composes the set of protocols into aglobal business protocol. Note that the 2nd-tier providers are not only selectedby protocol compatibility. It means that while there are parts of the global
Proceedings
88

2nd-tier Provider2nd-tier Provider
2nd-tier Provider
Goal
Support
Protocol
Composition
Protocol
Enactment
Adaptor
Factory
Protocol
Enactment
Adaptor
Enactment
Service ProviderService Consumer
Run-t
ime
part
Design-time part
Protocol
Definition
Design-time part Run-time part
Protocol
Compatibility
Check
Team
Formation
Goal
Support
Protocol
Enactment
Legacy
Integration
Adaptor
EnactmentR
un-t
ime
part
De
sign
-tim
ep
art
Adaptor
Factory
Protocol
Compatibility
Check
2nd-tier Provider
Fig. 3: Architecture Extension of CrossWork [8] for Flexible Demand Chain Man-agement
protocol that are compatible with the 2nd-tier providers, there are other partsthat are incompatible with the 2nd-tier provider protocols. This way, the 2nd-tier providers check the compatibility between their business protocols and theset of protocols that compose the global protocol. If they are incompatible, theadaptor factory at the 2nd-tier providers generates a protocol adaptor. Next,each 2nd-tier provider deploys the business protocol in the protocol enactmentmodule and the adaptor in the adaptor enactment module. Finally, the serviceprovider deploys the global protocol in the protocol enactment module. Thisway, the protocols can be later executed by the service consumer and provider,enacting the demand chain with the 2nd-tier providers.
At run-time, the extended CrossWork architecture enables the formation ofthe demand chain when the consumer business protocol is being enacted. This isillustrated with the ‘reverse’ dotted arrow from the protocol enactment moduleto the goal support module in Figure 3. This way, the consumer stops the busi-ness protocol execution to configure the demand chain (at design-time) to latercontinue the enactment of the business protocols. Similarly, the service providercan configure the demand chain with 2nd-tier providers when its protocol is be-ing executed. Note that if the service provider acts as integrator only [6], thenthe adaptation is only needed at the 2nd-tier provider. The service provider usesthe protocol sent by the consumer as global business protocol. Then, the serviceprovider is protocol compatible with the service consumer since they interactto only synchronize the control flow of the global business protocol. The globalbusiness protocol interacts with the 2nd-tier providers, which can need adap-tation. In the basic CrossWork architecture, if the global protocol cannot be
5th SIKS/BENAIS Conference on Enterprise Information Systems
89

2nd-tier Provider2nd-tier Provider
2nd-tier Provider2nd-tier Provider
Protocol
Enactment
Adaptor
Enactment
Service Consumer
Design-time part Run-time part
Adaptor
Factory
Partner
Selection
Protocol
Compatibility
Check
Protocol
Composition
Adaptor
Enactment
Service Provider
Desig
n-t
ime
part
Run-t
ime
pa
rt
Adaptor
Factory
Partner
Selection
Protocol
Compatibility
Check
Protocol
Composition
Protocol
Definition
Protocol
Enactment
Desig
n-t
ime
part
Run-t
ime
part
Partner
SelectionProtocol
Enactment
Protocol
Definition
Fig. 4: Architecture Extension of CrossFlow [7] for Flexible Supply Chain Man-agement
composed then the system backs up to the team formation or even to the goalsupport module to correct it [8]. However, in the extended architecture, thesebacktrack steps are needed only if the adaptor factory module at the 2nd-tierprovider indicates the mismatch cannot be resolved and no adaptor can be con-structed [12, 14]. Note that technically the business protocols and the adaptorcan be enacted using the same enactment engine or two different enactmentengines.
4 Architecture for Flexible Supply Chain Formation
The CrossFlow architecture [7] was developed to support the configuration ofa supply chain, using dynamic service outsourcing. In the CrossFlow businessscenario, the service consumer outsources a non-core part of its business proto-col to a service provider. The service consumer takes the decision of outsourcingduring the execution of its business protocol, and thus it selects the provider atthe last possible moment. This way, the basic CrossFlow architecture is mainlyfocused on run-time supply chain configuration. Note that the architecture wasdeveloped in the pre web services era, but it conceptually supports the collabora-tion of two interacting services which share the business protocols at the publicprocess view. We extend the CrossFlow architecture to support the flexible con-figuration of a supply chain at design-time and at run-time. We illustrate thebasic architecture (white boxes) plus the extension (grey boxes) in Figure 4.
At design-time, the extended CrossFlow architecture is triggered by the con-sumer that selects the service provider from the marketplace to outsource its
Proceedings
90

protocol. Then, the provider sends its standard business protocol to the con-sumer that checks the compatibility with its protocol. If the business protocolsare incompatible, then the service consumer constructs a protocol adaptor. Next,the service consumer couples the outsourced protocol part with its business pro-tocol in the composition module for later deployment in the enactment module.Then, the consumer deploys the coupled business protocol in the protocol en-actment module and the adaptor in the adaptor enactment module. Finally, theservice provider deploys its business protocol in the enactment module after itsent the protocol definition. Similarly, the service provider can outsource partof its protocol by selecting 2nd-tier providers from the marketplace. Then, the2nd-tier providers send their standard business protocol to the provider thatchecks the compatibility with its protocol. If the protocols are incompatible,then the provider adaptor factory module generates the protocol adaptor. Then,the provider couples the outsourced protocol part with its business protocol inthe composition module. Next, the provider deploys the coupled protocol andthe adaptor in the enactment modules while the 2nd-tier providers deploy theirprotocols too. This way, the protocols can be later executed by the service con-sumer and provider, enacting the supply chain with the 2nd-tier providers.
At run-time, the extended CrossFlow architecture supports the configurationof the supply chain when the consumer business protocol is being enacted. Thisis illustrated with the ‘reverse’ dotted arrow from the protocol enactment mod-ule to the partner selection module in Figure 4. Therefore, the consumer stopsthe business protocol execution to configure the supply chain (at design-time) tolater continue the enactment of the business protocols. Then, the service providercan also configure a supply chain with 2nd-tier providers when its protocol isbeing enacted. Note that if the service provider acts as integrator only [6], thenthe adaptation is only needed at the service consumer. The service provider pre-selects the 2nd-tier providers before it is selected by the consumer. Once theprovider is selected, it sends the standard protocol to the consumer. The serviceprovider is protocol compatible with the 2nd-tier providers since they interactto only synchronize the control flow of the business protocol. On the other hand,the consumer protocol interacts with the standard business protocol, which canneed adaptation. Like the extended CrossWork architecture, the CrossFlow ar-chitecture technically support the enactment of the business protocols and theadaptor using the same enactment engine or two different enactment engines.
5 Architecture for Flexible Hybrid Demand/SupplyChain Formation
To support the flexible configuration of a hybrid demand/supply chain, we definethe architecture as an extension of the CrossWork (demand chain) and CrossFlow(supply chain) architectures. We illustrate the architecture for flexible formationof a hybrid demand/supply chain in Figure 5. It supports the configuration ofthe hybrid chain at design-time and at run-time.
5th SIKS/BENAIS Conference on Enterprise Information Systems
91

2nd-tier Provider2nd-tier Provider
2nd-tier Provider2nd-tier Provider
Goal
Support
Protocol
Enactment
Adaptor
Factory
Adaptor
Enactment
Service Provider
Run-t
ime
part
Design-time part
Protocol
Compatibility
Check
Team
Formation
Adaptor
Enactment
Protocol
Enactment
Service Consumer
Protocol
Definition
Design-time part Run-time part
Goal
Support
Desig
n-t
ime
part
Run
-tim
ep
art
Partner
SelectionProtocol
Enactment
Protocol
Definition
Protocol
Composition
Fig. 5: Architecture for Flexible Hybrid Demand/Supply Chain Management
At design-time, the architecture is triggered by the service consumer thatconfigures a demand chain with the provider. The consumer defines the solu-tion objective in the goal support module according to the customer businessrequirements. Then, the consumer defines its business protocol according to thegoal and selects the service provider from the marketplace that meets the goal.Then, the consumer sends the goal definition and its business protocol to theservice provider. Next, the service provider checks the compatibility between itsbusiness protocol and the consumer protocol. If the protocols are incompatible,the adaptor factory module constructs a protocol adaptor to resolve mismatches.Then, the provider deploys the business protocol in the protocol enactment mod-ule and the protocol adaptor in the adaptor enactment module while the serviceconsumer deploys its business protocol in the protocol enactment module.
At this stage, the service provider configures a supply chain with 2nd-tierproviders. Next, the service provider decomposes the goal into a required setof protocols (component services) in the goal support module. Then, the teamformation module finds the 2nd-tier providers in the marketplace according tothe set of protocols. Next, the composition module composes the set of protocolsinto a global business protocol. Then, the 2nd-tier providers send their standardbusiness protocol to the provider that checks the compatibility with its protocol.If the protocols are incompatible, then the provider adaptor factory module gen-erates the corresponding protocol adaptors. Finally, the service provider deploysthe global protocol and the adaptors in the enactment modules while each 2nd-tier provider deploys its protocol in the enactment module too. This way, theprotocols can be later executed by the services by enacting the demand chain
Proceedings
92

between the consumer and provider and the supply chain between the providerand 2nd-tier providers.
At run-time, the extended architecture supports the configuration of the hy-brid demand/supply chain when the consumer and provider protocols are beingenacted. This is illustrated with the ‘reverse’ dotted arrow in Figure 4. The con-sumer stops the business protocol execution to configure the demand chain (atdesign-time) to later continue the enactment of the business protocols. Similarly,the service provider stops the protocol execution to configure the supply chain(at design-time) with the 2nd-tier providers to later continue with the protocolenactment.
Note that if the service provider acts as integrator only [6], then the adapta-tion is needed for compatibility with either the 2nd-tier providers or the serviceconsumer. In both cases the adaptor is constructed and deployed by the ser-vice provider. In the first case, like in the extended CrossWork case, the serviceprovider uses the protocol sent by the consumer as global business protocol.Then, the provider and consumer protocols are compatible since they interactto only synchronize the control flow. Thus, the global business protocol partsinteract with the 2nd-tier providers, which can need adaptation. In the secondcase, like in the extended CrossFlow case, the service provider pre-selects the2nd-tier providers before it is selected by the consumer. Then, the provider hasto generate an adaptor if the consumer and provider protocols are incompati-ble. The service provider and the 2nd-tier providers are compatible since theyinteract to only synchronize the control flow of the global business protocol parts.
6 Third-party Adaptor Factory
The architectures that we defined for flexible formation of business chains sup-port the participation of a trusted third-party that provides adaptation as aservice (AaaS). The third-party is an adaptor factory that constructs and enactsprotocol adaptors to support the flexible configuration of business chains. Thisway, the service consumer, service provider or 2nd-tier providers can buy theadaptation service from the trusted third-party, and thus they do not need toadd the adaptor factory module in their architectures themselves. The partici-pation of the third-party does not cause conceptual changes to the architecturesdefined previously, but technically it needs to add the technology to ensure qual-ity of services and security, which are outside the scope of this paper.
7 Conclusions and Future Work
We have presented three software architectures that considers protocol adapta-tion component as a key enabler of flexible chain formation. Any existing protocoladaptation approach can be used to realize the actual adaptation. The presentedarchitectures enables the flexible formation of business chains between organi-zations that collaborate in a just-in-time fashion to meet a solution objective,which is very important in competitive markets.
5th SIKS/BENAIS Conference on Enterprise Information Systems
93

There are several directions for future work. We plan to extend our approachadding interface adaptation to the adaptor factory. We are currently extendingour approach to define a reference architecture in which the presented threesoftware architectures can be described. Moreover, we will extend our approachto deal with adaptation of running business chains that deadlock due to thepropagation of changes on the partner business protocols.
References
1. A. Brogi and R. Popescu. Automated generation of BPEL adapters. In Proc.ICSOC’06, pages 27–39. Springer, 2006.
2. D. Chiu, S. Cheung, S. Till, K. Karlapalem, Q. Li, and E. Kafeza. Workflow viewdriven cross-organizational interoperability in a web service environment. Infor-mation Technology and Management, 5(3-4):221–250, 2004.
3. Supply Chain Council. SCOR: Supply-Chain Operations Reference model; version9.0, 2008. http://www.supply-chain.org.
4. R. Eshuis and P. Grefen. Constructing customized process views. Data and Knowl-edge Engineering, 64(2):419–438, 2008.
5. TM Forum. eTOM: enhanced Telecom Operations Map; release 8.0, 2008.http://www.tmforum.org/.
6. P. Grefen. Mastering E-Business. Routledge, 2010.7. P. Grefen, K. Aberer, Y. Hoffner, and H. Ludwig. CrossFlow: Cross-Organizational
Workflow Management in Dynamic Virtual Enterprises. Computer Systems Sci-ence & Engineering, 1(5):277–290, 2000.
8. P. Grefen, R. Eshuis, N. Mehandjiev, G. Kouvas, and G. Weichhart. Internet-basedsupport for process-oriented instant virtual enterprises. IEEE Internet Computing,13(6):65–73, 2009.
9. D-R. Liu and M. Shen. Business-to-business workflow interoperation based onprocess-views. Decision Support Systems, 38(3):399–419, 2004.
10. R. Mateescu, P. Poizat, and G. Salaun. Adaptation of service protocols usingprocess algebra and on-the-fly reduction techniques. In Proc. ICSOC’08, pages84–99. Springer, 2008.
11. H.R. Motahari Nezhad, G.Y. Xu, and B. Benatallah. Protocol-aware matching ofweb service interfaces for adapter development. In Proc. WWW’10, pages 731–740.ACM, 2010.
12. R. Seguel, R. Eshuis, and P. Grefen. Constructing minimal protocol adaptors forservice composition. In Proc. WEWST ’09, pages 29–38. ACM, 2009.
13. R. Seguel, R. Eshuis, and P. Grefen. Business protocol adaptation for flexible chainmanagement. In Robert Meersman, Tharam Dillon, and Pilar Herrero, editors, Onthe Move to Meaningful Internet Systems: OTM 2010, volume 6426 of LectureNotes in Computer Science, pages 438–445. Springer, 2010.
14. R. Seguel, R. Eshuis, and P. Grefen. Minimal protocol adaptors for loosely coupledservices. In Proc. ICWS’10, pages 417–424. IEEE, 2010.
15. Z. Shan, A. Kumar, and P. Grefen. Towards integrated service adaptation - a newapproach combining message and control flow adaptation. In Proc. ICWS ’10,pages 385–392. IEEE, 2010.
16. D.M. Yellin and R.E. Strom. Protocol specifications and component adaptors.ACM Transactions on Programming Languages and Systems (TOPLAS), 19:292–333, 1997.
Proceedings
94

Session 6:
Process Model Transformations


Transforming Standard Process Models toDecentralized Autonomous Entities
Pieter Hens1, Monique Snoeck1, Manu De Backer1,2,3,4, and Geert Poels2
1 K.U.Leuven, Dept. of Decision Sciences and Information Management,Naamsestraat 69, 3000 Leuven, Belgium
2 Universiteit Gent, Dept. of Management Information and Operations Management,Tweekerkenstraat 2, 9000 Gent, Belgium
3 Universiteit Antwerpen, Dept. of Management Information Systems,Prinsstraat 13, 2000 Antwerpen, Belgium
4 Hogeschool Gent, Dept. of Management and Informatics,Kortrijksesteenweg 14, 9000 Gent, Belgium
Abstract. Today, in state of the art process engine architectures, pro-cess models are executed by a central orchestrator (i.e. one per process).There are however a lot of drawbacks in using a central orchestrator,including a single point of failure and performance degradation. Decen-tralization algorithms that distribute the workload of the central orches-trator exist, but the result still suffers from a tight coupling betweenthe different decentralized orchestrators and therefore has a decreasedscalability. In this paper, we show practical transformations to decen-tralize a process model into autonomous, independent process engines.This solves the fundamental problems of the classical decentralization al-gorithms, increases the availability of the global process flow and makesit easier to re-specify and redeploy process models.
1 Introduction
In the last couple of years, process modeling received increasing attention fromresearchers and practitioners. Especially with the arrival of service oriented com-puting, process modeling became even more important. Starting from atomicservices, new aggregate services can be built by combining the atomic servicesand describing an execution flow between the different entities. This way com-posite services are created, which can again be used in other compositions.When these compositions are described with a specific executable language (e.g.BPEL4WS [1] or BPMN 2.0 [2]), automated enactment using a process enginecan be accomplished. The description of the process flow can be interpreted bya process engine (or orchestrator), which coordinates and triggers the describedwork.
Typically, the execution of each composite service (or process) is coordinatedby one central entity (Fig. 1a, coordinator C0). This central orchestrator isinitiated upon a request from a client and starts the execution of the workflowlogic described in the composite service (Fig. 1a, tasks T1, T2 and T3). This iscalled centralized orchestration [3].
5th SIKS/BENAIS Conference on Enterprise Information Systems
97
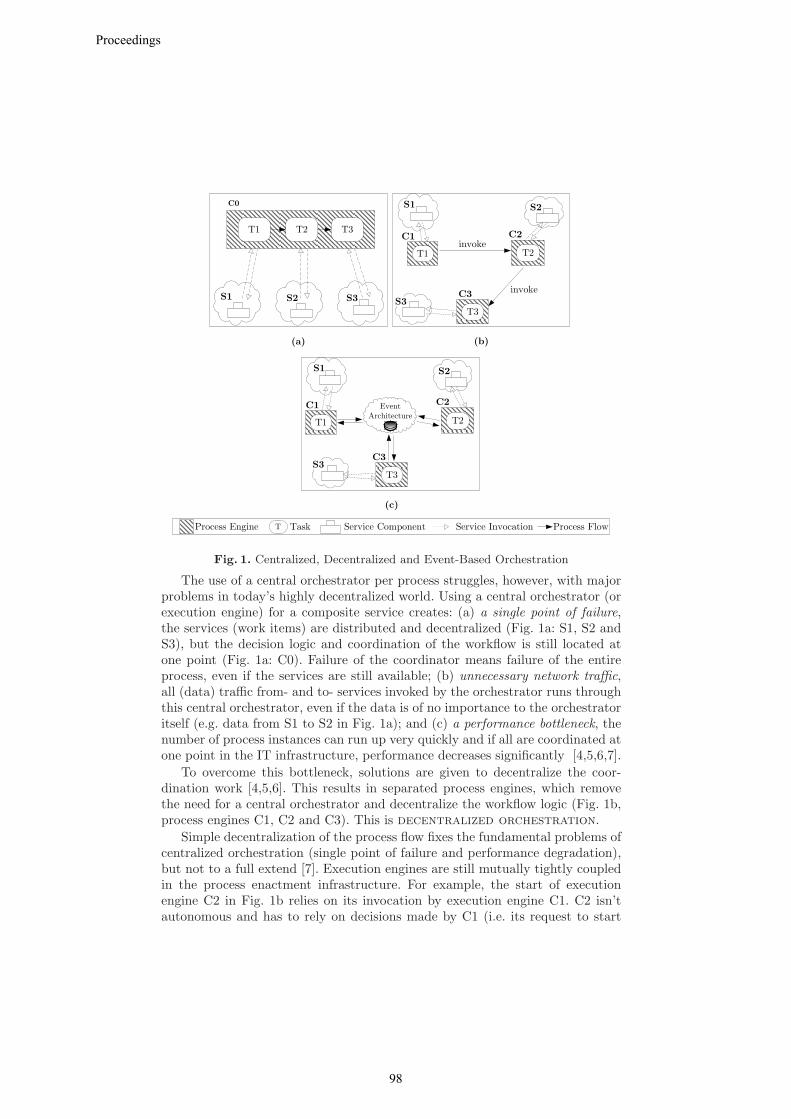
�� ��
��
��
��
��
��
����
����� ������ �
��
��
��
��
��
��
��
��
��
�� �
��
�� �� ��
��
�� �� ��
�� ���������� �� ��������������� �� ������������ � ����������
�����
�����
Fig. 1. Centralized, Decentralized and Event-Based Orchestration
The use of a central orchestrator per process struggles, however, with majorproblems in today’s highly decentralized world. Using a central orchestrator (orexecution engine) for a composite service creates: (a) a single point of failure,the services (work items) are distributed and decentralized (Fig. 1a: S1, S2 andS3), but the decision logic and coordination of the workflow is still located atone point (Fig. 1a: C0). Failure of the coordinator means failure of the entireprocess, even if the services are still available; (b) unnecessary network traffic,all (data) traffic from- and to- services invoked by the orchestrator runs throughthis central orchestrator, even if the data is of no importance to the orchestratoritself (e.g. data from S1 to S2 in Fig. 1a); and (c) a performance bottleneck, thenumber of process instances can run up very quickly and if all are coordinated atone point in the IT infrastructure, performance decreases significantly [4,5,6,7].
To overcome this bottleneck, solutions are given to decentralize the coor-dination work [4,5,6]. This results in separated process engines, which removethe need for a central orchestrator and decentralize the workflow logic (Fig. 1b,process engines C1, C2 and C3). This is decentralized orchestration.
Simple decentralization of the process flow fixes the fundamental problems ofcentralized orchestration (single point of failure and performance degradation),but not to a full extend [7]. Execution engines are still mutually tightly coupledin the process enactment infrastructure. For example, the start of executionengine C2 in Fig. 1b relies on its invocation by execution engine C1. C2 isn’tautonomous and has to rely on decisions made by C1 (i.e. its request to start
Proceedings
98

C2). The logic of the next step in the process is located with the caller (C1), andnot with the callee (C2). This tight coupling creates inflexible IT infrastructuresand decreases scalability of the process architecture [8].
To solve the tight coupling, we proposed an extension to decentralized orches-tration, which uses an event-based architecture as the communication paradigmin decentralized orchestration (see Fig. 1c) [7]. Decentralized Event-BasedOrchestration will create autonomous process engines, capable of assessingtheir environment and deciding on their own when to initiate their execution(which is a useful property in process management [9]). It also creates a highlyloose coupled infrastructure, which makes changes to the process flow relativelyeasy (‘plug and play’ of process engines). Notice that we’ve introduced an eventdriven architecture to support the decentralization of the process flow (full ar-rowhead arrows in Fig. 1), not for the invocation of services (open arrowheadarrows in Fig. 1), which has already been accomplished by many others (SOAand EDA [10]).
To gain the benefits from decentralized event-based orchestration, funda-mental transformations of the modeled process flow are necessary. In this paperwe’ll introduce the practical transformations involved in transforming a stan-dard (global) process to a decentralized event-based orchestrated process. Theoutcome of this transformation is a process model that can be executed by sev-eral event-based process engines (or orchestrators). Each orchestrator will beautonomous and distributed, which increases scalability and removes the singlepoint of failure.
In the next section we briefly explain decentralized event-based orchestration,followed by the positioning of the transformations in process development andenactment (Sect. 3). In Sect. 4 we show the actual transformations involved intransforming a process model to a decentralized event-based model. In Sect. 5we end the paper with a conclusion and some implications of this research.
2 Decentralized Event-Based Orchestration
Decentralized event-based orchestration is the coordination of a single processflow by multiple, autonomous orchestrators [7]. Each orchestrator coordinates alittle piece of the global, entire process flow. Thus, combined, they coordinate theglobal process as modeled by the process modeler. Communication between theorchestrators is accomplished by means of an event based architecture. An eventbased architecture is a communication paradigm that uses a publish/subscribeinteraction scheme. An event is something that happens, and when an event oc-curs, a notification of this event occurrence is published in the architecture. Thearchitecture then routes this notification to interested parties (the subscribers).
Using a publish/subscribe interaction scheme accomplishes loose coupling be-tween two communicating entities. These include: space decoupling (unawarenessof interaction partners), time decoupling (interaction partners don’t need to beactive at the same time) and synchronization decoupling (asynchronous send andreceive) [11,7]. Using an event based architecture for decentralized orchestration
5th SIKS/BENAIS Conference on Enterprise Information Systems
99

thus removes the tight coupling between the different distributed execution en-gines, which makes the process architecture more scalable. New process engineswhich consume already published events, can simply be added to the processarchitecture without making any changes to the already running infrastructure.Note that the supporting entities in an event based architecture (the cloud inFig. 1c) are also loosely coupled and don’t add another single point of failure.Many solutions exist that distribute the event based architecture itself [8].
A second consequence of using an event driven architecture in a processdecentralization setting is that each execution engine becomes autonomous. Adecentralized orchestrator can asses its environment, and when the environmentis in a certain state (i.e. some specific events happened), it starts its execution.An orchestrator doesn’t rely anymore on messages that request its initiation,in stead it decides for itself when to start. After execution, the orchestratorpublishes a notification of its occurrence. This event alters the environment,whereupon other orchestratorsmay react and execute their process logic. A chainof these event publications and consummations (assessment of the environment)results in the execution of the process flow as modeled by the process modeler.
3 Deploying a Process Specification
Transforming a process model to a decentralized event-based model happens atdeployment time. This enables the process modeler to not take decentraliza-tion into account when designing the process model. Figure 2 shows a processspecification-deployment structure. First a process modeler designs a global, fullyspecified, executable process model. This model not only specifies the flow, butalso specifies which service(s) will handle which tasks defined in the process flow(service invocations, see top part of Fig. 3). After process specification, the pro-cess can be deployed. It is at this time that the specified process will undergo atransformation which decomposes the process into smaller parts. Note again thatour decentralization focuses on transforming the process logic, not the invocationof services.
������������� ��
���������������
����������� ���
���������������� ��
�������� ������������ ���
�������������
�������������
Fig. 2. Deployment and re-specificationof a process model in an event-based or-chestration
To decentralize the process flow, aunit of decomposition has to be cho-sen. The unit of decomposition canbe anything from a task to a groupof process elements (tasks, gateways,. . . ). Each unit of decomposition willbe deployed to a separate executionengine, resulting in a one-to-one map-ping between unit of decompositionand coordinator. This is illustrated inFig. 3, with the unit of decompositiona task. Each task in the original pro-cess flow (T1, T2, T3 and T4) is to
Proceedings
100

be deployed on its own process engine (C1, C2, C3 and C4).
After deployment, re-specification and redeployment of the process modelcan be done with little effort. The process modeler can re-specify the globalprocess model, after which only the changed items in the process flow will needto be redeployed (see Fig. 2). The already existing not-changed items can beleft running without interruption. This is possible due to the space decouplingproperty of event-based orchestration [7].
��
��
��
��
��
��
������������������� ��
���
��
��!�� ����"������
��
��!����#$
��!����#$
��%&#$��%&#$
��!����#$
��%&#$
��%&#$
��!����#$
'����&
�� ���
��
� �����������%�����
�� ��
��
��
Fig. 3. Deploying a process specification to a decentralized event-based orchestration
4 Transformation
To illustrate the transformations involved in deploying a process specification toa decentralized event-based orchestration, we use BPMN 2.0 [2] as the notationin which the process is specified. Besides a workflow notation, BPMN 2.0 hasa token based execution semantics. This makes it possible to directly executeprocess models defined in BPMN 2.0. Process engine solutions like jBPM [12]and Activiti [13] already support this feature. Because BPMN 2.0 defines a vastamount of entities that can occur in the process model, we define the scope for ourtransformations to the Standard Process Models as defined by [14]. A StandardProcess Model embodies process elements which are connected to each otherby transitions. A process element is either an activity, an AND-Split, a XOR-Split, an OR-Split, an AND-Join and a XOR-Join. These elements correspondto the basic control flow patterns, together with the multi-choice control flowpattern [15].
The outcome of our decentralization is also compliant with the BPMN 2.0metamodel. This way, any BPMN 2.0 process engine can eventually run the de-centralized process model (if it supports the used concepts and a publish/subscribecommunication architecture).
5th SIKS/BENAIS Conference on Enterprise Information Systems
101

4.1 Translating the Unit of Decomposition
We choose a task as the unit of decomposition in our transformation. This guar-antees a fine grained decentralization. Each task gets translated to a separateprocess containing that same original task, (multiple) start event(s) and oneend event (see Fig. 4 for an example). The unique end event indicates the no-tification of the tasks accomplishment. This end event is transcribed in BPMN2.0 as a throw signal event. Signal events indicate events that are not processbound, multiple processes can have start events that are triggered from the samebroadcasted signal. The semantics of a signal-event resemble closely an event-notification of an event-based architecture. They are thus the most appropriatenotation to symbolize our loosely coupled event structure.
As start for the new process, event rules need to be calculated. An event ruleis a rule stating in which situation this new process can start. For example, thestart rule (EventA AND EventB) XOR (EventC), simply says that the processstarts after the occurrence of event A and event B or after the occurrence ofevent C. For each task, this rule is deduced from the original global processmodel (the input for the transformation). Event rules are transcribed by usinga catch signal event. A conjunction in the event rule is indicated by displayingthe start event with a parallel multiple marker. Disjunctions in the event ruleare denoted by using multiple start events. This notation ensures that an eventrule is always expressed in a Disjunctive Normal Form (DNF). Figure 4 showsan example of the resulting new process for one unit of decomposition (task).
������
���������� �
���������� ����������� �
���������� �
Fig. 4. Result of a single task after the decomposition of a process flow
4.2 Event Rules
To find the start event rule of a task, the preceding elements in the process flowhave to be investigated:
Sequence Flow. The most basic start rule for a task is that it can only startafter the successful completion of the preceding task in the sequence flow.Figure 5a shows the corresponding transformation. Task X starts after thecompletion of task A. Our unit of decomposition is a task, thus it is put ina separate process, with as start event a catch of the signal indicating theend of task A.
Proceedings
102

Exclusive Gateway. If the incoming flow of a task is connected with anexclusive gateway, the start of the task is dependent on the successful execu-tion of one of the tasks preceding the exclusive gateway. The event rule for atask connected with an exclusive gateway is thus a disjunction of the signalsindicating the completion of the process elements preceding the exclusivegateway. Figure 5b shows this transformation.
Conditions on preceding sequence flows. BPMN 2.0 states that the con-ditions belonging to an OR- and XOR-split are put on the sequence flowssucceeding the OR- and XOR- gateway (conditional flow). If the conditionis valid, that specific path in the process is ‘chosen’. These conditions shouldbe conveyed to the newly created decentralized process and displayed on thecorrect sequence flow (see Fig. 5c). This means that the (decentralized) taskwill only start when the environment is in a certain state (i.e. some eventshappened) and when the condition on the respective sequence flow is true. Itis possible that, when multiple exclusive gateways are linked together, mul-tiple conditions should be true before the task can start. All these conditionsare put in conjunction on the respective sequence flow.
Parallel Gateway. Figure 5d and 5e illustrate the transformation for atask with its incoming sequence flow connected to a parallel gateway (ei-ther AND-split or AND-join). The event rule becomes a conjunction of thecompletion-notifications of the process elements preceding the parallel gate-way. Observe that for an AND-split only one signal event (Signal-EventA)is used to trigger the multiple catch events (for tasks X and Y). This reducesthe number of different event messages that need to be exchanged in the de-centralized orchestration, compared to creating a separate signal event foreach flow outgoing the AND-gateway.
Linked Gateways. Gateways can also be directly linked together by sequenceflows (see Fig. 5d). In this situation the event rule has to be calculatedrecursively according to the transformations described above. The eventualrule is put in DNF so that it can be represented in the BPMN schema (seeSect. 4.1). Figure 5d shows an example. Following the transformations statedabove results in an event rule for task X: TaskA∧ (TaskB ∨TaskC) and inDNF: (TaskA ∧ TaskB) ∨ (TaskA ∧ TaskC).
4.3 Formal Implementation
We have implemented the transformation in the Atlas Transformation Language(ATL) [16]. ATL is available as a plugin in the Eclipse Modeling Frameworkand provides a way to declaratively describe the transformation of a sourcemodel (supported by a metamodel) to a target model. Figure 6a shows thetransformation structure. As input, the transformation takes a source modelwhich conforms to the BPMN 2.0 metamodel (any BPMN Diagram Interchangefile [2]). The output of the transformation is also a model conforming to theBPMN 2.0 metamodel. The output file (a BPMN Diagram Interchange file)can be directly uploaded in any process engine supporting BPMN 2.0. If the
5th SIKS/BENAIS Conference on Enterprise Information Systems
103

������������ �������������������
�����
�����
������
���
���������������� �
���
���� ���
�����������
����������� �
�����
�����
������
�����
����
����������� ������������
����������� �
���
���
���
����� �����
������
�����
���
�����
���
����������� �
����������� �
���
����������� �
���
�!���������� ����������"#�$���
������������ ����������%��$���
���
�����
�����
������
���������������� ������������
����������� �
���
����
����&
����������� ������������ &
����������� �����������'��� ����
�'���������� ����������%������
�����
����(
������
�����
�����
����������� �
���
���
����������� �
����(����������� (����������� �
���
���
����������� �
����������� �
�����
����(
������
�����
�����
����������� �
����(����������� (
����������
����������
����������
����������
������������ ������"#� ��'��"#����� �
���
Fig. 5. Deploying Standard Process Flow elements to a decentralized event-based or-chestration
Proceedings
104

engine implements signal event communication in a publish/subscribe fashion,the benefits described in [7] will become available.
A small excerpt of the ATL transformation code is found in Fig. 6b. Thetransformation contains only one matching rule1 which translates a task in thesource model to a new resulting process as described in Sect. 4.1.
�����)� �)� �)�'��
��* +)%,-.
+)%,-.
+)%,���� +)%
�������)�'��
����� �)�'��
&������ �&������ � &������ �
&������ �
&������ �&������ �
�������� ���
��������,+�����/������0� +)%,.1������������0� +)%,.1���������'�2� -�'3��������2� -�������3����'��0� +)%,.1��'���� ������'�2� 4��'���� 4�5�-�'3������� ����� ����2� �� �� �����3���� �� ��0� +)%,.1���������� ����� ���������'�2� 4�� �� ��4�5�-�'3��������#��2� �� �� ���������3���� �� ������0� +)%,.1������������'�2� 4������4�5�-�'�3���3�������0� +)%,.1+����������'�2� 4�'�+����4�5�-�'3������������ �2� ��������/������63������������ �2� ��������/�� �� ���7���63������������ �2� ��������/��'��63������������ �2� -�� ���� #�������8������� ���9� :�)�'���-���� �� �� ���� ����
���
&������ �
������*� ������� ���� ��� ����!���;���� ��� :����*� +)%,���� +)%�
������� ������'�
Fig. 6. ATL Transformation
5 Conclusion, Implications and Future Research
In this paper we introduced the practical transformations necessary to transforma standard process model to a decentralized event-based orchestration.
Using an event based communication paradigm in a decentralized orchestra-tion creates highly flexible, autonomous entities, which increase scalability andavailability of the process flow. By doing the transformations at deployment, theprocess modeler doesn’t need to know the decentralization details. Deploymentof a changed process flow can also be done fairly quickly, without the need tointerrupt the current (unchanged) process entities.
Another implication of working with an event based architecture in processenactment is that event-logs of the running processes become readily available.
1 A matching rule is a rule that matches an entity from the source model to newentities in the target model
5th SIKS/BENAIS Conference on Enterprise Information Systems
105

This enables easier access to process mining [17] or complex event processing [18].Yet another application can be agent based development, where the operationsof the agents are noted in a process flow-like style.
Future research includes widening the scope of the transformable processelements to a level 2 process modeling [19], which includes subprocesses, inter-mediate events, transactions, . . . as well as including data management. We alsointend to prove the correctness of the transformation rules with process algebraand formally validate the added value by testing on availability (stress testing)and scalability of the decentralized event-based process flow.
References
1. Oasis: Web service business process execution language version 2.0. Oasis Standard2. Object Management Group: Draft proposal for: Bpmn 2.0, beta 2.
http://www.omg.org/cgi-bin/doc?dtc/10-06-04 (May 2010)3. Barros, A., Dumas, M., Oaks, P.: Standards for web service choreography and
orchestration: Status and perspectives. BPM Workshops 61–744. Chafle, G., Chandra, S., Mann, V., Nanda, M.: Decentralized orchestration of
composite web services. Proceedings of the 13th international World Wide Webconference on Alternate track papers & posters (2004) 134–143
5. Muth, P., Wodtke, D., Weissenfels, J., Dittrich, A., Weikum, G.: From centralizedworkflow specification to distributed workflow execution. Journal of IntelligentInformation Systems 10(2) (1998) 159–184
6. Nanda, M., Chandra, S., Sarkar, V.: Decentralizing execution of composite webservices. ACM SIGPLAN Notices 39(10) (2004) 170–187
7. Hens, P., Snoeck, M., De Backer, M., Poels, G.: Decentralized Event-Based Or-chestration. In: Third International Workshop on Event-Driven Business ProcessManagement. (2010)
8. Muhl, G., Fiege, L., Pietzuch, P.: Distributed Event-Based Systems. Springer-Verlag New York, Inc. Secaucus, NJ, USA (2006)
9. Jennings, N., Norman, T., Faratin, P., OBrien, P., Odgers, B.: Autonomous agentsfor business process management. Applied Artificial Intelligence 14(2) (2000)
10. Michelson, B.: Event-driven architecture overview. OMG report (2006)11. Eugster, P., Felber, P., Guerraoui, R., Kermarrec, A.: The many faces of pub-
lish/subscribe. ACM Computing Surveys (CSUR) 35(2) (2003) 13112. jBPM. http://jboss.org/jbpm13. Activiti. http://www.activiti.org/14. Kiepuszewski, B., ter Hofstede, A., van der Aalst, W.: Fundamentals of control
flow in workflows. Acta Informatica 39(3) (2003) 143–20915. van Der Aalst, W., Ter Hofstede, A., Kiepuszewski, B., Barros, A.: Workflow
patterns. Distributed and parallel databases 14(1) (2003) 5–5116. Jouault, F., Allilaire, F., Bezivin, J., Kurtev, I., Valduriez, P.: ATL: a QVT-like
transformation language. In: the 21st ACM SIGPLAN symposium. (2006)17. van der Aalst, W.M.P., van Dongen, B.F., Herbst, J., Maruster, L., Schimm, G.,
Weijters, A.J.M.M.: Workflow mining: A survey of issues and approaches. Data &Knowledge Engineering 47(2) (2003) 237–267
18. Luckman, D.: The power of events: an introduction to Complex Event Processing.Addison-Wesley (2002)
19. Silver, B.: BPMN Method and Style. Cody-Cassidy Press (2009)
Proceedings
106

Unified Patterns to transform business rules intoan event coordination mechanism[1]
Willem De Roover and Jan Vanthienen
Department of Decision Sciences & Information Management,Katholieke Universiteit Leuven, Belgium
(willem.deroover;jan.vanthienen)@econ.kuleuven.be
Abstract. Business rules define and constrain various aspects of thebusiness, such as vocabulary, behavior and organizational issues. En-forcing the various rules of the business in information systems is notstraightforward, because different mechanisms exist for the transforma-tion of business rules into model driven implementations, leading topartial solutions for process management, data constraints, audit con-straints, etc. In this paper, we examine if and how business rules, notonly data rules, but also process rules, timing rules, authorization rules,etc., can be expressed in SBVR and translated using patterns into a moreuniform event mechanism, such that the event handling could provide anintegrated enforcement of business rules of many kinds.
The need for a unified framework Business rules should be on the one handcomprehensible so that they can be understood by business people and on theother hand formal so that they can be enforced by information systems. TheSemantics of Business Vocabulary and Business Rules (SBVR), a new standardfor business modeling within the Object Management Group (OMG), has suchproperty.
SBVR is a language to describe the structure and the meaning of vocabularyand business rules in terms of formalized statements about the meaning. Thisalso makes SBVR a suitable base language for defining process-aware rules, butit does not contain a vocabulary with process related concepts such as agents,activities, process states and events. To this end we extended SBVR with avocabulary for expressing process-related concepts, called the EM-BrA2CE Vo-cabulary.
Business Rule Types SBVR extended with the EM-BrA2CE Vocabulary al-lows us to define three groups of business rules: (1) Data rules constrain par-ticular manipulations of data. (2) Control-flow rules constrain the execution ofactivities. (3) Organizational aspects constrain the authorization to perform andsee particular activities.
Patterns for transforming business rules into event rules Enforcing thedifferent types of rules of the business in information systems is not straight-forward, different mechanisms exist for the (semi-)automatic transformation of
5th SIKS/BENAIS Conference on Enterprise Information Systems
107
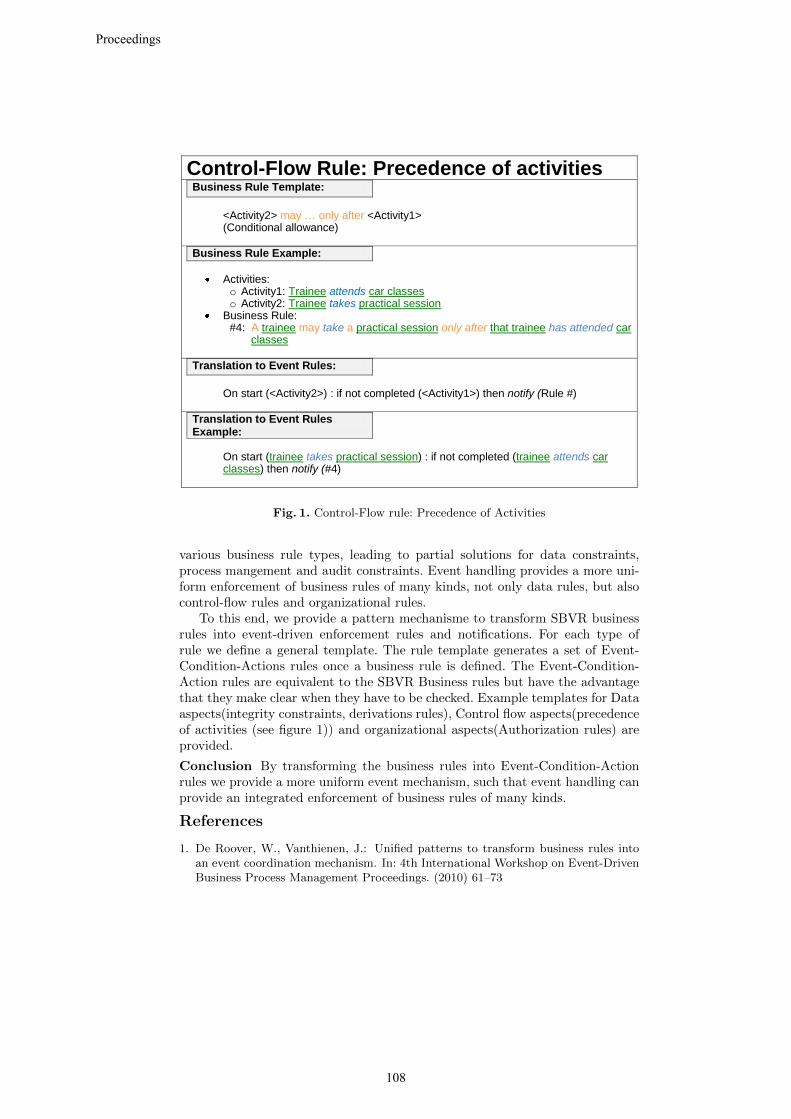
Control-Flow Rule: Precedence of activities
Business Rule Template:
<Activity2> may … only after <Activity1> (Conditional allowance)
Business Rule Example:
Activities: o Activity1: Trainee attends car classes o Activity2: Trainee takes practical session
Business Rule: #4: A trainee may take a practical session only after that trainee has attended car
classes
Translation to Event Rules:
On start (<Activity2>) : if not completed (<Activity1>) then notify (Rule #)
Translation to Event Rules Example:
On start (trainee takes practical session) : if not completed (trainee attends car classes) then notify (#4)
Fig. 1. Control-Flow rule: Precedence of Activities
various business rule types, leading to partial solutions for data constraints,process mangement and audit constraints. Event handling provides a more uni-form enforcement of business rules of many kinds, not only data rules, but alsocontrol-flow rules and organizational rules.
To this end, we provide a pattern mechanisme to transform SBVR businessrules into event-driven enforcement rules and notifications. For each type ofrule we define a general template. The rule template generates a set of Event-Condition-Actions rules once a business rule is defined. The Event-Condition-Action rules are equivalent to the SBVR Business rules but have the advantagethat they make clear when they have to be checked. Example templates for Dataaspects(integrity constraints, derivations rules), Control flow aspects(precedenceof activities (see figure 1)) and organizational aspects(Authorization rules) areprovided.
Conclusion By transforming the business rules into Event-Condition-Actionrules we provide a more uniform event mechanism, such that event handling canprovide an integrated enforcement of business rules of many kinds.
References
1. De Roover, W., Vanthienen, J.: Unified patterns to transform business rules intoan event coordination mechanism. In: 4th International Workshop on Event-DrivenBusiness Process Management Proceedings. (2010) 61–73
Proceedings
108

Papers of Interest

Towards Robust Conformance Checking
(Extended Abstract)
A. Adriansyah, B.F. van Dongen, and W.M.P. van der Aalst
Department of Mathematics and Computer ScienceEindhoven University of Technology
P.O. Box 513, 5600 MB Eindhoven, The Netherlandsa.adriansyah,b.f.v.dongen,[email protected]
The growing complexity of processes in many organizations stimulates theadoption of business process management (BPM) techniques. Process modelstypically lie at the basis of these techniques and generally, the assumption ismade that the operational business processes as they are taking place in practiceconform to these models. However, recent experience has shown that this oftenisn’t the case. Therefore, the problem of checking to what extent the operationalprocess conforms to the process model is increasingly important.
In [1], we provide a robust method for calculating conformance between alog and a process model. First, we introduce flexible models that provide anabstraction of many languages and allow for the modeling of complex controlflow constructs, such as OR-split/joins and multiple tasks that represent thesame activity. We provide semantics for these models, but without specifyinghow to execute them. Instead, we show that in the context of a case that hasbeen recorded in the log, we can construct instances of the model that maxi-mize certain conformance metrics. Finally, using experiments on simulated data(comparable in size to real-life data sets), we show that our approach calculatesfitness correctly in the presence of complex constructs, where existing approachesdo not.
Given a process model and an event log, our approach does not only solve theproblem of having inaccurate conformance results, but also opens possibilitiesto compare conformance values for a given log between different models made indifferent languages. With existing approaches, conformance comparison betweentwo process models and a given log require both models to be created in the sameprocess modeling language. We soften the requirement such that models can bein different modeling languages as long as they can be represented as abstractmodels.
The work presented in this paper provides a solid basis for robust confor-mance checking. Since our flexible models do not have executable semantics,we do not rely on state-space exploration (which is required in Petri-net basedconformance checking). Using the approach presented in [1], we plan to definemetrics that capture different dimensions of conformance. Furthermore, our ap-proach can easily be extended to identify the “skipping” of activities, i.e. byidentifying which tasks were executed but not logged.
Our approach is fully implemented in Version 6 of the ProM framework, thatcan be obtained from http://www.processmining.org, evaluated using simulated
5th SIKS/BENAIS Conference on Enterprise Information Systems
111

event logs and compared against an existing conformance technique based onPetri nets. By experiments, it is proven that the proposed approach providebetter insights to conformance between a given process model and an event log,particularly when advanced control flow constructions (e.g. OR split, OR join)exist in the model.
References
1. A. Adriansyah, B.F. van Dongen, and W.M.P. van der Aalst. Towards Robust Con-formance Checking. In Proceedings of the 6th International Workshop on BusinessProcess Intelligence (BPI 2010 - accepted), 2010.
Proceedings
112
Abstracting Common Business Rules to PetriNets
(Abstract)
Kees van Hee1, Jan Hidders2, Geert-Jan Houben2, Jan Paredaens3, andPhilippe Thiran4
1 Eindhoven University of Technology, The Netherlands2 Delft University of Technology, The Netherlands
3 University of Antwerp, Belgium4 University of Namur, Belgium
These days Business Information Systems (BIS) have a highly responsible task:they execute large parts of the business processes autonomously. So organiza-tions become more and more dependent on their BIS. Business processes usuallyrequire a certain order in which activities have to be executed. On top of that,there are many other business rules that should be met by the execution ofbusiness processes, e.g., the famous Sarbanes-Oxley rules (cf. [1]) and the Gen-eral Accepted Accounting Principles (GAAP). Business rules can be required byany stakeholders, such as management, government, shareholders and businesspartners, both clients and suppliers. In this paper we take it for granted that aBIS has some unknown errors and that the system is for all stakeholders moreor less a black box. Instead of a human auditor we propose here an approachwhere the BIS is extended by an independent monitor system that checks theessential business rules on the fly and that reports violations of business rules orthat interrupts the BIS to prevent the occurrence of a violation.
As basic terminology we use workflow notions such as task, case, agent andresource. This is consistent with the terminology for accounting information sys-tems where the REA (Resource, Event and Agent) data-model is used frequently.This model is an Entity-Relationship model for accounting information systems[2–4]. We assume that business processes are described by traces which are heredefined as sets of events where events are partial functions that map event prop-erties to property values. Event properties can be either a standard mandatoryproperty such as time, case, task, agent or a certain type of resource that isinvolved in the event such as money or used materials. A property value canbe either a task name, an agent, a basic value, or a rational number where thelatter is also used to represent time stamps. The values of standard propertiesare restricted so they have property values of the right type.
The syntax of the BRL, the business rule language we present here, is definedby the following abstract grammar:
F ::= ¬F | (F ∧ F ) | 〈PS = E, . . . , PS = E〉 | E = E | E < E.
E ::= X | DS | Σ(X : F )E | (E + E).
Here F denotes boolean formulas and E expressions that return a property value.The non-terminals PS and DS represent event properties and property values,
5th SIKS/BENAIS Conference on Enterprise Information Systems
113
respectively, and X represents variables that range over property values, whichincludes time-stamps. The value of the formulas and expressions are definedw.r.t. to a certain trace. There are three special workflow constructs with specificworkflow semantics: formulas of the form e1 < e2, formulas of the form 〈p1 =e1, . . . , pk = ek〉 and expressions of the form Σ(x : ϕ)e. The first comparesthe values of e1 and e2 according to the ordering defined over the propertyvalues, which includes the time ordering over time-stamps. The formula 〈p1 =e1, . . . , pk = ek〉 states that the trace contains at least one event ev such thatev(p1) = v1, . . . , ev(pk) = vk where v1, . . . , vk are the values of the expressionse1, . . . , ek for the trace. The expression Σ(x : ϕ)e is a sum quantifier which sumsthe values of expression e for each property value x that occurs in the traceand satisfies the formula ϕ. For example, Σ(xt : (xt = xt))(Σ(xp : 〈time =xt,payed = xp〉)xp) computes the total amount of money payed.
The sum quantifier allows us to formulate business rules about aggregates ofused and produces resources such as “for each case at each moment the totalamount of used bread does not exceed the amount of previously delivered bread”.In addition it can also be used to formulate more standard workflow rules con-cerning precedence, such as “an event for task a is always followed by an eventfor task b”. For example, the formula (Σ(x : 〈time = x, task = a〉)1) > 0 checksif at least one event for task a has occurred.
In the full paper it is shown how for certain types of rules in BRL we candefine a monitor system that is able to check them on the fly and in parallel to abusiness information system. This is done by translating parts of the evaluationof business rules into the execution of a Petri net [5] by using history-dependentPetri nets [6]. This is an efficient way of checking rules because it can be donein an incremental way, i.e., event by event, using a Petri net engine. If the Petrinet cannot execute a transition, then a rule is violated and this can be reported,or it may generate an interrupt for the BIS and trigger an exception handler. Inthe future we will also try to transform larger classes of business rules.
References
1. Berg, D.: Turning Sarbanes-Oxley projects into strategic business processes.Sarbanes-Oxley Compliance Journal (2004)
2. Romney, M.B., Steinbart, P.J.: Accounting Information Systems. 11 edn. PearsonInternational Editions (2009)
3. Geerts, G.L., McCarthy, W.E.: An ontological analysis of the economic primitivesof the extended-REA enterprise information architecture. International Journal ofAccounting Information Systems 3(1) (2002) 1–16
4. McCarthy, W.E.: The REA accounting model: A generalized framework for account-ing systems in a shared data environment. The Accounting Review 57(3) (1982)554–578
5. Reisig, W.: Petri Nets: An Introduction. Volume 4 of Monographs in TheoreticalComputer Science: An EATCS Series. Springer-Verlag, Berlin (1985)
6. van Hee, K., Serebrenik, A., Sidorova, N.: Token History Petri Nets. Fundam. Inf.85(1-4) (2008) 219–234
Proceedings
114

5th SIKS/BENAIS Conference on Enterprise Information Systems
115
