6 case studies in humidity buffering by porous walls · 6 case studies in humidity buffering by...
TRANSCRIPT
6
CASE STUDIES IN HUMIDITY BUFFERING BY POROUSWALLS
Humidity buffering in the real world
The purpose of the experimental part of this thesis has been to give some quantitativesupport to the concept of using interior walls as buffers for the interior climate,particularly in museums and archives. In this chapter I describe some case historieswhere the principle of using porous materials as a buffer has been applied in real life. Insome of these examples buffering has not been the intent of the builder.
Humidity buffering by the walls of Fanefjord Church
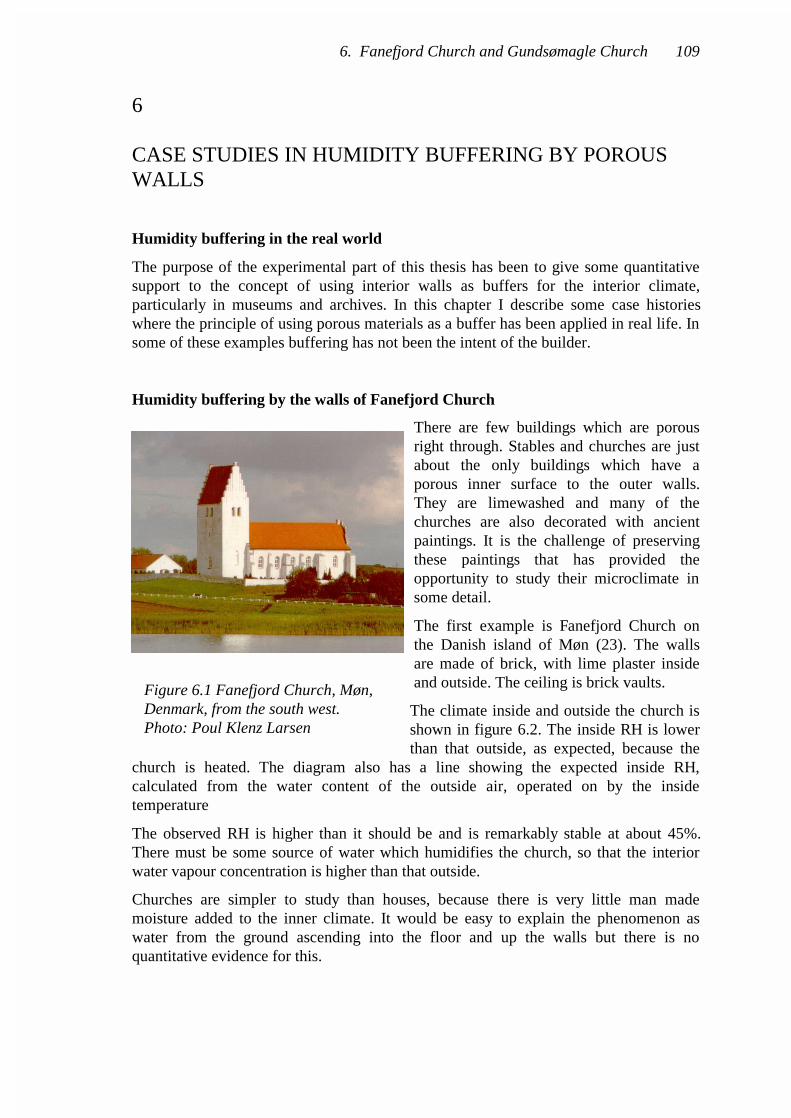
There are few buildings which are porousright through. Stables and churches are justabout the only buildings which have aporous inner surface to the outer walls.They are limewashed and many of thechurches are also decorated with ancientpaintings. It is the challenge of preservingthese paintings that has provided theopportunity to study their microclimate insome detail.
The first example is Fanefjord Church onthe Danish island of Møn (23). The wallsare made of brick, with lime plaster insideand outside. The ceiling is brick vaults.
The climate inside and outside the church isshown in figure 6.2. The inside RH is lowerthan that outside, as expected, because the
church is heated. The diagram also has a line showing the expected inside RH,calculated from the water content of the outside air, operated on by the insidetemperature
The observed RH is higher than it should be and is remarkably stable at about 45%.There must be some source of water which humidifies the church, so that the interiorwater vapour concentration is higher than that outside.
Churches are simpler to study than houses, because there is very little man mademoisture added to the inner climate. It would be easy to explain the phenomenon aswater from the ground ascending into the floor and up the walls but there is noquantitative evidence for this.
6. Fanefjord Church and Gundsømagle Church 109
Figure 6.1 Fanefjord Church, Møn,Denmark, from the south west.Photo: Poul Klenz Larsen

The observed buffering cannot be explained by buffering by the wall in the moderateRH region of the sorption curve. This can only provide buffering for about a day. Amodel prediction of the performance of a brick church is shown in the next diagram.
Figure 6.3 A computer model of a brick building with 0.1 air changes per hour, asmeasured in Fanefjord Church. The model simulates the onset of the heating season byusing a very low outside RH of air at the same temperature as the church interior.
110 6. Fanefjord Church and Gundsømagle Church
Figure 6.2 The climate inside Fanefjord Church. The red line marked 'Inert' RH iscalculated from the water content of the outside air raised to the inside temperature.The measured RH is much higher. This humidification is attributed to movement ofwater inwards through the wall, so that the RH across the wall tends to equality,rather than the vapour pressure, as orthodox theory would suggest. Climate datafrom Poul Klenz Larsen.

The computer model predicts that the interior RH will only be buffered by the wallsover a period of about a day, with the long term adjustment to the average prevailing RHsubstantially complete after about a week. The observed buffering must be caused byanother mechanism altogether.
Gundsømagle Church
The same pattern of climate occurs in Gundsømagle church in Zealand, Denmark(figure 6.4). This church is built mainly of lime tufa, which has a very open, porousstructure and is reputed to hold water and give damp interiors. The wall is covered on
both sides by lime mortar and limewash.
The indoor climate in winter has a muchhigher RH than would be expected bycalculating the RH of outside air raised tothe inside temperature. The graph for aseven week period in autumn is shown infigure 6.5.
The pattern is the same as in Fanefjord:when the church is heated in winter the RHfalls from the high summer humidity butremains moderate and surprisingly stable.
The climatic stability of Gundsømaglechurch was investigated in a two yearcampaign by Eshøj and Padfield (24,25,26).
6. Fanefjord Church and Gundsømagle Church 111
Figure 6.4 Gundsømagle Church, northof Roskilde, Denmark. The choir andnave are built of lime tufa.
Figure 6.5 The microclimate in Gundsømagle Church, Zealand, Denmark. The curvein the middle shows the theoretical course of the RH in the church if the only sourceof moisture were the outside air. The curve is smoothed to take account of an airexchange rate of about 0.1 per hour.

The results are summarised here because they show the ability of supposedly relativelyunabsorbent materials to contribute a very significant stability to the indoor climate. Themechanism for this stabilisation is, however, not established beyond doubt.
The influence of the walls on the microclimate in Gundsømagle Church
The reason for measuring the climate in the church was the conservator's concern aboutdamage to the very delicate (in both the æsthetic and the material sense) wall painting,from the 12th century. A small corner of this painting is visible in figure 6.6. which alsoshows some temporary 20th century additions to the wall decoration.
The white box hanging from a string and resting very delicately indeed against thepainting, is measuring the surface temperature of the wall and the RH and temperatureof the room air. It can do both because the boundary layer, that is the transitional layerof air between wall and room, is only about 20 mm thick. The round device is a shallowacrylic cup, 200 mm in diameter, with its opening against the wall. A siliconemembrane is stretched slightly around the perimeter to give an elastic seal against theirregular plaster surface. The temperature and relative humidity are measured inside thecontainer.
With this arrangement in place we waited patiently for the few short periods whichwould reveal how the building behaves climatically. Such critical periods are oftencaused by unusual behaviour by the weather, or by people.
Our opportunity came: for one week the heating was left on. It was a long sermon, or amistake, but the physics is the same.
The series of pictures that follows builds up the interpretation of the climate step bystep. The first picture shows just the measured climate in the church and outside.
112 6. Fanefjord Church and Gundsømagle Church
Figure 6.6 Measuring devices restingagainst the north wall of the choir ofGundsømagle church. The white boxmeasures surface temperature and roomtemperature and RH. The circular cupmeasures temperature and RH in theenclosed space within 10 mm of thewall, and also measures the surfacetemperature.

The next graph adds the theoretical RH calculated from the water content of the outsideair and the temperature of the inside air.
There must be a source of water in the church to keep the RH considerably higher thanthat achieved by warming up air from outside to the inside temperature.
One possibility is that the walls release water vapour. When the RH falls because of thesudden rise in temperature, the wall should release water into the air to compensate. Thewall will only release water vapour until the RH at its surface is again in equilibriumwith its water content. In the next diagram the RH at the wall surface is calculated. Thisis obtained by taking the temperature and RH of the air in the church and calculating thewater vapour content. This water vapour content and the wall temperature are then usedto calculate a wall surface RH.
6. Fanefjord Church and Gundsømagle Church 113
Figure 6.7 The climate during a three week period. In the middle week the heatingwas left on. Notice how the inside RH varies in the opposite sense to the temperature,as expected for the RH in a mass of air subjected to a varying temperature.
Figure 6.8 The new curve is the imaginary course of the RH calculated with thewater vapour content of the outside air raised to the inside temperature. Thecalculated RH drop caused by heating is twice the measured drop.

Notice that there is no sudden jump in RH at the wall surface when the heating periodstarts. The RH gently descends, partly because the water reserves in the surface layer ofthe wall are released into the air but also because the temperature is slowly increasingthroughout the period of warming.
The wall appears therefore to be buffering the RH perfectly at the wall surface. Theremaining drop in RH in the church is due to the temperature difference between walland room air, which is quite high because of the lack of insulation and also because ofthe suddenness of the heating, so that the thermal inertia of the thick wall keeps itrelatively cool.
The hypothesis that it is the wall that is the RH buffer for the church climate isreinforced by data from the cup sealed against the wall.
The sensor within the cup, though close to the wall, is outside the boundary layer of coolair and yet cooler than the church air, because of the insulating value of the acrylic plateand the still air within the cup. The RH does therefore drop as the temperature rises butthen remains steady, as one would expect, because there is no loss of water from theenclosure. When the heating is turned down the RH in the cup bounces backimmediately.
The case for humidity buffering by the wall is reinforced by a separate experiment inwhich the same cup was placed against the floor. The RH in the cup did indeed rise, butat a rate so slow that the floor could not function as the main source of water.
114 6. Fanefjord Church and Gundsømagle Church
Figure 6.9 The RH calculated for the wall surface is added. This cannot bemeasured because the boundary layer is thin compared with the bulk of a RHsensor, which would also disturb access to the wall at the point of measurement.

The final graph in this series, figure 6.11, shows the climate over a longer period. Theclimate in the sealed cup is compared with the climate in the church. On about day 260and again at day 285 the church was aired. The climate in the cup does show theinfluence of this influx of dry air, but not nearly as much as the room air.
6. Fanefjord Church and Gundsømagle Church 115
Figure 6.10 The RH within the cup sealed against the wall is shown in thisdiagram. In the stagnant air within the cup the RH is buffered perfectly by thewall. The small step down during the heating period is caused by the position ofthe RH sensor within the boundary layer.
Figure 6.11 A longer extract from the climate record, showing two periods, arounddays 260 and 285, when the church was ventilated. The RH in the cup, the upperbold line, responds a little to the ventilation but much less than the air in thechurch. The church RH does not fully recover from the ventilation beginning onday 260. Recovery after day 285 is aided by a period of high outside RH.

How the church climate is controlled by the walls
The experimental evidence suggests strongly that the porous wall buffers the church airvery effectively. This is surprising because the materials involved: lime plaster, brickand porous limestone, have very little buffering capacity at the moderate RH within thechurch. The surface area and the thickness available is large, because these materials arevery porous. Even so, the rapid recovery after ventilation shown in figure 6.11 suggestsconsiderable water reserves. An explanation of the phenomenon must also account forthe continuous excess water content in the air within the church, compared with thatoutside.
One possible mechanism is provided by the hygroscopicity contributed by the saltcontent of normally non-absorbent materials. But there is another mechanism that doesnot depend on contamination of the bricks. At high RH the moisture content of cleanbrick reaches less than 10g/kg. Brick is however easily wetted and the capillary watercontent is about 150 g/kg, depending very much on porosity. Fog, dew or rain will wetthe outside of the wall to this condition. The water will now move by capillarity inwardsto a point where the temperature is higher. The vapour pressure at this point will behigher than that outdoors. Further inward movement of liquid involves smaller poreswhere the RH over the meniscus is lower, so the vapour pressure will fall again. Inaddition the capillary movement will be slower through the finer pores.
At some point within the wall the capillary movement of water becomes insignificant incomparison with the vapour diffusion. At this point, according to Poul Klenz Larsen, thevapour pressure is still higher than that outside and higher than that in the interior of thechurch, so further movement of water to the interior is down the vapour pressuregradient all the way.
My way of looking at the matter starts off in the same way, with a reservoir of capillarywater towards the outside of the wall, with a fairly definite boundary where vapourdiffusion takes over. The vapour diffusion, however, follows the relative humiditygradient into the interior of the church.
116 6. Fanefjord Church and Gundsømagle Church
Figure 6.12 The sorption isotherm oflime mortars from Fanefjord Church(23). The samples are taken near thefigures painted on the vault.
The three steepest curves are formortars with close to 1 mol/kgsoluble salts. The lowest curve is for arelatively pure mortar with about 0.15mol/kg.

Both theories give the same result so the only way to decide the matter, or to reveal acompletely different mechanism, is to make an experimental wall or bore holes in anexisting wall and measure temperature and RH through the section.
The observed response to heating of the church interior can be explained in this way: ata steady state one would expect that the RH gradient would fall in a linear mannerthrough the wall. The greater part of the thickness of the wall, which will be below 90%RH, will contain very little water compared to the outside layer. It will function as anearly inert, porous medium which allows steady diffusion of water vapour from thereservoir in the outside surface layers. The linear gradient is established by water vapourpassing into the church under the influence of the lower RH caused by heating theoutside air that leaks in. When the church is suddenly heated further for a service the airfalls in RH, thus steepening the gradient through the wall. The establishment of a newequilibrium is quite rapid in a porous wall with low buffer capacity.
On the other hand one could imagine a situation in which the wall has an enhancedbuffer capacity, due to small quantities of water soluble ions such as nitrate, chloride,magnesium and calcium. These will generate a liquid at moderate RH which gives thewall substance a much steeper sorption curve. Another source of buffer capacity is theorganic polymers which are a product of the rich fungal and bacterial life in the walls ofchurches.
Such a wall will have a less uniform RH through it, because the water capacity ensures aslower movement of water, controlled by the history of the weather. Such a wall has abuffer capacity at the inner surface. The moisture stress imposed by sudden heating willbe taken up by the inner surface layers of the wall.
The two models are shown in figure 6.13. A combined model could be constructed inwhich the water reservoir at the outside functions as a slow supplier of water,accounting for the higher than expected RH in the church air through the year. Therelatively brief episodes of warming for services would extract water from the limited
6. Fanefjord Church and Gundsømagle Church 117
Figure 6.13 Two models for RH buffering bychurch walls during brief periods of heating.
In the top diagram a reservoir of capillary waterjust within the outside surface of the wall feedsvapour into a linear vapour pressure gradientthrough the scarcely absorbent pores of the wall.
In the bottom diagram a more absorbent wall hasbuffer capacity right through to the inside. Thegradient is more unpredictable, depending on thehistory of the weather. Only the inner surfaceresponds to episodes of heating. This model fitsthe data from Gundsømagle church, except thatthe measured properties of the materials do notprovide enough hygroscopicity. Soluble saltswithin the wall do, however, increase the buffercapacity.

but definite buffer capacity of the interior surface of the wall, which would then bere-supplied from the capillary reservoir towards the outside.
The observed microclimate is compatible with this model, which does not invoke watervapour movement by diffusion driven by vapour pressure difference, though it does notexclude it as a competing process. Vapour pressure driven movement alone will give ahigh humidity near the outer surface of the wall but can only explain the high RHindoors by invoking a region of the wall at 100% RH and at a higher temperature thanoutside. This mechanism should give a much higher RH within the cup against the wallthan is observed.
Experimental confirmation of the conflictng ideas put forward in this chapter wouldinvolve considerable effort in putting sensors within the wall and would requireremoving a statistically reliable number of specimens of material from the old walls. Itwould also require firm control over the operation of the building, particularly theheating and the ventilation.
The first mechanism proposed, that for the nearly unabsorbent wall, is an extension ofthe isothermal experiment reported in chapter 4, figure 4.35: cellular concrete withgypsum plaster over its surface. This figure is interpreted as showing that the cellularconcrete contains capillary water. This means that it is at equilibrium with a very highRH. The gypsum plaster coating it cannot share this moisture because it has a coarsercapillary structure. A steep linear RH gradient develops within the gypsum, whichfunctions as a porous retarder of vapour movement, with almost no sorptive capacity atall. The gradient remains stable as the reservoir of water in the cellular concreteshrinks, because the RH at the surface of this reservoir is close to 100% over a verywide range of water content. This gives a very stable inside RH, so long as the vapourflux leaking from the church through openings in the building is constant.
The church as a whole seems to function as a heat driven pump: water moves inwardsthrough the wall to give a higher interior water content, which leaks out through cracksin the building. The balance between these two processes gives the observed moderatelyhigh RH within the building.
118 6. Fanefjord Church and Gundsømagle Church
The climate behind pictures mounted against the outer walls of the Chapel ofLedreborg, Denmark
The experiment with the cup mounted against the wall in Gundsømagle church can becriticised as unrealistic, because the diameter of the cup was small compared with thethickness of the wall. This section describes the climate in a much wider, but not muchdeeper enclosure.
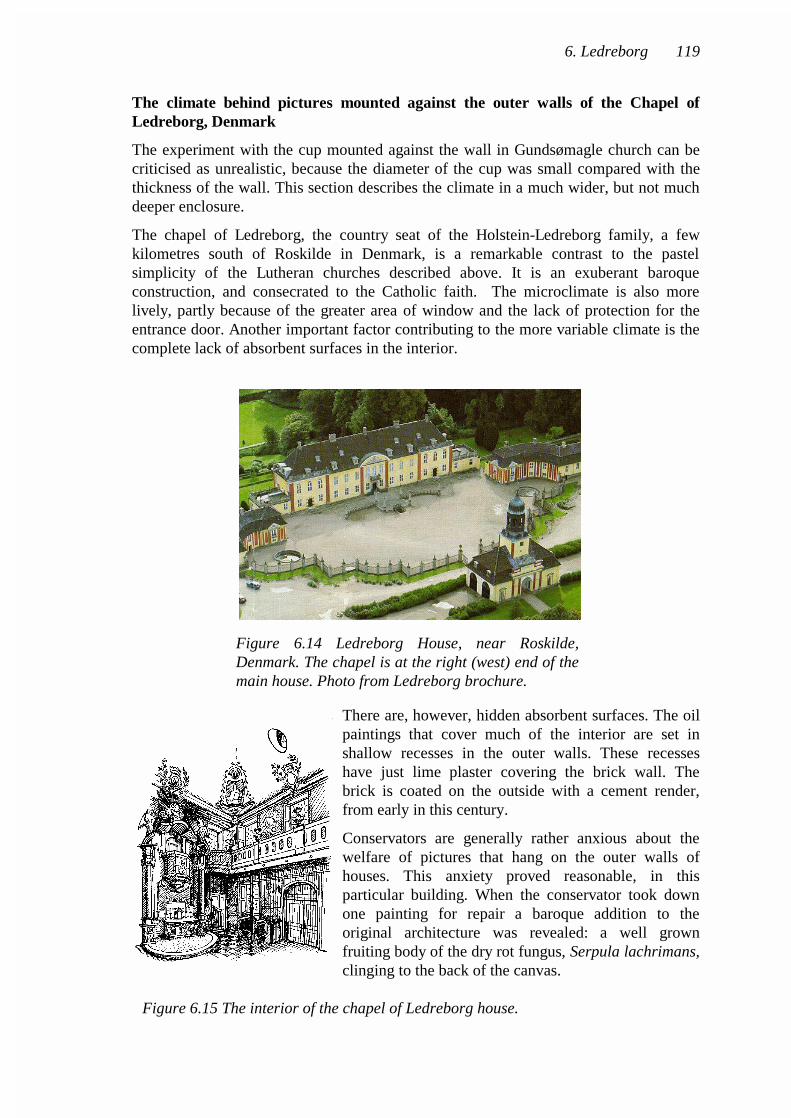
The chapel of Ledreborg, the country seat of the Holstein-Ledreborg family, a fewkilometres south of Roskilde in Denmark, is a remarkable contrast to the pastelsimplicity of the Lutheran churches described above. It is an exuberant baroqueconstruction, and consecrated to the Catholic faith. The microclimate is also morelively, partly because of the greater area of window and the lack of protection for theentrance door. Another important factor contributing to the more variable climate is thecomplete lack of absorbent surfaces in the interior.
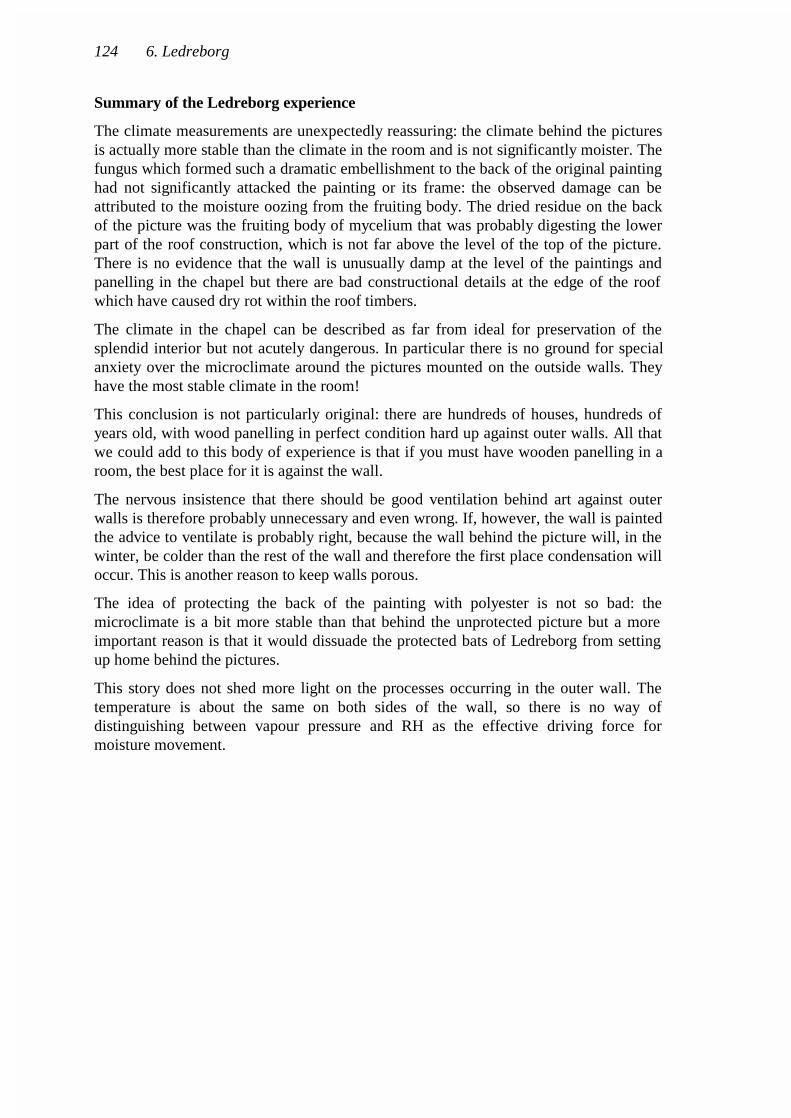
There are, however, hidden absorbent surfaces. The oilpaintings that cover much of the interior are set inshallow recesses in the outer walls. These recesseshave just lime plaster covering the brick wall. Thebrick is coated on the outside with a cement render,from early in this century.
Conservators are generally rather anxious about thewelfare of pictures that hang on the outer walls ofhouses. This anxiety proved reasonable, in thisparticular building. When the conservator took downone painting for repair a baroque addition to theoriginal architecture was revealed: a well grownfruiting body of the dry rot fungus, Serpula lachrimans,clinging to the back of the canvas.
6. Ledreborg 119
Figure 6.14 Ledreborg House, near Roskilde,Denmark. The chapel is at the right (west) end of themain house. Photo from Ledreborg brochure.
Figure 6.15 The interior of the chapel of Ledreborg house.

The National Museum had, at that time, astudent, Annabel Robinson, who wasinterested in microclimatic matters relevantto the conservation of art.
We decided to investigate the microclimatebehind the pictures with full scientific rigour(27).
The climate measurements
While the damaged canvas was in intensivecare in the National Museum's workshop weput in the vacant niche two paintings, one
designed to imitate the original, the other with a polyester film stretched over the backof the frame, to exclude water vapour coming from the direction of the wall.
The two pictures were set side by side in the recess, as shown in figure 6.17.Temperature and humidity sensors were placed in front of these pictures and in the air
120 6. Ledreborg
Figure 6.16 An 18th C. oil painting byIsaac Isaacsz. The white squares aretemporary repairs. Below is a portion ofthe back of the picture showing the driedremains of the fruiting body of the DryRot fungus.
Figure 6.17 The wall structure, showing the placing of sensors to investigate themicroclimate behind the painting. The sensor assembly behind the test picturesconsisted of a RH sensor and thermocouple within a radiant heat shield in the middleof the space (about 40 mm) and two springy thermocouples, one touching the back ofthe canvas, the other touching the surface of the wall.

space between the canvas and the wall. The outside climate was measured in a shadedspot on the flat roof of the west wing, just outside the chapel.
The microclimate around the pictures
The climate measurements are summarised in three graphs. Figure 6.18 shows theoutside (dotted) and inside temperature and relative humidity (RH) for a 15 week period
starting on the 14th. March 1994. The inside relative humidity is generally a moderatedversion of the outside RH. The daily cycles of RH are caused mainly by the dailytemperature cycle acting upon room air that is rapidly exchanging with outside air. Theouter door has no lobby, the door at the balcony level is poorly fitting and the windowsare not particularly airtight. The room is high and open, encouraging convective airexchange (the "stack effect").
The temperature and humidity cycling is only moderately damped out by the room. Theabundant wood panelling is a fairly good thermal insulator, reducing the stabilisinginfluence of the thermal inertia of the wall. The paint on the wood prevents moisturemovement which would stabilise the relative humidity.
Figure 6.19 shows the microclimate around the paintings. The upper curves show theRH in the room (dotted) and at the back of each of the two experimental paintings. Boththe polyester-protected canvas (the line rising from 30% RH) and the unprotectedcanvas (bold line) had been stored for several weeks in a room at about 40%RH. Theunprotected canvas came rapidly to equilibrium close to the running average of the RHin the chapel, while the protected canvas came slowly to equilibrium with its newsurroundings over a period of about two months. At the end of the measuring period thetwo RH traces have converged. The RH behind both canvases is more stable than that inthe room.
6. Ledreborg 121
Figure 6.18 Temperature and relative humidity inside the chapel and outside. Thechapel was only heated on two brief occasions at the beginning of the period.

A detailed study of figures 6.18 and 6.19, together with a close up of a shorter period,shown in figure 6.20, suggests that the canvas of the polyester protected picture isstabilising the RH of the air trapped behind it but that the wall is actively stabilising theRH behind the unprotected picture, and therefore behind all the other pictures in theroom.
The lowest line in figure 6.20 is the temperature difference between the pictures and thewall surface (the two pictures have identical thermal environments). Notice that the RHbehind the unprotected canvas (the top curve) is cycling up and down with minimumvalues that coincide with maximum values of the temperature difference between thepicture and the wall (the picture surface is warmer than the wall surface). At first glancethis could be attributed to air exchange with the room, because the RH in the room goesup and down in the same pattern. However, a closer look at figure 6.19 shows that therelationship between RH in the room and behind the painting is not easily explained bythis theory. Around day 130 the RH behind the picture is varying more than that in theroom but the peaks in room RH on days 105, 137 and 145, when the temperature wasrather stable, do not penetrate behind the canvas.
These observations can be explained by assuming that the wall is controlling the RH toa constant value at the wall surface. This air then convects away from the wall to theback surface of the painting, keeping the exact water content it acquired when it came toequilibrium with the wall surface. Because the picture canvas is at a higher temperaturethan the wall, the air warms up and therefore drops in relative humidity.
122 6. Ledreborg
Figure 6.19 The microclimate behind the two test pictures. The protected picturecomes much more slowly from the 40% RH of the painting workshop to the high RHof Ledreborg. After a few weeks, however, both paintings have much the same RHbehind the canvas, within the accuracy of measurement of the sensors.

This explanation may seem very indirect and speculative but it is supported by aconsideration of what happens at the back of the protected painting. Here the wall playsno part in the moisture transfer, because of the impermeable polyester sheet whichseparates the wall from the air space behind the picture. The air trapped behind thispicture exchanges water vapour only with the canvas of the picture itself, so the RH atthe back of the screened picture is much more constant. There is just a slight increase ofRH as the temperature rises, which is a known property of cellulosic fibres in aconfined, nearly airtight space.
The opposite pattern of the RH cycle behind the unscreened painting confirms that thereasonable RH stability cannot be due to poor air circulation, because this would allowthe canvas to buffer the RH just as it does for the screened picture. The wall is actuallysuch a powerful stabiliser of RH that it overrides the influence of the canvas.
6. Ledreborg 123
Figure 6.20 Relative humidity in the space between the picture canvas and the wall.Notice just after day 121, for example, that the RH cycles are in opposite phase. Thisis the evidence for buffering by the wall behind the unscreened picture. The screenedpicture has small RH peaks that approximately coincide with temperature peaks atthe canvas. This RH pattern is characteristic of a closed container filled withabundant buffer, in this case the canvas. The unscreened RH has larger RH peakswhen the temperature difference is at a minimum. This can be attributed to bufferingof RH by the wall at the wall temperature. This buffered air warms up to the canvastemperature with consequent fall in RH.
Summary of the Ledreborg experience
The climate measurements are unexpectedly reassuring: the climate behind the picturesis actually more stable than the climate in the room and is not significantly moister. Thefungus which formed such a dramatic embellishment to the back of the original paintinghad not significantly attacked the painting or its frame: the observed damage can beattributed to the moisture oozing from the fruiting body. The dried residue on the backof the picture was the fruiting body of mycelium that was probably digesting the lowerpart of the roof construction, which is not far above the level of the top of the picture.There is no evidence that the wall is unusually damp at the level of the paintings andpanelling in the chapel but there are bad constructional details at the edge of the roofwhich have caused dry rot within the roof timbers.
The climate in the chapel can be described as far from ideal for preservation of thesplendid interior but not acutely dangerous. In particular there is no ground for specialanxiety over the microclimate around the pictures mounted on the outside walls. Theyhave the most stable climate in the room!
This conclusion is not particularly original: there are hundreds of houses, hundreds ofyears old, with wood panelling in perfect condition hard up against outer walls. All thatwe could add to this body of experience is that if you must have wooden panelling in aroom, the best place for it is against the wall.
The nervous insistence that there should be good ventilation behind art against outerwalls is therefore probably unnecessary and even wrong. If, however, the wall is paintedthe advice to ventilate is probably right, because the wall behind the picture will, in thewinter, be colder than the rest of the wall and therefore the first place condensation willoccur. This is another reason to keep walls porous.
The idea of protecting the back of the painting with polyester is not so bad: themicroclimate is a bit more stable than that behind the unprotected picture but a moreimportant reason is that it would dissuade the protected bats of Ledreborg from settingup home behind the pictures.
This story does not shed more light on the processes occurring in the outer wall. Thetemperature is about the same on both sides of the wall, so there is no way ofdistinguishing between vapour pressure and RH as the effective driving force formoisture movement.
124 6. Ledreborg

Buildings which deliberately use humidity buffering by porousmaterials
The museum stores in Brede
The churches described in the previous sections were not intentionally built to provide astable relative humidity. This was a beneficial by-product of their construction and ispreserved by a continuing tradition of using a porous surface treatment both outside andinside.
The buildings described in this section were designed to provide a stable relativehumidity.
The National Museum of Denmark transformed some old factory buildings in Bredeinto storage for museum objects. It also built a new store for large objects.
The consulting engineering firm charged withdoing all the technical things proposed an airconditioning system designed to maintain aconstant relative humidity by adjusting the airtemperature in the storerooms. This proposal isbased on two ideas of doubtful validity. One is thatmuseum objects are more sensitive to humidityvariation than to temperature variation. The otheris that it is possible to control the relative humidityby raising or lowering the temperature, to lower orraise the RH, respectively.
The first of these axioms, that RH is moreimportant than temperature, is a complicatedmatter which I will not go into here. The secondaxiom, that RH in a storeroom can be controlledby adjusting the temperature, can be rebuttedinstantly by referring back to chapter 1, where theresults of putting cotton into a sealed box arediscussed. The RH in the empty box falls withrising temperature while the RH in the box full of
cotton rises with rising temperature. A storeroom will surely contain a considerable, butnot exactly known, quantity of cellulosic products, such as cardboard boxes and woodenshelves and wooden relics. There is therefore an ambiguity in the room's response totemperature change: it will either rise or fall in RH according to the ratio of availablebuffer to total volume, complicated by the effect of ventilation with outside air ofunpredictable water vapour content.
There is therefore a risk that a rising signal from the RH sensor will cause heating thatwill cause a further rise in RH, a phenomenon known in the control industry as positivefeedback.
The engineers were not convinced by this argument. It must be said that severalconservators also expressed scepticism, pointing out that exactly this system, dignifiedby the name of "Conservation heating" has been used to keep the damp out of Englishcountry houses for several years. The English upper class, however, were never
6. Buffered air conditioning 125
Figure 6.21 The complex of factorybuildings in Brede, north ofCopenhagen. The storage roomsare in the foreground.

celebrated for putting comfort before pomp and their draughty ancestral piles are wellenough ventilated, and coated on the inside with such heavily varnished art, that thebuffer effect described for cotton does not happen. The climate graph for Ledreborgwould apply to most country houses. The buffer effect of the few absorbent materials isswept away by the air rushing through the edges of the windows.
The Brede storerooms, however, were another matter. They would be built to beairtight, without windows and with a surrounding corridor to act as a buffer againstinfiltration through the old factory windows.
Computing the best control strategy for humidity control in a well sealed storeroom
Mechanical air conditioning is not an absolute necessity if one has a completely freehand. The building holding the archives of Schleswig-Holstein in northern Germanyoperates with great climatic stability without any mechanical climate control (thisbuilding will be described briefly later) but it was designed for the purpose. In the Bredebuildings the natural humidity buffering by the building and by the stored objects is notquite good enough for a museum store. The concepts of passive humidity control neededto be supplemented by active control with a mechanical system. The aim of thisresearch was therefore not the study of natural processes at work, as described up tonow, but to develop a system of air conditioning that would use the natural processes toreduce the installation and running costs of the buildings.
Various alternative ways of controlling the RH in the store rooms were explored bycomputer simulations (28). These do not involve the outer walls of the rooms butcalculate the humidity buffering by wood within the room, as an example of a commonabsorbent material. The temperature is of course included in the calculations and thewood could just as well be the walls of the room: the result would be the same. Acertain zest was added to the computational effort by the knowledge that the resultswould be tested in reality.
The response of wood to changes of ambient RH and temperature was taken fromunpublished work by Poul Jensen, who was studying the drying of wood during timberproduction. This core physics was written into a program which also calculated the heatand moisture changes in the room through diffusion and ventilations and as a result ofthe activities of various kinds of air conditioning methods.
The natural climate of the store
When we came on the scene the planning of the alterations to the old buildings was faradvanced. The storerooms would be made of lightly built walls of gypsum board andplywood with mineral wool insulation. This wall was separated by a corridor from theoriginal outer shell, from about 1920, which was of reinforced concrete with vast areasof window with a single layer of glass in iron frames.
The first exercise was to study the likely climate in the room if there were no climatecontrol at all.
We used the following basic data in all the simulations: The room is 30 x 15 x 4.5 mhigh. It has two exterior walls of k-value (thermal transmission) 0.2 W/(m2 ·°C) to
126 6. Buffered air conditioning

simulate the outside weather moderated by the enclosing corridor. The ventilation isadjustable from 0.05 to 0.5 air changes per hour. The air is recirculated at one airchange per hour and the air speed over the wood surface is 0.1 m/s. The apparentlyirrelevant air circulation rate becomes a necessary parameter when considering theeffects of recirculation through an air conditioning device.
The natural buffering is provided by wood. Simulations were made with two levels ofbuffering. A lightly buffered room has 200 m2 of wood , 10 mm thick, varnished on oneside. A heavily buffered room is represented by 5000 m2 of wood. This is a reasonableapproximation to a well filled museum store with a mixed collection.
The starting RH, and the target for RH control was set to 50%, not as a suggestion forthe ideal value but to simplify interpretation of the graphs.
6. Buffered air conditioning 127
Figure 6.22 The modelled performance of the museum store with a small amount ofwood. The outside climate is the dotted lines. The buffering is poor, worse than thatof Ledreborg chapel shown earlier. Notice the rapidly varying water content in thesurface layers of the wood: a sign of the physical stress suffered by museum objectsstored in such conditions.

When the store room is reasonably full of objects and containers, including many thatare water absorbent, the humidity buffering, and also the temperature buffering aremuch improved.
The RH had risen from 50% to over 60% during the month and a half when the outdoorRH is at its lowest average value. This entirely passive climate control will not work.
There are several alternative methods of improving the situation. The one chosen by thedesign team was to heat to constant RH. This method relies on the fact that thesaturation vapour pressure of water rises with temperature, while the actual vapourpressure of an isolated volume of air remains the same as it is heated. Therefore theratio of actual to saturation vapour pressure, which is the RH, falls. This process workswell in the lightly buffered room, as shown in the next diagram.
128 6. Buffered air conditioning
Figure 6.23 Climate buffering by an abundance of wood in a storeroom. Both RHand temperature are moderated but the room RH is slowly rising to the unacceptablyhigh (for museum objects) average RH of the Danish climate.

When the room is filled with museum objects, some in cardboard boxes and laid out onwooden shelves, the climate follows a completely different pattern. Now the situationresembles that sketched in chapter 1. The air in the room can no longer be regarded asan isolated volume with no access to water. As the temperature rises the absorbentmaterials in the room will see a falling RH around them and will release water tomaintain equilibrium with the air. They release so much water that the RH actually riseswith increasing temperature, causing the control electronics to call for even more heat.The process runs amok in the mild, museum equivalent of a nuclear meltdown.
6. Buffered air conditioning 129
Figure 6.24 The control strategy used here is to warm the room to constant RH,using the fact that the RH of an enclosed body of air falls with rising temperaturebecause the saturation vapour pressure increases while the actual vapour pressureremains the same. In the lightly buffered room the process works well.

All this was just theory. The system that heats to constant RH was installed in the onlynew building in the project. What happened next is not clear but at some point after thebuilding was filled with the museum's collection of old boats and wagons a dehumidifierwas installed. I watched the climate, ignorant of the modification, and wondered how Icould have got my modelling so wrong.
One day, a year or two later, some visitors were taken round the showpiece museumstorage facility. The Director of Conservation complained afterwards that it seemed veryhot in there, so I looked up the recent data. It is shown in figure 6.26.
130 6. Buffered air conditioning
Figure 6.25 Heating to constant RH in a room full of absorbent materials. Thesawtooth pattern of the temperature cycles is caused by positive feedback: a rise inRH provokes a rise in temperature, which causes a further rise in RH. The absolutewater content of the air increases until the leakage of outside air with much lowerwater content puts a stop to the rise of the indoor water concentration. Thetemperature then nosedives as the fall in RH provokes a cooling response from theair conditioner.

Further investigation revealed that the dehumidifier had failed. The control computerreacted to this failure by dredging up the old program which controlled the RH byheating. The real climate is a bit different from the model, but the model did not havethe heating power of the real building, as shown in the sharp temperature rise of the airblown into the building (dotted line). Also, the model was capable of cooling the air byventilation to the outside, a refinement not found in the real building.
I fed the actual outside climate data into the old computer model and got the graphshown in figure 6.27 (29).
6. Buffered air conditioning 131
Figure 6.26 Climate data for nine weeks in the new museum storage building nearBrede. Temperature oscillations are caused by positive feedback in the controlsystem. A rising RH calls for more heating, which then causes a rise in RH becauseof release of water by the collected objects, supplemented by the cellular concretewalls. The dotted curve with sharp rise and fall is the temperature of air blown intothe interior.

There are two lessons to be learned from this affair. One of them is that mechanical airconditioning is only as safe as the quality of the supervision. The climate in this buildingran amok for about three months without anyone noticing. This alone is a good reason topromote passive climate control. It may not be so accurate but it cannot go berserknearly as effectively as mechanical systems.
132 6. Buffered air conditioning
Figure 6.28 The large storage hall inØrholm, north of Copenhagen. Theclimate is buffered to some extent bythe cellular concrete walls, which arecovered with limewash but most of theclimate buffering comes from the storedobjects. The mechanical airconditioning dehumidifies to achieve areasonably constant RH.
Figure 6.27 The computer model based on the outside climate for the period shownin figure 6.26. The heavy sawtooth line is the indoor temperature. The steeperdecline in temperature is due to active cooling by ventilation in the model, whichwas not available in the real building.

Warming to constant relative humidity
The principle of warming to constant humidity can be used to control RH, so long asone does not use a RH sensor to control the air conditioning. The signal is ambiguousand cannot be used for direct control. Heating can be controlled according to theexpected outside temperature and RH for the time of year. It can also be controlled bybuilding a storage vault so massive that it responds only to the yearly average outsideclimate, moderated by waste heat from dim lighting.
This is the case with the State Archives of Schleswig-Holstein in Schleswig, northGermany. The climate control of this modern building is described by LarsChristoffersen (4). Briefly, the archival storage is built with a metre thick brick wall,insulated on the outside and with another brick rain shield outside that. This dampsdown and retards the annual temperature cycle very considerably. The waste heat fromdim lights and people hunting down ancient documents provides exactly the righttemperature rise to keep a moderate RH. The climate over a year and a half is shown infigure 6.29.
This building is a great success, compared with the Danish storehouse described earlier.One must point out, without detracting from the achievement, that the engineers diddesign an air conditioning unit, which lies with gleaming pipes, valves and dials,completely unused. The designer omitted to take into account the buffer effect of thestored items. The brick wall probably contributes very little to the humidity stability. Itcould be that half the number of bricks would have done the job, but this archive willresist heavy artillery.
6. Buffered air conditioning 133
Figure 6.29 Climate in and around the State Archive of Schleswig-Holstein, inSchleswig. The massive brick building and the stored papers provide good temperaturestability and very impressive RH stability. Data from Lars Christoffersen.
Dehumidifying to constant relative humidity
The principle of warming to achieve a moderate RH is widely used, though it is difficultto control in rooms with good humidity buffering. In temperate climates human comfortalso demands heating above ambient temperature.
The only reason for considering alternative strategies in a cool climate is to improve thedurability of materials.
It is not really a good idea to heat an archive just to achieve a moderate RH. The highertemperature accelerates degradative chemical reactions: oxidation, hydrolysis andcondensation reactions that slowly demolish many of the organic materials of museumand art collections, and particularly photographs and films.
It would be better to dehumidify the air while keeping it cool.
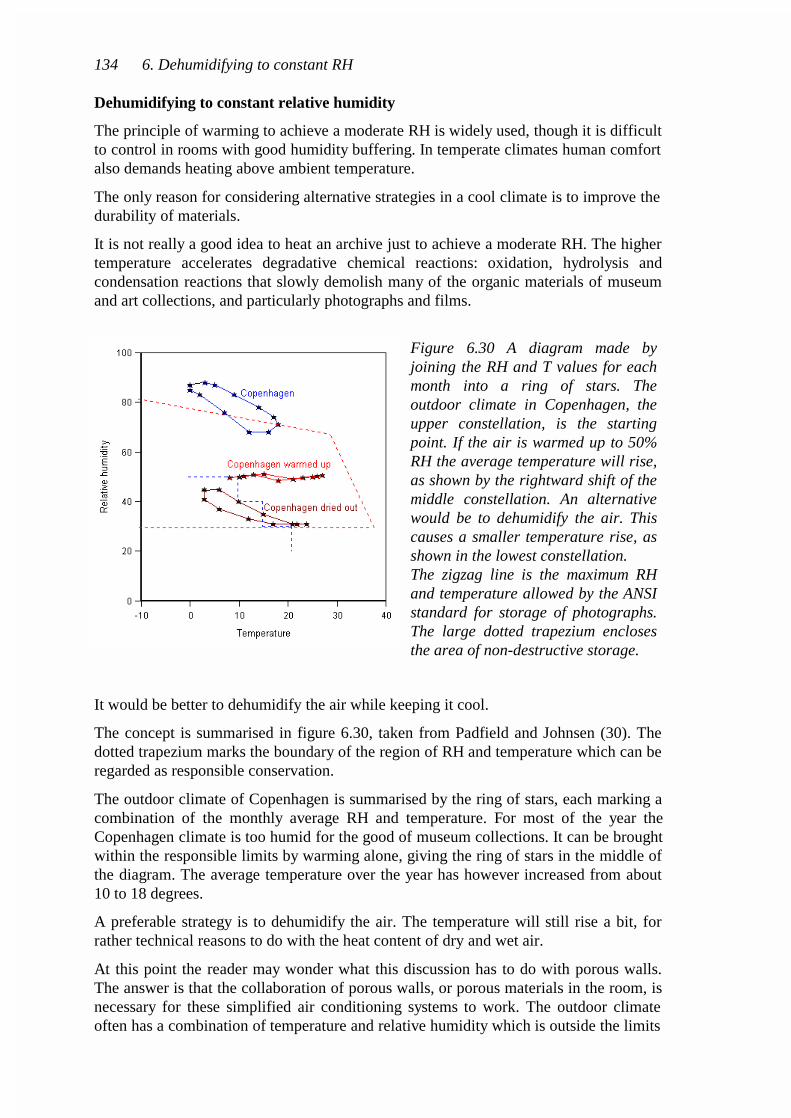
The concept is summarised in figure 6.30, taken from Padfield and Johnsen (30). Thedotted trapezium marks the boundary of the region of RH and temperature which can beregarded as responsible conservation.
The outdoor climate of Copenhagen is summarised by the ring of stars, each marking acombination of the monthly average RH and temperature. For most of the year theCopenhagen climate is too humid for the good of museum collections. It can be broughtwithin the responsible limits by warming alone, giving the ring of stars in the middle ofthe diagram. The average temperature over the year has however increased from about10 to 18 degrees.
A preferable strategy is to dehumidify the air. The temperature will still rise a bit, forrather technical reasons to do with the heat content of dry and wet air.
At this point the reader may wonder what this discussion has to do with porous walls.The answer is that the collaboration of porous walls, or porous materials in the room, isnecessary for these simplified air conditioning systems to work. The outdoor climateoften has a combination of temperature and relative humidity which is outside the limits
134 6. Dehumidifying to constant RH
Figure 6.30 A diagram made byjoining the RH and T values for eachmonth into a ring of stars. Theoutdoor climate in Copenhagen, theupper constellation, is the startingpoint. If the air is warmed up to 50%RH the average temperature will rise,as shown by the rightward shift of themiddle constellation. An alternativewould be to dehumidify the air. Thiscauses a smaller temperature rise, asshown in the lowest constellation.The zigzag line is the maximum RHand temperature allowed by the ANSIstandard for storage of photographs.The large dotted trapezium enclosesthe area of non-destructive storage.

for the warming or dehumidifying to a constant RH. The porous materials are needed tobuffer the indoor climate during these periods when active control is impossible.
Dehumidification can reduce the temperature of a well buffered room at the same timeas reducing the relative humidity. The standard condensation dehumidifier works bycooling the air below the required dew point, to condense the surplus water. The air isthen re-warmed by passing it over the coil containing the hot, compressed refrigerationfluid. If the dehumidifier is outside the room it can lose this heat outside the room andpump the dehumidified, but still cold, air into the room. The RH of this air stream willbe very high but if the balance of heat loss through the walls is right it will warm up to atemperature where the RH is correct but the temperature slightly below ambient.
This method is modelled in the next diagram, which is taken from the set of calculationsmade to evaluate various methods of air conditioning the museum store in Brede.
This technique only works in a room with good humidity buffering. It is important torealise that absorbent porous walls are not only advantageous in houses without airconditioning, they also allow much simpler and more economical air conditioning inplaces where the requirement for accurate control does not permit a relaxed attitude tonatural climatic forces.
6. Dehumidifying to constant RH 135
Figure 6.31 The calculated climate in a museum store dehumidified to 50% RH. Theheat generated in the dehumidifier is discarded to the outside, rather than pumpedinto the room, as happens with a standard dehumidifier.

136 6. Dehumidifying to constant RH

Absorbent insulation
Absorbent insulation, like absorbent walls, is a traditional material that has fallen intodisuse. A huge variety of plant fibres have been used for insulation, so has animal hair.
The important characteristic of absorbent insulation that sets it apart from absorbentsolid building materials is that there is very little of it, by weight, per square metre ofwall. Its buffer capacity is correspondingly limited. Furthermore, the little buffercapacity that it has is screened behind the hard interior finish of the house.
Absorbent insulation has an important role to play in buffering the climate in the interiorof the wall. The volume is small, compared to the inner volume of a house, but theclimate is more extreme. There is heat flow and water vapour flow. There is also radiantheating of exterior surfaces in the sun and there is driving rain forcing water into thewall.
The climate within the structure of walls is so extreme that the threats it poses seem tohave deflected the attention of building engineers away from the interior climate of thehouse.
The basic problem, apart from faulty construction, is that warm air inside a housealways contains more water, measured in kg/m3, than the cool air outside. If the outsideair temperature is lower than the dew point of the inside air, and the inside air movesthrough the wall and cools to the outside temperature then water will condense withinthe wall. This condensation inside the wall will threaten corrosion and rot and providedrinking water for plagues of insects.
If the wall is very open to air movement from the inside there is not much that absorbentinsulation can do to ameliorate the situation. If, however, the wall is fairly well sealedagainst air flow, then the buffer effect of absorbent insulation can moderate the suddenswings of climate within the wall very substantially.
This is an assertion, based on calculations of the same type that have been presented forhouses and for storage rooms. There is no body of research on the performance ofabsorbent insulation, because the modern building industry insulates almost exclusivelywith mineral fibre, mineral pellets and polystyrene. All these materials arenon-absorbent. The paper fibre insulation industry has been established as a minorplayer in the business for many years but seems not to have sponsored research thatreally defines the properties of the material, as used within a wall.
All insulating fibres have roughly the same insulation value: that of the stagnant airbetween the solid fibres. The battle between the proponents of various materials hascentred on issues of fire resistance and resistance to rot and insect attack. The subtledifferences in performance due to moisture absorption at moderate RH has not figuredin the debate.
It is difficult to find evidence for succesful performance. Disasters attract much morecritical research. I therefore present a case history that emphasises the disadvantages ofnon absorbent insulation, with the purpose of opening a debate on the possibleadvantages of porous insulation. This may seem a weak excuse, but the story isamusing, and has not been told before.
6. The Arts and Industries Museum 137

The mysterious case of the building that rained inside, but only in fine sunnyweather
The Arts and Industries Museum in Washington, D.C. was finished in 1881. It wasdesigned as a museum, with ingenious use of the towers for ventilation. The advance oftechnology brought an orthodox air conditioning system with electric boilers for winterhumidification.
The museum's roof was replaced in the latenineteen seventies. The new roof soon showed amagical ability to shower rain down on the interiorin bright spring sunshine. The reason for thisphenomenon is a fascinating illustration of theproblems that arise when the whole apparatus ofmodern materials, modern standards and modernregulations are applied to ancient buildings.
It is also an example of what happens when onemixes absorbent and non absorbent materials in a
multi-layer sandwich exposed to large temperature variations.
The old roof was replaced by a box-sandwich construction of two layers of plywoodenclosing mineral fibre insulation. The outer surface was of lead-coated copper. Thewood was impregnated with a mixture of water soluble salts for fire and rot resistance.A polyester membrane was laid on the bottom plywood as a vapour barrier. Thestructure is sketched in figure 6.33.
138 6. The Arts and Industries Museum
Figure 6.32 The Arts and Industries Museumof the Smisthsonian Institution inWashington D.C. The south front showingthe towers beside the entrance, used forcooling by the stack effect.
Figure 6.33 The design of the new roof of the Arts and Industries Museum

The rain in the building was not at first attributed to the roof but to some malfunction ofthe air conditioning. Eye witnesses reported seeing clouds in the high central rotunda.
An analysis of the rainwater, however,pointed to the roof as the cause of theproblem. Ammonium and phosphate ionshinted at dissolution of the fireproofingsalts in the plywood. A visit to the loftconfirmed the suspicion.
In the U.S. all scientific evidence must besolid enough to be defended in court, sowe set about installing sensors to revealthe exact processes at work within theroof. My colleague in this, and severalother amusing technical detective jobs,was David Erhardt, a research chemistworking at the Smithsonian Institution.
The temperature and RH was measuredbetween every layer in the roof, and
outside. Sensors for liquid water were placed on the vapour barrier and within theinsulation. These were copper nails fixed close and parallel to each other. The directionof air movement was measured by placing an insulated tube through the roof with atemperature sensor in it. This sensor followed the indoor or the outdoor temperature,
6. The Arts and Industries Museum 139
Figure 6.34 Fireproofing salts formedstalactites hanging from the ceilingpanels, revealing that the water camefrom the roof. *Koktaite is a hydratedcalcium ammonium sulphate.
Figure 6.35 A plot of the directionof air flow through the roof is atthe top. The curve below showsthe steady increase of RH justbelow the upper plywood layer,indicating that water vapour fromthe humidified museum air isreaching the plywood and is beingabsorbed into the wood. Theprocess is aided by thefireproofing salts that also absorbwater at high RH.In early summer the stack effectgoes into reverse, air moves downthrough the roof, drying itrapidly.
according to the direction of air flow. Thermally driven air movement is a powerfulprocess in buildings with high, unobstructed inside spaces.
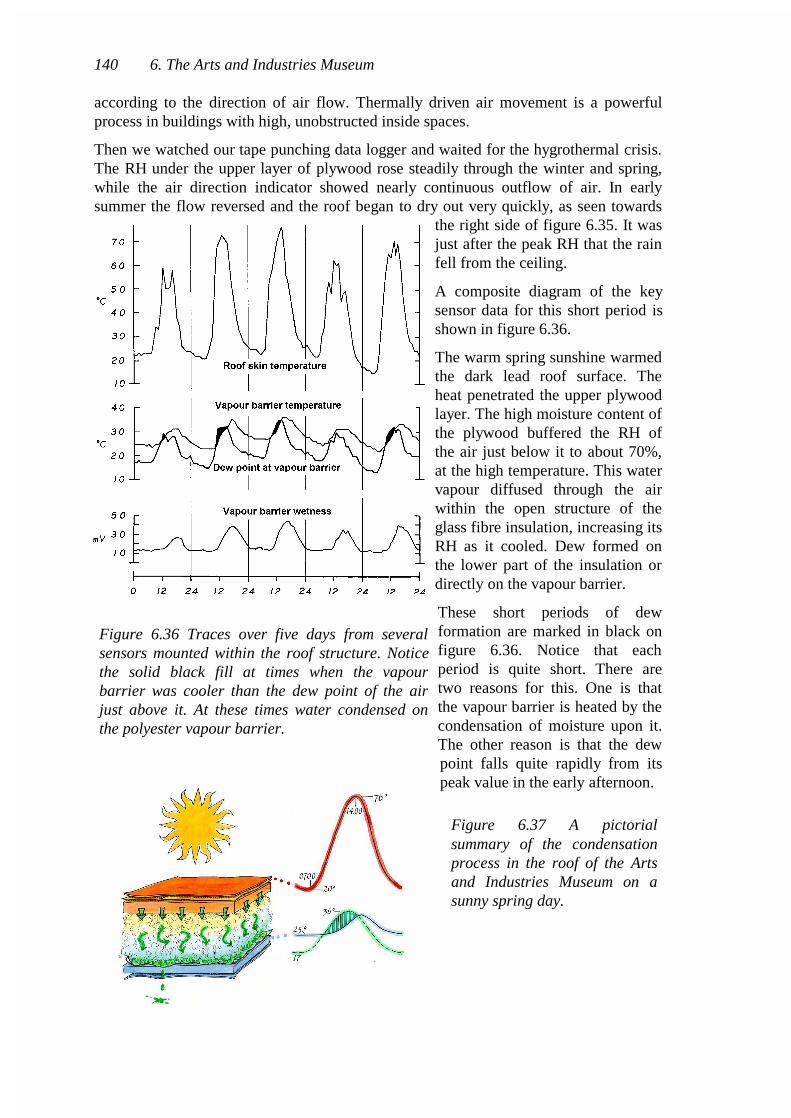
Then we watched our tape punching data logger and waited for the hygrothermal crisis.The RH under the upper layer of plywood rose steadily through the winter and spring,while the air direction indicator showed nearly continuous outflow of air. In earlysummer the flow reversed and the roof began to dry out very quickly, as seen towards
the right side of figure 6.35. It wasjust after the peak RH that the rainfell from the ceiling.
A composite diagram of the keysensor data for this short period isshown in figure 6.36.
The warm spring sunshine warmedthe dark lead roof surface. Theheat penetrated the upper plywoodlayer. The high moisture content ofthe plywood buffered the RH ofthe air just below it to about 70%,at the high temperature. This watervapour diffused through the airwithin the open structure of theglass fibre insulation, increasing itsRH as it cooled. Dew formed onthe lower part of the insulation ordirectly on the vapour barrier.
These short periods of dewformation are marked in black onfigure 6.36. Notice that eachperiod is quite short. There aretwo reasons for this. One is thatthe vapour barrier is heated by thecondensation of moisture upon it.The other reason is that the dewpoint falls quite rapidly from itspeak value in the early afternoon.
140 6. The Arts and Industries Museum
Figure 6.37 A pictorialsummary of the condensationprocess in the roof of the Artsand Industries Museum on asunny spring day.
Figure 6.36 Traces over five days from severalsensors mounted within the roof structure. Noticethe solid black fill at times when the vapourbarrier was cooler than the dew point of the airjust above it. At these times water condensed onthe polyester vapour barrier.

The same process occurs day after day until enoughwater has been evaporated from the plywood that thedew point never reaches the vapour barriertemperature.
The condensation process is summarised in figure6.37.
One final detail is necessary to explain the dramaticrain showers. The condensate accumulated for sometime as discrete drops on the water repellent surfaceof the polyester membrane. The roof tilts at ashallow angle, so a lot of water accumulates. Then,
by chance two drops meet and coalesce, then run down into another and soon the entiremass of collected water streams towards the nearest downstream break in theconstruction.
This story encapsulates many of the themes touched in this thesis. Absorbent materialsand unabsorbent materials interact in a temperature gradient. The absorbency of theplywood is artificially increased by the addition of fireproofing water soluble salts. Theporosity of the unabsorbent insulation allows rapid moisture transfer through thetemperature gradient. The discontinuous vapour barrier allows air to infiltrate frombelow. The humidification of the museum air increases the water uptake by theplywood. The amount of water released is limited by the hours of intense sunlight butalso by the rather low permeability of the wood, which restricts the amount of waterreleased on a single day but also allows a recharge rate that ensures daily rain during aperiod of two or three weeks, if the sun shines. The symptomless accumulation ofcondensed water during the whole winter is made possible by the absorptive capacity ofthe plywood, conceals the true nature of the problem.
There are also influences working against condensation. The roof dries rapidly when thedirection of air flow reverses, so that dry (in kg/m3) outside air comes easily through theunsealed seams of the roof covering. These same seams allow a portion of the watervapour to escape upwards, as shown in figure 6.38.
Such a relatively short period of rapid mobilisation of water in a structure is notuncommon. The conditions for condensation are usually only fulfilled in the transitionfrom winter to summer. Nevertheless, much damage can be caused by these briefepisodes. There was far more corrosion on the underside of the lead coated copper roofthan on the outside. The fireproofing salts had migrated and recrystallised and aluxuriant growth of fungus wound its hyphæ around the nutritious crystals ofammonium dihydrogen phosphate while the borax added to prevent this hadrecrystallised far away.
The complexity of the roof was forced on the architect. The original roof was very thin,so the new roof had to match its dimensions while providing insulation and fireresistance to modern standards. It had to be placed in sections over a building that
6. The Arts and Industries Museum 141
Figure 6.38. Trickles of water emerging onto theroof. The water is distilled from the underlyingdamp plywood and condenses in periods whenthe roof skin is cooler than the wood below.

continued to function as a museum, making impossible the laying of a continuous airbarrier. Given the circumstances there is no one to blame for this expensive mistake.
One solution to the problem was not only available but was being built just a few metresaway at the same time, designed by the same architect. Another part of the roof of thisvast building was constructed in almost the same way, but with slabs of foamed glassinsulation instead of the glass fibre. This material is completely impermeable and so thedistillation process described above cannot occur. The absorption of water vapour intothe roof is certainly happening in the same way but the drying occurs predominantly tothe outside.
One can speculate over other solutions to the problem. If there were no vapour barrierthe condensate would be absorbed into the lower plywood. The process would go intoreverse during the night so that no water would cascade into the interior. Anotherpossibility would be to use absorbent insulation, such as wool or paper fibres. The
142 6. The Arts and Industries Museum
Figure 6.39 A summary of the annual cycle of water movement in the roof of theArts and Industries Museum. In winter, on the left, warm, buoyant air forces its wayup through the roof, depositing water in the cold upper plywood. In summer, on theright, the clear sunlight warms the roof. The water is released and diffuses down,helped by the downward flow of warm air into the now cooler interior. It condenseson the vapour barrier, accumulates in drops which, after a while, join together andmove off down the shallow slope to the nearest crack in the ceiling. From there ashower of rain, with dissolved fireproofing salts from the wood, cascades into theexhibition hall below. The entire process is governed by the interplay of absorbentand non-absorbent materials in the complex roof structure.

lower, cooler parts would absorb water, possibly in sufficient amount to prevent thedaily condensation. The insulation would dry out again during the night when thewarmth of the building and radiation to the night sky from the dark roof would reversethe temperature gradient.
Such speculation can only be tested by making models, real models. It is difficult toimagine that a computer program could simulate the intricacy of water movement in theroof described above.
One can draw the conclusion from this tale that modern building practice has reached adegree of complexity whose consequences are unpredictable. There is a good case forinvestigating radical, but simple alternatives, such as massive walls which combine inone layer the functions of moisture absorption, thermal insulation, thermal inertia, fireresistance and physical strength.
Making a simple roof is more difficult, particularly in a cool, rainy temperate climate.Absorbent materials have a role to play in roof construction, because of their ability toabsorb limited amounts of water, which can be released again when the temperaturegradient reverses. The criterion for effective performance is therefore that the absorbentmaterial must be able to take up the likely daily flux of vapour. The amount depends, ofcourse, on the water capacity of the source.
Ideally the upper parts of the roof, those that are warmed in the spring sunshine, shouldhave rather little water capacity, whereas the lower levels, at the relatively constantindoor temperature should be very absorbent.
6. The Arts and Industries Museum 143

144 6. The Arts and Industries Museum