6 dpi403 qog introduction - harvard university fall09/6 dpi403 qog... · 1 wed2 sept introduction:...
TRANSCRIPT

DPI‐403DPI 403
Introduction to using the QoGdataset

HousekeepingHousekeeping
• Sign up for lab sessionsSign up for lab sessions• A. Mon 5th 1.00‐2.30, B. 2.30‐4.00, C. Tues 6th 1‐2.30
• A. Mon 19th 1.00‐2.30 , B 2.30‐4.00, C Tues 20th 1‐2.30, ,
• Download template for 1st assignment report
• Review examples of previous student reports• Review examples of previous student reports
• Visiting speakers announced

Class Date Topic Due dates (i)
Part I: Advocacy: Democratic governance for development
1 Wed 2 Sept Introduction: Roadmap and democratic governance for development
2 Wed 9 Sept The role of the UN, regional organizations and bilateral donors
3 Mon 14 Sept Impact upon economic growth and social welfare
4 Wed 16 Sept Impact upon peace, conflict and terrorism
Part II: Analytics: Diagnostics, benchmarks and indicators
5 Mon 21 Sept Overview: Alternative concepts of democratic governance
6 Wed 23 Sept Introduction to using the QoG and shared class datasets
7 Mon 28 Sept Measuring democracy: Freedom House and Polity IV
8 Wed 30 Sept Guest Lecture: Thomas Carothers, Carnegie Endowment for International Peace: DemocracyPromotion
9 Mon 5 Oct Utilizing the shared CS‐TS class datasets (Applied Lab session #1)*
10 Wed 7 Oct Survey indicators and democratic audits: WVS
11 Wed 14 Oct Measuring good governance: Kaufmann‐Kraay
12 M 19 O U ili i h h d CS TS l d (A li d L b i #2)*12 Mon19 Oct Utilizing the shared CS‐TS class datasets (Applied Lab session #2)*
Part III: Options: reform strategies and agencies
13 Wed 21 Oct Constitution‐building in peace‐building processes: International IDEA #1
14 Mon 26 Oct Elections: ACE/Internnational IDEA
15 Wed 28 Oct Guest Lecture: Larry Diamond Strategies and options for strengthening democratic governance
16 Mon 2 Nov Strengthening representation: parliaments, parties, and women’s empowerment: the Inter‐parliamentary Union
17 Wed 4 Nov Building the capable state: public administration reform, local governance, and anti‐corruption:Transparency International
18 Mon 9 Nov Civil society social capital and the news media: Committee to Protect Journalists and the Open18 Mon 9 Nov Civil society, social capital and the news media: Committee to Protect Journalists and the OpenSociety Institute
19 Mon 16 Nov Human rights, justice, and rule of law: Amnesty International # 2
Part IV: Implementation: Applied case‐studies
20 Wed 18 Nov Identifying your client’s strategic priorities and capacities
21 Mon 23 Nov Guest Lecture: Ingrid Wetterqvist and Massimo Tommasoli, International IDEA: Europeanapproaches to Democracy Promotion
22 Wed 25 Nov Class workgroup presentations
Conclusions
23 Mon 30 Nov Conclusion & wrap up # 3

StructureStructure
1 Why measure the quality of democratic1. Why measure the quality of democratic governance?
2 What types of indicators are available in the2. What types of indicators are available in the QoG dataset?
3 H h l ff i l ?3. How can you present the results effectively?

1. Why measure QoG?1. Why measure QoG?
– Evidence based policymakingEvidence based policymaking
– Diagnosis of priorities facing country
– Implementation and program performanceImplementation and program performance management by results
– Policy analysis – what works?Policy analysis what works?
– Human development• UNDP’s HDIUNDP s HDI
• MDG targets eg poverty, female education
• Standardized international statistics

1st class assignment1st class assignment• Assignment 1: Challenges of democratic governance facing a world region (30%)
• Aim: Become familiar with the most common indices and datasets to compare and evaluate the quality of democratic governance.
• You are asked to use selected indicators to write a professional report assessing and comparing the problems of democratic governance reform in one world region (e.g. Latin America and the Caribbean, Sub‐Saharan Africa, Asia, Central and Eastern Europe, North Africa and the Middle‐East).
• The potential client for your report is a regional organization, an international b l l d l h d h dagency or a bilateral donor. Your client has requested the report in order to
identify the most pressing problems of democratic governance in the region, to prioritize their work within countries.
• Your report will also be read and critiqued by representatives from governments d ti l t k h ld i th i it d t b f ll itt dand national stake‐holders in the region so it needs to be carefully written and
supported by direct evidence derived from the available datasets and from citations to existing research.
• It has a professional readership so the presentation of effective graphs and figures is essential to summarize data with more technical details confined to a technicalis essential to summarize data, with more technical details confined to a technical appendix. It should NOT be written as a personal essay or as an academic paper.
9/23/2009 www.pippanorris.com 6

1st Assignment1 Assignment• What indicators would you use (and why?)
h d i i d d i l b h k ld d l• What descriptive trends and summary regional benchmarks would you develop for comparison?
• What additional information would you collect, to evaluate and measure political priorities in your region?
• What secondary literature is available from research to support your argument? As part of the exercise, you should justify your choice of criteria, measures, and evidence for a non‐technical audience. The QoG dataset provides the following resources, along with many others:
• 1. Freedom House index of political rights and civil liberties• 2. Polity IV Project Democracy and Autocracy scales• 3. Cheibub and Gandhi Democracy‐Autocracy classification3. Cheibub and Gandhi Democracy Autocracy classification• 4. Vanhanen Democracy Index• 5. World Values Survey/Global Barometers Attitudinal surveys• 6. Kaufmann/Kray World Bank Institute Good governance indicators
7 T I i l C i i d• 7. Transparency International Corruption index
9/23/2009 www.pippanorris.com 7

Common professional skillCommon professional skill
• Practical use of descriptive statistics andPractical use of descriptive statistics and qualitative cases for evidence‐based performance indicatorsperformance indicators
• Country/regional assessments and needs analysisanalysis
• Effective descriptive presentation to display d d itrends and comparisons
• Accessible for a practitioner readership

2. WHAT INDICATORS ARE2. WHAT INDICATORS ARE AVAILABLE?

www.qog.pol.gu.se/www.qog.pol.gu.se/
9/23/2009 www.pippanorris.com 10

Types of QoG variablesTypes of QoG variables
1. WII (What It Is) variables, – variables pertaining to the core features of QoG (such as
corruption, bureaucratic quality, and democracy)2. HTG (How To Get it) variables, (causes)
– variables posited to promote the development of QoG (such as electoral rules, forms of government, federalism, legal & colonial origin, religion and social fractionalization); and
3 WYG (Wh Y G ) i bl ( )3. WYG (What You Get) variables, (consequences)– variables pertaining to some of the posited consequences of
QoG (such as economic and human development, international and domestic peace environmentalinternational and domestic peace, environmental sustainability, gender equality, and satisfied, trusting & confident citizens).
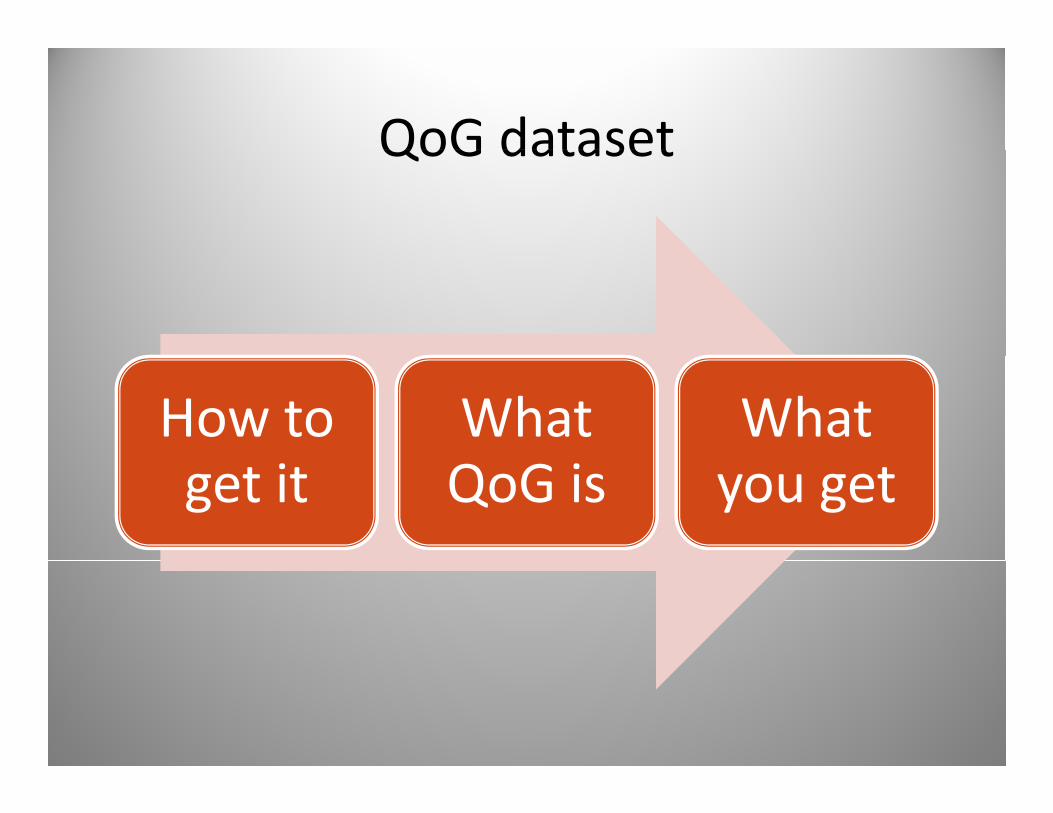
QoG datasetQoG dataset
How to What What get it QoG is you get

QoG What it is…QoG What it is…
• Be selective….• Cheibub & Gandhi
• Type of regime democracy/autocracy
Ci lli & Ri h d• Cingranelli & Richards• Human rights
• Freedom HouseFreedom House• Freedom in the world
• Polity IV• Democracy‐autocracy
• World Bank• Good governance indicatorsGood governance indicators

Types of dataTypes of data
• Cross‐sectionalCross sectional – 192 independent nation‐states
2006 (or latest year available)– 2006 (or latest year available)
– Released June 2009
Ti i 1990 2006• Time‐series 1990‐2006– Same nation‐states plus 13 historical countries

Examples of graphics and tables from the UNDP Human Development
3. PROFESSIONAL PRESENTATIONS
Examples of graphics and tables from the UNDP Human Development Report
3. PROFESSIONAL PRESENTATIONS


Next class:Next class:
Freedom house and Polity IV
Read FH ‘methodology’ Freedom ofRead FH methodology Freedom of the World