6 drawing graphics - grahamhall.orggrahamhall.org/java netbeans/chapter 6 drawing graphics.pdf ·...
TRANSCRIPT
150 Java Programming for A-level Computer Science
6 Drawing graphics
In previous programs we have added picture images to forms in a similar way to other components,
so that the pictures appear when the program runs. In some cases, however, we need to draw
graphics while a program is actually running, using input from the user. For example: in a computer
aided design application, the user might draw lines and shapes to produce an image of a building or
piece of machinery. In this chapter, we will set up some programs to produce run-time graphics
using graphics programming commands.
For the first example, we will create a program which draws a picture of a house. A design for the
image is provided on graph paper on the next page.
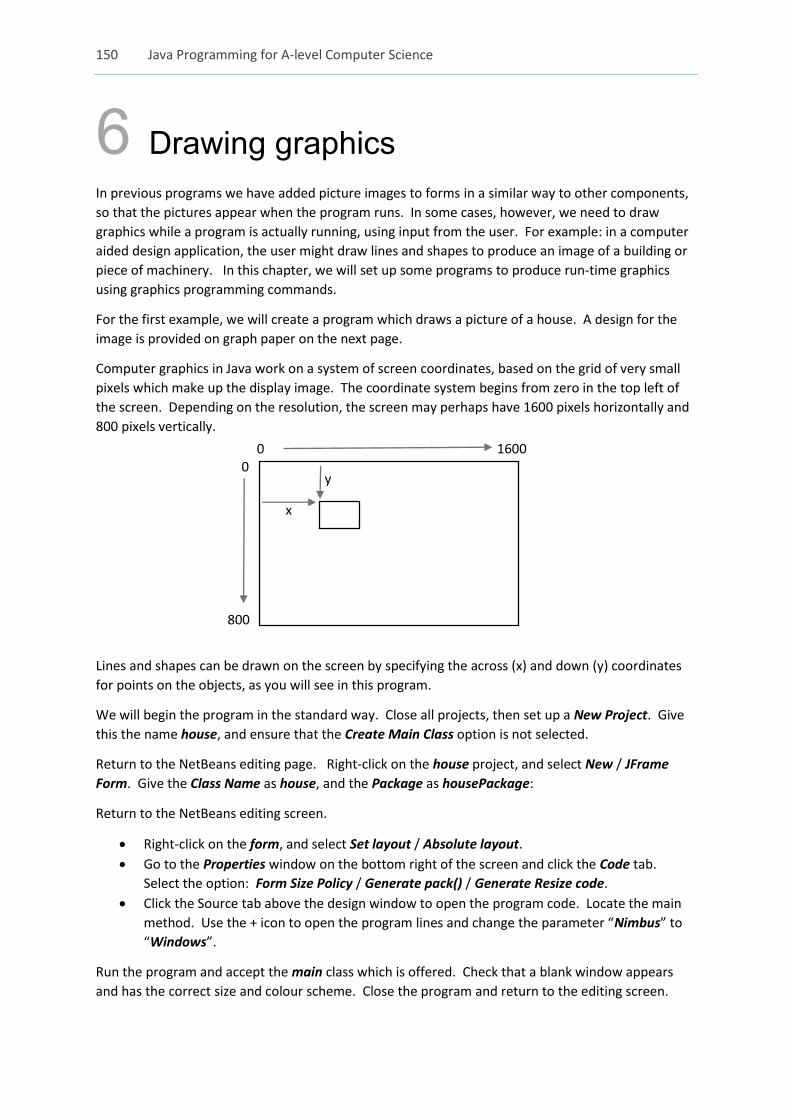
Computer graphics in Java work on a system of screen coordinates, based on the grid of very small
pixels which make up the display image. The coordinate system begins from zero in the top left of
the screen. Depending on the resolution, the screen may perhaps have 1600 pixels horizontally and
800 pixels vertically.
Lines and shapes can be drawn on the screen by specifying the across (x) and down (y) coordinates
for points on the objects, as you will see in this program.
We will begin the program in the standard way. Close all projects, then set up a New Project. Give
this the name house, and ensure that the Create Main Class option is not selected.
Return to the NetBeans editing page. Right-click on the house project, and select New / JFrame
Form. Give the Class Name as house, and the Package as housePackage:
Return to the NetBeans editing screen.
Right-click on the form, and select Set layout / Absolute layout.
Go to the Properties window on the bottom right of the screen and click the Code tab.
Select the option: Form Size Policy / Generate pack() / Generate Resize code.
Click the Source tab above the design window to open the program code. Locate the main
method. Use the + icon to open the program lines and change the parameter “Nimbus” to
“Windows”.
Run the program and accept the main class which is offered. Check that a blank window appears
and has the correct size and colour scheme. Close the program and return to the editing screen.
0 0 1600
y
x
800

Chapter 6: Drawing graphics 151
100
200
300
400
600
500
0 0 100 200 300 400
152 Java Programming for A-level Computer Science
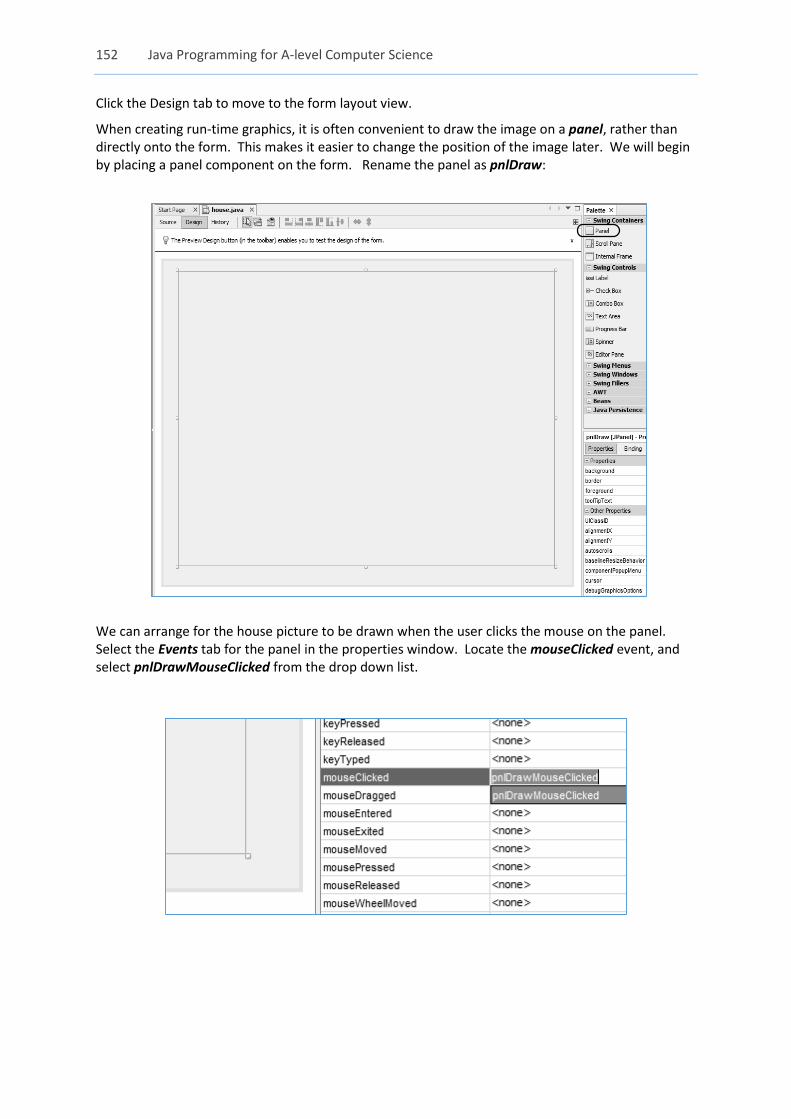
Click the Design tab to move to the form layout view.
When creating run-time graphics, it is often convenient to draw the image on a panel, rather than directly onto the form. This makes it easier to change the position of the image later. We will begin by placing a panel component on the form. Rename the panel as pnlDraw:
We can arrange for the house picture to be drawn when the user clicks the mouse on the panel. Select the Events tab for the panel in the properties window. Locate the mouseClicked event, and select pnlDrawMouseClicked from the drop down list.
Chapter 6: Drawing graphics 153
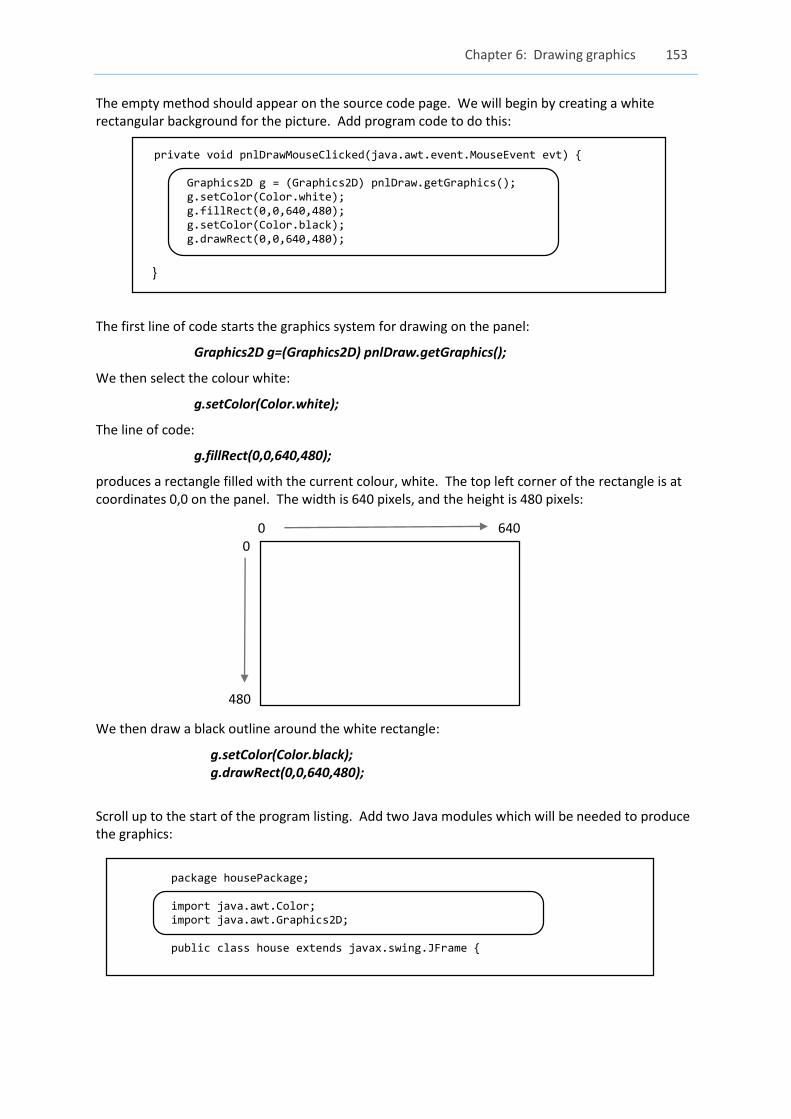
The empty method should appear on the source code page. We will begin by creating a white rectangular background for the picture. Add program code to do this:
private void pnlDrawMouseClicked(java.awt.event.MouseEvent evt) { Graphics2D g = (Graphics2D) pnlDraw.getGraphics(); g.setColor(Color.white); g.fillRect(0,0,640,480); g.setColor(Color.black); g.drawRect(0,0,640,480);
} The first line of code starts the graphics system for drawing on the panel:
Graphics2D g=(Graphics2D) pnlDraw.getGraphics();
We then select the colour white:
g.setColor(Color.white);
The line of code:
g.fillRect(0,0,640,480);
produces a rectangle filled with the current colour, white. The top left corner of the rectangle is at coordinates 0,0 on the panel. The width is 640 pixels, and the height is 480 pixels:
We then draw a black outline around the white rectangle:
g.setColor(Color.black); g.drawRect(0,0,640,480);
Scroll up to the start of the program listing. Add two Java modules which will be needed to produce the graphics:
package housePackage; import java.awt.Color; import java.awt.Graphics2D; public class house extends javax.swing.JFrame {
0 640
480
0
154 Java Programming for A-level Computer Science
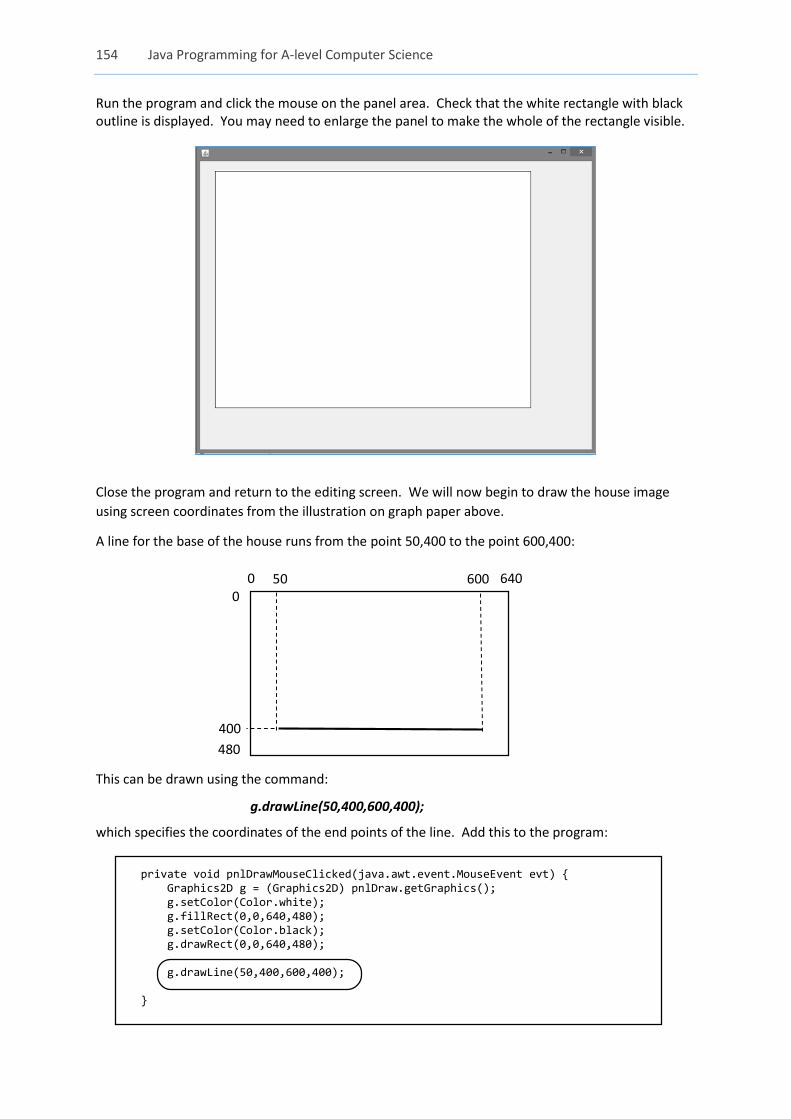
Run the program and click the mouse on the panel area. Check that the white rectangle with black outline is displayed. You may need to enlarge the panel to make the whole of the rectangle visible.
Close the program and return to the editing screen. We will now begin to draw the house image
using screen coordinates from the illustration on graph paper above.
A line for the base of the house runs from the point 50,400 to the point 600,400:
This can be drawn using the command:
g.drawLine(50,400,600,400);
which specifies the coordinates of the end points of the line. Add this to the program:
private void pnlDrawMouseClicked(java.awt.event.MouseEvent evt) { Graphics2D g = (Graphics2D) pnlDraw.getGraphics(); g.setColor(Color.white); g.fillRect(0,0,640,480); g.setColor(Color.black); g.drawRect(0,0,640,480); g.drawLine(50,400,600,400); }
0 640
480
0
400
50 600
Chapter 6: Drawing graphics 155
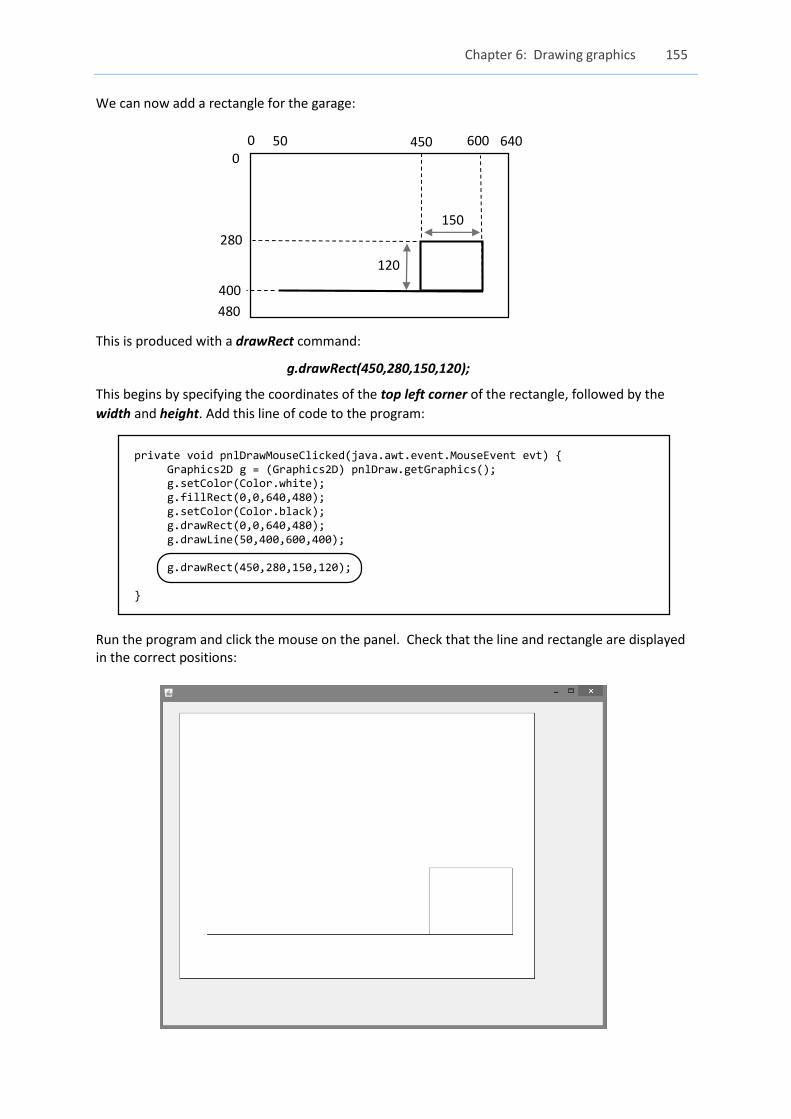
We can now add a rectangle for the garage:
This is produced with a drawRect command:
g.drawRect(450,280,150,120);
This begins by specifying the coordinates of the top left corner of the rectangle, followed by the
width and height. Add this line of code to the program:
private void pnlDrawMouseClicked(java.awt.event.MouseEvent evt) { Graphics2D g = (Graphics2D) pnlDraw.getGraphics(); g.setColor(Color.white); g.fillRect(0,0,640,480); g.setColor(Color.black); g.drawRect(0,0,640,480); g.drawLine(50,400,600,400); g.drawRect(450,280,150,120); }
Run the program and click the mouse on the panel. Check that the line and rectangle are displayed in the correct positions:
0 640
480
0
400
50 600
280
450
150
120
156 Java Programming for A-level Computer Science
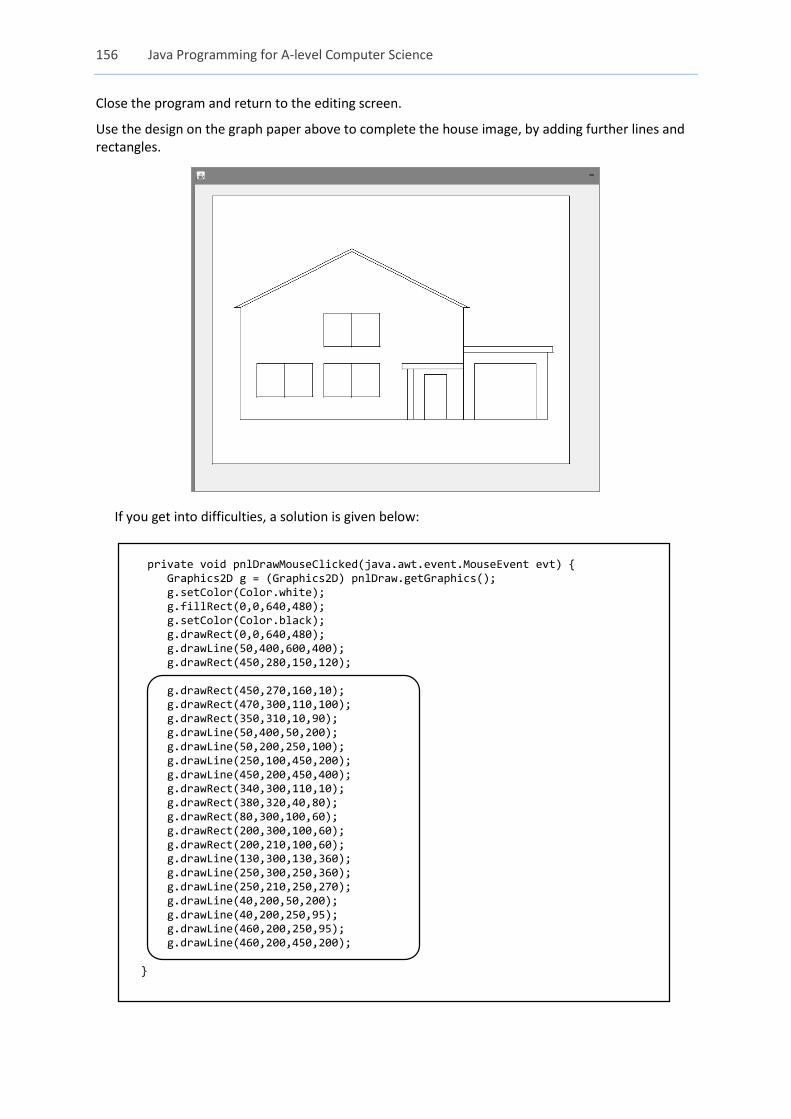
Close the program and return to the editing screen.
Use the design on the graph paper above to complete the house image, by adding further lines and rectangles.
If you get into difficulties, a solution is given below: private void pnlDrawMouseClicked(java.awt.event.MouseEvent evt) { Graphics2D g = (Graphics2D) pnlDraw.getGraphics(); g.setColor(Color.white); g.fillRect(0,0,640,480); g.setColor(Color.black); g.drawRect(0,0,640,480); g.drawLine(50,400,600,400); g.drawRect(450,280,150,120); g.drawRect(450,270,160,10); g.drawRect(470,300,110,100); g.drawRect(350,310,10,90); g.drawLine(50,400,50,200); g.drawLine(50,200,250,100); g.drawLine(250,100,450,200); g.drawLine(450,200,450,400); g.drawRect(340,300,110,10); g.drawRect(380,320,40,80); g.drawRect(80,300,100,60); g.drawRect(200,300,100,60); g.drawRect(200,210,100,60); g.drawLine(130,300,130,360); g.drawLine(250,300,250,360); g.drawLine(250,210,250,270); g.drawLine(40,200,50,200); g.drawLine(40,200,250,95); g.drawLine(460,200,250,95); g.drawLine(460,200,450,200); }
Chapter 6: Drawing graphics 157
For the next program, we will produce a graph, based on data input by the user while the program is
running.
Temperature and rainfall total are recorded at a weather station each day.
A program is required which will input and display a week's temperature and rainfall
data together on the same graph:
Temperature is to be shown as a graph line. You may assume that all
temperatures will be in the range from -5o to 25o C.
Rainfall is to be shown by columns. You may assume that daily rainfall will not
exceed 30mm.
A stategy for this program is to input the temperature and rainfall with a table component, then
store the data in two arrays. We can use loops to plot the teperature line and rainfall columns on
the graph.
Begin the project in the standard way:
Close all projects, then set up a New Project. Give this the name weather, and ensure that the
Create Main Class option is not selected.
Return to the NetBeans editing page. Right-click on the weather project, and select New / JFrame
Form. Give the Class Name as weather, and the Package as weatherPackage:
Return to the NetBeans editing screen.
Right-click on the form, and select Set layout / Absolute layout.
Go to the Properties window on the bottom right of the screen and click the Code tab.
Select the option: Form Size Policy / Generate pack() / Generate Resize code.
Click the Source tab above the design window to open the program code. Locate the main
method. Use the + icon to open the program lines and change the parameter “Nimbus” to
“Windows”.
Run the program and accept the main class which is offered. Check that a blank window appears
and has the correct size and colour scheme. Close the program and return to the editing screen.
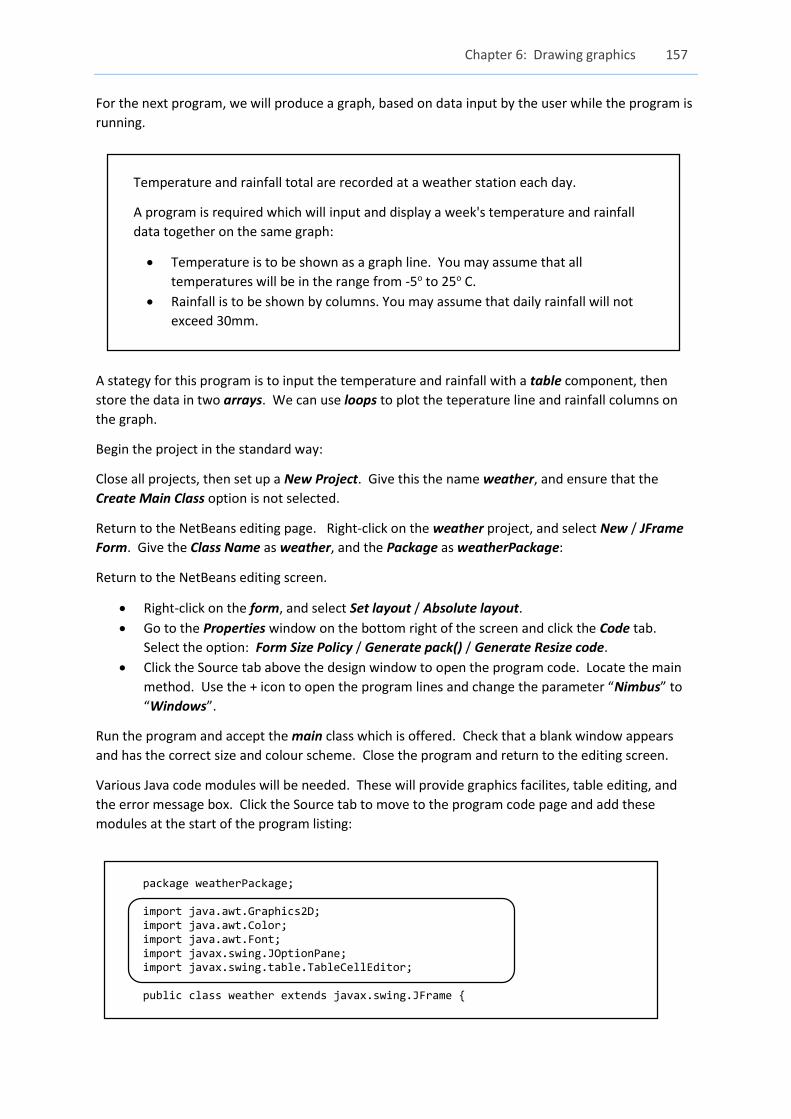
Various Java code modules will be needed. These will provide graphics facilites, table editing, and
the error message box. Click the Source tab to move to the program code page and add these
modules at the start of the program listing:
package weatherPackage; import java.awt.Graphics2D; import java.awt.Color; import java.awt.Font; import javax.swing.JOptionPane; import javax.swing.table.TableCellEditor; public class weather extends javax.swing.JFrame {
158 Java Programming for A-level Computer Science
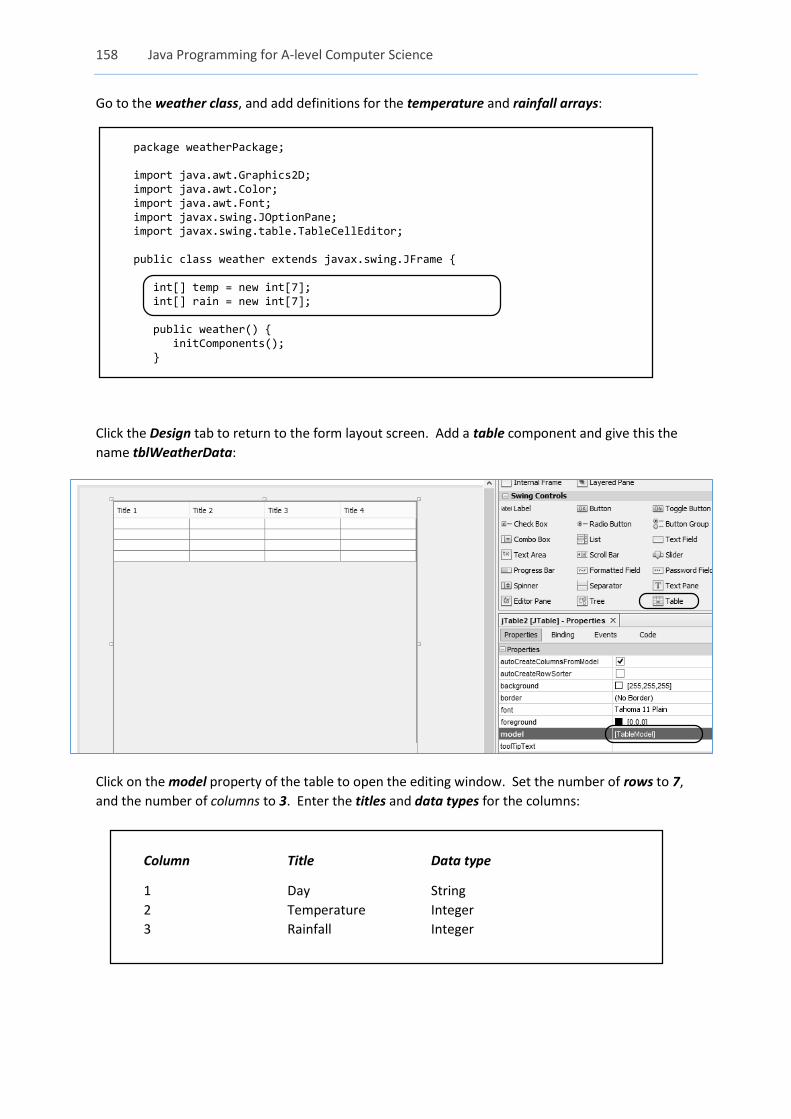
Go to the weather class, and add definitions for the temperature and rainfall arrays:
package weatherPackage; import java.awt.Graphics2D; import java.awt.Color; import java.awt.Font; import javax.swing.JOptionPane; import javax.swing.table.TableCellEditor; public class weather extends javax.swing.JFrame { int[] temp = new int[7]; int[] rain = new int[7]; public weather() { initComponents(); }
Click the Design tab to return to the form layout screen. Add a table component and give this the
name tblWeatherData:
Click on the model property of the table to open the editing window. Set the number of rows to 7,
and the number of columns to 3. Enter the titles and data types for the columns:
Column Title Data type
1 Day String
2 Temperature Integer
3 Rainfall Integer
Chapter 6: Drawing graphics 159
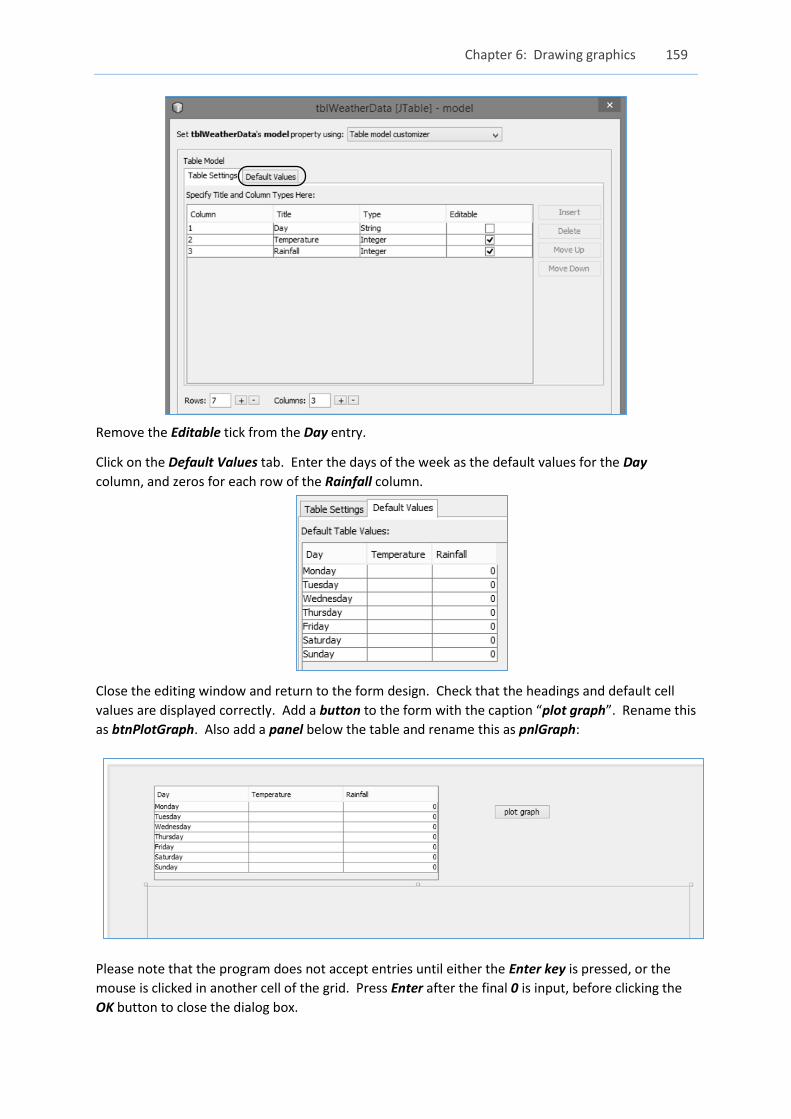
Remove the Editable tick from the Day entry.
Click on the Default Values tab. Enter the days of the week as the default values for the Day
column, and zeros for each row of the Rainfall column.
Close the editing window and return to the form design. Check that the headings and default cell
values are displayed correctly. Add a button to the form with the caption “plot graph”. Rename this
as btnPlotGraph. Also add a panel below the table and rename this as pnlGraph:
Please note that the program does not accept entries until either the Enter key is pressed, or the
mouse is clicked in another cell of the grid. Press Enter after the final 0 is input, before clicking the
OK button to close the dialog box.
160 Java Programming for A-level Computer Science
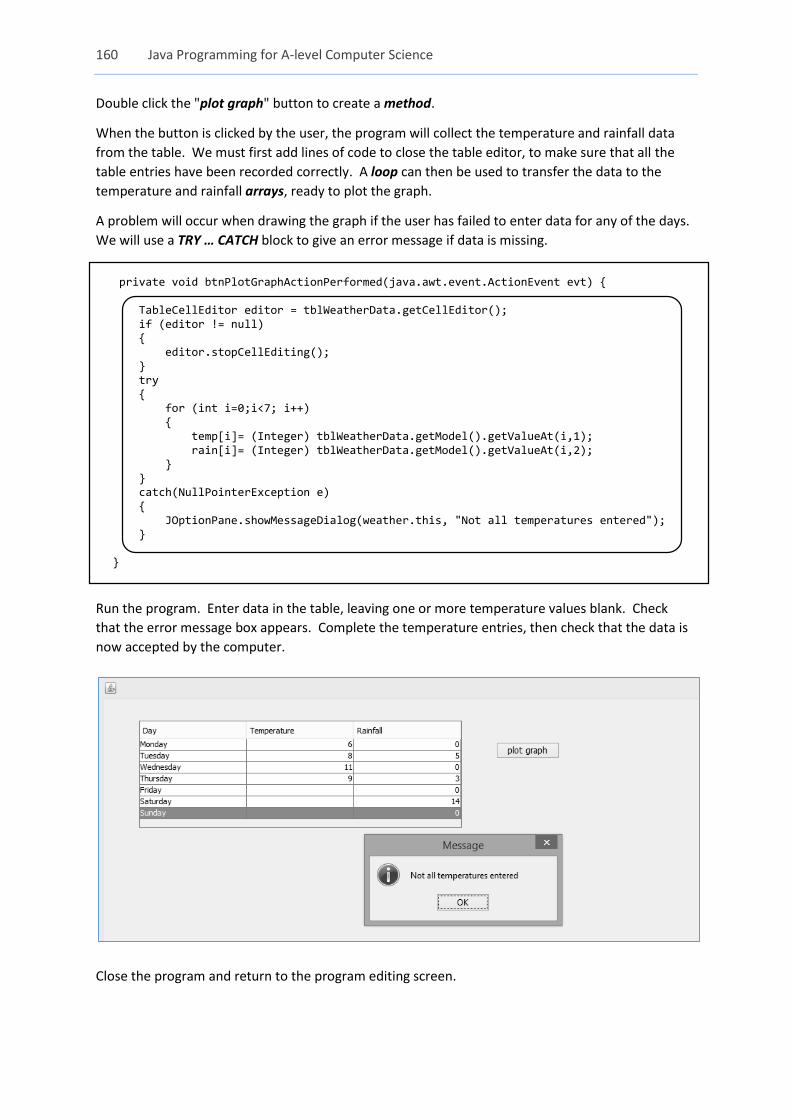
Double click the "plot graph" button to create a method.
When the button is clicked by the user, the program will collect the temperature and rainfall data
from the table. We must first add lines of code to close the table editor, to make sure that all the
table entries have been recorded correctly. A loop can then be used to transfer the data to the
temperature and rainfall arrays, ready to plot the graph.
A problem will occur when drawing the graph if the user has failed to enter data for any of the days.
We will use a TRY … CATCH block to give an error message if data is missing.
private void btnPlotGraphActionPerformed(java.awt.event.ActionEvent evt) { TableCellEditor editor = tblWeatherData.getCellEditor(); if (editor != null) { editor.stopCellEditing(); } try { for (int i=0;i<7; i++) { temp[i]= (Integer) tblWeatherData.getModel().getValueAt(i,1); rain[i]= (Integer) tblWeatherData.getModel().getValueAt(i,2); } } catch(NullPointerException e) { JOptionPane.showMessageDialog(weather.this, "Not all temperatures entered"); } }
Run the program. Enter data in the table, leaving one or more temperature values blank. Check
that the error message box appears. Complete the temperature entries, then check that the data is
now accepted by the computer.
Close the program and return to the program editing screen.
Chapter 6: Drawing graphics 161
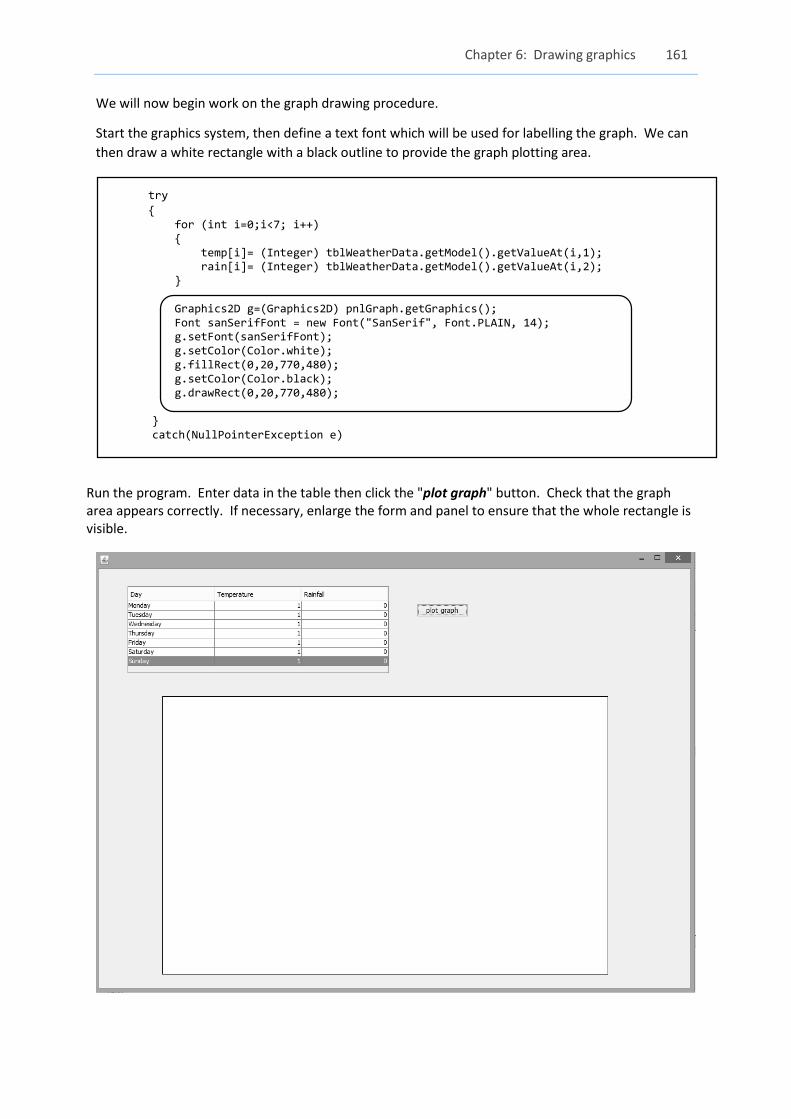
We will now begin work on the graph drawing procedure.
Start the graphics system, then define a text font which will be used for labelling the graph. We can
then draw a white rectangle with a black outline to provide the graph plotting area.
try
{ for (int i=0;i<7; i++) { temp[i]= (Integer) tblWeatherData.getModel().getValueAt(i,1); rain[i]= (Integer) tblWeatherData.getModel().getValueAt(i,2); } Graphics2D g=(Graphics2D) pnlGraph.getGraphics(); Font sanSerifFont = new Font("SanSerif", Font.PLAIN, 14); g.setFont(sanSerifFont); g.setColor(Color.white); g.fillRect(0,20,770,480); g.setColor(Color.black); g.drawRect(0,20,770,480);
} catch(NullPointerException e)
Run the program. Enter data in the table then click the "plot graph" button. Check that the graph area appears correctly. If necessary, enlarge the form and panel to ensure that the whole rectangle is visible.

162 Java Programming for A-level Computer Science
Close the program and return to the program editing screen. We will now add graphics commands
to draw the axes for the graph, then use a loop to add the captions for the days of the week.
The drawString command places text on the screen. This requires three parameters: the text string
itself, the horizontal coordinate and the vertical coordinate where the text will be displayed:
g.drawString(day,130+80*x,428);
Notice how the loop counter variable x is used to calculate the horizontal position of each of the
labels. 80 pixels are added to the horizontal coordinate each time around the loop, as x increases in
value from 0 to 6:
g.setColor(Color.white); g.fillRect(0,20,770,480); g.setColor(Color.black); g.drawRect(0,20,770,480); g.drawLine(100,100,100,400); g.drawLine(100,400,660,400); g.drawLine(660,400,660,100); String day=""; for (int x=0; x<=6;x++) { g.drawLine(100+80*x,400,100+80*x,410); switch(x) { case 0: day="Mon"; break; case 1: day="Tue"; break; case 2: day="Wed"; break; case 3: day="Thur"; break; case 4: day="Fri"; break; case 5: day="Sat"; break; case 6: day="Sun"; break; } g.drawString(day,130+80*x,428); }
} catch(NullPointerException e)
A new program structure has been introduced here: a SWITCH … CASE block. This has a similar
purpose to a conditional IF … THEN … ELSE structure, but allows for more than two possible
outcomes:
switch(x) : check the value of the variable x
{ case 0: day="Mon"; break; : do this if x = 0 case 1: day="Tue"; break; : do this if x = 1 . . . case 6: day="Sun"; break; : do this if x = 6 }
Chapter 6: Drawing graphics 163
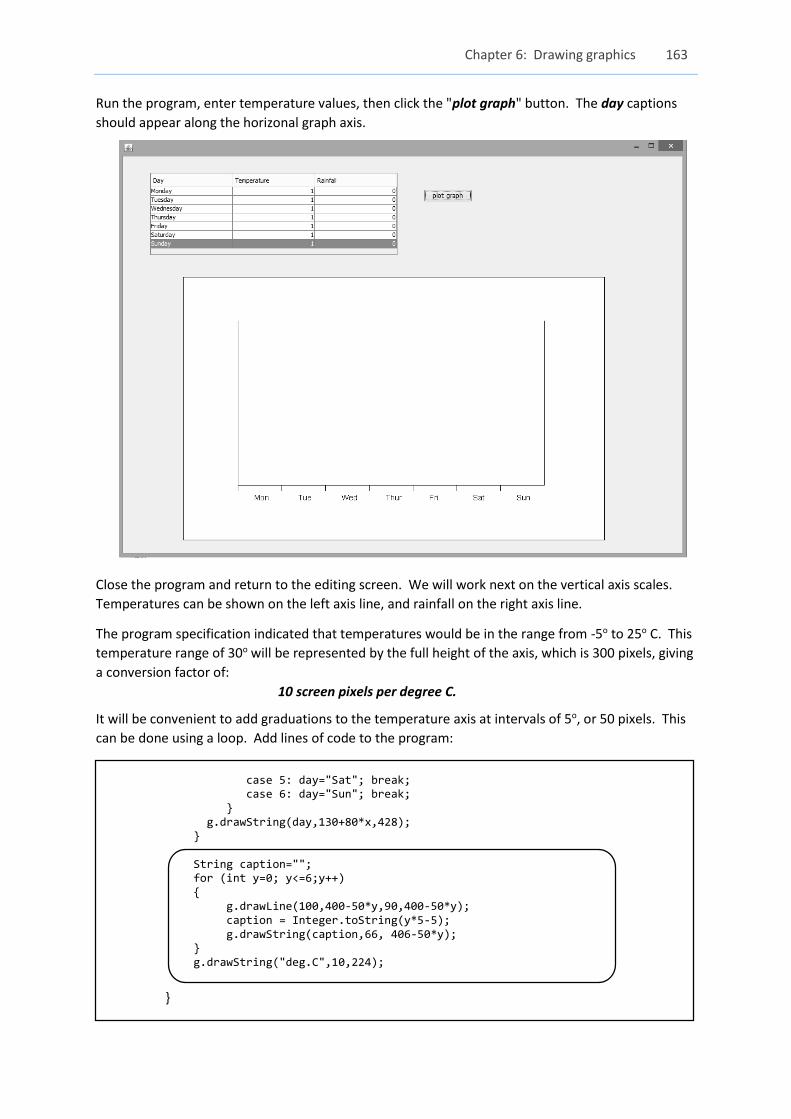
Run the program, enter temperature values, then click the "plot graph" button. The day captions
should appear along the horizonal graph axis.
Close the program and return to the editing screen. We will work next on the vertical axis scales.
Temperatures can be shown on the left axis line, and rainfall on the right axis line.
The program specification indicated that temperatures would be in the range from -5o to 25o C. This
temperature range of 30o will be represented by the full height of the axis, which is 300 pixels, giving
a conversion factor of:
10 screen pixels per degree C.
It will be convenient to add graduations to the temperature axis at intervals of 5o, or 50 pixels. This
can be done using a loop. Add lines of code to the program:
case 5: day="Sat"; break; case 6: day="Sun"; break; } g.drawString(day,130+80*x,428); } String caption=""; for (int y=0; y<=6;y++) { g.drawLine(100,400-50*y,90,400-50*y); caption = Integer.toString(y*5-5); g.drawString(caption,66, 406-50*y); } g.drawString("deg.C",10,224);
}
164 Java Programming for A-level Computer Science
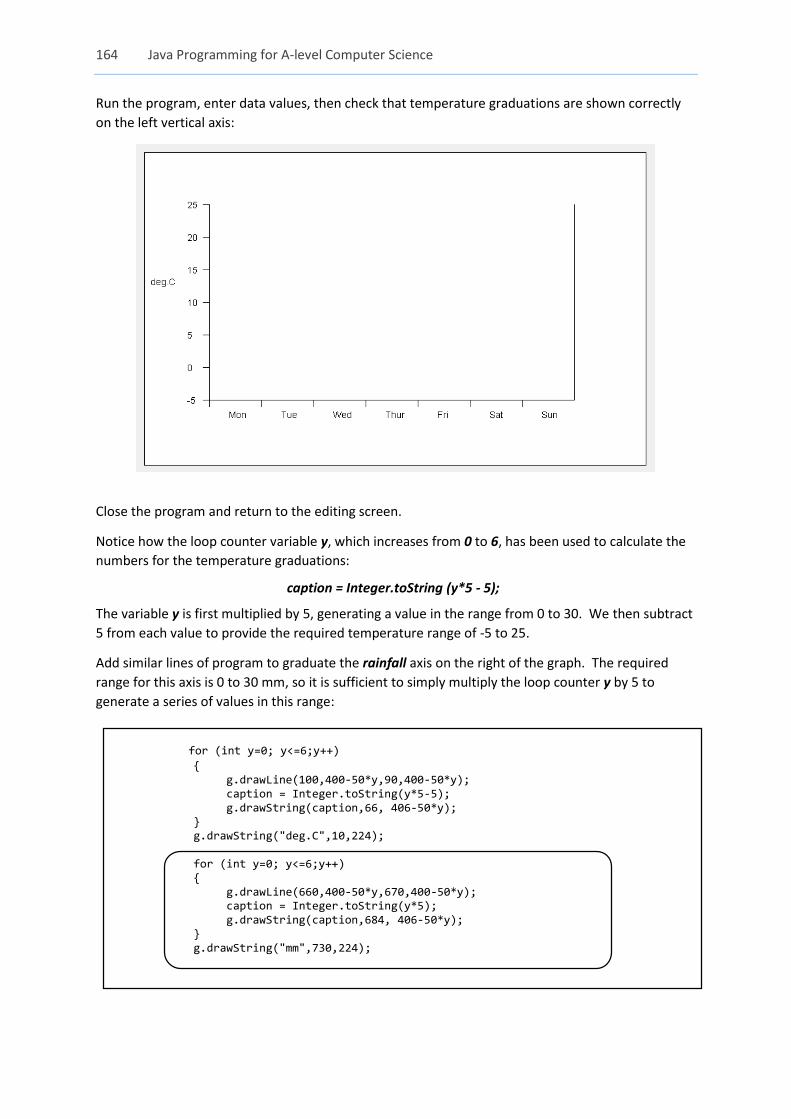
Run the program, enter data values, then check that temperature graduations are shown correctly
on the left vertical axis:
Close the program and return to the editing screen.
Notice how the loop counter variable y, which increases from 0 to 6, has been used to calculate the
numbers for the temperature graduations:
caption = Integer.toString (y*5 - 5);
The variable y is first multiplied by 5, generating a value in the range from 0 to 30. We then subtract
5 from each value to provide the required temperature range of -5 to 25.
Add similar lines of program to graduate the rainfall axis on the right of the graph. The required
range for this axis is 0 to 30 mm, so it is sufficient to simply multiply the loop counter y by 5 to
generate a series of values in this range:
for (int y=0; y<=6;y++) { g.drawLine(100,400-50*y,90,400-50*y); caption = Integer.toString(y*5-5); g.drawString(caption,66, 406-50*y); } g.drawString("deg.C",10,224); for (int y=0; y<=6;y++) { g.drawLine(660,400-50*y,670,400-50*y); caption = Integer.toString(y*5); g.drawString(caption,684, 406-50*y); } g.drawString("mm",730,224);
Chapter 6: Drawing graphics 165
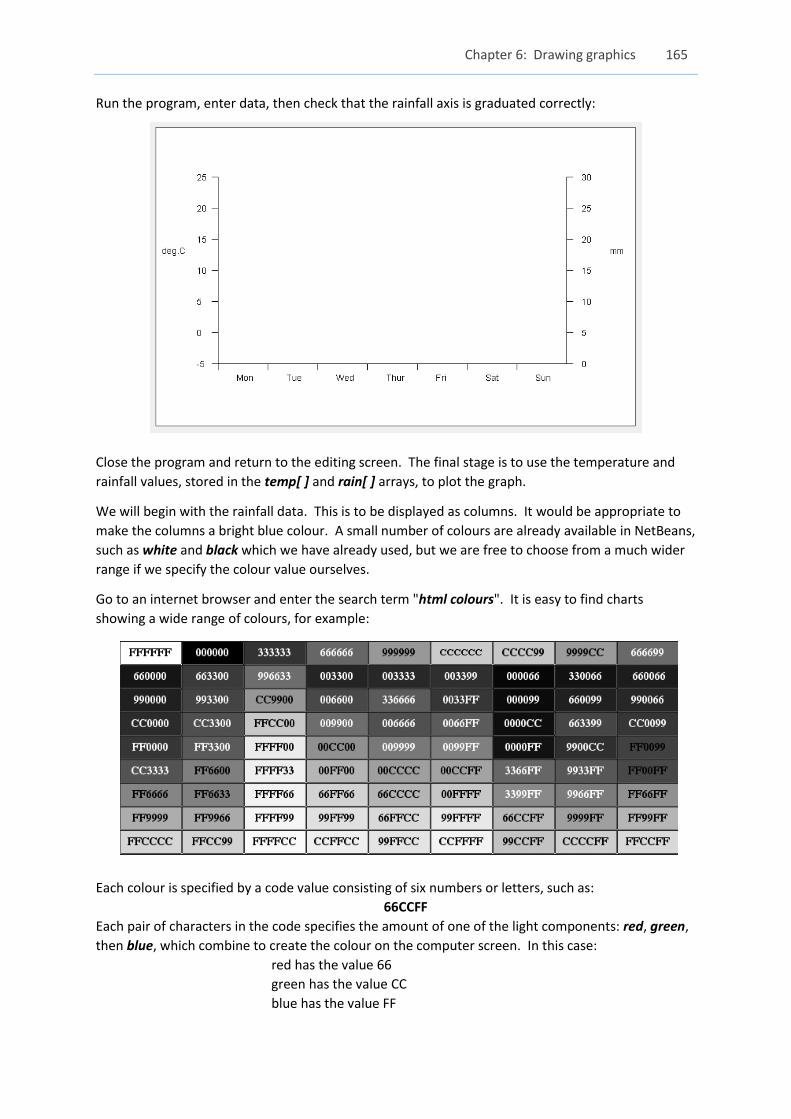
Run the program, enter data, then check that the rainfall axis is graduated correctly:
Close the program and return to the editing screen. The final stage is to use the temperature and
rainfall values, stored in the temp[ ] and rain[ ] arrays, to plot the graph.
We will begin with the rainfall data. This is to be displayed as columns. It would be appropriate to
make the columns a bright blue colour. A small number of colours are already available in NetBeans,
such as white and black which we have already used, but we are free to choose from a much wider
range if we specify the colour value ourselves.
Go to an internet browser and enter the search term "html colours". It is easy to find charts
showing a wide range of colours, for example:
Each colour is specified by a code value consisting of six numbers or letters, such as:
66CCFF
Each pair of characters in the code specifies the amount of one of the light components: red, green,
then blue, which combine to create the colour on the computer screen. In this case:
red has the value 66
green has the value CC
blue has the value FF
166 Java Programming for A-level Computer Science
The codes use the hexadecimal (base-16) number system. Hexadecimal digits can be related to our
normal base-10 number system. The numbers 0 to 9 are the same in both systems. Hexadecimal
then uses the letters A to F to represent the base-10 values 10 to 15.
Hexadecimal
0 1 2 … 7 8 9 A B C D E F
Base-10
0 1 2 … 7 8 9 10 11 12 13 14 15
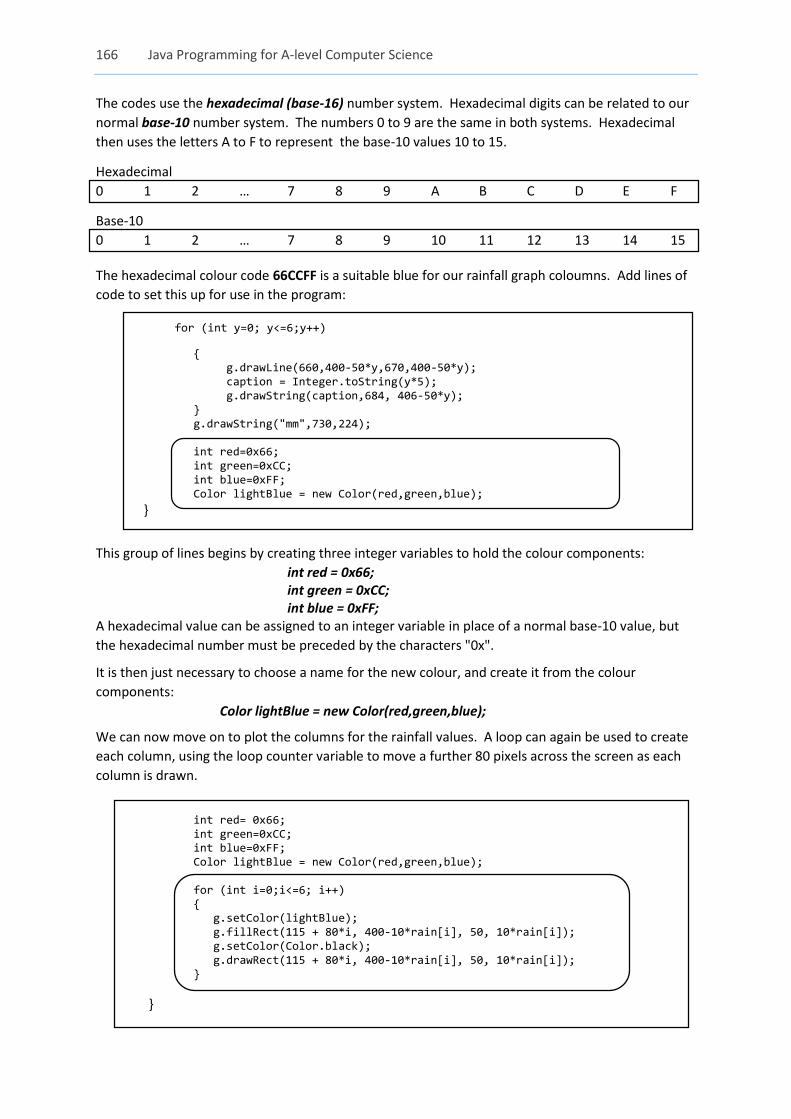
The hexadecimal colour code 66CCFF is a suitable blue for our rainfall graph coloumns. Add lines of
code to set this up for use in the program:
for (int y=0; y<=6;y++)
{ g.drawLine(660,400-50*y,670,400-50*y); caption = Integer.toString(y*5); g.drawString(caption,684, 406-50*y); } g.drawString("mm",730,224); int red=0x66; int green=0xCC; int blue=0xFF; Color lightBlue = new Color(red,green,blue);
}
This group of lines begins by creating three integer variables to hold the colour components:
int red = 0x66; int green = 0xCC; int blue = 0xFF;
A hexadecimal value can be assigned to an integer variable in place of a normal base-10 value, but
the hexadecimal number must be preceded by the characters "0x".
It is then just necessary to choose a name for the new colour, and create it from the colour
components:
Color lightBlue = new Color(red,green,blue);
We can now move on to plot the columns for the rainfall values. A loop can again be used to create
each column, using the loop counter variable to move a further 80 pixels across the screen as each
column is drawn.
int red= 0x66; int green=0xCC; int blue=0xFF; Color lightBlue = new Color(red,green,blue); for (int i=0;i<=6; i++) { g.setColor(lightBlue); g.fillRect(115 + 80*i, 400-10*rain[i], 50, 10*rain[i]); g.setColor(Color.black); g.drawRect(115 + 80*i, 400-10*rain[i], 50, 10*rain[i]); }
}
Chapter 6: Drawing graphics 167
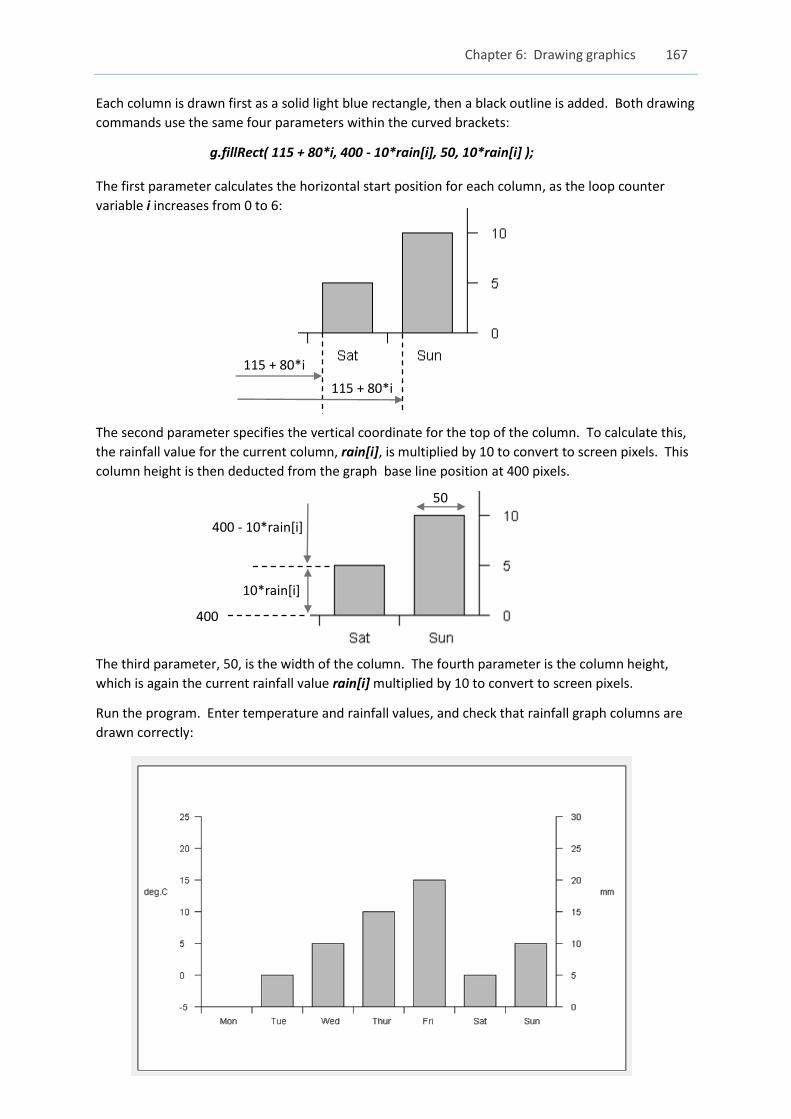
Each column is drawn first as a solid light blue rectangle, then a black outline is added. Both drawing
commands use the same four parameters within the curved brackets:
g.fillRect( 115 + 80*i, 400 - 10*rain[i], 50, 10*rain[i] );
The first parameter calculates the horizontal start position for each column, as the loop counter
variable i increases from 0 to 6:
The second parameter specifies the vertical coordinate for the top of the column. To calculate this,
the rainfall value for the current column, rain[i], is multiplied by 10 to convert to screen pixels. This
column height is then deducted from the graph base line position at 400 pixels.
The third parameter, 50, is the width of the column. The fourth parameter is the column height,
which is again the current rainfall value rain[i] multiplied by 10 to convert to screen pixels.
Run the program. Enter temperature and rainfall values, and check that rainfall graph columns are
drawn correctly:
115 + 80*i
115 + 80*i
400 - 10*rain[i]
10*rain[i]
400
50
168 Java Programming for A-level Computer Science
Close the program and return to the editing screen.
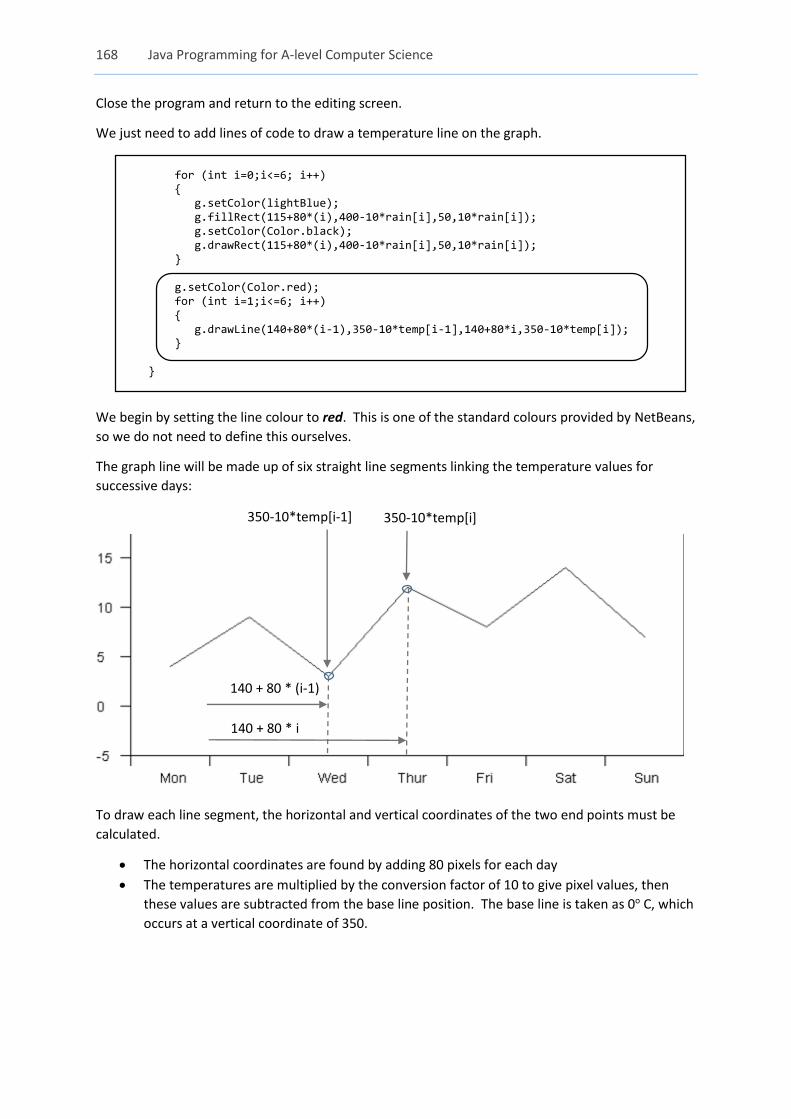
We just need to add lines of code to draw a temperature line on the graph.
for (int i=0;i<=6; i++) { g.setColor(lightBlue); g.fillRect(115+80*(i),400-10*rain[i],50,10*rain[i]); g.setColor(Color.black); g.drawRect(115+80*(i),400-10*rain[i],50,10*rain[i]); } g.setColor(Color.red); for (int i=1;i<=6; i++) { g.drawLine(140+80*(i-1),350-10*temp[i-1],140+80*i,350-10*temp[i]); } }
We begin by setting the line colour to red. This is one of the standard colours provided by NetBeans,
so we do not need to define this ourselves.
The graph line will be made up of six straight line segments linking the temperature values for
successive days:
To draw each line segment, the horizontal and vertical coordinates of the two end points must be
calculated.
The horizontal coordinates are found by adding 80 pixels for each day
The temperatures are multiplied by the conversion factor of 10 to give pixel values, then
these values are subtracted from the base line position. The base line is taken as 0o C, which
occurs at a vertical coordinate of 350.
140 + 80 * (i-1)
140 + 80 * i
350-10*temp[i] 350-10*temp[i-1]
Chapter 6: Drawing graphics 169
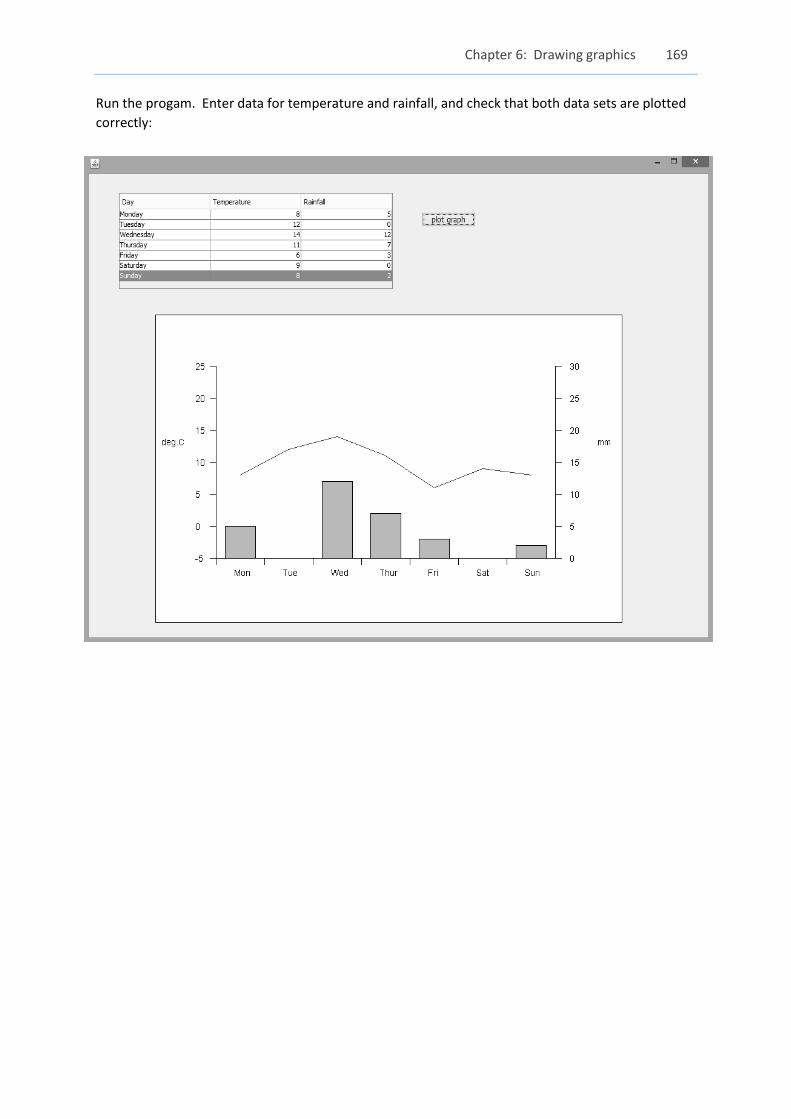
Run the progam. Enter data for temperature and rainfall, and check that both data sets are plotted
correctly:
170 Java Programming for A-level Computer Science
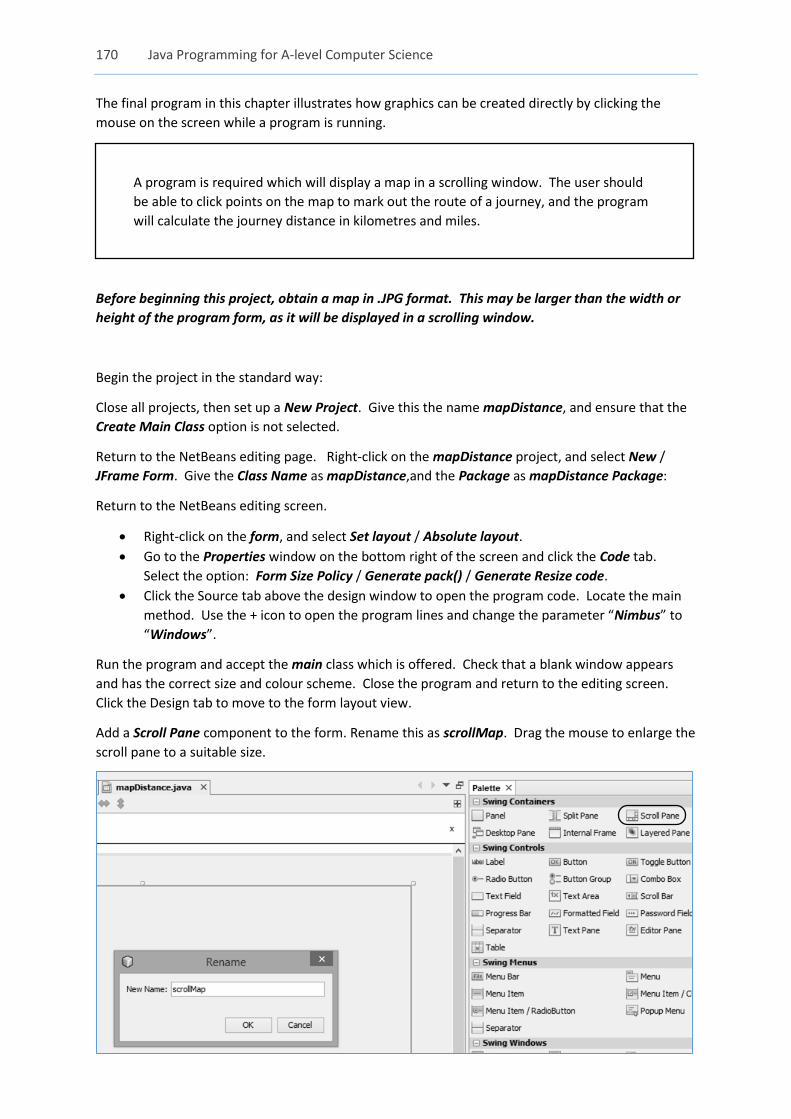
The final program in this chapter illustrates how graphics can be created directly by clicking the
mouse on the screen while a program is running.
A program is required which will display a map in a scrolling window. The user should
be able to click points on the map to mark out the route of a journey, and the program
will calculate the journey distance in kilometres and miles.
Before beginning this project, obtain a map in .JPG format. This may be larger than the width or
height of the program form, as it will be displayed in a scrolling window.
Begin the project in the standard way:
Close all projects, then set up a New Project. Give this the name mapDistance, and ensure that the
Create Main Class option is not selected.
Return to the NetBeans editing page. Right-click on the mapDistance project, and select New /
JFrame Form. Give the Class Name as mapDistance,and the Package as mapDistance Package:
Return to the NetBeans editing screen.
Right-click on the form, and select Set layout / Absolute layout.
Go to the Properties window on the bottom right of the screen and click the Code tab.
Select the option: Form Size Policy / Generate pack() / Generate Resize code.
Click the Source tab above the design window to open the program code. Locate the main
method. Use the + icon to open the program lines and change the parameter “Nimbus” to
“Windows”.
Run the program and accept the main class which is offered. Check that a blank window appears
and has the correct size and colour scheme. Close the program and return to the editing screen.
Click the Design tab to move to the form layout view.
Add a Scroll Pane component to the form. Rename this as scrollMap. Drag the mouse to enlarge the
scroll pane to a suitable size.
Chapter 6: Drawing graphics 171
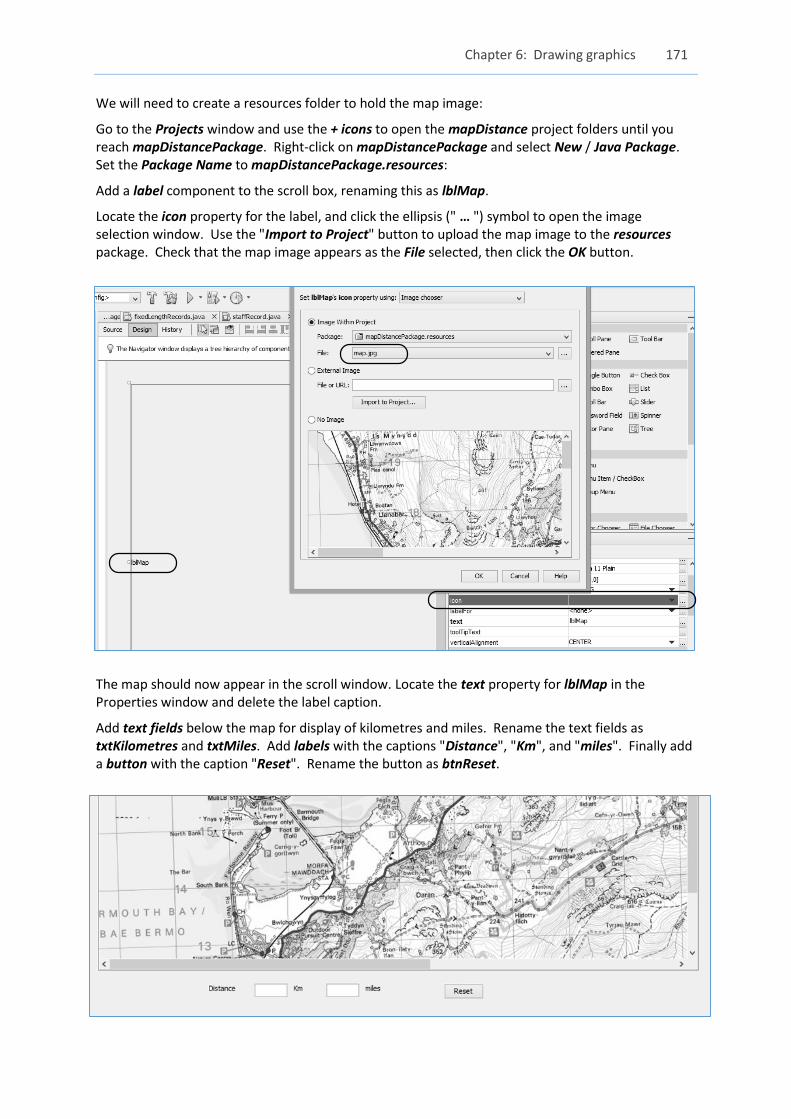
We will need to create a resources folder to hold the map image:
Go to the Projects window and use the + icons to open the mapDistance project folders until you reach mapDistancePackage. Right-click on mapDistancePackage and select New / Java Package. Set the Package Name to mapDistancePackage.resources:
Add a label component to the scroll box, renaming this as lblMap.
Locate the icon property for the label, and click the ellipsis (" … ") symbol to open the image selection window. Use the "Import to Project" button to upload the map image to the resources package. Check that the map image appears as the File selected, then click the OK button.
The map should now appear in the scroll window. Locate the text property for lblMap in the Properties window and delete the label caption.
Add text fields below the map for display of kilometres and miles. Rename the text fields as txtKilometres and txtMiles. Add labels with the captions "Distance", "Km", and "miles". Finally add a button with the caption "Reset". Rename the button as btnReset.
172 Java Programming for A-level Computer Science
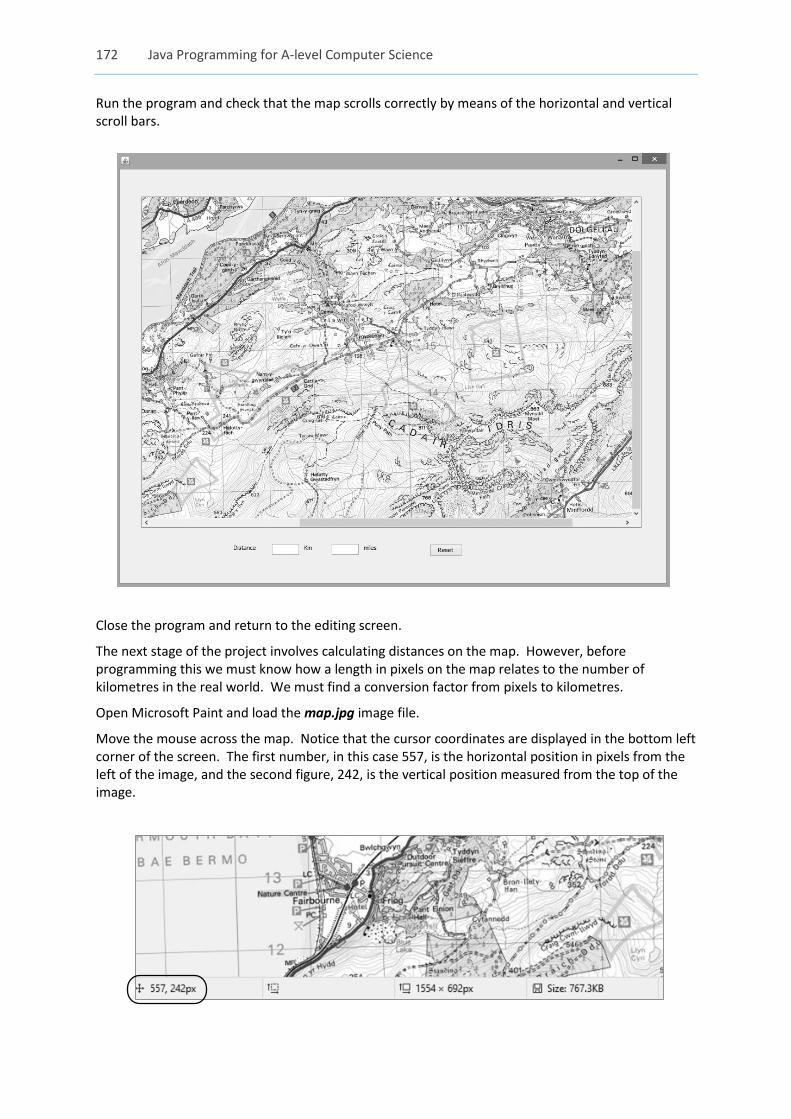
Run the program and check that the map scrolls correctly by means of the horizontal and vertical scroll bars.
Close the program and return to the editing screen.
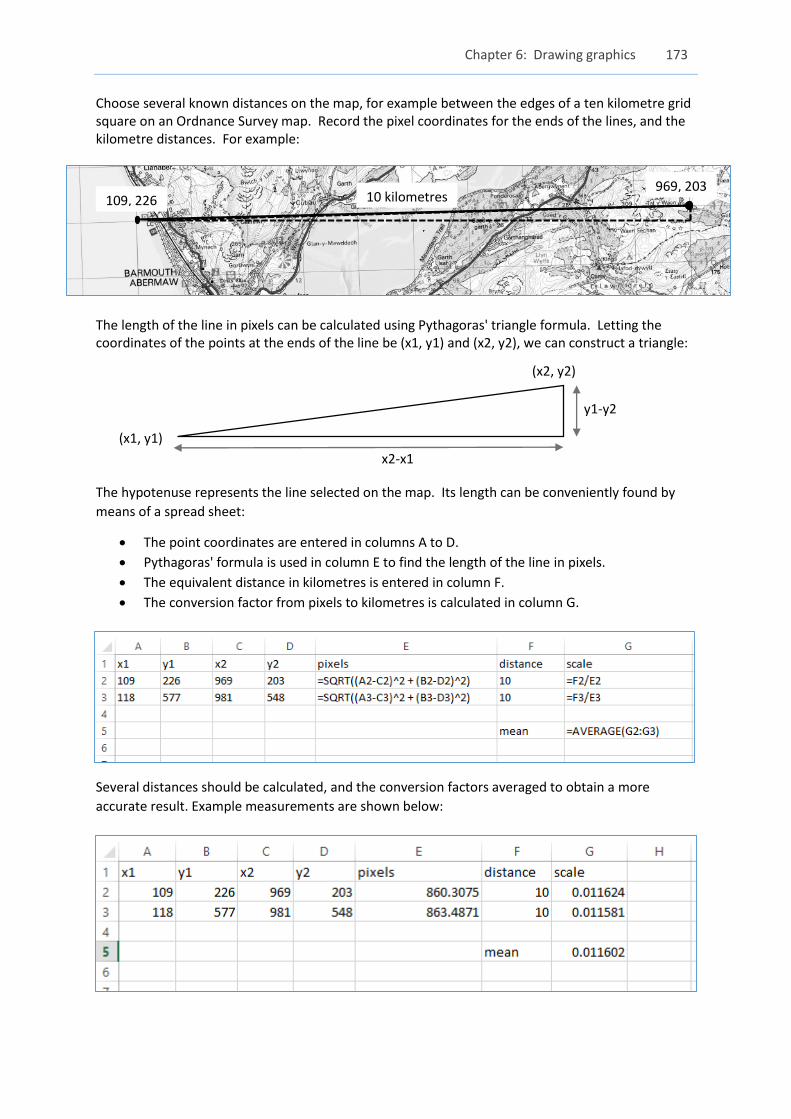
The next stage of the project involves calculating distances on the map. However, before programming this we must know how a length in pixels on the map relates to the number of kilometres in the real world. We must find a conversion factor from pixels to kilometres.
Open Microsoft Paint and load the map.jpg image file.
Move the mouse across the map. Notice that the cursor coordinates are displayed in the bottom left corner of the screen. The first number, in this case 557, is the horizontal position in pixels from the left of the image, and the second figure, 242, is the vertical position measured from the top of the image.
Chapter 6: Drawing graphics 173
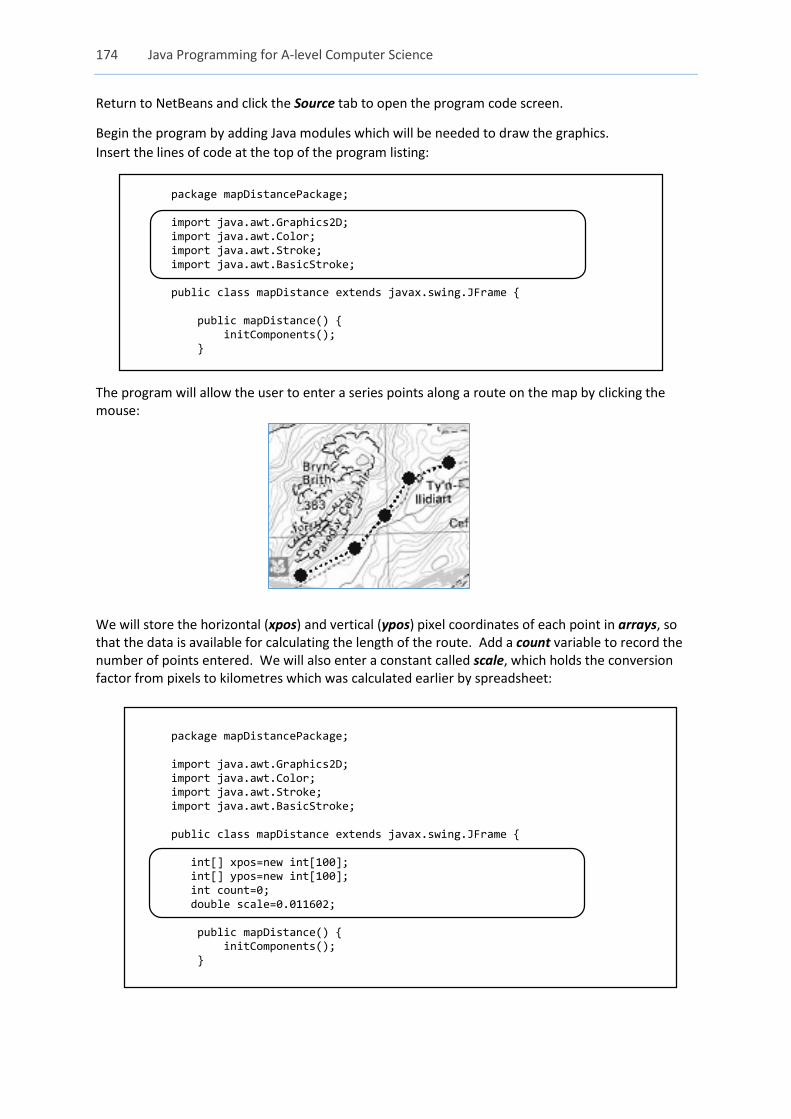
Choose several known distances on the map, for example between the edges of a ten kilometre grid square on an Ordnance Survey map. Record the pixel coordinates for the ends of the lines, and the kilometre distances. For example:
The length of the line in pixels can be calculated using Pythagoras' triangle formula. Letting the coordinates of the points at the ends of the line be (x1, y1) and (x2, y2), we can construct a triangle:
The hypotenuse represents the line selected on the map. Its length can be conveniently found by
means of a spread sheet:
The point coordinates are entered in columns A to D.
Pythagoras' formula is used in column E to find the length of the line in pixels.
The equivalent distance in kilometres is entered in column F.
The conversion factor from pixels to kilometres is calculated in column G.
Several distances should be calculated, and the conversion factors averaged to obtain a more
accurate result. Example measurements are shown below:
10 kilometres 969, 203
109, 226
(x1, y1)
(x2, y2)
y1-y2
x2-x1
174 Java Programming for A-level Computer Science
Return to NetBeans and click the Source tab to open the program code screen.
Begin the program by adding Java modules which will be needed to draw the graphics.
Insert the lines of code at the top of the program listing:
package mapDistancePackage; import java.awt.Graphics2D; import java.awt.Color; import java.awt.Stroke; import java.awt.BasicStroke; public class mapDistance extends javax.swing.JFrame { public mapDistance() { initComponents(); }
The program will allow the user to enter a series points along a route on the map by clicking the mouse:
We will store the horizontal (xpos) and vertical (ypos) pixel coordinates of each point in arrays, so that the data is available for calculating the length of the route. Add a count variable to record the number of points entered. We will also enter a constant called scale, which holds the conversion factor from pixels to kilometres which was calculated earlier by spreadsheet:
package mapDistancePackage; import java.awt.Graphics2D; import java.awt.Color; import java.awt.Stroke; import java.awt.BasicStroke; public class mapDistance extends javax.swing.JFrame { int[] xpos=new int[100]; int[] ypos=new int[100]; int count=0; double scale=0.011602; public mapDistance() { initComponents(); }

Chapter 6: Drawing graphics 175
Click the Design tab to move to the form display. Select the map by clicking the mouse, then open the Events tab in the Properties window. Locate the mouseClicked event, and select lblMapMouseClicked from the drop down list:
A method will be created. This will be activated when the user clicks the mouse on the map.
Add lines for code which will:
Find the x and y pixel coordinates for the map point where the mouse was clicked.
Increment the count of route points by one.
Store the coordinates of the map point in the xpos and ypos arrays, using the value of count to specify the index for the array elements to be used.
private void lblMapMouseClicked(java.awt.event.MouseEvent evt) { int x=evt.getX(); int y=evt.getY(); count++; xpos[count]=x; ypos[count]=y; }
Once the route point has been recorded, the updated route can be redrawn on the map. It is convenient to do this using a separate method drawRoute which we will write ourselves. Add the header: private void drawRoute( )
for the method, and a line at the end of the mouseClicked method which will call this method:
private void lblMapMouseClicked(java.awt.event.MouseEvent evt) { int x=evt.getX(); int y=evt.getY(); count++; xpos[count]=x; ypos[count]=y; drawRoute(); } private void drawRoute() { }

176 Java Programming for A-level Computer Science
We begin the drawRoute method by setting up variables to record the route distance in pixels, then in kilometres and miles.
The graphics system is then started, so that lines and shapes can be drawn on top of the map image.
We will link the points along the route with a dotted line. Java does not have a built in command for dotted lines, but a dot pattern can be set up using the BasicStroke function. Please note that the command:
Stroke dottedLine = new BasicStroke(2f, BasicStroke ... … dots, 2.0f);
should be entered as a single line of code without a line break.
private void drawRoute() { double pixelDistance=0; double kilometres, miles; Graphics2D g = (Graphics2D) scrollMap.getGraphics(); float[] dots = {2f, 2f}; Stroke dottedLine = new BasicStroke(2f, BasicStroke.CAP_BUTT, BasicStroke.JOIN_MITER, 1.0f, dots, 2.0f); g.setStroke(dottedLine); }
We can now produce a loop which will obtain the end positions of each line segment from the arrays (x1, y1, x2, y2), then connect these with a dotted line. Each end point of each line segment will be marked with a blue circle using the fillOval command:
private void drawRoute() { double pixelDistance=0; double kilometres, miles; float[] dots = {2f, 2f}; Stroke dottedLine = new BasicStroke(2f, BasicStroke.CAP_BUTT, BasicStroke.JOIN_MITER, 1.0f, dots, 2.0f);
g.setStroke(dottedLine);
int x1,y1,x2,y2; for (int i=1; i<=count; i++) { x1 = xpos[i]; y1 = ypos[i]; x2 = xpos[i+1]; y2 = ypos[i+1]; if (i<count) { g.setColor(Color.black); g.drawLine(x1, y1, x2, y2); } g.setColor(Color.blue); g.fillOval(x1-5, y1-5, 10,10); }
}
Chapter 6: Drawing graphics 177
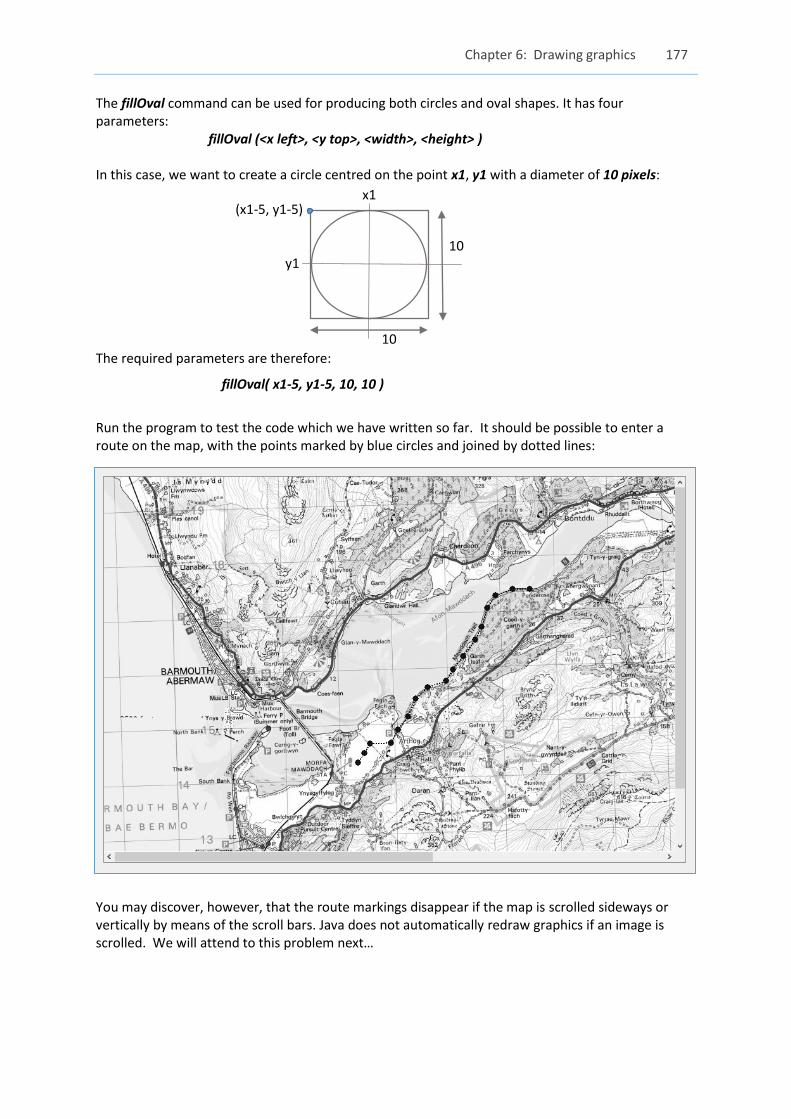
The fillOval command can be used for producing both circles and oval shapes. It has four parameters: fillOval (<x left>, <y top>, <width>, <height> ) In this case, we want to create a circle centred on the point x1, y1 with a diameter of 10 pixels:
The required parameters are therefore:
fillOval( x1-5, y1-5, 10, 10 )
Run the program to test the code which we have written so far. It should be possible to enter a route on the map, with the points marked by blue circles and joined by dotted lines:
You may discover, however, that the route markings disappear if the map is scrolled sideways or vertically by means of the scroll bars. Java does not automatically redraw graphics if an image is scrolled. We will attend to this problem next…
x1
y1
(x1-5, y1-5)
10
10
178 Java Programming for A-level Computer Science
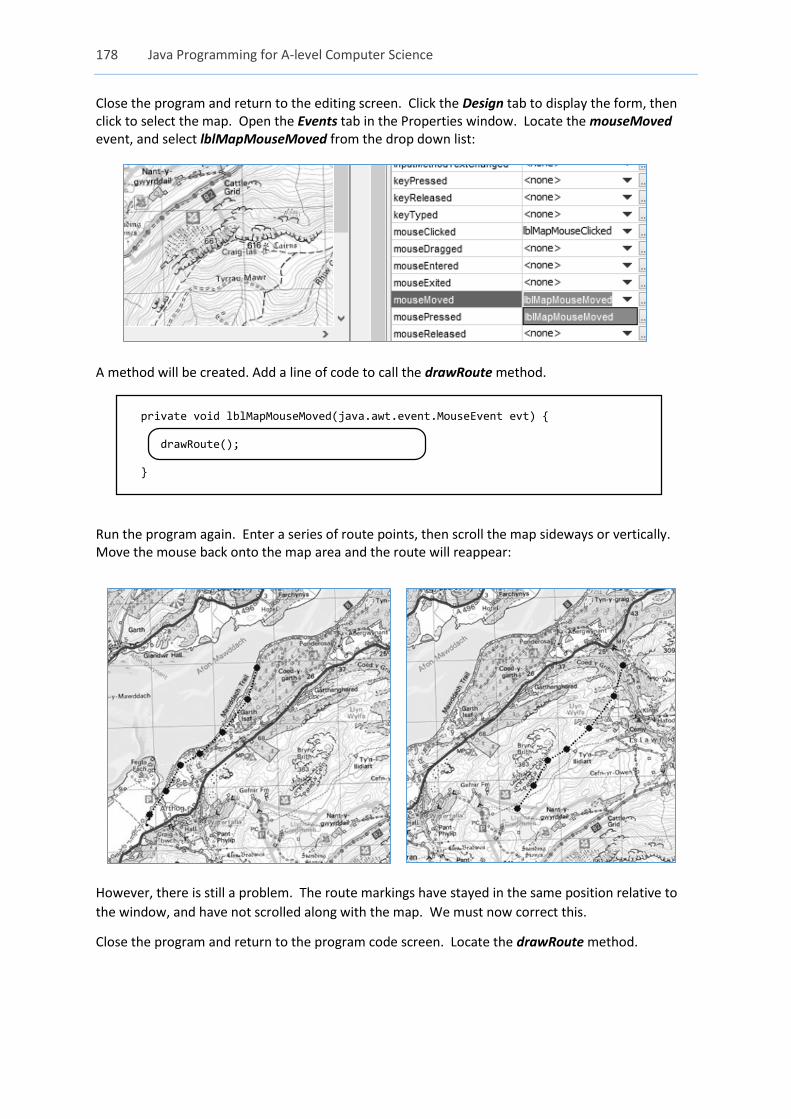
Close the program and return to the editing screen. Click the Design tab to display the form, then click to select the map. Open the Events tab in the Properties window. Locate the mouseMoved event, and select lblMapMouseMoved from the drop down list:
A method will be created. Add a line of code to call the drawRoute method.
private void lblMapMouseMoved(java.awt.event.MouseEvent evt) { drawRoute(); }
Run the program again. Enter a series of route points, then scroll the map sideways or vertically. Move the mouse back onto the map area and the route will reappear:
However, there is still a problem. The route markings have stayed in the same position relative to
the window, and have not scrolled along with the map. We must now correct this.
Close the program and return to the program code screen. Locate the drawRoute method.
Chapter 6: Drawing graphics 179
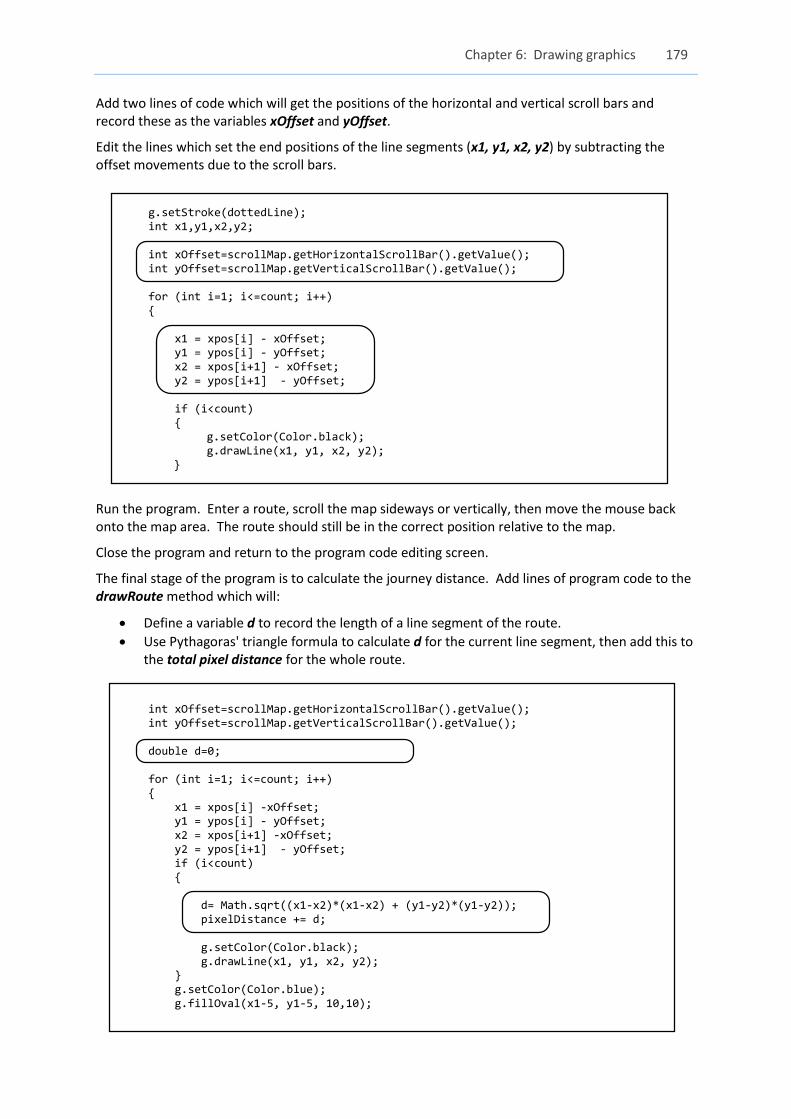
Add two lines of code which will get the positions of the horizontal and vertical scroll bars and record these as the variables xOffset and yOffset.
Edit the lines which set the end positions of the line segments (x1, y1, x2, y2) by subtracting the offset movements due to the scroll bars. g.setStroke(dottedLine); int x1,y1,x2,y2; int xOffset=scrollMap.getHorizontalScrollBar().getValue(); int yOffset=scrollMap.getVerticalScrollBar().getValue(); for (int i=1; i<=count; i++) { x1 = xpos[i] - xOffset; y1 = ypos[i] - yOffset; x2 = xpos[i+1] - xOffset; y2 = ypos[i+1] - yOffset; if (i<count) {
g.setColor(Color.black); g.drawLine(x1, y1, x2, y2); }
Run the program. Enter a route, scroll the map sideways or vertically, then move the mouse back onto the map area. The route should still be in the correct position relative to the map.
Close the program and return to the program code editing screen.
The final stage of the program is to calculate the journey distance. Add lines of program code to the drawRoute method which will:
Define a variable d to record the length of a line segment of the route.
Use Pythagoras' triangle formula to calculate d for the current line segment, then add this to the total pixel distance for the whole route.
int xOffset=scrollMap.getHorizontalScrollBar().getValue(); int yOffset=scrollMap.getVerticalScrollBar().getValue(); double d=0; for (int i=1; i<=count; i++) { x1 = xpos[i] -xOffset; y1 = ypos[i] - yOffset; x2 = xpos[i+1] -xOffset; y2 = ypos[i+1] - yOffset; if (i<count) { d= Math.sqrt((x1-x2)*(x1-x2) + (y1-y2)*(y1-y2)); pixelDistance += d; g.setColor(Color.black); g.drawLine(x1, y1, x2, y2); } g.setColor(Color.blue); g.fillOval(x1-5, y1-5, 10,10);
180 Java Programming for A-level Computer Science
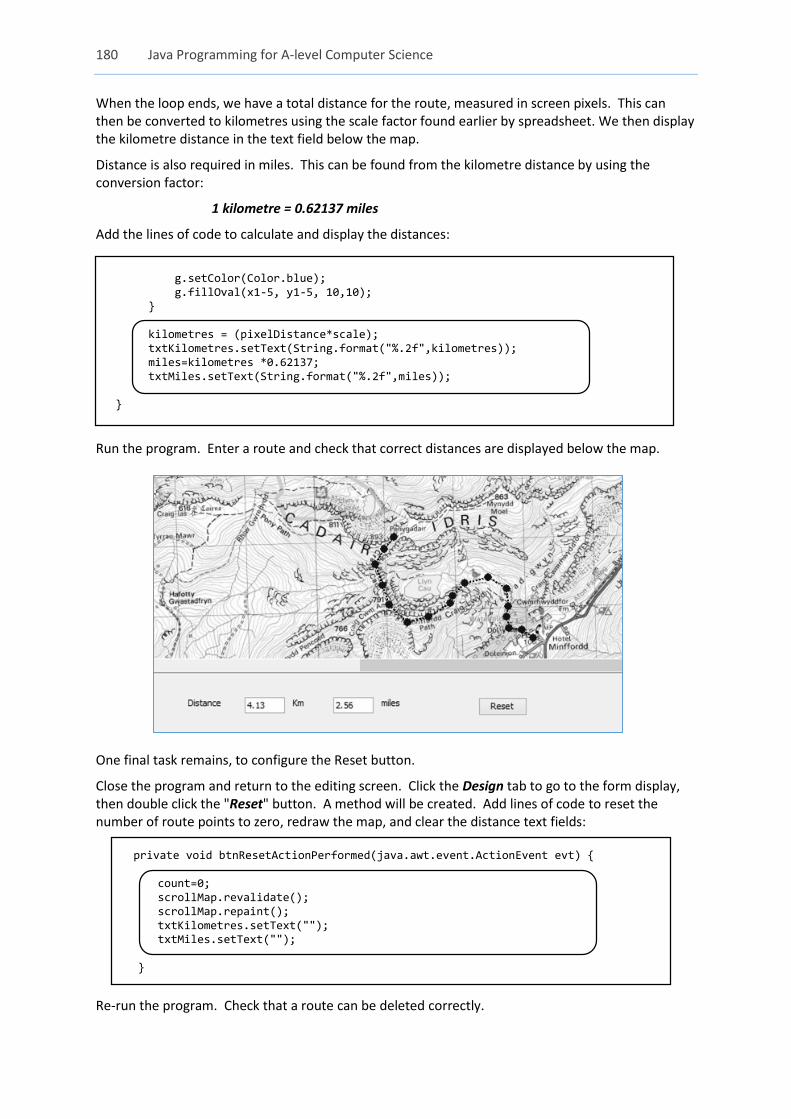
When the loop ends, we have a total distance for the route, measured in screen pixels. This can then be converted to kilometres using the scale factor found earlier by spreadsheet. We then display the kilometre distance in the text field below the map.
Distance is also required in miles. This can be found from the kilometre distance by using the conversion factor:
1 kilometre = 0.62137 miles
Add the lines of code to calculate and display the distances: g.setColor(Color.blue); g.fillOval(x1-5, y1-5, 10,10); } kilometres = (pixelDistance*scale); txtKilometres.setText(String.format("%.2f",kilometres)); miles=kilometres *0.62137; txtMiles.setText(String.format("%.2f",miles)); }
Run the program. Enter a route and check that correct distances are displayed below the map.
One final task remains, to configure the Reset button.
Close the program and return to the editing screen. Click the Design tab to go to the form display, then double click the "Reset" button. A method will be created. Add lines of code to reset the number of route points to zero, redraw the map, and clear the distance text fields:
private void btnResetActionPerformed(java.awt.event.ActionEvent evt) {
count=0; scrollMap.revalidate(); scrollMap.repaint(); txtKilometres.setText(""); txtMiles.setText(""); }
Re-run the program. Check that a route can be deleted correctly.