6 months of strategic progress
TRANSCRIPT

AVON RUBBER P.L.C. UNAUDITED INTERIM RESULTS FOR THE SIX MONTHS ENDED 31 MARCH 2018
Page 1 of 27
6 MONTHS OF STRATEGIC PROGRESS Paul McDonald, Chief Executive Officer
“We have delivered strong financial results, with underlying performance more than offsetting currency headwinds, whilst continuing to build the order book. We have also made further progress on the longer-term growth opportunities for our expanding product portfolio.
The performance reflects the benefits of the strategic actions being implemented to enable the Group to continue to grow sustainably in our core markets. Building on this platform, and with the momentum from our expanding product portfolio, the Board remains confident on delivery of its current year expectations and is excited by the medium-term prospects for the Group.”
31 March 2018
31 March 2017
(Restated)2
% Increase Reported
% Increase Constant Currency
Orders received £88.3m £90.8m (2.7%) 5.0%
Closing order book £40.6m £34.5m 17.7% 29.6%
Revenue £77.7m £78.9m (1.5%) 5.9%
Adjusted1 operating profit £11.6m £10.9m 6.4% 18.9%
Operating profit £9.9m £9.6m 3.1% 18.4%
Net cash £39.1m £12.6m Up £14.4m3
Adjusted1 basic earnings per share4 32.8p 28.6p 14.7% 33.7%
Basic earnings per share4 27.9p 24.7p 13.0% 33.6%
Interim dividend per share 5.34p 4.11p 30.0% 30.0% Operational highlights • Avon Protection growth driven by strong Law Enforcement performance • Positive Military order intake contributing to building the order book for 2019 • milkrite | InterPuls growth momentum in Farm Services and Precision, Controls & Intelligence • Powered Air range NIOSH approval obtained together with first customer orders • MCM100 initial customer orders received for delivery in H2 2018 • UK MOD General Service Respirator 5 year contract signed for deliveries starting in 2019 • Avon Engineered Fabrications, Inc. (“AEF”) non-core divestment for $9.25m Financial highlights at constant currency • Orders received up 5.0% and £10.6m ahead of revenue • Closing order book of £40.6m provides excellent visibility going into the second half of 2018 • Revenue up 5.9% at £77.7m and adjusted1 operating profit up 18.9% at £11.6m • EBITDA margins improved by 20bps to 19.9% • Strong EBITDA cash conversion of 123.9% and the divestment of AEF resulting in net cash of
£39.1m, up £14.4m in the half year • Adjusted1 earnings per share of 32.8p, grew by 33.7% • Interim dividend per share of 5.34p, up 30.0%

Page 2 of 27
Notes: 1 The Directors believe that adjusted measures provide a more useful comparison of business trends and performance. Adjusted results exclude exceptional items, defined benefit pension scheme costs, the amortisation of acquired intangibles and discontinued operations. The term adjusted is not defined under IFRS and may not be comparable with similarly titled measures used by other companies. A reconciliation of reported numbers to adjusted numbers is provided in note 4 to the interim financial statements. 2 2017 has been restated to reflect the continuing operations of the business following the sale of AEF on 30 March 2018 and to correct the charge for share based payments as previously reported in the 2017 Annual Report. The restatement did not have any impact on the prior period comparatives for adjusted and reported operating profit and earnings per share. 3 Movement since 30 September 2017. 4 Earnings per share and adjusted earnings per share are presented on a continuing operations basis.
For further enquiries, please contact:
Avon Rubber p.l.c.
Paul McDonald, Chief Executive Officer 01225 896300
Nick Keveth, Chief Financial Officer
Weber Shandwick Financial
Nick Oborne 020 7067 0700
Tom Jenkins
An analyst meeting will be held at 9.30am this morning at the offices of Weber Shandwick Financial, 2 Waterhouse Square, 140 Holborn, London, EC1N 2AE. The analyst meeting will be webcast live on www.avon-rubber.com
Legal Entity Identifier: 213800JM1AN62REBWA71
The information contained within this announcement is deemed by the Company to constitute inside information as stipulated under the Market Abuse Regulation ("MAR") EU no.596/2014. Upon the publication of this announcement via Regulatory Information Service ("RIS"), this inside information is now considered to be in the public domain.
Note to editors:
Avon Rubber p.l.c. is an innovative technology group specialising in respiratory protection systems and milking point solutions through our two businesses Avon Protection and milkrite | InterPuls. We design, test and manufacture specialist products and services to maximise the performance and capabilities of our customers.
Avon Protection is the recognised global leader in advanced Chemical, Biological, Radiological and Nuclear (CBRN) respiratory protection systems for the world's Military, Law Enforcement and Fire markets.
milkrite | InterPuls is a global leader providing complete milking point solutions to customers across the world with the aim of improving every farm it touches.
For further information please visit the Group’s website: www.avon-rubber.com

Page 3 of 27
Interim Management Report
Overview During the first half of 2018 we have continued to make excellent progress delivering our strategy to generate shareholder value through maximising organic sales growth from our current portfolio, supported by selective product development, and through value enhancing acquisitions.
In Avon Protection, we have seen significant market share gains within Law Enforcement as well as higher filter and spare sales from the increased customer base. Military order intake for existing platforms for both the DoD and Rest of World customers has been positive and enables us to build visibility into 2019. In milkrite | InterPuls, we have seen good growth in the Farm Services and Precision, Control & Intelligence (“PCI”) products, despite weaker market conditions in North America impacting the performance of Interface. This reflects both the benefits of our differentiated Farm Services ownership model as well as the added value our PCI products bring to customers in terms of driving farm efficiency. As a result the Group delivered strong constant currency revenue growth in the first six months of the year and positive order intake across the business has resulted in a closing order book at the half year of £40.6m (Sept 2017: £30.0m).
Our focus on new selective product development has continued with £4.4m of investment in research and development projects during the first six months of the year. We received NIOSH safety approval in North America for our Powered Air range and are in full production readiness for the MCM100 underwater rebreather, with first deliveries during the second half of the year. We will also launch our Magnum Self Contained Breathing Apparatus (“SCBA”) and the heavy duty PCI products in North America during the second half of the year.
The divestment of AEF, the US based manufacturer of hovercraft skirts and bulk liquid storage tanks, supports our focus on growing the core business in our chosen market segments. We continue to explore acquisition opportunities, where we see the potential to deliver significant strategic and financial value. Our strengthened balance sheet will enable us to execute on these acquisition opportunities where our commercial and financial criteria are met.
Group Results
The Group has delivered a strong financial performance in the first half of the year with revenue and adjusted operating profit increasing at constant currency by 5.9% and 18.9% respectively. Given our US businesses constitute over 70% of the Group, the strengthening pound during the first half of the year has resulted in reported revenue decreasing by 1.5% to £77.7m and a smaller increase in reported adjusted operating profit of 6.4% to £11.6m (2017: £10.9m) at actual currency.
After a tax charge of £1.6m (2017: £2.0m), an adjusted effective rate of 14% (2017: 19%), the Group recorded an adjusted profit for the period after tax of £10.0m (2017: £8.7m).
The reduced tax rate of 14% (2017: 19%) has resulted in adjusted basic earnings per share increasing by 33.7% at constant currency to 32.8p (2017: 28.6p). Basic earnings per share from continuing operations were 27.9p (2017: 24.7p).
Operational cash generation has continued to be strong with EBITDA cash conversion of 123.9%. The operational cash performance, together with the divestment of AEF for $9.25m, resulted in a £14.4m increase in net cash during the first half of the year and a closing net cash balance of £39.1m. This strong cash position provides funding to support our organic growth strategy and value enhancing acquisitions.
Against this strong backdrop, the Board has increased the interim dividend by 30% to 5.34p, in line with our policy, and reflecting confidence in the full year performance.

Page 4 of 27
Segmental Information
1 March 2018
£m
31 March 2017
(restated) £m
Growth %
Growth at constant currency
% Orders received
Avon Protection 64.2 65.8 (2.4%) 6.6% milkrite | InterPuls 24.1 25.0 (3.6%) 1.0% Total 88.3 90.8 (2.7%) 5.0% Closing order book
Avon Protection 37.5 31.8 17.9% 30.8% milkrite | InterPuls 3.1 2.7 14.8% 16.1% Total 40.6 34.5 17.7% 29.6% Revenue
Avon Protection 53.1 53.7 (1.1%) 8.4% milkrite | InterPuls 24.6 25.2 (2.4%) 0.8% Total 77.7 78.9 (1.5%) 5.9% Operating profit
Avon Protection 8.7 7.6 14.4% 21.0% milkrite | InterPuls 2.6 3.3 (21.2%) 1.2% Unallocated corporate costs (1.4) (1.3) (7.7%) 0.3% Total 9.9 9.6 3.1% 18.4% Adjusted operating profit
Avon Protection 9.2 8.0 15.0% 25.1% milkrite | InterPuls 3.6 4.0 (10.0%) 2.3% Unallocated corporate costs (1.2) (1.1) (9.1%) (15.8%) Total 11.6 10.9 6.4% 18.9% Adjusted EBITDA
Avon Protection 11.7 11.6 0.8% 7.1% milkrite | InterPuls 5.0 5.5 (9.1%) 0.2% Unallocated corporate costs (1.2) (1.1) (9.1%) 13.2% Total 15.5 16.0 (3.1%) 6.6% Adjusted EBITDA margin
Avon Protection 22.0% 21.6% 0.4% - milkrite | InterPuls 20.3% 21.8% (1.5%) (0.5%) Total 19.9% 20.3% (0.4%) 0.2%

Page 5 of 27
Avon Protection
Orders received totalling £64.2m (2017: £65.8m) reflect a constant currency growth of 6.6%, offset by the impact of the strengthening pound. Revenue of £53.1m (2017: £53.7m) improved by 8.4% on a constant currency basis with exceptional growth in Law Enforcement of 42%, more than offsetting 6% declines in both Military and Fire.
Adjusted operating profit increased by 15.0% to £9.2m (2017: £8.0m) with adjusted EBITDA of £11.7m (2017: £11.6m). On a constant currency basis, adjusted operating profit and adjusted EBITDA grew by 25.1% and 7.1% respectively and our EBITDA margins have remained stable.
Military
Military revenues of £27.3m (2017: £32.9m) were 5.5% lower versus last half year, on a constant currency basis. DoD revenues were flat, with higher spares sales offsetting the planned lower shipment of M50 mask systems of 79,000 (2017: 93,000). The Rest of the World order book has grown strongly in the period driven by the initial MCM100 underwater rebreather orders. The lower first half Rest of World revenue arises due to delivery timings being weighted to the second half.
We received orders for 100,000 M50 mask systems in the first six months, resulting in an order book of 70,000 systems as we entered the second half of the year and, since 31 March 2018, we have received a further order for 24,000 M50 mask systems. This has provided us with visibility for the Military sales in the current year as well as contributing to building the order book for 2019. We continue to pursue a number of identified opportunities with the DoD and Rest of World Military customers and anticipate further orders, both for existing products as well from the new product portfolio.
Law Enforcement
Law Enforcement revenue grew 42% on a constant currency basis to £18.6m (2017: £12.5m). This was driven by strong performances in hoods and mask systems in Europe, Middle East and Asia as we continue to make progress in converting police forces to our products. In North America, we also benefited from increased sales of filters and spares to our expanding customer base. Initial sales of our Powered Air range also contributed to the growth in the period and we see the new product range as an exciting driver for growth moving forward.
Fire
Fire revenue reduced to £7.2m (2017: £8.3m), a reduction of 6.3% on a constant currency basis, as the sector experienced tougher market conditions in North America than 2017. We expect the launch of the Magnum SCBA, later in the year, to upgrade the existing product offering to our customers and support the medium term outlook for revenue growth.
milkrite | InterPuls
Revenue of £24.6m (2017: £25.2m) increased by 0.8% on a constant currency basis. Continued growth in Precison, Control & Intelligence and Farm Services was offset by the performance of Interface in North America due to tougher markets conditions as a result of increased feed costs squeezing farmer margins.
Adjusted operating profit of £3.6m (2017: £4.0m) grew 2.3% on a constant currency basis. Adjusted EBITDA of £5.0m (2017: £5.5m) resulted in an adjusted EBITDA margin of 20.3%. With the softer market conditions in North America, we will continue to focus on managing the operating costs of the business in the second half of the year.

Page 6 of 27
Interface
Interface revenue of £17.2m (2017: £18.3m) was impacted by weaker market conditions in North America following recent feed cost increases which is expected to continue in the second half. As a result of the performance in North America, Interface revenues declined by 1.1% on a constant currency basis. Market conditions in Europe, Middle East and Asia Pacific remain positive reflected in constant currency revenue growth of 8.6% across these regions.
Precision, Control and Intelligence
Our PCI range and sales have continued to perform well across our key markets. Revenue of £4.8m (2017: £4.8m) grew 5.3% at a constant currency rate as dairy farmers continue to invest in our PCI products to drive farm efficiency.
Farm Services
Farm Services has continued to show exceptional growth with revenue of £2.6m (2017: £2.1m), up 28.7% at constant currency, reflecting the ongoing success of Cluster Exchange which saw a 23% growth in cluster points in the period. The extension of Farm Services to include Pulsator Exchange and Tag Exchange continues to progress well in line with expectations.
Research & Development expenditure
We continue to invest for the future and our total investment in research and development (capitalised and expensed) amounted to £4.4m (2017: £3.9m) as shown below. Total research and development as a percentage of revenue was 5.7% (2017: 4.8%).
Half year to 31 Mar
2018
Half year to 31 Mar 2017
Year to 30 Sep 2017
Total research and development expenditure £4.4m £3.9m £8.4m Less customer funded (£1.4m) (£2.0m) (£4.6m) Group expenditure £3.0m £1.9m £3.8m Capitalised (£2.6m) (£0.9m) (£2.7m) Income statement impact £0.4m £1.0m £1.1m Amortisation £1.3m £2.0m £3.5m Impairment - - £2.6m Total income statement impact £1.7m £3.0m £7.2m Revenue £77.7m £78.9m £159.2m R&D spend as % of revenue 5.7% 4.8% 5.3%
In Avon Protection the most significant investments have been in the further development of the Magnum Self Contained Breathing Apparatus and MCM100 underwater rebreather product ranges. In milkrite | InterPuls, investment has been focussed on expanding our Precision, Control and Intelligence (PCI) heavy duty product range.

Page 7 of 27
Profit for the Period Half year to
31 March 2018
£m
Half year to 31 March 2017
£m (restated)
Adjusted operating profit 11.6 10.9 Adjustments (1.7) (1.3) Operating profit 9.9 9.6 Net finance costs (0.5) (0.7) Profit before taxation 9.4 8.9 Taxation (0.9) (1.4) Profit from continuing operations 8.5 7.5 Profit/(loss) from discontinued operations 1.6 (0.3) Profit for the period 10.1 7.2
Adjustments
Adjustments of £1.7m (2017: £1.3m) have been excluded from adjusted operating profit and include amortisation of acquired intangible assets of £1.5m (2017: £1.4m) and pension administration costs of £0.2m (2017: £0.2m). Adjustments in 2017 included an exceptional credit of £0.3m for a post-acquisition working capital adjustment relating to the acquisition of InterPuls.
Taxation
The tax charge of £0.9m is comprised of an adjusted tax charge of £1.6m, at an adjusted effective rate of 14%, offset by the tax effects of the amortisation of acquired intangibles and the defined benefit pension scheme.
Profit from Discontinued Operations
The profit from discontinued operations of £1.6m (2017: (£0.3m)) is comprised of the profit after tax of AEF up to the date of disposal on 30 March 2018 of £0.5m (2017: (0.3m)) and the gain on disposal after tax of £1.1m.
Net Cash and Cash Flow
Underlying cash generated from continuing operations was £19.2m with operating cash conversion from adjusted EBITDA continuing to be strong at 123.9% (2017: 105.0%).
Total capital expenditure was £4.0m (2017: £2.7m) including £2.6m of capitalised development costs. Dividends and the purchase of own shares was £3.7m (2017: £2.9m) reflecting the 30% increase in the 2017 final dividend.
Net cash at the half year was £39.1m, including the £6.6m proceeds from the sale of AEF, £14.4m higher than the 2017 year end.
Dividends
The Board has declared an interim dividend of 5.34p per ordinary share, an increase of 30% on the 2017 interim dividend. This will be paid on 7 September 2018 to shareholders on the register on 10 August 2018.

Page 8 of 27
Outlook
We have delivered strong financial results, with underlying performance more than offsetting currency headwinds, whilst continuing to build the order book. We have also made further progress on the longer-term growth opportunities for our expanding product portfolio.
The performance reflects the benefits of the strategic actions being implemented to enable the Group to continue to grow sustainably in our core markets. Building on this platform, and with the momentum from our expanding product portfolio, the Board remains confident on delivery of its current year expectations and is excited by the medium-term prospects for the Group.
Paul McDonald Chief Executive Officer 2 May 2018
Nick Keveth Chief Financial Officer 2 May 2018
Statement of Directors’ Responsibilities
The Directors confirm that this condensed consolidated interim financial information has been prepared in accordance with International Accounting Standard 34, ‘Interim Financial Reporting’ as

Page 9 of 27
adopted by the European Union, and that the interim management report herein includes a fair review of the information required by DTR 4.2.7 and DTR 4.2.8, namely:
• an indication of important events that have occurred during the first six months and their impact on the condensed consolidated interim financial information, and a description of the principal risks and uncertainties for the remaining six months of the financial year; and
• material related party transactions in the first six months and any material changes in the related party transactions described in the last annual report.
Miles Ingrey-Counter Company Secretary 2 May 2018
Forward-looking statements
Certain statements in this half year report are forward‐looking. Although the Group believes that the expectations reflected in these forward‐looking statements are reasonable, we can give no assurance that these expectations will prove to have been correct. Because these statements involve risks and uncertainties, actual results may differ materially from those expressed or implied by these forward‐looking statements.
We undertake no obligation to update any forward‐looking statements whether as a result of new information, future events or otherwise.
Company website
The interim statement is available on the Company’s website at www.avon-rubber.com. The maintenance and integrity of the website is the responsibility of the Directors. Legislation in the United Kingdom governing the preparation and dissemination of financial statements may differ from legislation in other jurisdictions.
Change of auditor
As reported in our 2017 Annual Report, PricewaterhouseCoopers LLP (‘PwC’) have been the Company’s external auditor for well over 20 years and the Board requested the Audit Committee run a tender process in early 2018. Following this process the Board have selected KPMG LLP to be the Company’s external auditor for the year ending 30 September 2019. PwC will continue to act as auditors for the current financial year. At the 2019 AGM shareholders will be invited to vote on the appointment of KPMG LLP.

Page 10 of 27
Consolidated Statement of Comprehensive Income
*See note 5 for further details of adjustments
Half year to 31 March 2018 Half year to 31 March 2017 Year to 30 Sep 2017 Adjusted Adjustments* Total Adjusted Adjustments* Total Adjusted Adjustments* Total (restated) (restated) (restated) (restated) Note £m £m £m £m £m £m £m £m £m Continuing operations Revenue 3 77.7 - 77.7 78.9 - 78.9 159.2 - 159.2 Cost of sales (48.9) - (48.9) (48.7) - (48.7) (97.6) - (97.6) Gross profit 28.8 - 28.8 30.2 - 30.2 61.6 - 61.6 Selling and distribution costs (9.7) - (9.7) (10.5) - (10.5) (19.9) - (19.9) General and administrative expenses (7.5) (1.7) (9.2) (8.8) (1.3) (10.1) (15.6) (6.0) (21.6) Operating profit 3 11.6 (1.7) 9.9 10.9 (1.3) 9.6 26.1 (6.0) 20.1 Operating profit is analysed as: Before depreciation and amortisation 15.5 (0.2) 15.3 16.0 0.1 16.1 35.7 (0.1) 35.6 Depreciation and amortisation (3.9) (1.5) (5.4) (5.1) (1.4) (6.5) (9.6) (5.9) (15.5) Operating profit 11.6 (1.7) 9.9 10.9 (1.3) 9.6 26.1 (6.0) 20.1 Interest income 7 0.1 - 0.1 - - - 0.1 - 0.1 Finance costs 7 (0.1) - (0.1) (0.1) - (0.1) (0.3) - (0.3) Other finance expense 7 - (0.5) (0.5) (0.1) (0.5) (0.6) - (1.0) (1.0) Profit before taxation 11.6 (2.2) 9.4 10.7 (1.8) 8.9 25.9 (7.0) 18.9 Taxation 8 (1.6) 0.7 (0.9) (2.0) 0.6 (1.4) (0.4) 3.3 2.9 Profit for the period from
continuing operations 10.0 (1.5) 8.5 8.7 (1.2) 7.5 25.5 (3.7) 21.8 Profit/(loss) from discontinued operations 6 - 1.6 1.6 - (0.3) (0.3) - (0.3) (0.3) Profit for the period 10.0 0.1 10.1 8.7 (1.5) 7.2 25.5 (4.0) 21.5

Page 11 of 27
Consolidated Statement of Comprehensive Income (continued) Half year to 31 March 2018 Half year to 31 March 2017 Year to 30 Sep 2017
Adjusted Adjustments* Total Adjusted Adjustments* Total Adjusted Adjustments* Total (restated) (restated) (restated) (restated) Note £m £m £m £m £m £m £m £m £m Other comprehensive income Actuarial gain/(loss) recognised in
retirement benefit scheme (**) - 1.5 1.5 - (0.4) (0.4) - (3.8) (3.8) Deferred tax relating to retirement
benefit scheme (**) - (0.3) (0.3) - 0.1 0.1 - 0.6 0.6 Net exchange differences offset in
reserves (***) (2.3) - (2.3) 1.1 - 1.1 (2.3) - (2.3) Cash flow hedges (***) 0.2 - 0.2 0.5 - 0.5 1.1 - 1.1 Tax relating to exchange
differences offset in reserves (***) - - - - - - 0.2 - 0.2 Other comprehensive income for
the period, net of taxation (2.1) 1.2 (0.9) 1.6 (0.3) 1.3 (1.0) (3.2) (4.2) Profit for the period 10.0 0.1 10.1 8.7 (1.5) 7.2 25.5 (4.0) 21.5 Total comprehensive income for
the period 7.9 1.3 9.2 10.3 (1.8) 8.5 24.5 (7.2) 17.3
Earnings per share Basic 10 32.8p 0.3p 33.1p 28.6p (4.9)p 23.7p 83.8p (13.2)p 70.6p Diluted 10 32.6p 0.3p 32.9p 28.2p (4.9)p 23.3p 83.3p (13.1)p 70.2p Earnings per share from continuing operations Basic 10 32.8p (4.9)p 27.9p 28.6p (3.9)p 24.7p 83.8p (12.2)p 71.6p Diluted 10 32.6p (4.9)p 27.7p 28.2p (3.9)p 24.3p 83.3p (12.1)p 71.2p
* See note 5 for further details of adjustments ** Items that are not subsequently reclassified to the income statement ***Items that may be subsequently reclassified to the income statement The Statement of Comprehensive Income for half year and full year 2017 has been restated to present AEF as a discontinued operation, and half year 2017 has also been restated to correct the charge for share based payments.

Page 12 of 27
Consolidated Balance Sheet
As at 31 Mar
2018
As at 31 Mar
2017
As at 30 Sep
2017 Note £m £m £m Assets Non-current assets Goodwill and acquired intangibles 21.2 23.7 23.4 Development expenditure and computer software 17.9 21.7 17.0 Property, plant and equipment 21.9 29.1 26.3 Deferred tax assets 8.1 7.8 8.2 69.1 82.3 74.9 Current assets Inventories 21.8 21.8 21.8 Trade and other receivables 18.8 19.8 23.8 Derivative financial instruments 0.4 - 0.2 Cash and cash equivalents 14 40.4 14.8 26.5 81.4 56.4 72.3 Liabilities Current liabilities Borrowings 14 1.3 2.2 1.8 Trade and other payables 28.6 26.1 30.1 Derivative financial instruments - 0.3 - Provisions for liabilities and charges 11 0.3 0.7 0.3 Current tax liabilities 7.1 9.9 6.8 37.3 39.2 39.0 Net current assets 44.1 17.2 33.3 Non-current liabilities Deferred tax liabilities 5.8 9.2 6.8 Retirement benefit obligations 42.5 40.7 44.1 Provisions for liabilities and charges 11 3.0 1.6 1.7 51.3 51.5 52.6 Net assets 61.9 48.0 55.6 Shareholders’ equity Ordinary shares 12 31.0 31.0 31.0 Share premium account 12 34.7 34.7 34.7 Capital redemption reserve 0.5 0.5 0.5 Translation reserve 4.2 9.7 6.5 Accumulated losses (8.5) (27.9) (17.1) Total equity 61.9 48.0 55.6

Page 13 of 27
Consolidated Cash Flow Statement Half year to
31 Mar 2018
Half year to 31 Mar
2017 (restated)
Year to 30 Sep
2017 (restated)
Note £m £m £m
Cash flows from operating activities Cash flows from continuing operating activities
before the impact of exceptional items 13 19.2 16.8 35.0
Cash impact of exceptional items - 0.3 0.3
Cash flows from continuing operations 19.2 17.1 35.3 Cash flows from discontinued operations (0.2) 0.2 0.3
Cash generated from operations 13 19.0 17.3 35.6
Interest income received 0.1 - 0.1
Finance costs paid (0.1) (0.1) (0.2)
Retirement benefit deficit recovery contributions (0.8) (0.4) (1.0)
Tax paid (2.0) (0.7) (2.0)
Net cash flows from operating activities 16.2 16.1 32.5 Cash flows from/(used in) investing activities Proceeds from disposal of discontinued
operations 6.5 - - Purchase of property, plant and equipment (1.4) (1.7) (2.6) Capitalised development costs and purchased
software (2.6) (1.0) (2.9) Net cash flows from/(used in) investing
activities 2.5 (2.7) (5.5) Cash flows used in financing activities Net movement in borrowings (0.5) (0.3) (0.8) Dividends paid to shareholders (2.5) (1.9) (3.2) Payments to acquire own shares (1.2) (1.0) (1.0) Net cash flows used in financing activities (4.2) (3.2) (5.0) Net increase in cash and cash equivalents 14.5 10.2 22.0 Cash and cash equivalents at beginning of the
period 26.5
4.5 4.5 Effects of exchange rate changes (0.6) 0.1 - Cash and cash equivalents at end of the
period 14 40.4 14.8 26.5

Page 14 of 27
Consolidated Statement of Changes in Equity
Share capital
Share premium
Other reserves*
Accumulated losses
(restated)
Total equity
(restated) £m £m £m £m £m At 30 September 2016 31.0 34.7 9.1 (32.8) 42.0 Profit for the period - - 7.2 7.2 Net exchange differences offset in reserves - - 1.1 - 1.1 Cash flow hedges - - - 0.5 0.5 Actuarial loss recognised on retirement benefit scheme - - - (0.4) (0.4) Deferred tax relating to retirement benefit scheme - - - 0.1 0.1 Total comprehensive income for the period - - 1.1 7.4 8.5 Dividends paid - - - (1.9) (1.9) Movement in shares held by the employee benefit trust - - - (1.0) (1.0) Movement in respect of employee share schemes - - - 0.4 0.4 At 31 March 2017 31.0 34.7 10.2 (27.9) 48.0 Profit for the period - - 14.3 14.3 Net exchange differences offset in reserves - - (3.4) - (3.4) Tax relating to exchange differences offset in reserves - - 0.2 - 0.2 Cash flow hedges - - - 0.6 0.6 Actuarial loss recognised on retirement benefit scheme - - - (3.4) (3.4) Deferred tax relating to retirement benefit scheme - - - 0.5 0.5 Total comprehensive income for the period - - (3.2) 12.0 8.8 Dividends paid - - - (1.3) (1.3) Movement in respect of employee share schemes - - - 0.5 0.5 Deferred tax relating to employee share schemes - - - (0.4) (0.4) At 30 September 2017 31.0 34.7 7.0 (17.1) 55.6 Profit for the period - - - 10.1 10.1 Net exchange differences offset in reserves - - (2.3) - (2.3) Cash flow hedges - - - 0.2 0.2 Actuarial gain recognised on retirement benefit scheme - - - 1.5 1.5 Deferred tax relating to retirement benefit scheme - - - (0.3) (0.3) Total comprehensive income for the period - - (2.3) 11.5 9.2 Dividends paid - - - (2.5) (2.5) Movement in shares held by the employee benefit trust - - - (1.0) (1.0) Movement in respect of employee share schemes - - - 0.6 0.6 At 31 March 2018 31.0 34.7 4.7 (8.5) 61.9
*Other reserves consist of the capital redemption reserve of £0.5m (31 March 2017: £0.5m, 30 September 2017: £0.5m) and the translation reserve of £4.2m (31 March 2017: £9.7m, 30 September 2017: £6.5m).

Page 15 of 27
Notes to the Interim Financial Statements 1. General information The company is a limited liability company incorporated in England and domiciled in the UK. The address of its registered office is Hampton Park West, Semington Road, Melksham, Wiltshire, SN12 6NB. The company has its primary listing on the London Stock Exchange. This unaudited condensed consolidated interim financial information was approved for issue on 2 May 2018. These interim financial results do not comprise statutory accounts within the meaning of Section 434 of the Companies Act 2006. Statutory accounts for the year ended 30 September 2017 were approved by the Board of Directors on 15 November 2017 and delivered to the Registrar of Companies. The report of the auditors on those accounts was unqualified, did not contain an emphasis of matter paragraph and did not contain any statement under Section 498 of the Companies Act 2006. 2. Basis of preparation This condensed consolidated interim financial information for the half year ended 31 March 2018 has been prepared in accordance with the Disclosure and Transparency Rules of the Financial Conduct Authority and with IAS 34, ‘Interim financial reporting’ as adopted by the European Union. These interim financial results should be read in conjunction with the annual financial statements for the year ended 30 September 2017, which have been prepared in accordance with International Financial Reporting Standards as adopted by the European Union. Having considered the Group’s funding position, budgets for 2018 and three year plan, the Directors have formed a judgement that there is a reasonable expectation that the Group has adequate resources to continue in operational existence for the foreseeable future. For this reason the Directors continue to adopt the going concern basis in preparing the condensed consolidated interim financial information. The financial information presented in this Interim Report has been prepared in accordance with the accounting policies expected to be used in preparing the 2018 Annual Report and Accounts which do not differ significantly from those used in the preparation of the 2017 Annual Report and Accounts.

Page 16 of 27
3. Segment information The Group has two clearly defined business segments, Protection and Dairy. Half year to 31 March 2018
Protection Dairy Unallocated Group £m £m £m £m Revenue 53.1 24.6 - 77.7
Segment result before depreciation, amortisation, exceptional items and defined benefit pension scheme costs 11.7 5.0 (1.2) 15.5 Depreciation of property, plant and equipment (1.4) (1.2) - (2.6) Amortisation of development costs and software (1.1) (0.2) - (1.3) Segment result before amortisation of acquired intangibles, exceptional items and defined benefit pension scheme costs 9.2 3.6 (1.2) 11.6 Amortisation of acquired intangibles (0.5) (1.0) - (1.5) Exceptional items - - - - Defined benefit pension scheme costs - - (0.2) (0.2) Segment result 8.7 2.6 (1.4) 9.9 Interest income 0.1 Finance costs (0.1) Other finance expense (0.5) Profit before taxation 9.4 Taxation (0.9) Profit for the period from continuing operations 8.5

Page 17 of 27
Half year to 31 March 2017 Protection
(restated) Dairy
Unallocated
Group
(restated) £m £m £m £m Revenue 53.7 25.2 - 78.9 Segment result before depreciation, amortisation and defined benefit pension scheme credit 11.6 5.5 (1.1) 16.0 Depreciation of property, plant and equipment (1.8) (1.1) - (2.9) Amortisation of development costs and software (1.8) (0.4) - (2.2) Segment result before amortisation of acquired intangibles and defined benefit pension scheme credit 8.0 4.0 (1.1) 10.9 Amortisation of acquired intangibles (0.4) (1.0) - (1.4) Exceptional items - 0.3 - 0.3 Defined benefit pension scheme costs - - (0.2) (0.2) Segment result 7.6 3.3 (1.3) 9.6 Finance costs (0.1) Other finance expense (0.6) Profit before taxation 8.9 Taxation (1.4) Profit for the period from continuing operations 7.5

Page 18 of 27
Year ended 30 September 2017
Protection (restated)
Dairy
Unallocated
Group (restated)
£m £m £m £m Revenue 109.8 49.4 - 159.2
Segment result before depreciation, amortisation, exceptional items, acquisition costs and defined benefit pension scheme costs 26.8 10.9 (2.0) 35.7 Depreciation of property, plant and equipment (3.4) (2.3) - (5.7) Amortisation of development costs and software (3.3) (0.6) - (3.9) Segment result before amortisation of acquired intangibles, exceptional items, acquisition costs and defined benefit pension scheme costs 20.1 8.0 (2.0) 26.1 Amortisation of acquired intangibles (1.0) (2.0) - (3.0) Exceptional items and acquisition costs (2.9) 0.3 - (2.6) Defined benefit pension scheme costs - - (0.4) (0.4) Segment result 16.2 6.3 (2.4) 20.1 Interest income 0.1 Finance costs (0.3) Other finance expense (1.0) Profit before taxation 18.9 Taxation 2.9 Profit for the year from continuing operations 21.8
Revenue by origin
Half year to 31 March
2018
Half year to 31 March
2017 (restated)
Year to 30 Sep
2017 (restated)
£m £m £m Europe 21.3 17.3 40.2 North America 56.4 61.6 119.0 Continuing operations 77.7 78.9 159.2

Page 19 of 27
4. Adjusted Performance Measures This document contains certain financial measures that are not defined or recognised under IFRS including adjusted operating profit and adjusted earnings per share. The Directors believe that adjusted measures provide a more useful comparison of business trends and performance. These adjusted measures exclude the effect of exceptional items, defined benefit scheme pension costs, the amortisation of acquired intangible assets and discontinued operations. The Group uses these measures for planning, budgeting and reporting purposes and for its internal assessment of the operational performance of individual businesses within the Group. Given the term adjusted is not defined under IFRS, the adjusted measures may not be comparable with similarly titled measures used by other companies. The following tables show the adjustments made to arrive at adjusted operating profit, adjusted profit for the period and adjusted basic earnings per share.
Half year to 31 March 2018 Half year to 31 March 2017
Adjusted operating profit
Protection
£m
Dairy
£m
Group
£m
Protection
£m
Dairy
£m
Group (restated)
£m Operating profit 8.7 2.6 9.9 7.6 3.3 9.6 Amortisation of acquired intangibles 0.5 1.0 1.5 0.4 1.0 1.4 Defined benefit pension administration costs - - 0.2 - - 0.2 Post-acquisition working capital adjustment - - - - (0.3) (0.3) Adjusted operating profit 9.2 3.6 11.6 8.0 4.0 10.9
Adjusted basic earnings per share
Half year to 31 March
2018
£m
Half year to 31 March
2017 (restated)
£m Profit for the period 10.1 7.2 Amortisation of acquired intangibles 1.5 1.4 Defined benefit pension administration costs 0.2 0.2 Post-acquisition working capital adjustment - (0.3) Defined benefit pension net interest cost 0.5 0.5 Tax on exceptional items (0.7) (0.6) (Profit)/loss from discontinued operations (1.6) 0.3 Adjusted profit for the year 10.0 8.7 Weighted average number of shares (in thousands) 30,498 30,410 Basic earnings per share (in pence) 33.1 23.7 Adjusted basic earnings per share (in pence) 32.8 28.6
Page 20 of 27
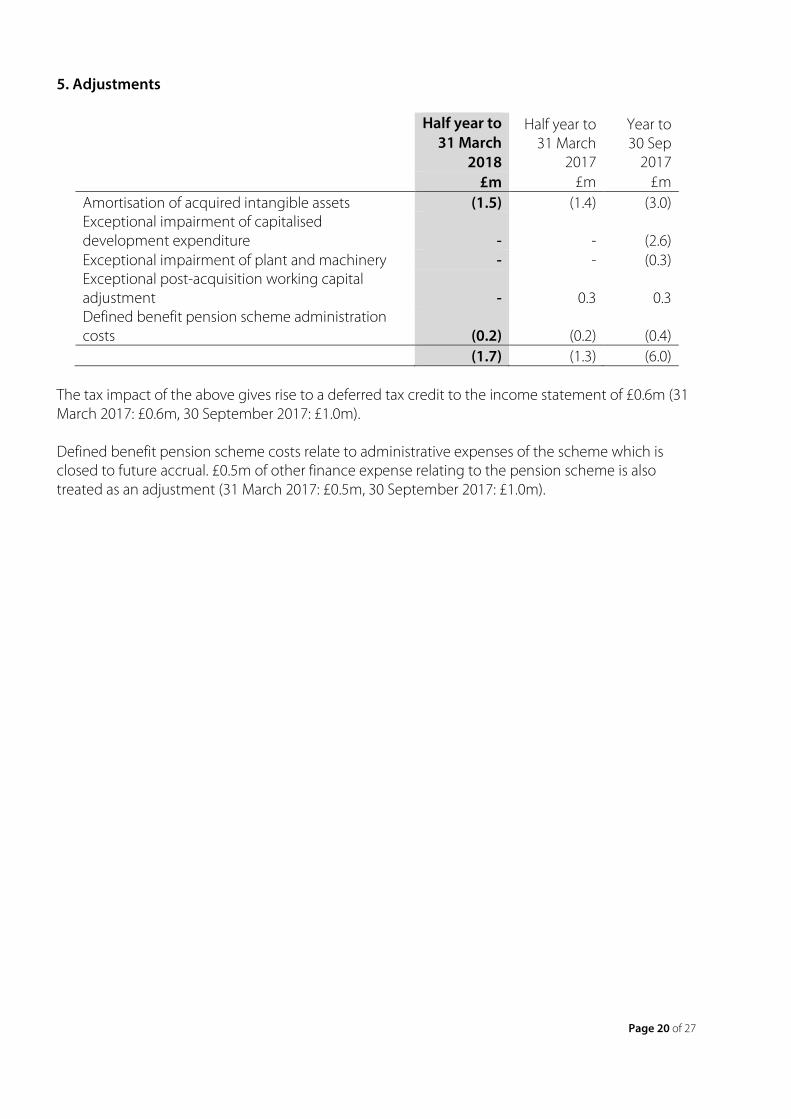
5. Adjustments
Half year to 31 March
2018
Half year to 31 March
2017
Year to 30 Sep
2017 £m £m £m Amortisation of acquired intangible assets (1.5) (1.4) (3.0) Exceptional impairment of capitalised development expenditure - - (2.6) Exceptional impairment of plant and machinery - - (0.3) Exceptional post-acquisition working capital adjustment - 0.3 0.3 Defined benefit pension scheme administration costs (0.2) (0.2) (0.4) (1.7) (1.3) (6.0)
The tax impact of the above gives rise to a deferred tax credit to the income statement of £0.6m (31 March 2017: £0.6m, 30 September 2017: £1.0m). Defined benefit pension scheme costs relate to administrative expenses of the scheme which is closed to future accrual. £0.5m of other finance expense relating to the pension scheme is also treated as an adjustment (31 March 2017: £0.5m, 30 September 2017: £1.0m).

Page 21 of 27
6. Discontinued operations In March 2018, the Group disposed of Avon Engineered Fabrications, Inc. its US based hovercraft skirt and bulk liquid storage tank business. This non-core business was included in the Protection segment. The business has been classified as discontinued and prior periods have been restated to reflect this. The results of discontinued operations are as follows:
Half year to 31 March
2018
Half year to 31 March
2017
Year to 30 Sep
2017 £m £m £m Profit before taxation 0.7 (0.3) (0.3) Taxation (0.2) - - Profit for the period 0.5 (0.3) (0.3) Gain on disposal 1.4 - - Tax on gain on disposal (0.3) - - Profit/(loss) from discontinued operations 1.6 (0.3) (0.3) Basic earnings/(loss) per share 5.2p (1.0)p (0.1)p Diluted earnings/(loss) per share 5.2p (1.0)p (0.1)p
The gain on disposal is a provisional figure and may be adjusted when final working capital balances have been agreed with the purchaser. Any adjustments that may be required will be recorded in discontinued operations in the future. Cash flows from discontinued operations included in the cash flow statement are as follows:
Half year to 31 March
2018
Half year to 31 March
2017
Year to 30 Sep
2017 £m £m £m Net cash flows (used in)/ from operating activities (0.2) 0.2 0.3 Net cash flows from investing activities 6.5 - - Net cash flows from financing activities - - - Net cash flows from discontinued operations 6.3 0.2 0.3

Page 22 of 27
7. Finance income and costs Half year to
31 Mar 2018
Half year to 31 Mar 2017
Year to 30 Sep
2017 £m £m £m Interest payable on bank loans and overdrafts (0.1) (0.1) (0.3) Finance income 0.1 - 0.1 - (0.1) (0.2)
Other finance expense
Half year to 31 Mar
2018 Half year to
31 Mar 2017
Year to 30 Sep
2017 £m £m £m
Net interest cost: UK defined benefit pension scheme (0.5) (0.5) (1.0) Provisions: Unwinding of discount - (0.1) -
(0.5) (0.6) (1.0) 8. Taxation
Half year to 31 Mar
2018 Half year to
31 Mar 2017
Year to 30 Sep
2017 £m £m £m Adjusted tax (charge)/credit (1.6) (2.0) (0.4) Tax credit on Adjustments 0.7 0.6 3.3 Total tax (charge)/credit (0.9) (1.4) 2.9
The effective tax rate for the period is a charge of 10% (31 March 2017: charge of 16%, 30 September 2017: credit of 15%). The adjusted effective tax rate, where the tax charge and the profit before taxation are adjusted for exceptional items, the amortisation of acquired intangibles and defined benefit pension scheme costs is 14% (31 March 2017: 19%, 30 September 2017: 2%). 9. Dividends On 1 February 2018, the shareholders approved a final dividend of 8.21p per qualifying ordinary share in respect of the year ended 30 September 2017. This was paid on 16 March 2018 absorbing £2.5m of shareholders' funds. The Board of Directors has declared an interim dividend of 5.34p (2016: 4.11p) per qualifying ordinary share in respect of the year ended 30 September 2018. This will be paid on 7 September 2018 to shareholders on the register at the close of business on 10 August 2018. In accordance with accounting standards, this dividend has not been provided for. It will be recognised in shareholders’ funds in the year to 30 September 2018 and is expected to absorb £1.6m (2016: £1.2m) of shareholders’ funds.

Page 23 of 27
10. Earnings per share Basic earnings per share is based on a profit attributable to ordinary shareholders of £10.1m (2017: £7.2m) and 30,498,000 (2017: 30,410,000) ordinary shares being the weighted average number of shares in issue during the period. Adjusted earnings per share is based on a profit from continuing operations attributable to ordinary shareholders of £10.0m (2017: £8.7m) after adding back amortisation of acquired intangible assets, exceptional items and defined benefit pension scheme costs. The Company has 182,000 (2017: 463,000) potentially dilutive ordinary shares in respect of the Performance Share Plan. 11. Provisions for liabilities and charges
Property obligations
£m Balance at 30 September 2017 2.0 Reclassification from other payables 1.5 Payments in period (0.2) Balance at 31 March 2018 3.3
Property obligations include an onerous lease provision and obligations relating to former premises of the Group which are subject to dilapidation risks. Property provisions are subject to uncertainty in respect of the utilisation, non-utilisation, or subletting of surplus leasehold property and the final negotiated settlement of any dilapidation claims with landlords. 12. Share capital
Half year to 31 Mar
2018
Half year to 31 Mar 2017
Year to 30 Sep
2017 Number of shares (thousands) 31,023 31,023 31,023 Ordinary shares (£m) 31.0 31.0 31.0 Share premium (£m) 34.7 34.7 34.7
During the period 150,703 ordinary shares with a nominal value of £1 each were purchased by the Avon Rubber p.l.c. Employer Share Ownership Trust.
Page 24 of 27
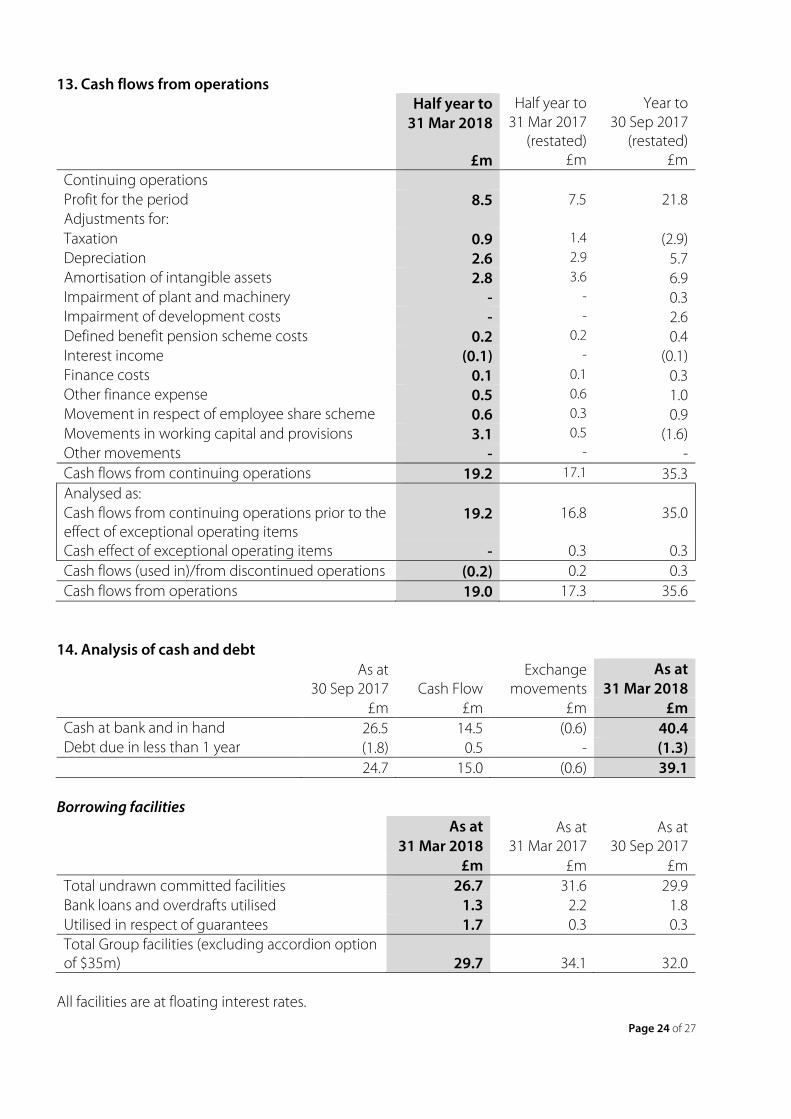
13. Cash flows from operations Half year to
31 Mar 2018 Half year to
31 Mar 2017 (restated)
Year to 30 Sep 2017
(restated) £m £m £m Continuing operations Profit for the period 8.5 7.5 21.8 Adjustments for: Taxation 0.9 1.4 (2.9) Depreciation 2.6 2.9 5.7 Amortisation of intangible assets 2.8 3.6 6.9 Impairment of plant and machinery - - 0.3 Impairment of development costs - - 2.6 Defined benefit pension scheme costs 0.2 0.2 0.4 Interest income (0.1) - (0.1) Finance costs 0.1 0.1 0.3 Other finance expense 0.5 0.6 1.0 Movement in respect of employee share scheme 0.6 0.3 0.9 Movements in working capital and provisions 3.1 0.5 (1.6) Other movements - - - Cash flows from continuing operations 19.2 17.1 35.3 Analysed as: Cash flows from continuing operations prior to the effect of exceptional operating items
19.2 16.8 35.0
Cash effect of exceptional operating items - 0.3 0.3 Cash flows (used in)/from discontinued operations (0.2) 0.2 0.3 Cash flows from operations 19.0 17.3 35.6
14. Analysis of cash and debt
As at 30 Sep 2017 Cash Flow
Exchange movements
As at 31 Mar 2018
£m £m £m £m Cash at bank and in hand 26.5 14.5 (0.6) 40.4 Debt due in less than 1 year (1.8) 0.5 - (1.3) 24.7 15.0 (0.6) 39.1
Borrowing facilities
As at 31 Mar 2018
As at 31 Mar 2017
As at 30 Sep 2017
£m £m £m Total undrawn committed facilities 26.7 31.6 29.9 Bank loans and overdrafts utilised 1.3 2.2 1.8 Utilised in respect of guarantees 1.7 0.3 0.3 Total Group facilities (excluding accordion option of $35m) 29.7 34.1 32.0
All facilities are at floating interest rates.

Page 25 of 27
The Group has agreed bank facilities with Barclays Bank and Comerica Bank comprising a revolving credit facility of $40m with a $35m accordion option. The facilities expire on 30 November 2019. This facility is priced on the dollar LIBOR plus margin of 1.25% and includes financial covenants which are measured on a quarterly basis. The Group was in compliance with its financial covenants during 2018 and 2017. 15. Disposal In March 2018, the Group disposed of Avon Engineered Fabrications, Inc. Further details are given in Note 6.
£m Cash consideration received 6.6 Consideration receivable 0.6 Total Consideration 7.2 Net assets disposed (5.1) Disposal cost (0.7) Recycling of deferred foreign exchange gains - Gain on disposal 1.4
Assets and liabilities at the date of disposal were:
£m Intangible assets 0.1 Property, plant and equipment 2.4 Inventories 1.2 Receivables 2.0 Payables (0.6) Total net assets disposed 5.1
16. Exchange rates The following significant exchange rates applied during the period.
Average rate
Closing rate
Average rate
Closing rate
Average rate
Closing rate
H1 2018 H1 2018 H1 2017 H1 2017 FY 2017 FY 2017 US dollar 1.359 1.408 1.240 1.250 1.267 1.339 Euro 1.130 1.143 1.157 1.169 1.147 1.134
Fair value of financial instruments The fair value of forward exchange contracts is determined by using valuation techniques using period end spot rates, adjusted for the forward points to the contract’s value date.

Page 26 of 27
17. Principal risks and uncertainties The principal risks and uncertainties impacting the Group are described on pages 32-35 of our Annual Report 2017 and remain unchanged at 31 March 2018. They include: projects failure/acquisition integration, market threat, talent management, product development, financial management, customer dependency, business interruption – supply chain, non-compliance with legislation and quality risks and product recall.
18. Related party transactions There were no related party transactions during the period or outstanding at the end of the period (2017: £nil) other than compensation of key management personnel which will be disclosed in the Group’s Annual Report for the year ending 30 September 2018.

Page 27 of 27
19. Restatement of prior periods The Statement of Comprehensive Income for half year and full year 2017 has been restated to present AEF as a discontinued operation. The half year 2017 has also been restated to correct the charge for share based payments. This is consistent with the restatement of the Income Statement for the year ended 30 September 2016 which was disclosed in the 2017 Annual Report. Further explanation is given on page 119 of our 2017 Annual Report. The effect of these restatements is summarised below.
Half Year to 31 March 2017 Year to 30 Sep 2017
As previously reported
Share based payments
AEF discontinued operations
Restated As previously reported
AEF discontinued operations
Restated
£m £m £m £m £m £m £m Adjusted Orders received 90.7 - - 90.7 173.9 (7.9) 166.0
Closing order book 35.0 - (0.5) 34.5 34.0 (4.0) 30.0 Revenue 81.1 - (2.2) 78.9 163.2 (4.0) 159.2 EBITDA 16.5 (0.3) (0.2) 16.0 36.0 (0.3) 35.7 Operating profit 10.9 (0.3) 0.3 10.9 25.8 0.3 26.1 Profit before tax 10.7 (0.3) 0.3 10.7 25.6 0.3 25.9 Tax (2.0) - - (2.0) (0.4) - (0.4) Profit for the period(1) 8.7 (0.3) 0.3 8.7 25.2 0.3 25.5 Total Orders received 90.7 - - 90.7 173.9 (7.9) 166.0
Closing order book 35.0 - (0.5) 34.5 34.0 (4.0) 30.0 Revenue 81.1 - (2.2) 78.9 163.2 (4.0) 159.2 EBITDA 16.6 (0.3) (0.2) 16.1 35.9 (0.3) 35.6 Operating profit 9.6 (0.3) 0.3 9.6 19.8 0.3 20.1 Profit before tax 8.9 (0.3) 0.3 8.9 18.6 0.3 18.9 Tax (1.4) - - (1.4) 2.9 - 2.9 Profit for the period(1) 7.5 (0.3) 0.3 7.5 21.5 0.3 21.8
(1) Profit for the period from continuing operations.