(6 people) - internal change
TRANSCRIPT

Annotated Progress ReportDecisionTech Leadership Team(6 people)Thursday, April 03, 2014 & Tuesday, June 20, 2017
This report is provided by:
Center for Internal ChangeA Division of The TEAM Approach2174 Old Philadelphia PikeLancaster PA 17602Telephone: (847) 259-0005
BB
Powered by

© 2015 by Patrick Lencioni and John Wiley & Sons, Inc. All rights reserved. Reproduction in any form, in whole or in part, is prohibited. Annotated Progress Report 2
Profile Page 2
The Five Behaviors of a Cohesive TeamHas your team made progress?
This report is designed to give you and your team insight into the progress you have made since you last took the assessment. Along with the original assessment questions, your team was given additional survey questions to help you pinpoint where improvement has been made and where it might still be needed.
Still, it’s important to bear in mind that progress can be measured in more than one way. While your assessment scores can help uncover weak spots (and strengths), other ways to measure progress may include how it feels to show up for work every day and willingness to stick with this program. Furthermore, it should be noted that your scores can be affected by more than just your progress. A shift in team members, deeper understanding of the concepts, and willingness to answer more honestly should be factored into any changes you see.
Maintaining a cohesive team requires ongoing attention and effort. But it can be—and should be—a rewarding process that benefits everyone on the team. Before you begin, take a moment to refresh yourself on The Five Behaviors model:
Trust One AnotherWhen team members are genuinely transparent and honest with one another, they are able to build vulnerability-based trust.
Engage in Conflict Around IdeasWhen there is trust, team members are able to engage in unfiltered, constructive debate of ideas.
Commit to DecisionsWhen team members are able to offer opinions and debate ideas, they will be more likely to commit to decisions.
Hold One Another AccountableWhen everyone is committed to a clear plan of action, they will be more willing to hold one another accountable.
Focus on Achieving Collective ResultsThe ultimate goal of building greater trust, productive conflict, commitment, and accountability is one thing: the achievement of results.
© 2015 by Patrick Lencioni and John Wiley & Sons, Inc. All rights reserved. Reproduction in any form, in whole or in part, is prohibited. 2 Use extra
space for
your own
notes

© 2015 by Patrick Lencioni and John Wiley & Sons, Inc. All rights reserved. Reproduction in any form, in whole or in part, is prohibited. Annotated Progress Report 3
Profile Page 3
The Five Behaviors and Your Team
Below are your team’s results for each behavior. The left side of the pyramid shows your results from the Thursday, April 03, 2014 assessment. The right side of the pyramid shows your results from the Tuesday, June 20, 2017 assessment.
The change between the two
scores:
Slight increase
Significant increase
Significant increase
Slight increase
Significant increase
Thursday, April 03, 2014 Tuesday, June 20, 2017
Summary of Your Team Survey Results
Your assessment scores indicate that commitment is likely an area of strength for your team, while results, accountability, conflict, and trust are potentially areas for improvement. Your team appears to have improved on all of the five behaviors since the last assessment.
© 2015 by Patrick Lencioni and John Wiley & Sons, Inc. All rights reserved. Reproduction in any form, in whole or in part, is prohibited. 3
3.00 3.25
Results
2.29 2.67
Accountability
3.50 3.88
Commitment
3.46
Conflict
3.71Trust
2.58 3.29

© 2015 by Patrick Lencioni and John Wiley & Sons, Inc. All rights reserved. Reproduction in any form, in whole or in part, is prohibited. Annotated Progress Report 4
Profile Page 4
Overview
Areas of Greatest Improvement
Almost Never
1Rarely
2Sometimes
3Usually
4
Almost Always
5
From TRUSTTeam members acknowledge their weaknesses to one another.
From COMMITMENTThe team is clear about its overall direction and priorities.
From COMMITMENTTeam members support group decisions even if they initially disagree.
Areas of Greatest Decline
Almost Never
1Rarely
2Sometimes
3Usually
4
Almost Always
5
From COMMITMENTTeam members leave meetings confident that everyone is committed to the decisions that were agreed upon.
From RESULTSTeam members are quick to point out the contributions and achievements of others.
© 2015 by Patrick Lencioni and John Wiley & Sons, Inc. All rights reserved. Reproduction in any form, in whole or in part, is prohibited. 4
04/2014
04/2014
04/2014
06/2017
06/2017
06/2017
04/2014
04/2014
06/2017
06/2017

© 2015 by Patrick Lencioni and John Wiley & Sons, Inc. All rights reserved. Reproduction in any form, in whole or in part, is prohibited. Annotated Progress Report 5
Profile Page 5
Your Team’s EvaluationAs part of the assessment, you and your team members had an opportunity to assess the overall progress, or lack of progress, you think your team made. The number of teammates who selected each option is indicated in the boxes below (out of 6 participants). Team members who did not participate in the last assessment should have indicated this on the team survey (you can find this tally at the bottom of the page).
Did your team spend enough time working through the issues that came up during your last Five Behaviors session?
1 Yes 5 No
Has your team functioned better since your last Five Behaviors session?
5 Yes 1 No
Has your team become more productive since your last Five Behaviors session?
4 Yes 2 No
Since the last assessment, what factors have kept the team from making more progress?(Team members could select all that apply)
5 1We were too busyPeople didn’t know how, or didn’t want, to make the necessary changes
5 1The topic just didn’t come up much
We didn’t know what changes needed to be made
1 0We didn’t make clear/specific goals during the last session
We didn’t know how to make the necessary changes
1 0We didn’t allot time to address the changes we needed to make
We didn’t need to make more progress
“I did not participate in the last assessment”= 0
© 2015 by Patrick Lencioni and John Wiley & Sons, Inc. All rights reserved. Reproduction in any form, in whole or in part, is prohibited. 5

© 2015 by Patrick Lencioni and John Wiley & Sons, Inc. All rights reserved. Reproduction in any form, in whole or in part, is prohibited. Annotated Progress Report 6
Profile Page 6
Building TrustRemember, the first and foundational behavior of a cohesive team is trust. The definition here isn’t centered around the ability to predict a person’s behavior based on past experience (a standard description). Rather, in the context of a cohesive team, trust means
• a willingness to be completely vulnerable with one another• confidence among team members that their peers’ intentions are good and
that there is no reason to be protective or careful around the team
Team Survey Results
The first row in each of the tables shows the spread of responses from your previous assessment to each of the trust-related questions. The second row in each table reflects your current results. To the right of the table, you will find the averages from each assessment. These averages are based on a five-point scale.
Normative Data
Team members acknowledge their weaknesses to one another.(Averages based on responses
from over 6,400 people)
Almost Never Rarely
Some-times Usually
Almost Always
AVG SCORE
04/2014 1 2 3 0 0 2.33
06/2017 1 0 2 2 1 3.332.81
Team members willingly apologize to one another.
Almost Never Rarely
Some-times Usually
Almost Always
AVG SCORE
04/2014 1 1 2 2 0 2.83
06/2017 0 0 3 2 1 3.673.35
Team members are unguarded and genuine with one another.Almost Never Rarely
Some-times Usually
Almost Always
AVG SCORE
04/2014 0 3 3 0 0 2.50
06/2017 0 1 4 1 0 3.003.34
Team members ask one another for input regarding their areas of responsibility.
Almost Never Rarely
Some-times Usually
Almost Always
AVG SCORE
04/2014 1 1 3 1 0 2.67
06/2017 0 1 3 2 0 3.173.33
Your Team’s Current Survey Results for Trust: 3.29=MEDIUM
Your Team’s Trust Score from Thursday, April 03, 2014: 2.58=LOW
© 2015 by Patrick Lencioni and John Wiley & Sons, Inc. All rights reserved. Reproduction in any form, in whole or in part, is prohibited. 6

© 2015 by Patrick Lencioni and John Wiley & Sons, Inc. All rights reserved. Reproduction in any form, in whole or in part, is prohibited. Annotated Progress Report 7
Profile Page 7
Progress Building TrustWhat has your team done to help improve trust?
As part of the assessment, you and your team members had an opportunity to address specific areas that may contribute to the level of trust on this team. The table below has two separate components. The box on the left illustrates the number of teammates (out of 6) that have noticed each level of change in the correlating behavior. The box on the right illustrates whether people on the team believe improvement is needed.
Since the last assessment, my team does this
More often
The same
Less often
We still need to work on
this
Readily apologizes 3 3 0 2
Lets go of grudges 1 5 0 3
Shares professional failures and successes 1 4 1 6
Considers one another’s working styles 5 1 0 0
Shares personal information 4 2 0 5
“I did not participate in the last assessment”= 0
Points of Discussion1. A number of group members have noticed an increase in many of the behaviors above. What examples do you have to share? How has this contributed to the level of trust on your team?
2. Based on your team survey (page 6), your team seems to have a higher level of trust than last time. What do you think contributed to your higher score? What steps can the team take to continue building trust?
© 2015 by Patrick Lencioni and John Wiley & Sons, Inc. All rights reserved. Reproduction in any form, in whole or in part, is prohibited. 7

© 2015 by Patrick Lencioni and John Wiley & Sons, Inc. All rights reserved. Reproduction in any form, in whole or in part, is prohibited. Annotated Progress Report 8
Profile Page 8
Mastering ConflictAll great relationships, the ones that last over time, require productive conflict in order to grow. It’s important to distinguish productive, ideological conflict from destructive fighting and interpersonal politics. Productive conflict
• is focused on concepts and ideas• avoids mean-spirited, personal attacks
Team Survey Results
The first row in each of the tables shows the spread of responses from your previous assessment to each of the conflict-related questions. The second row in each table reflects your current results. To the right of the table, you will find the averages from each assessment. These averages are based on a five-point scale.
Normative Data
Team members voice their opinions even at the risk of causing disagreement.
(Averages based on responses
from over 6,400 people)
Almost Never Rarely
Some-times Usually
Almost Always
AVG SCORE
04/2014 0 1 2 2 1 3.50
06/2017 0 0 1 3 2 4.173.40
Team members solicit one another’s opinions during meetings.
Almost Never Rarely
Some-times Usually
Almost Always
AVG SCORE
04/2014 0 1 3 1 1 3.33
06/2017 0 1 2 3 0 3.333.60
When conflict occurs, the team confronts and deals with the issue before moving to another subject.
Almost Never Rarely
Some-times Usually
Almost Always
AVG SCORE
04/2014 0 2 1 1 2 3.50
06/2017 0 1 0 4 1 3.833.20
During team meetings, the most important—and difficult—issues are discussed.
Almost Never Rarely
Some-times Usually
Almost Always
AVG SCORE
04/2014 0 1 3 0 2 3.50
06/2017 0 1 2 2 1 3.503.42
Your Team’s Current Survey Results for Conflict: 3.71=MEDIUM
Your Team’s Conflict Score from Thursday, April 03, 2014: 3.46=MEDIUM
© 2015 by Patrick Lencioni and John Wiley & Sons, Inc. All rights reserved. Reproduction in any form, in whole or in part, is prohibited. 8

© 2015 by Patrick Lencioni and John Wiley & Sons, Inc. All rights reserved. Reproduction in any form, in whole or in part, is prohibited. Annotated Progress Report 9
Profile Page 9
Progress Mastering ConflictWhere is your team on the Conflict Continuum?
When it comes to the range of different conflict dynamics in an organization, there is a continuum of sorts. At one end of the continuum is no conflict at all, marked by false smiling and disingenuous agreement. At the other end of the continuum is relentless, nasty, destructive conflict, with people constantly at one another’s throats. Somewhere in the middle of those two extremes is the demarcation line where good, constructive conflict exists.
As part of the assessment, you and your team members had the opportunity to place yourselves on the conflict continuum and to answer questions regarding this placement. Here are the results of the team survey (6 people):
Since the last assessment, our team has largely:
Avoided conflict and maintained artificial
harmony
Resolved many issues with
productive conflict
Engaged in conflict that is destructive and mean-spirited
People=
2 2 1 0 1 0 0
Ideal Conflict Point
Since the last Five Behaviors session, RarelySome-times Often
I hold back my opinions because I think they will cause tension. 3 3 0
I hold back my opinions because I don’t think anyone will listen. 2 2 2
I feel that my opinions are overpowered by others. 2 1 3
“I did not participate in the last assessment”= 0
Points of Discussion
1. A number of people on this team hold back their opinions for the reasons listed above. How has this impacted the team’s productivity? What could the team do to encourage people to share their opinions more freely?
2. Based on your team survey (page 8), your team seems to have improved at handling conflict. What do you think contributed to your higher score? What steps can the team take to continue to engage in healthy conflict?
© 2015 by Patrick Lencioni and John Wiley & Sons, Inc. All rights reserved. Reproduction in any form, in whole or in part, is prohibited. 9

© 2015 by Patrick Lencioni and John Wiley & Sons, Inc. All rights reserved. Reproduction in any form, in whole or in part, is prohibited. Annotated Progress Report 10
Profile Page 10
Achieving CommitmentWhat do we mean by commitment? In the context of a cohesive team, commitment is
• clarity around decisions• moving forward with complete buy-in from every member of the team, even
those who initially disagreed with the decision
Team Survey Results
The first row in each of the tables shows the spread of responses from your previous assessment to each of the commitment-related questions. The second row in each table reflects your current results. To the right of the table, you will find the averages from each assessment. These averages are based on a five-point scale. Normative Data
The team is clear about its overall direction and priorities.(Averages based on responses
from over 6,400 people)
Almost Never Rarely
Some-times Usually
Almost Always
AVG SCORE
04/2014 0 1 2 3 0 3.33
06/2017 0 1 0 1 4 4.333.55
Team members end meetings with clear and specific resolutions and calls to action.
Almost Never Rarely
Some-times Usually
Almost Always
AVG SCORE
04/2014 0 0 3 3 0 3.50
06/2017 0 0 2 4 0 3.673.43
Team members leave meetings confident that everyone is committed to the decisions that were agreed upon.
Almost Never Rarely
Some-times Usually
Almost Always
AVG SCORE
04/2014 0 1 1 2 2 3.83
06/2017 0 1 2 3 0 3.333.42
Team members support group decisions even if they initially disagree.
Almost Never Rarely
Some-times Usually
Almost Always
AVG SCORE
04/2014 0 1 2 3 0 3.33
06/2017 0 0 1 3 2 4.173.76
Your Team’s Current Survey Results for Commitment: 3.88=HIGH
Your Team’s Commitment Score from Thursday, April 03, 2014: 3.50=MEDIUM
© 2015 by Patrick Lencioni and John Wiley & Sons, Inc. All rights reserved. Reproduction in any form, in whole or in part, is prohibited. 10
© 2015 by Patrick Lencioni and John Wiley & Sons, Inc. All rights reserved. Reproduction in any form, in whole or in part, is prohibited. Annotated Progress Report 11
Profile Page 11
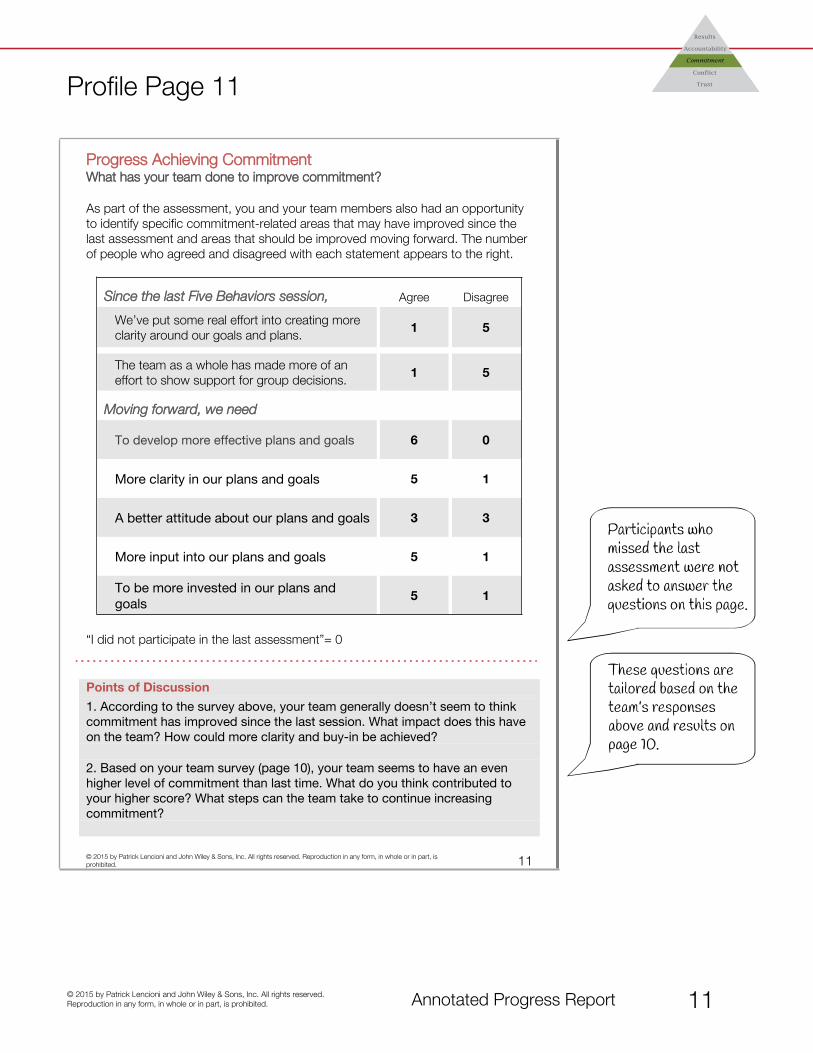
Progress Achieving CommitmentWhat has your team done to improve commitment?
As part of the assessment, you and your team members also had an opportunity to identify specific commitment-related areas that may have improved since the last assessment and areas that should be improved moving forward. The number of people who agreed and disagreed with each statement appears to the right.
Since the last Five Behaviors session, Agree Disagree
We’ve put some real effort into creating more clarity around our goals and plans.
1 5
The team as a whole has made more of an effort to show support for group decisions.
1 5
Moving forward, we need
To develop more effective plans and goals 6 0
More clarity in our plans and goals 5 1
A better attitude about our plans and goals 3 3
More input into our plans and goals 5 1
To be more invested in our plans and goals
5 1
“I did not participate in the last assessment”= 0
Points of Discussion
1. According to the survey above, your team generally doesn’t seem to think commitment has improved since the last session. What impact does this have on the team? How could more clarity and buy-in be achieved?
2. Based on your team survey (page 10), your team seems to have an even higher level of commitment than last time. What do you think contributed to your higher score? What steps can the team take to continue increasing commitment?
© 2015 by Patrick Lencioni and John Wiley & Sons, Inc. All rights reserved. Reproduction in any form, in whole or in part, is prohibited. 11

© 2015 by Patrick Lencioni and John Wiley & Sons, Inc. All rights reserved. Reproduction in any form, in whole or in part, is prohibited. Annotated Progress Report 12
Profile Page 12
Embracing AccountabilityAccountability has become a buzzword—so overused and with so many different interpretations that it has lost much of its meaning. In the context of teamwork, however, accountability is
The willingness of team members to call their peers on performance or behaviors that might hurt the team
Team Survey Results
The first row in each of the tables shows the spread of responses from your previous assessment to each of the accountability-related questions. The second row in each table reflects your current results. To the right of the table, you will find the averages from each assessment. These averages are based on a five-point scale. Normative Data
Team members offer unprovoked, constructive feedback to one another.
(Averages based on responses
from over 6,400 people)
Almost Never Rarely
Some-times Usually
Almost Always
AVG SCORE
04/2014 1 4 1 0 0 2.00
06/2017 1 1 4 0 0 2.503.08
The team ensures that members feel pressure from their peers and the expectation to perform.
Almost Never Rarely
Some-times Usually
Almost Always
AVG SCORE
04/2014 2 2 2 0 0 2.00
06/2017 1 2 2 0 1 2.672.97
Team members confront peers about problems in their respective areas of responsibility.
Almost Never Rarely
Some-times Usually
Almost Always
AVG SCORE
04/2014 2 2 1 1 0 2.17
06/2017 2 2 0 2 0 2.333.02
Team members question one another about their current approaches and methods.
Almost Never Rarely
Some-times Usually
Almost Always
AVG SCORE
04/2014 0 2 2 2 0 3.00
06/2017 0 1 4 0 1 3.173.07
Your Team’s Current Survey Results for Accountability: 2.67=LOW
Your Team’s Accountability Score from Thursday, April 03, 2014: 2.29=LOW
© 2015 by Patrick Lencioni and John Wiley & Sons, Inc. All rights reserved. Reproduction in any form, in whole or in part, is prohibited. 12
© 2015 by Patrick Lencioni and John Wiley & Sons, Inc. All rights reserved. Reproduction in any form, in whole or in part, is prohibited. Annotated Progress Report 13
Profile Page 13
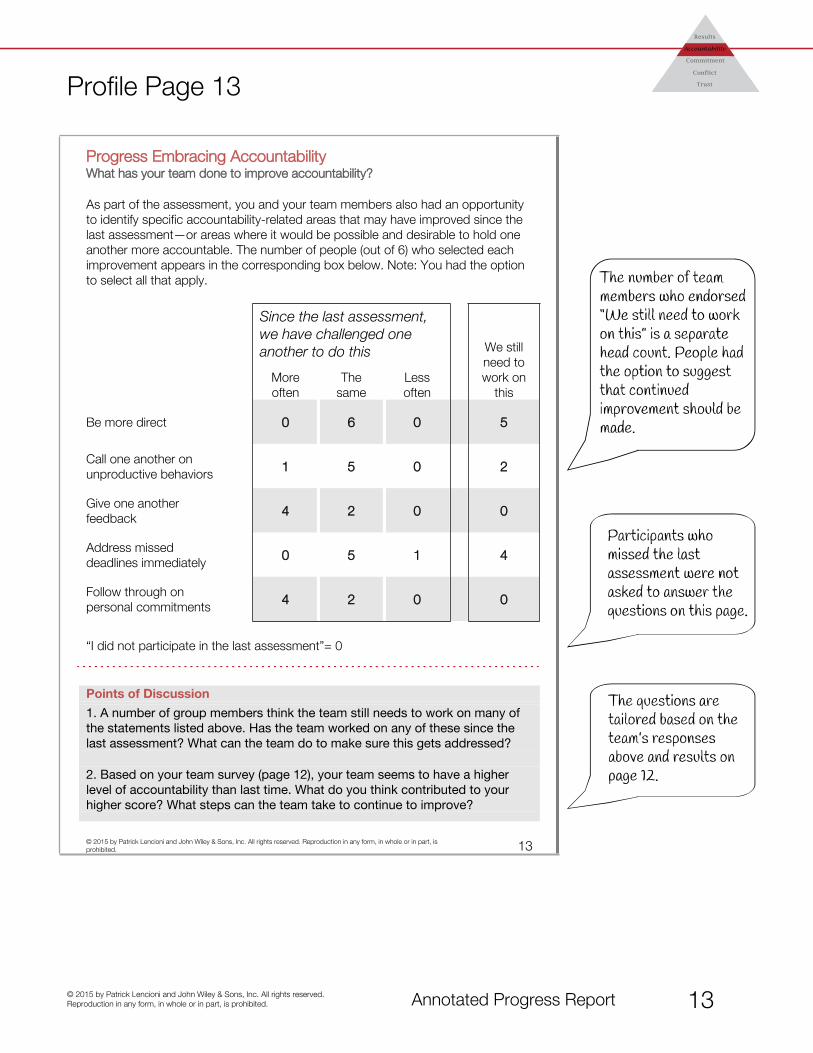
Progress Embracing AccountabilityWhat has your team done to improve accountability?
As part of the assessment, you and your team members also had an opportunity to identify specific accountability-related areas that may have improved since the last assessment—or areas where it would be possible and desirable to hold one another more accountable. The number of people (out of 6) who selected each improvement appears in the corresponding box below. Note: You had the option to select all that apply.
Since the last assessment, we have challenged one another to do this
More often
The same
Less often
We still need to work on
this
Be more direct 0 6 0 5
Call one another on unproductive behaviors 1 5 0 2
Give one another feedback 4 2 0 0
Address missed deadlines immediately 0 5 1 4
Follow through on personal commitments 4 2 0 0
“I did not participate in the last assessment”= 0
Points of Discussion
1. A number of group members think the team still needs to work on many of the statements listed above. Has the team worked on any of these since the last assessment? What can the team do to make sure this gets addressed?
2. Based on your team survey (page 12), your team seems to have a higher level of accountability than last time. What do you think contributed to your higher score? What steps can the team take to continue to improve?
© 2015 by Patrick Lencioni and John Wiley & Sons, Inc. All rights reserved. Reproduction in any form, in whole or in part, is prohibited. 13
© 2015 by Patrick Lencioni and John Wiley & Sons, Inc. All rights reserved. Reproduction in any form, in whole or in part, is prohibited. Annotated Progress Report 14
Profile Page 14
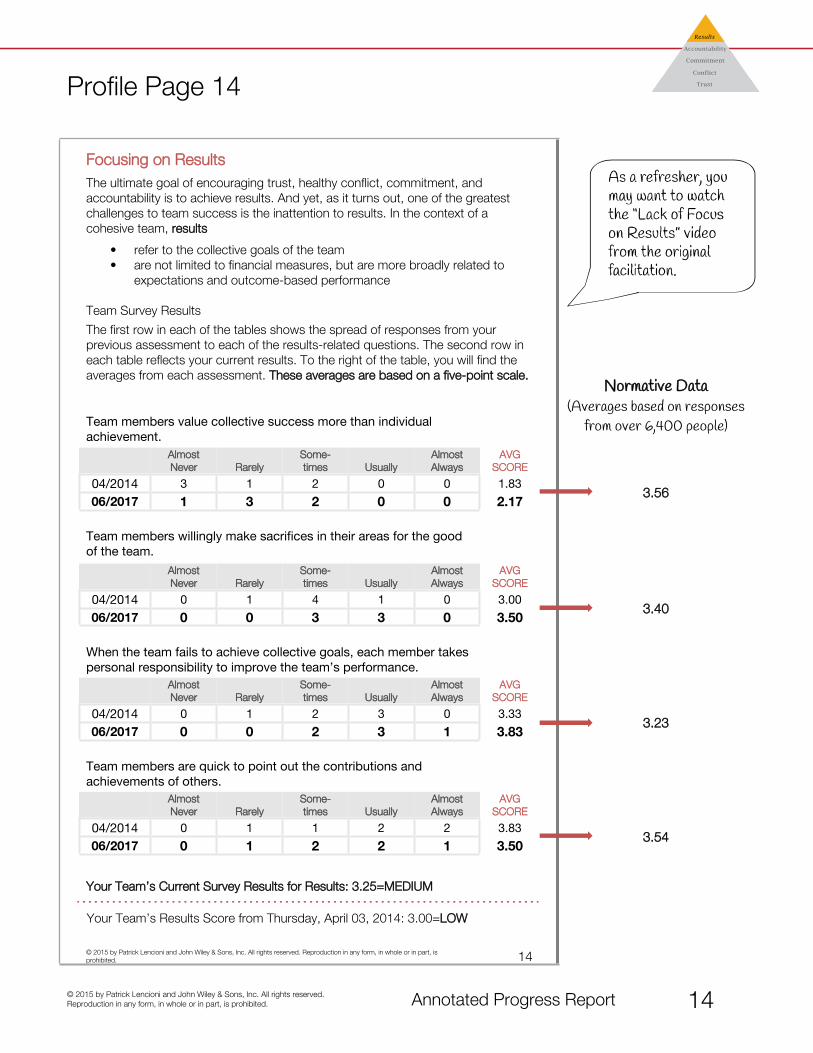
Focusing on ResultsThe ultimate goal of encouraging trust, healthy conflict, commitment, and accountability is to achieve results. And yet, as it turns out, one of the greatest challenges to team success is the inattention to results. In the context of a cohesive team, results
• refer to the collective goals of the team• are not limited to financial measures, but are more broadly related to
expectations and outcome-based performance
Team Survey Results
The first row in each of the tables shows the spread of responses from your previous assessment to each of the results-related questions. The second row in each table reflects your current results. To the right of the table, you will find the averages from each assessment. These averages are based on a five-point scale.
Normative Data
Team members value collective success more than individual achievement.
(Averages based on responses
from over 6,400 people)
Almost Never Rarely
Some-times Usually
Almost Always
AVG SCORE
04/2014 3 1 2 0 0 1.83
06/2017 1 3 2 0 0 2.173.56
Team members willingly make sacrifices in their areas for the good of the team.
Almost Never Rarely
Some-times Usually
Almost Always
AVG SCORE
04/2014 0 1 4 1 0 3.00
06/2017 0 0 3 3 0 3.503.40
When the team fails to achieve collective goals, each member takes personal responsibility to improve the team’s performance.
Almost Never Rarely
Some-times Usually
Almost Always
AVG SCORE
04/2014 0 1 2 3 0 3.33
06/2017 0 0 2 3 1 3.833.23
Team members are quick to point out the contributions and achievements of others.
Almost Never Rarely
Some-times Usually
Almost Always
AVG SCORE
04/2014 0 1 1 2 2 3.83
06/2017 0 1 2 2 1 3.503.54
Your Team’s Current Survey Results for Results: 3.25=MEDIUM
Your Team’s Results Score from Thursday, April 03, 2014: 3.00=LOW
© 2015 by Patrick Lencioni and John Wiley & Sons, Inc. All rights reserved. Reproduction in any form, in whole or in part, is prohibited. 14
© 2015 by Patrick Lencioni and John Wiley & Sons, Inc. All rights reserved. Reproduction in any form, in whole or in part, is prohibited. Annotated Progress Report 15
Profile Page 15
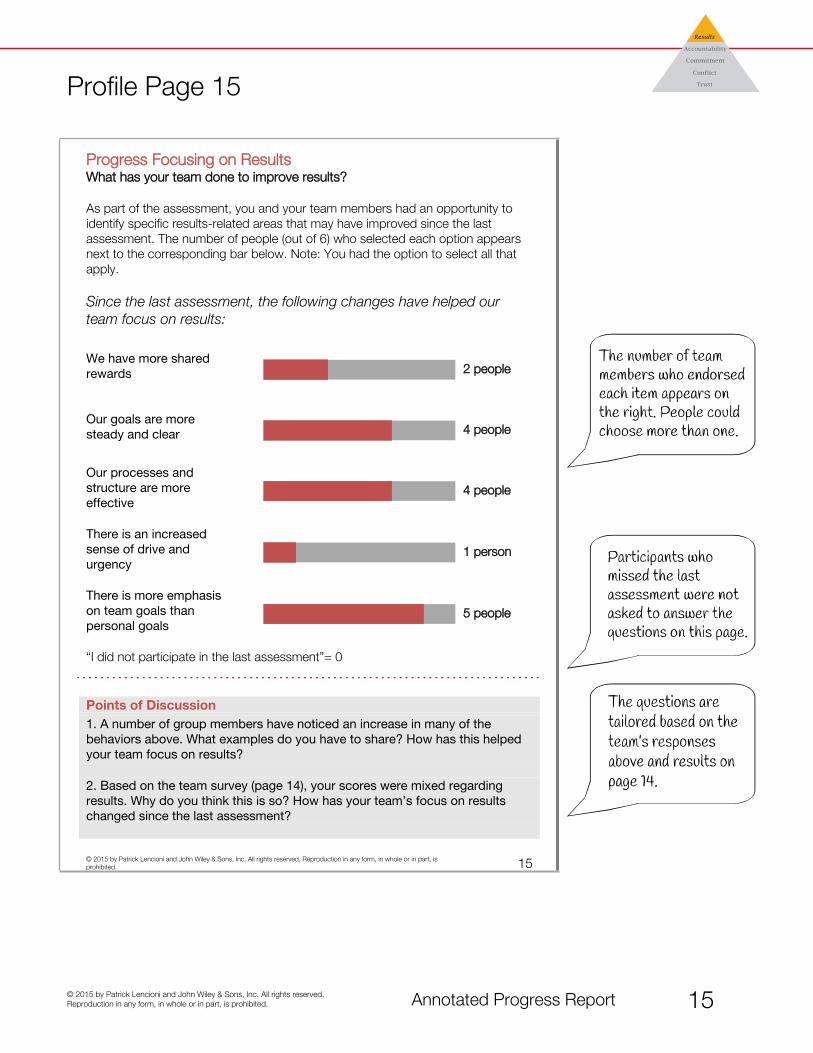
Progress Focusing on ResultsWhat has your team done to improve results?
As part of the assessment, you and your team members had an opportunity to identify specific results-related areas that may have improved since the last assessment. The number of people (out of 6) who selected each option appears next to the corresponding bar below. Note: You had the option to select all that apply.
Since the last assessment, the following changes have helped our team focus on results:
We have more shared rewards 2 people
Our goals are more steady and clear 4 people
Our processes and structure are more effective
4 people
There is an increased sense of drive and urgency
1 person
There is more emphasis on team goals than personal goals
5 people
“I did not participate in the last assessment”= 0
Points of Discussion1. A number of group members have noticed an increase in many of the behaviors above. What examples do you have to share? How has this helped your team focus on results?
2. Based on the team survey (page 14), your scores were mixed regarding results. Why do you think this is so? How has your team’s focus on results changed since the last assessment?
© 2015 by Patrick Lencioni and John Wiley & Sons, Inc. All rights reserved. Reproduction in any form, in whole or in part, is prohibited. 15

© 2015 by Patrick Lencioni and John Wiley & Sons, Inc. All rights reserved. Reproduction in any form, in whole or in part, is prohibited. Annotated Progress Report 16
Profile Page 16
Action Plan
Now that you have reviewed and discussed your assessment results, use the following action planning worksheet to identify the team’s priorities for improvements and set specific goals. The team may choose to answer the questions as a group. Or, you could start by answering independently and then sharing and combining ideas.
1. What is the team doing well? Why do you think this is a strength for the team? How can you make sure the team keeps doing this well?
2. What does this team need to work on? Why do you think this area is troublesome for the team? In what ways does it impede the team’s progress?
3. Come up with three action steps the team could take to improve, how they will be measured, and when you expect to see improvement.
ACTION MEASURED BY TARGET DATE
1.
2.
3.
© 2015 by Patrick Lencioni and John Wiley & Sons, Inc. All rights reserved. Reproduction in any form, in whole or in part, is prohibited. 16
© 2015 by Patrick Lencioni and John Wiley & Sons, Inc. All rights reserved. Reproduction in any form, in whole or in part, is prohibited. Annotated Progress Report 17
Profile Page 17This page will be a refresher for people who took the last assessment. People’s DiSC® styles will remain the same.
However, it may be new information for anyone who wasn’t involved in the last assessment.
Appendix: The Impact of Your DiSC® Style Dot Placement
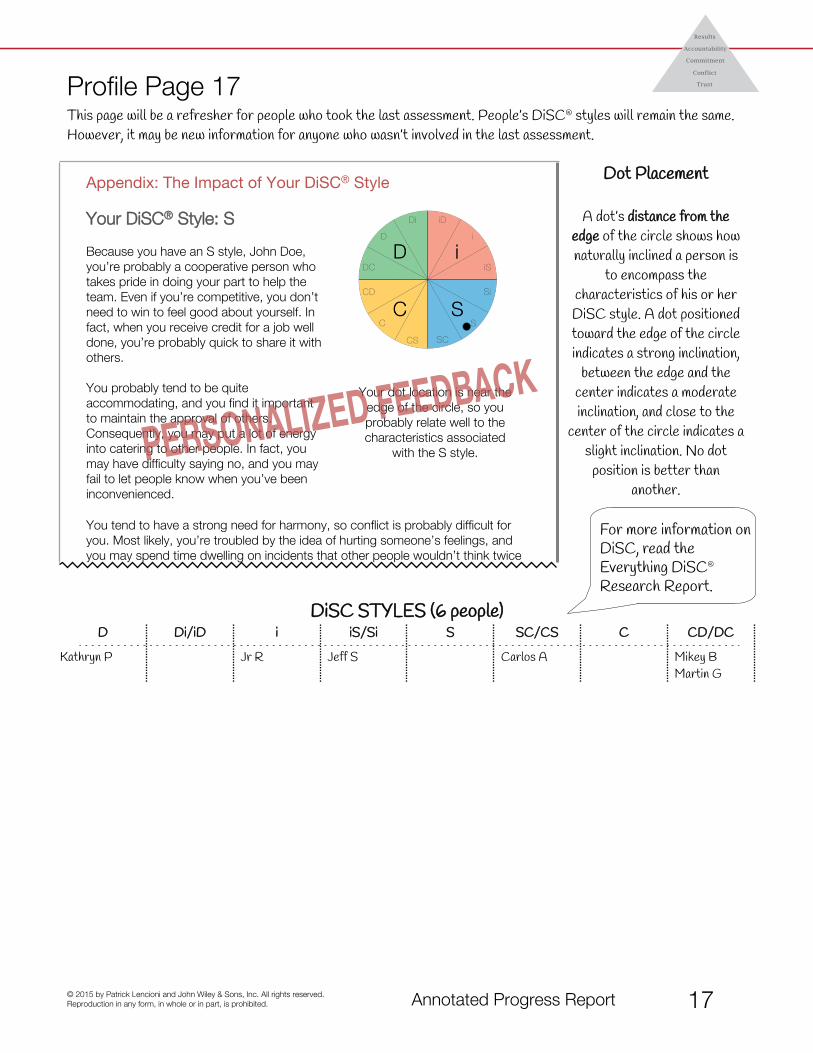
Your DiSC® Style: S
Because you have an S style, John Doe, you’re probably a cooperative person who takes pride in doing your part to help the team. Even if you’re competitive, you don’t need to win to feel good about yourself. In fact, when you receive credit for a job well done, you’re probably quick to share it with others.
You probably tend to be quite accommodating, and you find it important to maintain the approval of others. Consequently, you may put a lot of energy into catering to other people. In fact, you may have difficulty saying no, and you may fail to let people know when you’ve been inconvenienced.
Your dot location is near the edge of the circle, so you probably relate well to the characteristics associated
with the S style.
A dot’s distance from the
edge of the circle shows how
naturally inclined a person is
to encompass the
characteristics of his or her
DiSC style. A dot positioned
toward the edge of the circle
indicates a strong inclination,
between the edge and the
center indicates a moderate
inclination, and close to the
center of the circle indicates a
slight inclination. No dot
position is better than
another.
You tend to have a strong need for harmony, so conflict is probably difficult for you. Most likely, you’re troubled by the idea of hurting someone’s feelings, and you may spend time dwelling on incidents that other people wouldn’t think twice
DiSC STYLES (6 people)D Di/iD i iS/Si S SC/CS C CD/DC
Kathryn P Jr R Jeff S Carlos A Mikey B
Martin G
For more information on
DiSC, read the
Everything DiSC®
Research Report.
© 2015 by Patrick Lencioni and John Wiley & Sons, Inc. All rights reserved. Reproduction in any form, in whole or in part, is prohibited. Annotated Progress Report 18
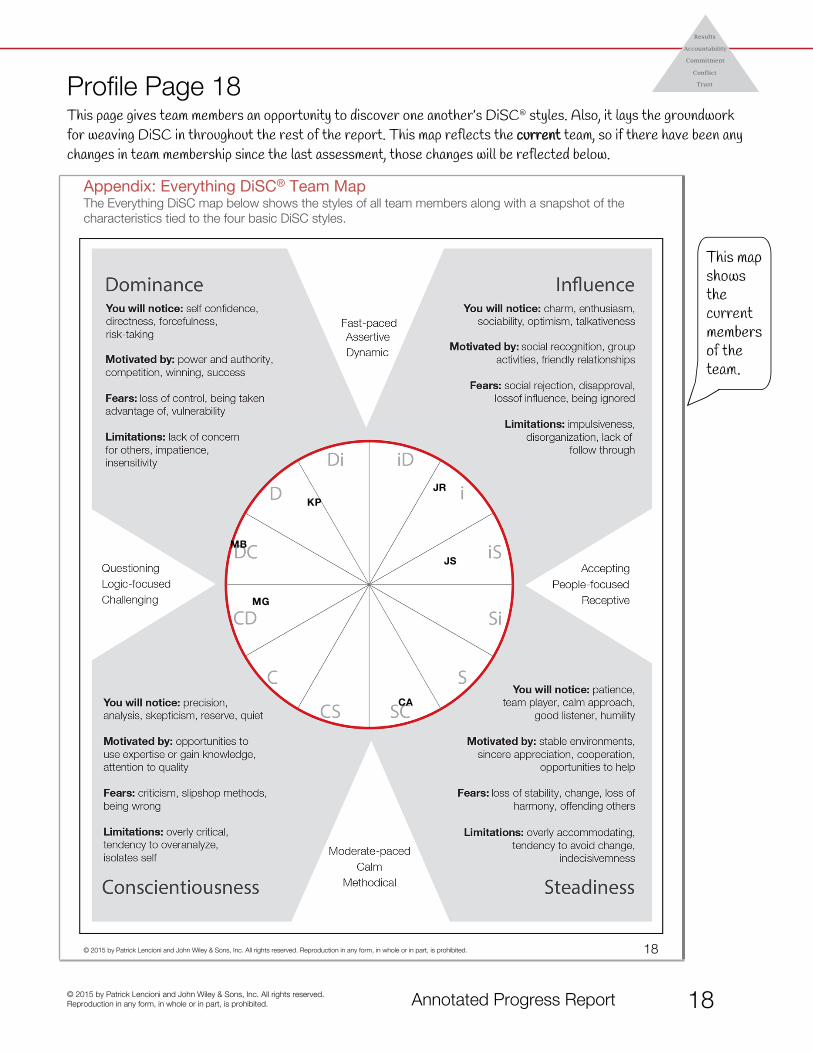
Profile Page 18This page gives team members an opportunity to discover one another’s DiSC® styles. Also, it lays the groundwork
for weaving DiSC in throughout the rest of the report. This map reflects the current team, so if there have been any
changes in team membership since the last assessment, those changes will be reflected below.
Appendix: Everything DiSC® Team MapThe Everything DiSC map below shows the styles of all team members along with a snapshot of the characteristics tied to the four basic DiSC styles.
© 2015 by Patrick Lencioni and John Wiley & Sons, Inc. All rights reserved. Reproduction in any form, in whole or in part, is prohibited. 18
CA
MB
MG
KPJR
JS

© 2015 by Patrick Lencioni and John Wiley & Sons, Inc. All rights reserved. Reproduction in any form, in whole or in part, is prohibited. Annotated Progress Report 19
Profile Page 19This page is designed to help teams candidly discuss healthy and unhealthy conflict, and acknowledge that we all
handle tense situations differently. The unhealthy behaviors, in particular, are generalizations. This map reflects the
current team, so if there have been any changes in team membership since the last assessment, those changes will be
reflected below.
Appendix: Conflict Team Map The descriptions on the inner, gray circle illustrate what healthy behavior during conflict might look like. The descriptions in red on the outer circle illustrate unhealthy behavior related to each style. The numbers in the innermost circle reflect the people on your team who fall into each of the style regions (6 people).
© 2015 by Patrick Lencioni and John Wiley & Sons, Inc. All rights reserved. Reproduction in any form, in whole or in part, is prohibited. 19
(0)(1)
(2)
(0)(1)
(0)
(1)
(1)

© 2015 by Patrick Lencioni and John Wiley & Sons, Inc. All rights reserved. Reproduction in any form, in whole or in part, is prohibited. Annotated Progress Report 20
Appendix: Question RankingBelow you will find all 20 questions ranked from this team’s highest to lowest average score. The average scores for this team (DecisionTech Leadership Team) appear in the first box to the right. In the second box to the right, you will find the average score for all teams that have taken the assessment. This information is not in the participant reports.
Almost Never
1Rarely
2Sometimes
3Usually
4
Almost Always
5
THIS team’s avg. score
Avg. score for ALL teams
1. CommitmentThe team is clear about its overall direction and priorities.
4.33 3.55
2. CommitmentTeam members support group decisions even if they initially disagree.
4.17 3.76
3. ConflictTeam members voice their opinions even at the risk of causing disagreement.
4.17 3.40
4. ConflictWhen conflict occurs, the team confronts and deals with the issue before moving to another subject.
3.83 3.20
5. ResultsWhen the team fails to achieve collective goals, each member takes personal responsibility to improve the team’s performance.
3.83 3.23
6. TrustTeam members willingly apologize to one another.
3.67 3.35

© 2015 by Patrick Lencioni and John Wiley & Sons, Inc. All rights reserved. Reproduction in any form, in whole or in part, is prohibited. Annotated Progress Report 21
Appendix: Question Ranking
Almost Never
1Rarely
2Sometimes
3Usually
4
Almost Always
5
THIS team’s avg. score
Avg. score for ALL teams
7. CommitmentTeam members end meetings with clear and specific resolutions and calls to action.
3.67 3.43
8. ConflictDuring team meetings, the most important—and difficult—issues are discussed.
3.50 3.42
9. ResultsTeam members willingly make sacrifices in their areas for the good of the team.
3.50 3.40
10. ResultsTeam members are quick to point out the contributions and achievements of others.
3.50 3.54
11. ConflictTeam members solicit one another’s opinions during meetings.
3.33 3.60
12. CommitmentTeam members leave meetings confident that everyone is committed to the decisions that were agreed upon.
3.33 3.42
13. TrustTeam members acknowledge their weaknesses to one another.
3.33 2.81

© 2015 by Patrick Lencioni and John Wiley & Sons, Inc. All rights reserved. Reproduction in any form, in whole or in part, is prohibited. Annotated Progress Report 22
Appendix: Question Ranking
Almost Never
1Rarely
2Sometimes
3Usually
4
Almost Always
5
THIS team’s avg. score
Avg. score for ALL teams
14. AccountabilityTeam members question one another about their current approaches and methods.
3.17 3.07
15. TrustTeam members ask one another for input regarding their areas of responsibility.
3.17 3.33
16. TrustTeam members are unguarded and genuine with one another.
3.00 3.34
17. AccountabilityThe team ensures that members feel pressure from their peers and the expectation to perform.
2.67 2.97
18. AccountabilityTeam members offer unprovoked, constructive feedback to one another.
2.50 3.08
19. AccountabilityTeam members confront peers about problems in their respective areas of responsibility.
2.33 3.02
20. ResultsTeam members value collective success more than individual achievement.
2.17 3.56
© 2015 by Patrick Lencioni and John Wiley & Sons, Inc. All rights reserved. Reproduction in any form, in whole or in part, is prohibited. Annotated Progress Report 23
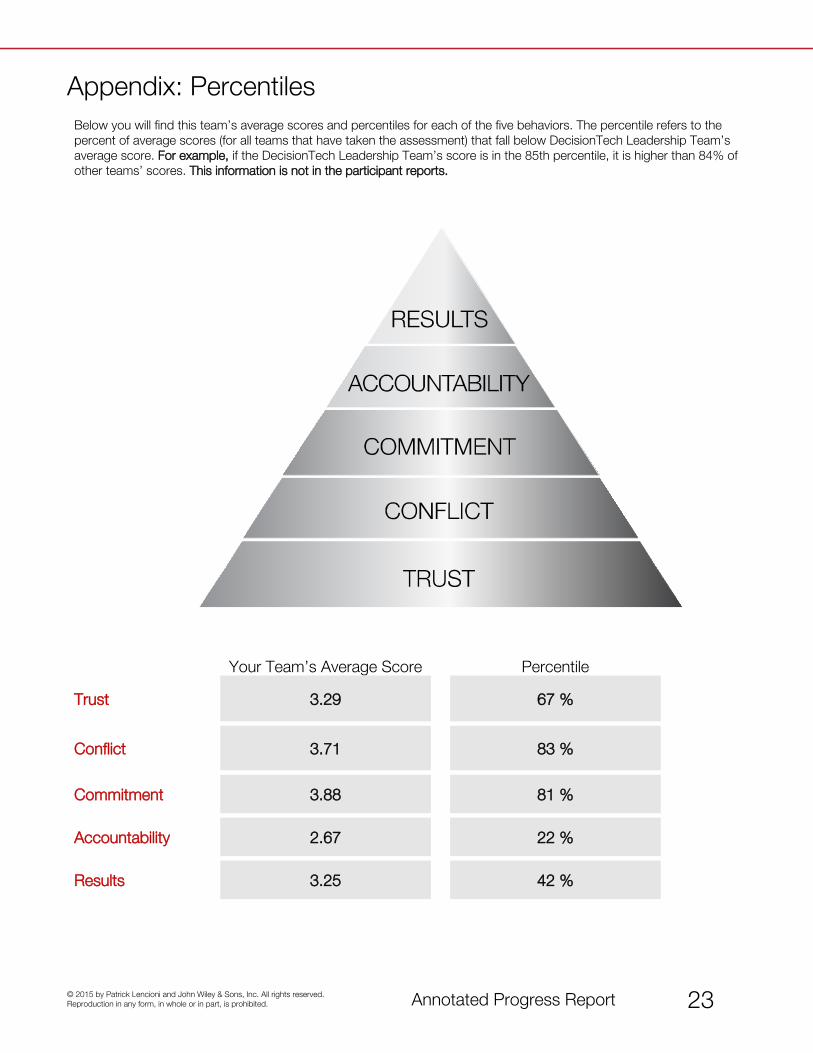
Appendix: PercentilesBelow you will find this team’s average scores and percentiles for each of the five behaviors. The percentile refers to the percent of average scores (for all teams that have taken the assessment) that fall below DecisionTech Leadership Team’s average score. For example, if the DecisionTech Leadership Team’s score is in the 85th percentile, it is higher than 84% of other teams’ scores. This information is not in the participant reports.
Your Team’s Average Score Percentile
Trust 3.29 67 %
Conflict 3.71 83 %
Commitment 3.88 81 %
Accountability 2.67 22 %
Results 3.25 42 %