6. references - unika repositoryrepository.unika.ac.id/1945/6/10.70.0137 vincent kevin tejo daftar...
TRANSCRIPT

46
6. REFERENCES
Anonymous. (1975) Minutes of Division Business Meeting. Institute of Food Technologists – Sensory Evaluation Division, IFT, Chicago, IL.
Abou-Arab, A., A. Abou-Arab and M. F. Abu-Salem. (2010). Physico-chemical assessment of natural sweeteners steviosides produced from Stevia rebaudiana Bertoni plant. African Journal of Food Science, 4, 269–281.
Aguero,M, J. Pereda, S.I. Roura, M.R. Moreira and C.E. del Valle. (2005). Sensory and biochemical changes in Swiss chard (Beta vulgaris) during blanching, Lesbensm Wiss Technol, 35, 772‐778
Andayani, R, Y. Lisawati dan Maimunah. (2008). Penentuan Aktivitas Antioksidan, Kadar Fenolat Total, dan Likopen pada Buah Tomat (solanum lycopersicum L.). Jurnal Sains dan Teknologi Farmasi, Vol 13, No.1
Apriyantono, A, D. Fardiaz, N.L. Puspitasari, Sedarnawati dan S. Budiyantono (1989). Petunjuk Laboratorium Analisis Pangan. Bogor : Penerbit Institut Pertanian Bogor.
Belitz, D.H and W. Grosch. (1997). Quı'mica de los Alimentos. Zaragoza: Acribia.
Bolaji, B.O and A.P. Olalusi. (2008). Performance Evaluation of a Mixed-Mode Soplar Dryer. AU J.T. 11(4):225-231
Brand-Williams W, M. E. Cuvelier and C. Berset. (1995). Use of a free radical method to evaluate antioxidant activity. Leben Wiss UTEch, 28, 25-30
Brandle, J. E. and P. G. Telmer. (2007). "Steviol glycoside biosynthesis."Phytochemistry, 68, 1855–1863.
Brandle, J.E., A.N. Starrratt and M. Gijen. (1998). “Stevia rebaudiana: Its agricultural, biological and chemical properties.” Can. J. Plant Sci.
Buckenhuskers, H.J. and H.T. Omran. (1997). Stevia rebaudiana Bertoni and stevioside. Sugar and S. Subst. in Food Proc. Nutr., Ismailia, Oct. pp. 157-178.
Carson, C and C. Hassel. (1994) Educating high risk Minnesotans about dietary fats, blood cholesterol and heart diseases Journal of the American Dietetic Association

47
Cesare, L., E. Forni, D. Viscardi and R.C. Nani. (2013). Changes in the Chemical Composition of Basil Caused by Different Drying Procedures, IVTPA, Milan, Italy
Chang, S.S., and J.M. Cook. (1983). Stability studies of stevioside and rebaudioside A in carbonated beverages. J. Agric. Food Chem. 31: 409-412.
Chatsudthipong, V and C. Muanprasat. (2009). Stevioside and related compounds:Therapeutic benefits beyond sweetness. Pharmacology & Therapeutics, 121,41–54.
Conway, W.S., and C.E. Sams, (1984). “Possible mechanism by which postharvest calcium treatment reduces decay in apples”, Phytopathology, Vol. 74, Vol. 2, pp. 208-210
Cramer, B and R. Ikan. (1987). Progress in the chemistry and properties of rebaudiosides. In: Grenby T.H., editor. Developments in sweeteners New York: Elsevier. pp 45–48.
Davoodia, M.G., P. Vijayanand, S.G. Kulkarnib and K.V.R. Ramana. (2007). Effect of different pre-treatments and dehydration methods on quality characteristics and storage stability of tomato powder. LWT-Food Technology, 40: 1832–1840
Devasagayam, T., J. Tilak, K. Boloor, K. Sane, S. Ghaskadbi and R. Lele. (2004). Free radicals and antioxidants in human health: Current status and future prospects. Journal of the Association of Physicians of India, 52, 794–804.
EC. (2011). Commission Regulation (EU) No 1131/2011 amending Annex II to Regulation (EC) No 1333/2008 of the European Parliament and of the Council with regard to steviol glycosides OJ L 295, 205-211 Elkins, Rita. 1997. Stevia: Nature's Sweetener. Woodland Pub.
EFSA. (2011). Statement of EFSA. Revised exposure assessment for steviol glycosides for the proposed uses as a food additive1European Food Safety Authority. 9(1):1972
Elkins, R. (1997). Stevia: Nature's Sweetener. Woodland Pub.19-24
Fellows, P. (1990). Food Processing Technology : Principles and Practise. Ellis Horwood Limited. New York.
Food and Agriculture Organization of the United Nations (FAO). (2004). Sugar crops and sweeteners and derived products. http://www.fao.org/es/faodef/fdef03e.htm. Accessible on 15 April 2013.

48
Goyal, S. K., R. K. Goyal and R.K. Samsher. (2010). "Stevia (Stevia rebaudiana) a bio-sweetener: a review."
Graham, H. N. (1992). Green tea, composition, consumption and polyphenols chemistry. Prev Med
Gurlek, G., N. Ozbalta and A. Gungor. (2009). Solar Tunnel Drying Characteristucs and Mathematical Modelling of Tomato. Isı Bilimi ve Tekniği Dergisi page 15-23, J. of Thermal Science and Technology
Helen, K. (2010). STEVIA - General Discussion. Available: http://www.dcnutrition.com/
Jaroslav P., H. Barbora and H. Tuulia. (2006). Characterization of Stevia rebaudiana by comprehensive two-dimensional liquid chromatography time-of-flight mass spectrometry. J. Chromatogr. doi:10. 1016/J.Chroma 04.050
Kahkonen M.P., A.I. Hopia, H.J. Vuorela, J.P. Rauha, K. Pihlaja, T.S. Kujala, K. Robards, P.D. Prenzler, G. Tucker, P. Swatsitang and W. Glower. (1999). Phenolic compounds and their role in oxidative processes in fruits. Food Chem; 66: 401–436.
Kao, Y.H., H. H. Chang, M. J. Lee and C.L. Chen. (2006). Tea, obesity, and diabetes. Mol Nutr Food Res.
Kaushal, M., K.D Sharma and A. Surekha. (2013). Effect of blanching on nutritional quality of dehydrated colocasia, Colocasia esculenta (L.) Schott leaves. Indian Journal of Natural Products and Resources, Vol. 4(2), pp. 161-164
Kemp, S., T. Hollowood and J. Hort. (2004). Sensory Evaluation, A Practical handbook. Singapore
Khokhar S., and S. G. M. Magnusdottir. (2002). Total phenol, catechin, and caffeine contents of teas commonly consumed in the United Kingdom. J Agric Food Chem.
Kim, J., Y. H. Choi and Y. H. Choi. (2002): Use of stevioside and cultivation of Stevia rebaudiana in Korea. In: Kinghorn, A.D. (Ed.), Stevia, the Genus Stevia. Medicinal and Aromatic Plants-Industrial Profiles, Vol. 19. Taylor and Francis, London and NY, pp. 196–202.
Labuza, T., K. Roe, C. Payne, F. Panda, T.J. Labuza, P.S Labuza and L. Krusch. (2004). Storage Stability of Dry Food Systems: Influence of State Changes During Drying and Storage.

49
The 14th International Drying Symposium (IDS 2004) Sao Paolo, Brazil, 22-25 August 2004, vol. A, pp. 48-68
Latapi, G. and M. Barrett. (2006). Influence of pre‐drying treatments on quality and safety of sun‐dried tomatoes. Part I: Use of steam blanching, boiling brine blanching, and dips in salt or sodium metabisulfite. Journal of Food Science, 71: 24–31
Lee, J. (2009). Green Tea: Flavor Characteristics of a Wide Range of Teas Including Brewing, Processing and Storage Variations and Consumer Acceptance of Teas in Three Countries. Kansa Satet University. America
Liu, J., C. P. Ong and SFY Li. (1997). Subcritical fluid extraction of stevia sweeteners from Stevia rebaudiana. J. Chromatogr. Science 35: 446-450.
Meilgaard, M., G.V Civille and B.T. Carr. (1999). Sensory Evaluation Techniques 3rd Edition. CRC Press. ASA
Melis, M.S. (1992). Renal excretion of stevioside in rats. J Nat Prod 1992;55(5):688–690.
Muftagil, N. (1985). The peroxidase enzyme activity of some vegetables and its resistance to heat, J Sci Food Agric, 36, 877-880.
Murcia,M. A, B. Lopez Ayerra, M. Martinez-Tome, A. M. Vera and F. Garcia-Carmona. (2000). Evaluation of ascorbic acid and peroxidase during industrial processing of broccoli, J Sci Food Agric, 80, 1882-1886
Namita, P., R. Mukesh and K.J. Vijay. (2012). Camellia Sinensis (Green Tea): A Review. Global Journal of Pharmacology 6 (2): 52-59, ISSN 1992-0075
Neely, G., and G. Borg. (1999). "The perceived intensity of caffeine aftertaste: Tasters versus nontasters." Chemical senses
Nutraingredients Com Lauded by Food Industry. (2004). http://www.foodqualitynews.com/Innovation/NutraIngredients.com-lauded -by-food-industry.
Owuor, P. O. (2003). Tea: analysis and tasting. In: Caballero B, Trugo LC, Finglas PM, editors. Encyclopedia of food sciences and nutrition. Oxford, UK: Academic Press. p 5757-5762.

50
Phillips, K.C. (1987) Stevia: Steps in developing a new sweetener. In: Grenby TH, editor. Developments in sweeteners New York
Porntewabancha, D and S. Prasong. (2010). Effect of pre-treatments on drying characteristics and colour of dried lettuce leaves. As. J Food Ag-Ind. 3(06), 580-586
Potter, N.N. (1978). Food Science 3rd edition. CBS Publisher. Delhi
Rice‐Evans, C., N. Miller and G. Paganga. (1997). Antioxidant properties of phenolic compounds. Trends Plant Sci. 1997 2: 152‐159
Sams, C.E., S.W. Conway, J.A. Abbott, R.J. Lewis and N. Benshalom, (1993). “Firmness and decay of apples following postharvest pressure infiltration of calcium and heat treatment”, J. Am. Soci. Hortic. Sci., Vol. 118, pp. 623-627
Sano, M., M. Tabata, M. Suzuki, M. Degawa, T. Miyase and M. Maeda-Yamamoto. (2001). Simultaneous determination of twelve tea catechins by high-performance liquid chromatography with electrochemical detection. Analyst.
Schwartz, S. J. and J. H. von Elbe. (1983). Kinetics of chlorophyll degradation to pyropheophytin in vegetables. Journal of Food Science, 48, 1303–1306.
Shi, J., M. Le‐Maguer, Y. Kakuda, A. Liptay and F. Niekamp. (1999). Lycopene degradation and isomerization in tomato dehydration. Food Res Int. 1999;32:15–21. doi: 10.1016/S0963‐9969(99)00059‐9
Singh, S., V. Garg; D. Yadav; M.N Beg and N. Sharma. (2012). In‐vitro Antioxidative and Antibacterial Activities of Various Parts of Stevia rebaudiana (Bertoni). International Journal of Pharmacy and Pharmaceutical Sciences. Vol 4, ISSN‐0975‐1491
SNI 3143:2011. (2011). Badan Standarisasi Nasional. Minuman Teh dalam Kemasan.
Sobukola, O.P., Dairo, O.U., Sanni, L.O., Odunewu, A.V. and Fadiolu, B.O. (2007). Thin layer drying process of some leafy vegetables under open sun. Food Science Technology, 13: 35–40
Soejarto D. D, C. M. Compadre, P. J. Medon, S. K. Kamath and A. D. Kinghorn. (1983). Potential sweetening agents of plant origin. II. Field search for sweet-tasting stevia species. Economic Botany 37: 71-79.

51
Soejarto, D. (2002). Botany of Stevia and Stevia rebaudiana. In A. Kinghorn (Ed.),Stevia: The genus Stevia (pp. 18–39). London, New York: Taylor and Francis.
Stanley, D.W., M.C. Bourne, A.P. Stone and W.V. Wismer, (1995). Low temperature blanching effects on chemistry, firmness and structure of canned green beans and carrots”, Food Sci., Vol . 60, pp. 327-333
Suttajit, M., U. Vinitketkaumnuen and U. Meevatee. (1993). Mutagenicity and human chromosomal effect of stevioside, a sweetener from Stevia rebaudiana Bertoni. Environ Health Perspect 101(3):53–56
Velic, D. and M. Bilic. (2007). Study of the Drying Kinetics of Granny Smith Apple in Tray Drier. Agriculture Conspectus Scientificus vol 72.
Vinson, J. A. (2000). Black and green tea and heart disease: a review. Biofactors.
von Elbe, J. H. and S. J. Schwartz. (1996). Colorants. In O. R.Fennema (Ed.), Food chemistry (pp. 651–722). New York: Marcel Dekker.
Watson, E. (2010). EFSA opinion paves way for EU approval of stevia-based sweeteners. Available:Foodnavigator.com
Wheeler, A., A. C. Boileau, P.C. Winkler, J. C. Compton, I. Prakash, X. Jiang and D. A. Mandarino. (2008). Pharmacokinetics of rebaudioside A and stevioside after single oral doses in healthy men, Food and Chemical Toxicology, doi: 10.1016/j.fct.2008.04.041
WHO. (2012). World Health Statistics 2012. www.epha.org. Accessible on 17 April 2013.
Yoshikawa, S. T. Ishima and O. Katayama. (1979). Taste of components of stevioside. Am. Chem. Soc., 177(1): 74.
Zimpel, A. (1996). Solar Drying of Chillies in Sri Lanka.AgMMA-Hohenheim University. Colombo.
52
Appendix 1. Worksheet, Scoresheet and Result of Trained Panelist Selection
WORKSHEET MATCHING TEST
Jenis rasa dasar Bahan Konsentrasi (g/L) Kode Manis Gula 20 A Asam Garam NaCl 2 B Asin Asam Sitrat 0,5 C Pahit Kafein 0,5 D
Kombinasi Urutan Penyajian
ABCD – BACD = 1 CABD – DABC = 7
ABDC – BADC = 2 CADB – DACB = 8
ACBD – BCAD = 3 CBDA – DBAC = 9
ACDB – BCDA = 4 CBAD – DBCA = 10
ADBC – BDAC = 5 CDAB – DCBA = 11
ADCB – BDCA = 6 CDBA – DCAB = 12
Tabel Rekap Kode Sampel
Sampel A (a=1) (b=2) a 576 437 308 299 180 685 764 853 902 249 398 477 b 280 894 646 725 349 428 507 616 191 389 478 507
Sampel B (a=3) (b=4) a 350 192 261 409 578 627 736 895 984 489 588 667 b 707 361 490 529 678 143 282 311 450 608 767 826
Sampel C (a=5) (b=6) a 144 580 392 471 649 788 827 986 293 382 243 194 b 789 670 175 551 185 244 363 898 402 195 907 313
Sampel D (a=7) (b=8) a 483 196 621 790 245 344 502 611 166 403 889 958 b 107 236 385 464 503 810 711 989 305 622 167 246

53
Urutan Penyajian :
Booth Panelis Kode Penyajian Booth Panelis Kode Penyajian
1 1 576 350 144 483 –
707 280 789 107
1 7 827 764 736 502 –
711 507 282 363
2 2 437 192 196 580 –
361 894 236 670
2 8 986 853 611 895 –
989 616 898 311
3 3 308 392 261 621 –
490 175 646 385
3 9 293 984 166 902 –
305 450 191 402
4 4 299 471 790 409 –
529 551 464 725
4 10 382 489 249 403 –
622 608 195 389
5 5 180 245 578 649 –
678 503 349 185
5 11 243 889 398 588 –
167 907 767 478
6 6 685 344 788 627 –
143 810 244 428
6 12 194 958 667 477 –
246 313 507 826
54
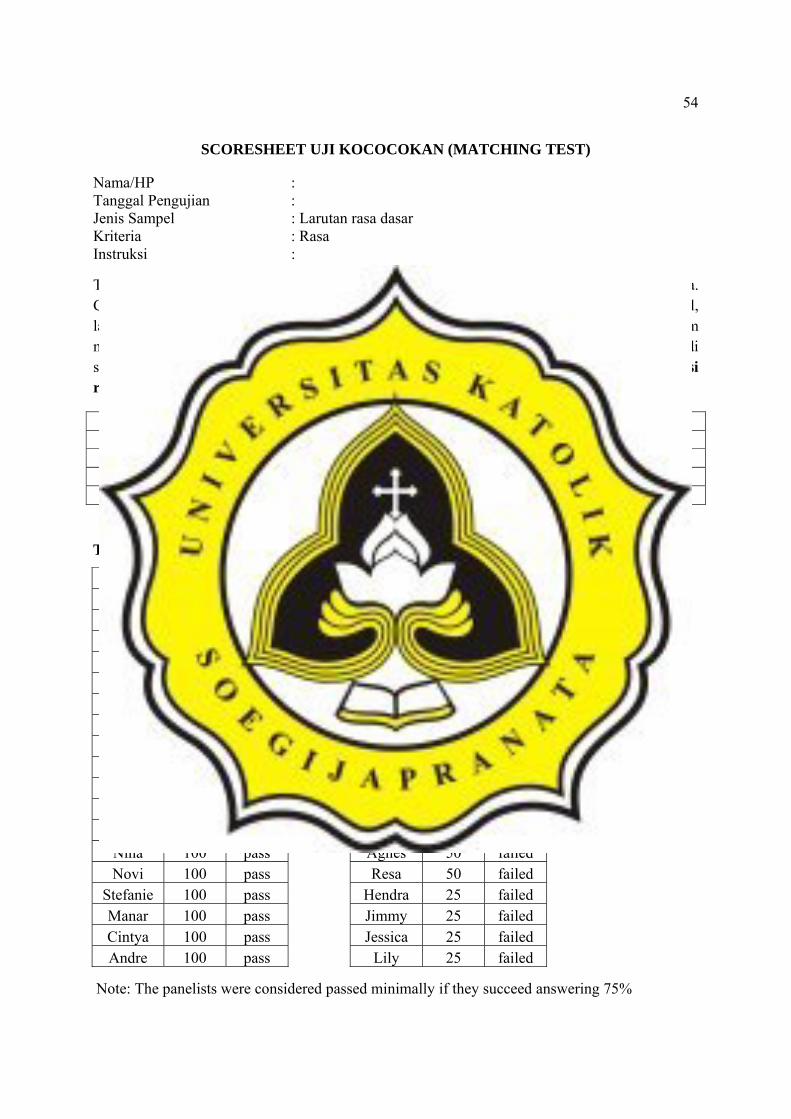
SCORESHEET UJI KOCOCOKAN (MATCHING TEST)
Nama/HP : Tanggal Pengujian : Jenis Sampel : Larutan rasa dasar Kriteria : Rasa Instruksi :
Tulislah kode sampel berurutan dari atas ke bawah dimulai dari sampel di sebelah kanan Anda. Cicipilah sampel larutan yang terdapat di sebelah kanan Anda. Setelah mencicipi satu sampel, lakukan pembilasan lidah dengan meminum air mineral dan berikan jeda ±20 detik sebelum mencicipi sampel berikutnya. Pasangkan dengan tepat rasa yang Anda cicip pada larutan di sebelah kanan dengan salah satu larutan yang ada di sebelah kiri Anda. Kemudian identifikasi rasa yang Anda cicipi.
Kode sampel kanan Kode sampel kiri Identifikasi rasa
~ Terima kasih, Tuhan memberkati ~
The Result of Matching Test
Panelists % True Exp Panelists % True Exp Tasya 100 pass Adri 75 pass
Michaela 100 pass Edo 75 pass Melita 100 pass Silvi 75 pass Selly 100 pass Miko 75 pass Felita 100 pass Ion 50 failed
Anthony 100 pass Ika 50 failed Julius 100 pass Dewi 50 failed Oxi 100 pass Dipta 50 failed
Ivana 100 pass Stella 50 failed Tomi 100 pass Graytta 50 failed
Vincent 100 pass Rendy 50 failed Kiki 100 pass Riko 50 failed Nina 100 pass Agnes 50 failed Novi 100 pass Resa 50 failed
Stefanie 100 pass Hendra 25 failed Manar 100 pass Jimmy 25 failed Cintya 100 pass Jessica 25 failed Andre 100 pass Lily 25 failed
Note: The panelists were considered passed minimally if they succeed answering 75%

55
WORKSHEET TRIANGLE TEST
Order of Presentation
AAX ; AXA ; XAA = 1, 7
AXX ; XAX ; XXA = 2, 8
AXX ; XAX ; XXA = 3, 9
XAA ; AXA ; AAX = 4, 10
AAX ; XAA ; AXA = 5, 11
XXA ; AXX ; XAX = 6, 12
Tabel Rekap Kode Sampel:
SAMPEL A
311, 101, 400, 373, 523, 876, 705, 246, 903, 464, 115, 890, 648, 395, 789, 432, 557, 854, 604, 955
SAMPEL X
368, 409, 786, 110, 499, 506, 908, 811, 342, 459, 556, 774, 803, 655, 918, 413, 300, 287, 449, 673
Urutan Penyajian:
Booth Panelis Kode Penyajian Booth Panelis Kode Penyajian 1 1 311 101 368;
400 409 373; 786 523 876
1 7 311 101 368; 400 409 373; 786 523 876
2 2 705 110 499; 506 246 908; 811 342 903
2 8 705 110 499; 506 246 908; 811 342 903
3 3 464 459 556; 774 115 803; 655 918 890
3 9 464 459 556; 774 115 803; 655 918 890
4 4 413 648 395; 789 300 432; 557 854 287
4 10 413 648 395; 789 300 432; 557 854 287
5 5 604 955 449; 673 311 101; 400 409 523
5 11 604 955 449; 673 311 101; 400 409 523
6 6 803 774 648; 854 413 287; 673 903 556
6 12 803 774 648; 854 413 287; 673 903 556

56
SCORESHEET UJI SEGITIGA (TRIANGLE TEST)
Nama/HP : Tanggal Pengujian : Jenis Sampel : Teh hijau Instruksi :
Di hadapan Anda terdapat tiga set sampel; di mana setiap set terdiri atas tiga sampel yang terdiri atas dua sampel sama dan satu sampel berbeda. Lakukan pembilasan dengan air mineral sebelum dan setelah mencicipi sampel, serta berikan jeda ± 20 detik untuk mencicipi sampel berikutnya. Cicipilah sampel dari kiri ke kanan. Pencicipan hanya boleh dilakukan satu kali dan tidak diperkenankan mengulang. Identifikasi sampel yang berbeda dengan menulis kode sampel pada kolom di bawah ini.
Set Kode sampel Kode sampel beda 1 2 3
~ Terima kasih, Tuhan memberkati ~
The Result of Triangle Test
Panelists % True Exp Panelists % True Exp
Tasya 100 pass Edo 100 pass Michaela 100 pass Novi 100 pass
Melita 100 pass Stefanie 100 pass Selly 100 pass Manar 100 pass Miko 100 pass Cintya 100 pass
Anthony 100 pass Adri >60 pass Julius 100 pass Vincent >60 pass Oxi 100 pass Tomi 0 failed
Ivana 100 pass Felita 0 failed Kiki 100 pass Andre 0 failed Nina 100 pass Silvi 0 failed
Note: The panelists were considered passed minimally if they answered 60% of the test correctly

57
WORKSHEET UJI RANKING INTENSITAS
Teh Hijau + Gula 1 gram Sampel A
Teh Hijau + Gula 2 gram Sampel B
Teh Hijau + Gula 3 gram Sampel C
Teh Hijau + Gula 4 gram Sampel D
Kombinasi urutan penyajian:
A B D C = 1, 5, 9
B C A D = 2, 6, 10
C D B A = 3, 7, 11
D A C B = 4, 8, 12
Tabel Rekap Kode Sampel:
SAMPEL A (2) 111 200 349 468 577 636 795 884 903 280 SAMPEL B (4) 450 698 222 371 559 896 103 668 777 490 SAMPEL C (6) 383 551 204 878 650 195 234 442 997 501 SAMPEL D (8) 404 197 286 315 583 672 771 820 919 395
Urutan Penyajian:
Booth 1 111 450 404 383
Booth 2 698 551 200 197
Booth 3 204 286 222 349
Booth 4 315 468 878 371
Booth 5 577 559 583 650

58
Booth 6 896 195 636 672
Booth 7 234 771 103 795
Booth 8 820 884 442 668

59
SCORESHEET UJI RANKING INTENSITAS
Nama/HP : Tanggal Pengujian : Produk : Teh Hijau Atribut : Tingkat Kemanisan Instruksi :
Di hadapan Anda terdapat 4 sampel teh hijau. Berikan jeda waktu ± 20 detik sebelum melakukan pengujian terhadap sampel. Lakukanlah pengujian sensori terhadap tingkat kemanisan dengan meminum setiap sampel. Urutkanlah sampel dengan tingkat kemanisan paling rendah hingga paling tinggi. Tuliskan kode sampel yang sesuai pada kolom sebelah kanan
Tabel Penilaian Sensori :
Tingkat Kemanisan Kode Sampel Paling tidak manis
Paling manis
~ Terima kasih, Tuhan memberkati ~
The Result of Ranking Test
Panelists % True Exp Panelists % True Exp Tasya 100 pass Nina 100 pass Manar 100 pass Novi 75 failed Selly 100 pass Edo 50 failed Miko 100 pass Adri 25 failed
Anthony 100 pass Michaela 0 failed Julius 100 pass Melita 0 failed Oxi 100 pass Cintya 0 failed
Ivana 100 pass Vincent 0 failed Kiki 100 pass Stefanie 0 failed
Note: The panelists were considered passed if they answered correctly

60
Appendix 2. Scoresheet of Main Sensory Test
SCORESHEET UJI RATING INTENSITAS
Nama : Tanggal Pengujian : Produk : Stevia Green Tea Atribut : Tingkat Kemanisan Instriksi :
Di hadapan Anda telah tersedia 4 sampel. Tulislah kode dan minumlah setiap sampel berurutan
dari kiri ke kanan. Minumlah air mineral setiap kali akan berganti sampel. Lingkarilah garis yang
paling sesuai untuk setiap sampel berikut.
Nomor Sampel: ………..
Nomor Sampel: ………..
Nomor Sampel: ………..
Nomor Sampel: ………..
1 7 Tawar Sangat manis 4
Manis
1 7 Tawar Sangat manis 4
Manis
1 7 Tawar Sangat manis 4
Manis
1 7 Tawar Sangat manis 4
Manis

61
SCORESHEET UJI RATING INTENSITAS Nama : Tanggal Pengujian : Produk : Stevia Green Tea Atribut : Warna Instriksi :
Di hadapan Anda telah tersedia 4 sampel. Tulislah kode dan amatilah setiap sampel berurutan
dari kiri ke kanan. Lingkarilah garis yang paling sesuai untuk setiap sampel berikut.
Nomor Sampel: ………..
Nomor Sampel: ………..
Nomor Sampel: ………..
Nomor Sampel: ………..
1 7 Kuning Bening Coklat 4
Kuning Kecoklatan
1 7 Kuning Bening Coklat 4
Kuning Kecoklatan
1 7 Kuning Bening Coklat 4
Kuning Kecoklatan
1 7 Kuning Bening Coklat 4
Kuning Kecoklatan
62
SCORESHEET UJI RATING INTENSITAS Nama : Tanggal Pengujian : Produk : Stevia Green Tea Atribut : Aroma Instriksi :
Di hadapan Anda telah tersedia 4 sampel. Tulislah kode dan hirup aroma setiap sampel berurutan
dari kiri ke kanan. Lingkarilah garis yang paling sesuai untuk setiap sampel berikut.
Nomor Sampel: ………..
Nomor Sampel: ………..
Nomor Sampel: ………..
Nomor Sampel: ………..
1 7 Tidak beraroma Sangat kuat 4
Kuat
1 7 Tidak beraroma Sangat kuat 4
Kuat
1 7 Tidak beraroma Sangat kuat 4
Kuat
1 7 Tidak beraroma Sangat kuat 4
Kuat
63
SCORESHEET UJI RATING INTENSITAS Nama : Tanggal Pengujian : Produk : Stevia Green Tea Atribut : Bitter Aftertaste Instriksi :
Di hadapan Anda telah tersedia 4 sampel. Tulislah kode dan nilailah setiap sampel berurutan dari
kiri ke kanan. Minumlah air mineral setiap kali akan berganti sampel. Lingkarilah garis yang
paling sesuai untuk setiap sampel berikut.
Nomor Sampel: ………..
Nomor Sampel: ………..
Nomor Sampel: ………..
Nomor Sampel: ………..
1 7 Tawar Sangat pahit 4
Pahit
1 7 Tawar Sangat pahit 4
Pahit
1 7 Tawar Sangat pahit 4
Pahit
1 7 Tawar Sangat pahit 4
Pahit

64
SCORESHEET UJI RATING INTENSITAS Nama : Tanggal Pengujian : Produk : Stevia Green Tea Atribut : Aftertaste Astringent / Sepat Instriksi :
Di hadapan Anda telah tersedia 4 sampel. Tulislah kode dan nilailah setiap sampel berurutan dari
kiri ke kanan. Minumlah air mineral setiap kali akan berganti sampel. Lingkarilah garis yang
paling sesuai untuk setiap sampel berikut.
Nomor Sampel: ………..
Nomor Sampel: ………..
Nomor Sampel: ………..
Nomor Sampel: ………..
1 7 Tawar Sangat sepat
4 Sepat
1 7 Tawar Sangat sepat
4 Sepat
1 7 Tawar Sangat sepat
4 Sepat
1 7 Tawar Sangat sepat
4 Sepat

65
SCORESHEET UJI RANKING HEDONIK Nama : Tanggal Pengujian : Produk : Stevia Green Tea Atribut : Overall Liking Instriksi :
Silahkan urutkan sampel yang paling Anda sukai (=4) hingga sampel yang paling tidak Anda
sukai (=1). Tuliskan kode sampel pada kolom sebelah kiri dan nilai ranking sampel (tidak boleh
dobel) pada kolom sebelah kanan.
Kode Sampel Ranking (Jangan ada yang dobel)

66
Appendix 3. pH Value of Chemical Blanching Solutions
Chemical Blanching Solutions pH Sodium Bicarbonate 0.1 % 8.21 Sodium Bicarbonate 0.5 % 8.28 Sodium Bicarbonate 1 % 8.43 Calcium Chloride 0.1 % 7.20 Calcium Chloride 0.5 % 7.53 Calcium Chloride 1 % 7.78
Appendix 4. Output of Anova on Color analysis
Color Analysis L t-0
Color analysis L t-140
ANOVA
Value
863.853 6 143.975 58.914 .00034.214 14 2.444
898.066 20
Between GroupsWithin GroupsTotal
Sum ofSquares df Mean Square F Sig.
Value
Duncana
3 21.61503 23.77503 31.79503 33.6683 33.66833 36.1350 36.13503 38.1750 38.17503 39.3783
.113 .164 .074 .132 .362
TreatmentsSodium 1%Sodium 0.5%Sodium 0.1%Calcium 0.1%Calcium 1%Calcium 0.5%ControlSig.
N 1 2 3 4 5Subset for alpha = .05
Means for groups in homogeneous subsets are displayed.Uses Harmonic Mean Sample Size = 3.000.a.

67
Color Analysis a* t-0
ANOVA
Value
580.161 6 96.693 28.173 .00048.051 14 3.432
628.212 20
Between GroupsWithin GroupsTotal
Sum ofSquares df Mean Square F Sig.
Value
Duncana
3 18.67673 23.47833 26.5700 26.57003 27.7800 27.78003 30.2933 30.29333 31.48503 36.1767
1.000 .060 .437 .119 .444 1.000
TreatmentsSodium 1%Sodium 0.5%Sodium 0.1%ControlCalcium 0.1%Calcium 0.5%Calcium 1%Sig.
N 1 2 3 4 5 6Subset for alpha = .05
Means for groups in homogeneous subsets are displayed.Uses Harmonic Mean Sample Size = 3.000.a.
ANOVA
Value
159.012 6 26.502 5.706 .00365.019 14 4.644
224.031 20
Between GroupsWithin GroupsTotal
Sum ofSquares df Mean Square F Sig.

68
Color Analysis a* t-140
Color analysis b* t-0
Value
Duncana
3 -13.11003 -11.8083 -11.80833 -9.4483 -9.4483 -9.44833 -9.3633 -9.3633 -9.36333 -8.5050 -8.50503 -6.6683 -6.66833 -4.2867
.068 .104 .166 .197
TreatmentsControlCalcium 1%Calcium 0.5%Sodium 0.1%Calcium 0.1%Sodium 0.5%Sodium 1%Sig.
N 1 2 3 4Subset for alpha = .05
Means for groups in homogeneous subsets are displayed.Uses Harmonic Mean Sample Size = 3.000.a.
ANOVA
Value
64.559 6 10.760 13.969 .00010.784 14 .77075.343 20
Between GroupsWithin GroupsTotal
Sum ofSquares df Mean Square F Sig.
Value
Duncana
3 -5.93173 -5.13673 -4.77503 -4.54333 -2.90833 -1.8517 -1.85173 -.7733
.094 .162 .155
TreatmentsCalcium 1%Calcium 0.1%Calcium 0.5%Sodium 0.5%Sodium 0.1%Sodium 1%ControlSig.
N 1 2 3Subset for alpha = .05
Means for groups in homogeneous subsets are displayed.Uses Harmonic Mean Sample Size = 3.000.a.

69
Color analysis b* t-140
ANOVA
Value
909.678 6 151.613 37.190 .00057.073 14 4.077
966.751 20
Between GroupsWithin GroupsTotal
Sum ofSquares df Mean Square F Sig.
Value
Duncana
3 2.88333 5.95003 14.79673 15.55003 19.82673 19.96673 20.5250
.084 .655 .694
TreatmentsSodium 1%Sodium 0.5%Calcium 0.1%Sodium 0.1%Calcium 0.5%ControlCalcium 1%Sig.
N 1 2 3Subset for alpha = .05
Means for groups in homogeneous subsets are displayed.Uses Harmonic Mean Sample Size = 3.000.a.
ANOVA
Value
464.822 6 77.470 44.402 .00024.426 14 1.745
489.248 20
Between GroupsWithin GroupsTotal
Sum ofSquares df Mean Square F Sig.

70
Appendix 5. Output of Anova on Antioxidant analysis
Value
Duncana
3 2.69833 5.41833 10.53173 11.6033 11.60333 13.4867 13.48673 14.9000 14.90003 16.7667
1.000 1.000 .337 .103 .211 .105
TreatmentsSodium 1%Sodium 0.5%Sodium 0.1%ControlCalcium 0.1%Calcium 0.5%Calcium 1%Sig.
N 1 2 3 4 5 6Subset for alpha = .05
Means for groups in homogeneous subsets are displayed.Uses Harmonic Mean Sample Size = 3.000.a.
ANOVA
Hasil
208.660 7 29.809 19.476 .00024.489 16 1.531
233.149 23
Between GroupsWithin GroupsTotal
Sum ofSquares df Mean Square F Sig.
Hasil
Duncana
3 80.0828843 84.4370773 85.406824 85.4068243 85.757701 85.7577013 85.818483 85.8184833 86.995441 86.9954413 88.747065 88.7470653 90.808123
1.000 .226 .166 .102 .058
PerlakuanControlCalcium 0.5Sodium 1Calcium 0.1Sodium 0.5Sodium 0.1Calcium 1FreshSig.
N 1 2 3 4 5Subset for alpha = .05
Means for groups in homogeneous subsets are displayed.Uses Harmonic Mean Sample Size = 3.000.a.

71
Appendix 6. Output of Anova on Sweetness analysis
ANOVA
Hasil
19.301 7 2.757 290.093 .000.152 16 .010
19.453 23
Between GroupsWithin GroupsTotal
Sum ofSquares df Mean Square F Sig.
Hasil
Duncana
3 1.5941673 3.8504633 4.0384263 4.2935193 4.3039813 4.3105563 4.365278 4.3652783 4.526759
1.000 1.000 1.000 .419 .059
PerlakuanSegarKontrolSodium 1Sodium 0,1Sodium 0,5Calcium 1Calcium 0,1Calcium 0,5Sig.
N 1 2 3 4 5Subset for alpha = .05
Means for groups in homogeneous subsets are displayed.Uses Harmonic Mean Sample Size = 3.000.a.

72
Appendix 7. Focus Group Discussion Anchor Points
Anchor Point
1 4 7
Sweetness Mineral Water Sucrose 7 g + 1 Green Tea Bag +
250 ml Mineral Water
Sucrose 15 g + 1 Green Tea Bag +
250 ml Mineral Water
Color 1 Green Tea Bag + 250 ml
Mineral Water
Green Tea - Stevia 1 g +
250 ml Mineral Water
1 Black Tea Bag + 250 ml Mineral
Water
Aroma Mineral Water Green Tea - Stevia 1 g + 250 ml
Mineral Water
Green Tea - Stevia 1.75 g + 250 ml
Mineral Water
Bitter Aftertaste Mineral Water 0.5 g Black Coffee + 250 ml Mineral
Water
1.5 g Black Coffee + 250 ml Mineral
Water
Astringent Aftertaste Mineral Water 1 Black Tea Bag + 250 ml Mineral
Water
1 Green Tea Bag + 250 ml Mineral
Water

73
Appendix 8. Analysis of Main Sensory Test
Overall Liking
Sweetness
Color
Ranks
2.561.673.562.22
Sucrose_6Stevia_0.2Stevia_0.4Stevia_0.6
Mean Rank
Test Statisticsa
910.200
3.017
NChi-SquaredfAsymp. Sig.
Friedman Testa.
Ranks
2.221.442.613.72
Sucrose_6Stevia_0.2Stevia_0.4Stevia_0.6
Mean Rank
Test Statisticsa
914.730
3.002
NChi-SquaredfAsymp. Sig.
Friedman Testa.
Ranks
1.171.943.003.89
Sucrose_6Stevia_0.2Stevia_0.4Stevia_0.6
Mean Rank

74
Aroma
Bitter Aftertaste
Test Statisticsa
923.292
3.000
NChi-SquaredfAsymp. Sig.
Friedman Testa.
Ranks
1.441.943.063.56
Sucrose_6Stevia_0.2Stevia_0.4Stevia_0.6
Mean Rank
Test Statisticsa
916.271
3.001
NChi-SquaredfAsymp. Sig.
Friedman Testa.
Ranks
1.222.503.223.06
Sucrose_6Stevia_0.2Stevia_0.4Stevia_0.6
Mean Rank
Test Statisticsa
913.449
3.004
NChi-SquaredfAsymp. Sig.
Friedman Testa.
75
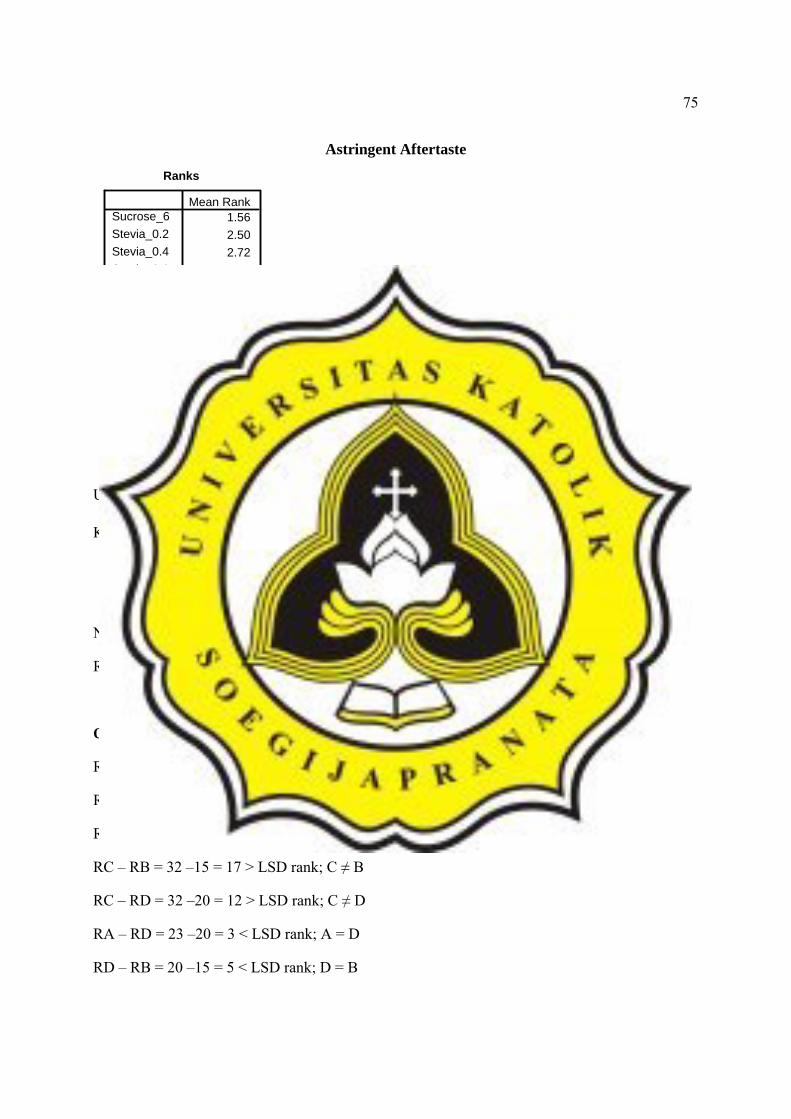
Astringent Aftertaste
Uji LSD rank (manual) = t α 2,∞ x ( ) 61ttp ÷+×××
Keterangan: t α 2,∞ untuk a = 5% nilainya 1,960
p = jumlah panelis
t = jumlah perlakuan
Nilai LSD rank = 1,960 x 5.47 = 10.73
RA = Sucrose 6%; RB = Stevia 0.2%; RC = Stevia 0.4%; RD = Stevia 0.6%
Overall Liking
RA = 23; RB = 15; RC = 32; RD = 20
RA – RB = 23 – 15 = 8 < LSD rank; A = B
RC – RA = 32 – 23 = 59 = 9 < LSD rank; C = A
RC – RB = 32 –15 = 17 > LSD rank; C ≠ B
RC – RD = 32 –20 = 12 > LSD rank; C ≠ D
RA – RD = 23 –20 = 3 < LSD rank; A = D
RD – RB = 20 –15 = 5 < LSD rank; D = B
Ranks
1.562.502.723.22
Sucrose_6Stevia_0.2Stevia_0.4Stevia_0.6
Mean Rank
Test Statisticsa
97.989
3.046
NChi-SquaredfAsymp. Sig.
Friedman Testa.

76
Sweetness
RA = 29; RB = 24; RC = 35; RD = 47
RD – RA = 47 – 29 = 18 > LSD rank; D ≠ A
RD – RB = 47 – 24 = 23 > LSD rank; D ≠ B
RD – RC = 47 – 35 = 12 > LSD rank; D ≠ C
RC – RA = 35 – 29 = 6 < LSD rank; C = A
RC – RB = 32 –24 = 11 > LSD rank; C ≠ B
RA – RB = 29 – 24 = 5 < LSD rank; A = B
Color
RA = 12; RB = 23; RC = 36; RD = 50
RD – RA = 50 – 12 = 38 > LSD rank; D ≠ A
RD – RB = 50 – 23 = 27 > LSD rank; D ≠ B
RD – RC = 50 – 36 = 14 > LSD rank; D ≠ C
RC – RA = 36 – 12 = 24 >LSD rank; C ≠ A
RC – RB = 36 – 23 = 13 > LSD rank; C ≠ B
RB – RA = 23 – 12 = 11 >LSD rank; B ≠ A
Aroma
RA = 24; RB = 28; RC = 41; RD = 47
RD – RA = 47 – 24 = 23 > LSD rank; D ≠ A
RD – RB = 47 – 28 = 19 > LSD rank; D ≠ B
RD – RC = 47 – 41 = 6 < LSD rank; D = C
RC – RA = 41 – 24 = 17 > LSD rank; C ≠ A
77
RC – RB = 41 – 28 = 13 > LSD rank; C ≠ B
RB – RA = 28 – 24 = 4 < LSD rank; B = A
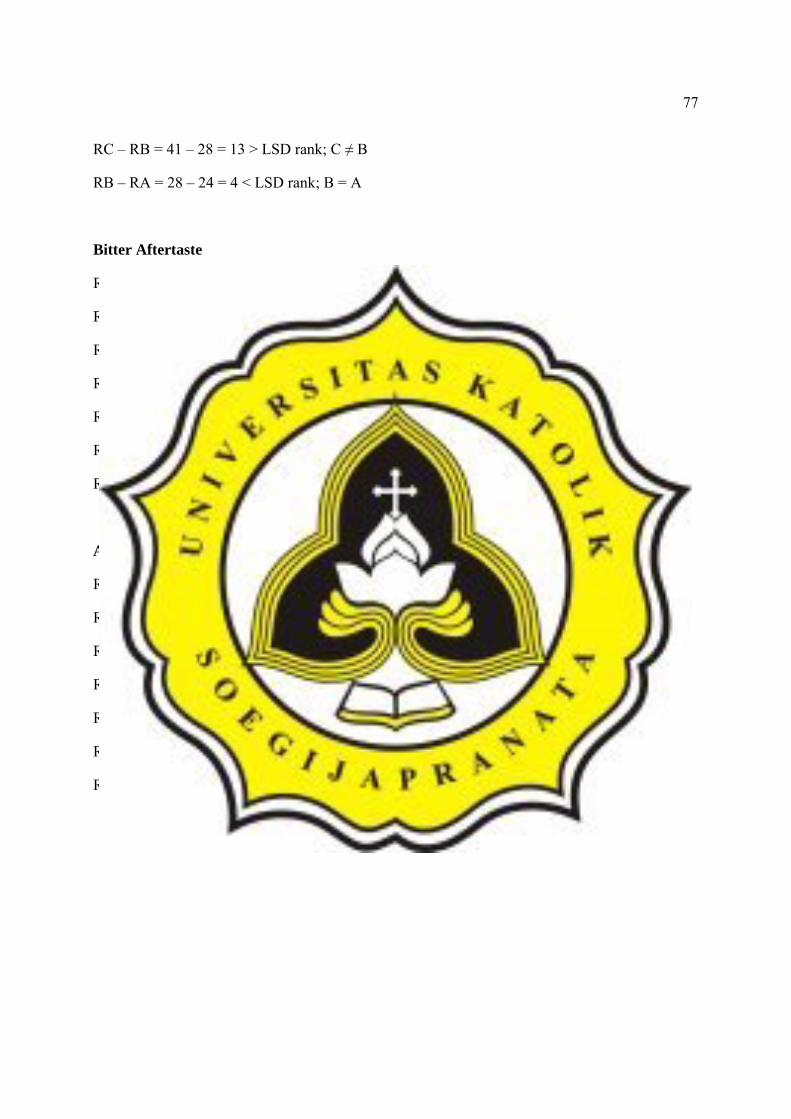
Bitter Aftertaste
RA = 23; RB = 36; RC = 41; RD = 44
RD – RA = 44 – 23 = 21 > LSD rank; D ≠ A
RD – RB = 44 – 36 = 8 > LSD rank; D = B
RD – RC = 44 – 41 = 3 < LSD rank; D = C
RC – RA = 41 – 23 = 8 > LSD rank; C ≠ A
RC – RB = 41 – 36 = 5 > LSD rank; C = B
RB – RA = 36 – 23 = 13 < LSD rank; B ≠ A
Astringent Aftertaste
RA = 27; RB = 36; RC = 39; RD = 49
RD – RA = 49 – 27 = 22 > LSD rank; D ≠ A
RD – RB = 49 – 36 = 13 > LSD rank; D ≠ B
RD – RC = 49 – 39 = 10 < LSD rank; D = C
RC – RA = 39 – 27 = 12 > LSD rank; C ≠ A
RC – RB = 39 – 36 = 3 > LSD rank; C = B
RB – RA = 36 – 27 = 9 < LSD rank; B = A