6. sciamachy in-orbit operations and performance
TRANSCRIPT

91
6. SCIAMACHY In-orbit Operations and Performance M. Gottwald1, K. Bramstedt2, R. Snel3, M. Krijger3, G. Lichtenberg1, S. Slijkhuis1, C. von Savigny2, S. Noël2, E. Krieg1 1 Remote Sensing Technology Institute, German Aerospace Center (DLR-IMF), Oberpfaffenhofen, 82234 Wessling, Germany 2 Institute of Environmental Physics / Institute of Remote Sensing (IUP-IFE), University of Bremen, Otto-Hahn-Allee 1, 28359 Bremen, Germany 3 SRON, Netherlands Institute for Space Research, Sorbonnelaan 2, 3584 CA Utrecht, The Netherlands Abstract: Since the launch in early 2002 SCIAMACHY has successfully operated in low-Earth orbit for more than 8 years. For the first several months, a challenging Commissioning Phase programme was executed. It successively brought SCIAMACHY into full operation mode and verified the instrument’s functional capabilities. In early August 2002, quasi-routine measurements executing nominal mission scenarios could start. In January 2003, the routine operations phase commenced. Since then SCIAMACHY is kept under strict configuration control. Because of the harsh space environment the instrument is subject to degradation, both optically and thermally. The optical performance is described by the throughput which is a measure for how optical components in a light path age with time. It also includes characterisation of optical imperfections such as scan angle dependence, channel 7 light leak and spatial stray light. Illustrating the thermal performance includes decontaminations, used to tackle the ice layers in channels 7 and 8, and configuration of the thermal control systems to respond to degradation. Finally, the improvement of the line-of-sight performance by determination of mispointing angles achieved the best possible pointing knowledge. This was especially needed for the retrieval of accurate limb data products. The current excellent status of SCIAMACHY is a prerequisite for successfully accomplishing the intended ENVISAT mission extension until 2013. Keywords: Commissioning Phase – Routine operations – Optical performance – Thermal performance – Line-of-sight performance – Mission extension On 1 March 2002 at 1:07 UTC, SCIAMACHY was lifted into space from Kourou as part of the ENVISAT mission (Fig. 6-1). The highly precise injection into a sun-synchronous orbit saved fuel so that, from an orbit maintenance point of view, an extension of the mission lifetime beyond the specified five years became possible. At about 02:53:51 UTC, ENVISAT crossed the Earth’s equator on the night side for the first time corresponding to the start of absolute orbit no. 1. Since then until the end of 2009, more than 40000 orbits have been executed.
SCIAMACHY’s initial operational programme reflects the requirements of the overall ENVISAT mission and the specific needs of the instrument. It was the goal to reach routine operations as soon as possible but also to perform a thorough in-orbit functional check-out and verification of the instrument. SCIAMACHY mission phases consisted of the launch and early operation phase (LEOP), the switch-on and data acquisition phase (SODAP), the main validation phase with quasi-routine operations and finally, the routine operations phase. SODAP and main validation phase formed the Commissioning Phase. A time schedule is presented in Table 6-1. 6.1 Commissioning Phase Establishing the instrument activities in the Commissioning Phase, particularly SODAP, required assembling a plan that includes engineering and specific measurement tasks. This plan had to provide a continuous, conflict-free schedule at instrument, as well as on ENVISAT level, which finally permitted the declaration that SCIAMACHY was ready for routine operations (Table 6-1). The

92
approach was to start with separate planning of engineering and measurement tasks, to integrate both in order to obtain a complete SCIAMACHY flow, and to insert this flow into the overall ENVISAT SODAP plan.
Engineering Tasks Instrument operations on command and control level are described in the Instrument Operation Manual (IOM). The IOM provides the ENVISAT Flight Operation Control Center (FOCC) with all information necessary to properly operate and maintain the instrument. During SODAP, the instrument capabilities which may later be used on a routine basis had to be functionally tested and verified, both in nominal and non-nominal situations. In addition, engineering settings for dedicated subsystems had to be derived. The engineering SODAP tasks comprised:
─ mode transitions with associated parameters ─ thermal operations including decontamination ─ flight procedures ─ routine monitoring ─ processor patch and dump
These were supplemented by dedicated operations that occurred only once during SODAP. Major activities included the release of the azimuth and elevation aperture cover mechanisms and the opening of the SCIAMACHY Radiant Cooler (SRC) door.
Many of the engineering functions had been tested during phase C/D on-ground. Thermal operations, however, were executed for the first time under in-orbit conditions. Therefore, emphasis was put on a thorough verification of the thermal subsystems Active Thermal Control (ATC), Thermal Control (TC) and Radiant Cooler. The goal was to characterise the subsystems well enough in order to
Fig. 6-1:ENVISAT launch (Photo: ESA)

93
be able to routinely select the correct parameter settings suitable to maintain Optical Bench Module (OBM) and detector temperatures within specified limits after the end of SODAP.
Phase Instrument Activity Date Orbit
LEOP OFF-Leo mode 1/7 Mar 2002
SODAP first switch-on 11 Mar 2002 147
first MPS driven operations 17 Mar 2002 238
first decontamination 18 Mar 2002 253
AZACM cover released 3 Apr 2002 477
SRC released 15 Apr 2002 653
first lunar measurement 22 Apr 2002 753
final ATC/TC settings loaded 10 Jun 2002 1454
ELACM cover released 20 Jun 2002 1594
states loaded 17 Jul 2002 1982
timelines with states loaded 18 Jul 2002 1990
end SODAP (remaining SODAP measurements inserted as SODAP in validation phase)
2 Aug 2002 2204
Validation start validation 2 Aug 2002 2204
end SODAP measurements 14 Dec 2002 4127
final flight states loaded 15 Dec 2002 4143
timelines with final flight states loaded 16 Dec 2002 4151
first non-nominal decontamination started 19 Dec 2002 4204
Routine Operations
nominal measurement programme since 6 Jan 2003 4457
Table 6-1: SCIAMACHY activities from launch to end of Commissioning Phase.
Measurement Tasks The flexibility of the instrument required verification of many different functionalities and characterisation of a large set of parameters. In order to ensure a thorough testing of all instrument capabilities, a call for proposals was issued to all parties involved in the instrument development. All proposals underwent a review process and finally, more than 110 proposals were accepted. Some of them proposed to verify whether the states defined for routine operations worked as expected, but the majority proposed to specify new states. Each new state corresponded to a new instrument on-board configuration that had to be commanded via the upload of measurement parameter CTI (Configurable Transfer Item) tables. Individual states, new ones and those already existing, were assembled to generate specific timelines. Execution of the states was triggered via the start of such SODAP specific timelines scheduled via the ENVISAT Mission Planning System (MPS).
Since some commissioning objectives required particular instrument configurations – e.g. aperture covers released, a certain thermal status – or needed the output of other objectives as a precondition, it was impossible to generate the full SCIAMACHY SODAP measurement plan by simply concatenating all the objectives. Furthermore, all lunar measurements could only be performed in the short monthly visibility periods. Therefore, engineering and measurement tasks were integrated at the level of individual objectives, thus ensuring that all instrument prerequisites were fulfilled and the overall ENVISAT SODAP schedule adhered to. The result was the SCIAMACHY On-Board Operation Plan (SCOOP), an Excel based database of the complete SODAP period. It split this period

94
into engineering and measurement windows. In an engineering window, SCIAMACHY operation was procedure driven, while in a measurement window, the instrument operations were timeline driven and controlled by the ENVISAT MPS. The measurement windows were arranged so that on entry and exit the instrument was in a well defined configuration and all timelines and states scheduled therein executed just those measurements compliant with this configuration. The SODAP Sequence At the time of launch, the SODAP specific planning information – SCOOP, states and timelines – was available and ready for activation. The ENVISAT SODAP plan had scheduled SCIAMACHY’s first switch-on for orbit 147 (11th March), eleven days after launch. Six days later (17th March), the instrument was controlled for the first time by the ENVISAT MPS when the first timeline was executed, which ran successfully the Full Functional Test. Because all aperture covers were still closed, no external light was collected and only light from the internal calibration sources was used. The sequence of engineering and measurement activities continued until 3rd April. That day, the first aperture cover, the azimuth aperture cover mechanism (AZACM), was released and the light path via the limb port opened, permitting limb and occultation observations. The long time delay between launch and the first appendage release was required to avoid possible contamination of the instrument due to outgassing from the platform. Another important milestone was reached on 15th April with the opening of the SRC. This event started the passive cooling of the detectors to their nominal temperatures, i.e. from this release on, detectors could be operated under in-flight thermal conditions. Furthermore, thermal tests aimed to find the final settings for the instrument were now possible. A particular challenge for mission planning and scanner control occurred at the end of April with the first lunar measurement window which was successfully passed. In June, SODAP had progressed so far that the final flight settings for the ATC and TC could be uploaded. OBM and detectors were now under continuous thermal control with modifications only being triggered by seasonal effects or the status of the SRC. On 20th June, the third and final cover, the elevation aperture cover mechanism (ELACM), was removed from the light paths. It permitted light to enter SCIAMACHY via the nadir port. From then on the engineering and measurement programme focused on finalising SODAP with the goal to begin the validation part of the Commissioning Phase in early August. With the set of states, originating from the evaluation of earlier measurements, and with the associated timelines, a configuration was specified and uploaded mid July which already came very close to the envisaged final flight definitions. SODAP ended on 2nd August, but leaving a few measurements still to be done. This was mainly due to the occurrence of anomalies which made it necessary to rearrange the tight SODAP plan. Also some of the objectives required seasonally dependent observing conditions, available only in the second half of the year.
At the end of SODAP, after a period of 130 days, SCIAMACHY had successfully executed more than 21200 macrocommands (MCMD). Almost 5500 timelines were started which triggered more than 78000 individual states. This impressive operational record required the upload of 5700 parameter tables and 560 timelines. Each parameter table was equivalent to reconfiguring one functionality or characteristic of the instrument. SODAP proved that the operational concept and the flight operations ground segment interfaces were well developed to handle the complex mission.
Although SODAP did not show major instrument malfunctions, the original plans had to be modified due to several anomalies. A rather persistent recurring anomaly hampered SCIAMACHY between May and July 2002. Subsequent detailed failure analysis had led to the conclusion that a bug in the Instrument Control Unit (ICU) can temporarily block its interface to the ENVISAT Payload Management Computer, causing a transfer to a safe instrument mode lower than Measurement. The error is known as MCMD CCA check error. In October 2002, a software patch was uploaded to correct this ICU bug. It did not fully cure the problem – complete repair would have required a more extended patch – but since then the average rate of the check error was reduced to a very low level of about 1/year. Single Event Upsets (SEU) were another type of anomaly triggering operational interrupts. The instrument can suffer from a SEU when high-energy particles, most likely protons, hit electronic components and switch their status information. The particle flux increases in low-Earth orbits during phases of high solar activity in general, and when crossing the South Atlantic Anomaly (SAA) of the Earth’s magnetic field in particular. Obviously, SEU were not only spoiling the Commissioning Phase

95
activities but have turned out to be the most frequent reason for unexpected instrument anomalies in the routine operations phase. The Validation Sequence From an instrument point of view, during the validation phase SCIAMACHY was operated in a quasi-routine fashion. Only some inserted SODAP measurements interrupted the nominal measurement plan. During this part of the mission, the extensive support of the ground segment was gradually reduced. SCIAMACHY now executed a continuous measurement programme which reflected the mission scenarios for routine operations. Validation scientists were provided with planning information – exact overpass times for nadir and limb observations – permitting synchronisation of ground-based, airborne and balloon-borne campaigns with SCIAMACHY operations. Details are described in chapter 9.
The end of the validation phase corresponded to the end of the Commissioning Phase. Therefore, the definition and upload of the final flight states and timelines was the ultimate goal to be accomplished. It occurred mid December 2002. After another decontamination the instrument was prepared and ready for the start of the routine operations phase. 6.2 Routine Operations Phase In January 2003, SCIAMACHY commissioning had ended and transfer to the routine operations phase was initiated. In spite of the few discrepancies described above, the instrument entered this phase with excellent performance. The start of routine operations also meant transfer of operational responsibilities on the instrument provider side from EADS Astrium to the SCIAMACHY Operations Support Team (SOST).
Routine operations are characterised by their continuity. Since spaceborne remote sensing of the atmosphere requires measurement data to be acquired under stable conditions, both in terms of instrument configuration and performance, SCIAMACHY has the goal to maintain the baseline measurement programme as long as possible. The majority of measurement sequences consist of a solar occultation each orbit, matching limb/nadir observations on the dayside and specific eclipse observations, including calibration and monitoring in the eclipse phase. Swath width in nadir and limb states is set to wide, i.e. 960 km, with an upper limit for the limb horizontal scans close to the top of the atmosphere at 100 km. This is supplemented by calibration and monitoring activities on a daily, weekly and monthly timescale. For a typical orbital mission scenario, 92% of the orbital period is covered by measurements. The remaining 8% are idle gaps required for potential command and control activities or are caused by the fact that the smallest possible time slice in a timeline is the duration of a state. Therefore, the continuous seasonal changes of solar and lunar constellations cannot always be perfectly matched and cause gaps up to the duration of a state.
By the end of 2009, SCIAMACHY had already executed more than 7 years of scientific measurements, where only 5 years were planned initially. For most of the routine operations phase, a high level of instrument availability could be ensured (Fig. 6-2). The continuous improvement of calibration and monitoring (chapter 5) permits deriving spectra with high relative (Fig. 6-3) and absolute (Fig. 6-4) accuracy. Together with the progress in the development of retrieval algorithms (chapter 7), data processing (chapter 8) and validation (chapter 9), this forms the basis for finally obtaining excellent scientific results (chapter 10). Operation Change Requests and Final Flight Configuration From January 2003 on, SCIAMACHY followed the specified mission scenarios. Deviations were only possible when a strict configuration controlled procedure, the Operation Change Request (OCR), was pursued and approved by project management. The OCR process was introduced early in 2003 because of the high number of configurable parameters describing the instrument status. Any modification of mission scenarios, states or timelines has to be requested via an OCR. The OCR procedure includes technical analyses by SOST of the proposed change and possible implementation options. Upon recommendation by SOST and endorsement by the SCIAMACHY Science Advisory
96
Group (SSAG) ensuring that no other scientific requirements are violated, project management finally approves or rejects the OCR.
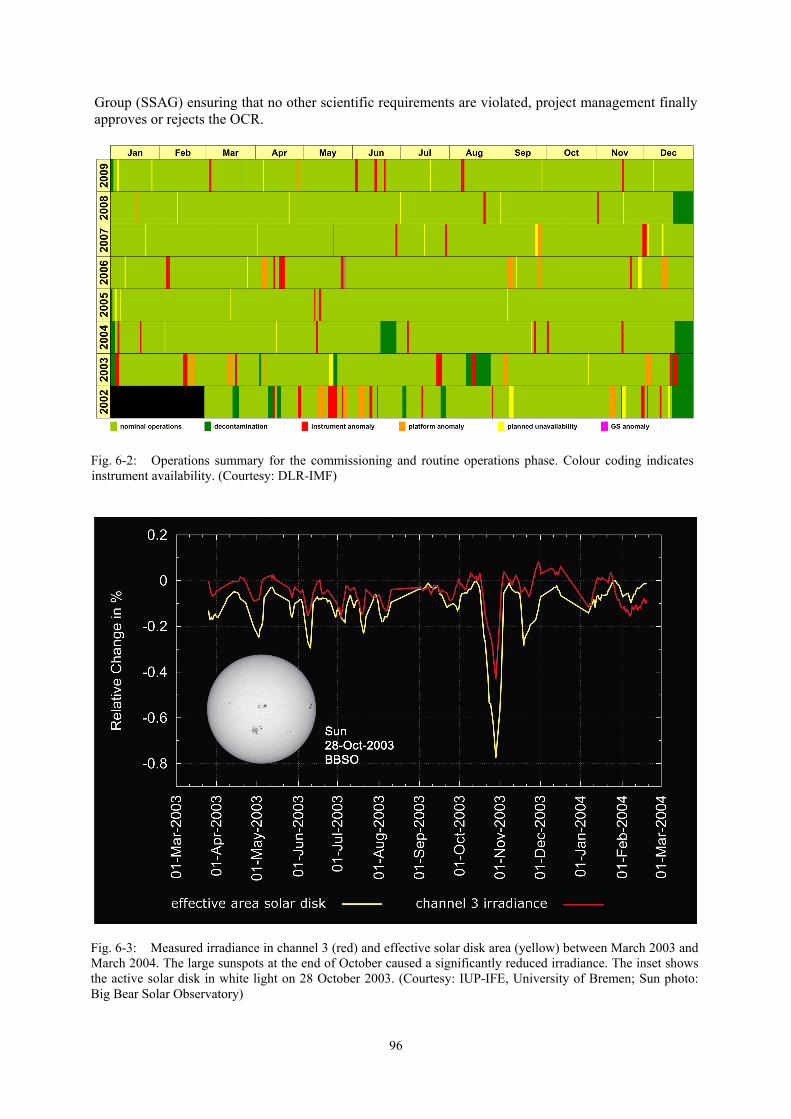
Fig. 6-2: Operations summary for the commissioning and routine operations phase. Colour coding indicates instrument availability. (Courtesy: DLR-IMF)
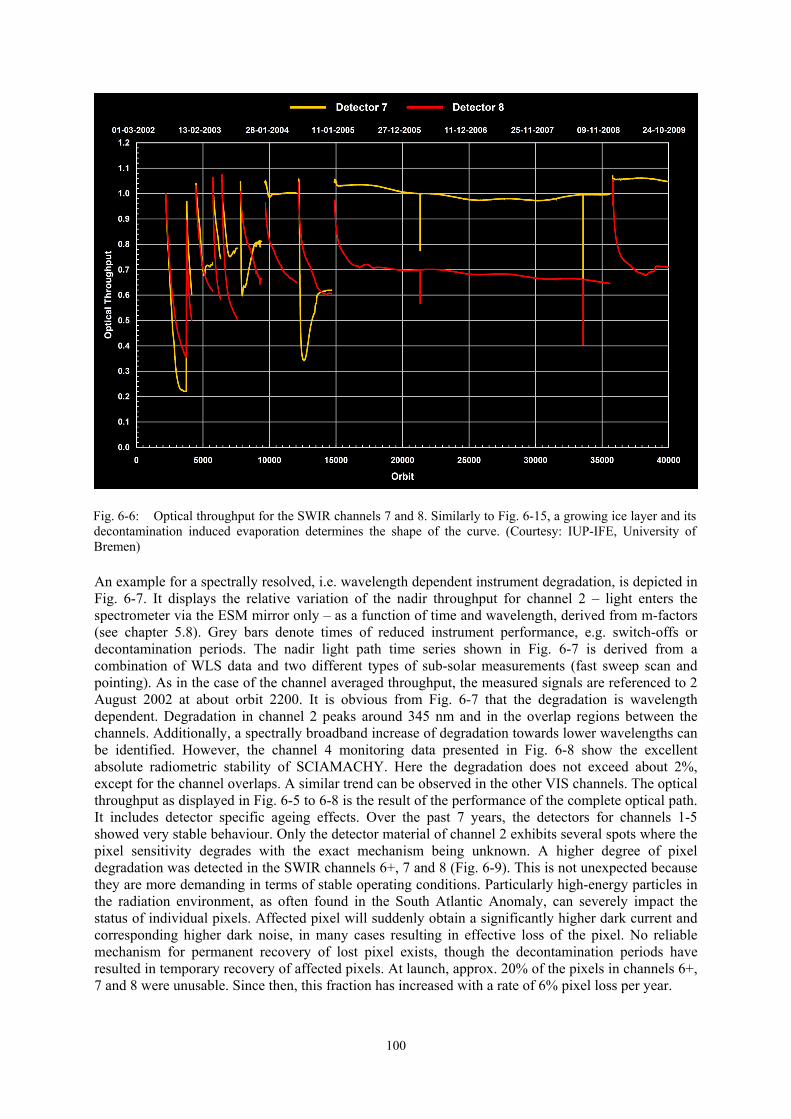
Fig. 6-3: Measured irradiance in channel 3 (red) and effective solar disk area (yellow) between March 2003 and March 2004. The large sunspots at the end of October caused a significantly reduced irradiance. The inset shows the active solar disk in white light on 28 October 2003. (Courtesy: IUP-IFE, University of Bremen; Sun photo: Big Bear Solar Observatory)

97
An OCR may ask for a temporary modification of operations, or result in permanent changes. In the latter case, the final flight configuration, either for states or timelines, has to be altered. Such a modification is permanently implemented in the flight operation ground segment command database and must be made operational at each ICU re-initialisation. Temporary changes are reset to the appropriate initial final flight settings. Since introducing the OCR process, more than 40 requests to change the instrument configuration have been issued. All of them were successfully implemented and executed. On average, this was equivalent to modify the measurement setup every 2 months. Some of the OCR requested rather trivial changes. Others were rather demanding such that SCIAMACHY’s operational capabilities had to be used at their limits. The final flight versions as of December 2002 were modified several times (Table 6-2). However, the overall state and timeline definitions remained rather stable throughout the routine operations phase so far. Mainly minor adjustments to state parameters or state sequences in timelines were required, but no major restructuring of their concepts.
Fig. 6-4: Calibrated SCIAMACHY solar irradiance spectrum measured on 18 April 2004, in comparison to the Kurucz solar reference spectrum. SCIAMACHY data have been normalised to 1 AU solar distance. Kurucz data have been interpolated to the SCIAMACHY wavelength grid. Top: SCIAMACHY (yellow) and Kurucz (blue) irradiance as function of wavelength with the wavelength coverage of all 8 channels. Bottom: Relative deviation between the two data sets. Small deviations in the wavelength calibration can cause large fluctuations in the ratio of the spectra. Therefore, the deviation is shown as unsmoothed (red) and smoothed (green) curve. The underlying grey bar shows the ±3% requirement for the absolute radiometric calibration of SCIAMACHY which is fulfilled over almost the whole spectral range. (Courtesy: IUP-IFE, University of Bremen)

98
Instrument Activity Date Orbit
modification of PET in Moon states 10 Mar 2003 5358
modification of dark current sequence in eclipse and monthly calibration timelines
4 Apr 2003 5712
modification of TCFoV in nadir states 8 Apr 2003 5771
modification of tangent height in limb dark current measurement
26 May 2003 6456
modification of WLS over diffuser sequence in monthly calibration timelines
13 Jul 2003 7151
modification of altitude range in limb mesosphere state
21 Jul 2003 7265
modification of PET in dark current and NDFM monitoring states
21 Jul 2003 7276
modification of limb altitude range and new timeline set for improved limb/nadir matching
15 Oct 2003 8489
new timeline set for improved limb/nadir matching in early orbit phase
22 May 2004 11638
modification of nadir states and new timeline set for increased signal-to-noise at high latitudes
6 Sep 2004 13172
new eclipse timelines with extended limb mesosphere coverage
6 Sep 2004 13172
increase of subsolar pointing rate and reduction of sub-solar fast sweep scanning rate
1 Oct 2006 23978
reduction of sub-solar observation rate to 1 every 3rd day
1 Oct 2006 23978
new limb mesosphere-thermosphere state to be executed 30 orbits per month
3 Nov 2008 34922
Table 6-2: Changes in final flight configurations from 2003-2009.
6.3 Optical Performance Optical Throughput
The regular monitoring of the optical light paths has generated a continuous record of optical throughput measurements, both averaged in each channel and spectrally resolved. The overall throughput behaviour is best illustrated by the channel averages. Although the results for the various paths differ slightly, all results provide a consistent view of the optical performance (Fig. 6-5, Fig. 6-6).
UV: Even with the observed degradation of 60% (channel 1) and 35% (channel 2) in 7 years, SCIAMACHY still maintains a high throughput at the UV wavelengths. The GOME mission with similar detectors suffered from a faster and larger decrease in sensitivity at short wavelengths.
VIS-NIR-SWIR: For detectors 3-6, annual variations are detected on a sub-percent level. The excellent stability permits correlation of the overall throughput with large scale features due to seasonal variations. Over short timescales even solar activity sensed via the effective sunspot area is reflected in the data.
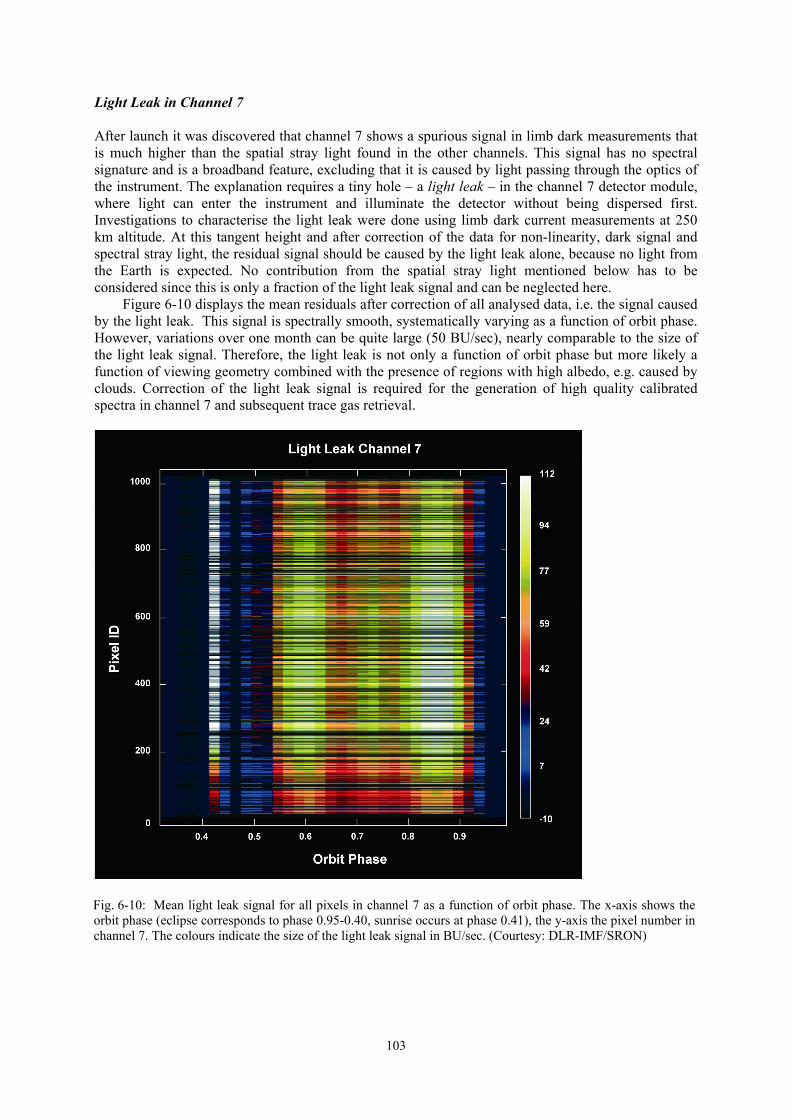
SWIR: Throughput analysis in channels 7 and 8 provides a means for monitoring the status of the ice layers. The record of decontaminations has led to the conclusion that throughput

99
measurements do not necessarily reflect the water content on the detectors but only in the optical path. As was learnt by the sequence of decontaminations between December 2003 and January 2005 and December/January 2008/2009, water might condense either on a second cold trap mimicking a water-free detector or on optical surfaces. In the first case, the throughput remains at high levels after having achieved values close to 100% immediately after the decontamination, while in the second case, it can be drastically reduced. While detectors 7 and 8 display common trends after each decontamination, a more detailed look reveals differences that are not fully understood. The light path in detector 7 can become virtually ice-free but sensitivity in detector 8 is always reduced by about 20-30% within 3-4 months.
Fig. 6-5: Seven years of optical throughput for channels 1-6 starting with quasi-routine measurements on 2 August 2002. Decontamination intervals and periods after instrument saving are omitted. The information has been derived from the operational light path monitoring using the Sun via the ASM and ESM mirror. The two strong temporal reductions just before orbit 22000 and 34000 are caused by total solar eclipses. (Courtesy: IUP-IFE, University of Bremen)
100
An example for a spectrally resolved, i.e. wavelength dependent instrument degradation, is depicted in Fig. 6-7. It displays the relative variation of the nadir throughput for channel 2 – light enters the spectrometer via the ESM mirror only – as a function of time and wavelength, derived from m-factors (see chapter 5.8). Grey bars denote times of reduced instrument performance, e.g. switch-offs or decontamination periods. The nadir light path time series shown in Fig. 6-7 is derived from a combination of WLS data and two different types of sub-solar measurements (fast sweep scan and pointing). As in the case of the channel averaged throughput, the measured signals are referenced to 2 August 2002 at about orbit 2200. It is obvious from Fig. 6-7 that the degradation is wavelength dependent. Degradation in channel 2 peaks around 345 nm and in the overlap regions between the channels. Additionally, a spectrally broadband increase of degradation towards lower wavelengths can be identified. However, the channel 4 monitoring data presented in Fig. 6-8 show the excellent absolute radiometric stability of SCIAMACHY. Here the degradation does not exceed about 2%, except for the channel overlaps. A similar trend can be observed in the other VIS channels. The optical throughput as displayed in Fig. 6-5 to 6-8 is the result of the performance of the complete optical path. It includes detector specific ageing effects. Over the past 7 years, the detectors for channels 1-5 showed very stable behaviour. Only the detector material of channel 2 exhibits several spots where the pixel sensitivity degrades with the exact mechanism being unknown. A higher degree of pixel degradation was detected in the SWIR channels 6+, 7 and 8 (Fig. 6-9). This is not unexpected because they are more demanding in terms of stable operating conditions. Particularly high-energy particles in the radiation environment, as often found in the South Atlantic Anomaly, can severely impact the status of individual pixels. Affected pixel will suddenly obtain a significantly higher dark current and corresponding higher dark noise, in many cases resulting in effective loss of the pixel. No reliable mechanism for permanent recovery of lost pixel exists, though the decontamination periods have resulted in temporary recovery of affected pixels. At launch, approx. 20% of the pixels in channels 6+, 7 and 8 were unusable. Since then, this fraction has increased with a rate of 6% pixel loss per year.
Fig. 6-6: Optical throughput for the SWIR channels 7 and 8. Similarly to Fig. 6-15, a growing ice layer and its decontamination induced evaporation determines the shape of the curve. (Courtesy: IUP-IFE, University of Bremen)

101
Fig. 6-7: Variation of the throughput of the SCIAMACHY nadir light path in channel 2, determined from m-factors. The contours plot shows the spectrally resolved throughput as a function of time. Grey bars mask out times of reduced instrument performance, i.e. switch-offs or decontamination periods. (Courtesy: IUP-IFE, University of Bremen)
Fig. 6-8: Same as Fig. 6-7, but for SCIAMACHY channel 4. (Courtesy: IUP-IFE, University of Bremen)

102
Scan Angle Dependence The measured signal depends on the viewing geometry, i.e. on the incidence angles on the mirrors or diffusers (see chapter 5). This is not only because the reflectivity of the mirrors/diffusers changes when viewed under a different scan angle, but also the polarisation sensitivities. The default calibration corrects for this scan angle dependence under the implicit assumption that it has not changed since launch. While several science products indicate increasing scan angle dependence, no method for directly monitoring this degradation effect exists. Experience with GOME on ERS-2 shows that the effect is likely due to a contamination layer built up on the scan mirrors since launch. This introduces a scan angle dependent degradation which varies with wavelength. Intrinsic scan angle dependence is expected, based on the Fresnel equations describing the polarised reflection of light off dielectric media (e.g. a mirror), including additionally added dielectric layers (e.g. a layer of built-up contamination). When the properties of the dielectrics or the layers change, as in contamination built up on a mirror surface, not only the unpolarised but also the polarised and scan angle dependent reflectance changes. These effects are all coupled through the Fresnel equations. If sufficient information is available from e.g. component data and in-flight monitoring at multiple wavelengths, polarisation conditions, or multiple angles, the properties of the changed mirror or coating can be derived and corrected for. This was successfully done for the GOME scan mirror for the period 1995-2001, where the contaminant thickness with time and contaminant optical properties with wavelength could be derived from solar and lunar monitoring data. Due to the superior monitoring capabilities of SCIAMACHY, it is expected that deriving such information for the SCIAMACHY scan mirrors can be achieved, as well. If the SCIAMACHY ESM mirror is behaving similarly as the GOME scan mirror, a scan angle dependent degradation of the order of a few percent is estimated (Snel and Tilstra 2008). It occurs mostly in the UV (channels 1 and 2) for extreme scan angles, compared to central viewing, due to accumulated contamination over the in-orbit mission lifetime of more than 7 years.
Fig. 6-9: Degradation of the pixel quality in the SWIR channels. The number of bad pixels is continuously increasing. For comparison, the first half of channel 6 is illustrated which consists of a material being more robust in the space environment and is thus much less subject to degradation. (Courtesy: SRON)
103
Light Leak in Channel 7 After launch it was discovered that channel 7 shows a spurious signal in limb dark measurements that is much higher than the spatial stray light found in the other channels. This signal has no spectral signature and is a broadband feature, excluding that it is caused by light passing through the optics of the instrument. The explanation requires a tiny hole – a light leak – in the channel 7 detector module, where light can enter the instrument and illuminate the detector without being dispersed first. Investigations to characterise the light leak were done using limb dark current measurements at 250 km altitude. At this tangent height and after correction of the data for non-linearity, dark signal and spectral stray light, the residual signal should be caused by the light leak alone, because no light from the Earth is expected. No contribution from the spatial stray light mentioned below has to be considered since this is only a fraction of the light leak signal and can be neglected here.
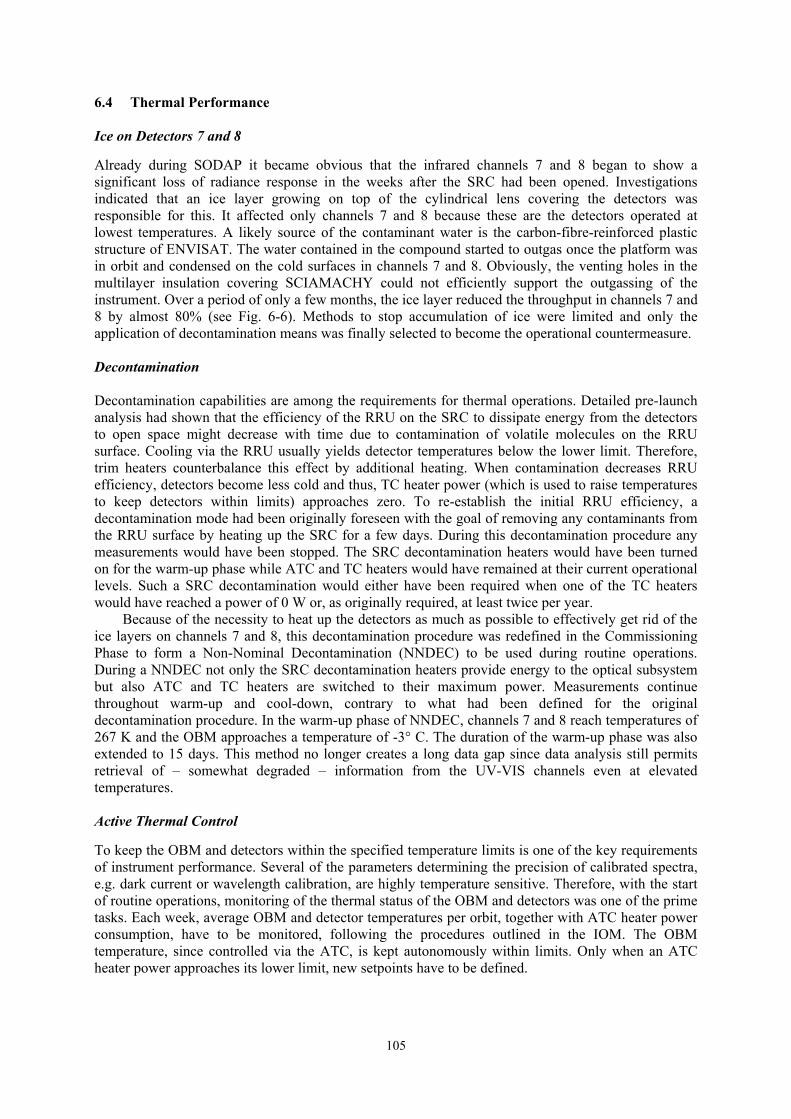
Figure 6-10 displays the mean residuals after correction of all analysed data, i.e. the signal caused by the light leak. This signal is spectrally smooth, systematically varying as a function of orbit phase. However, variations over one month can be quite large (50 BU/sec), nearly comparable to the size of the light leak signal. Therefore, the light leak is not only a function of orbit phase but more likely a function of viewing geometry combined with the presence of regions with high albedo, e.g. caused by clouds. Correction of the light leak signal is required for the generation of high quality calibrated spectra in channel 7 and subsequent trace gas retrieval.
Fig. 6-10: Mean light leak signal for all pixels in channel 7 as a function of orbit phase. The x-axis shows the orbit phase (eclipse corresponds to phase 0.95-0.40, sunrise occurs at phase 0.41), the y-axis the pixel number in channel 7. The colours indicate the size of the light leak signal in BU/sec. (Courtesy: DLR-IMF/SRON)

104
Spatial Stray Light in Limb Measurements During analysis of limb data it was discovered that these measurements suffer from spatial stray light. This was first noticed in measurements taken at 150 km tangent height where no atmospheric light should be present. The measurements at 150 km were originally intended to determine the orbital variation of the dark signal in channel 8 serving as an optional dark correction for limb measurements. Investigations (van Soest 2005) showed that the additional signal was not caused by a light leak because spectral structures such as air glow emissions and atmospheric absorptions are visible in the measurements. This means that the signal is spectrally dispersed and thus goes through the optics of the instrument. Comparison with MERIS data revealed that the stray light does not correlate with the intensity of the scene at the subsatellite point, thereby ruling out the possibility that light leaking through the nadir port is subsequently directed into the telescope. Measurements of limb scans at high altitude and at a lower tangent altitude of 10 km result in a good correlation confirming that the stray light is caused by light entering the instrument through the slit from regions outside the IFoV. The stray light impact is highest in channel 2-4 and is very low in channels 1, 5 and 6. In order to avoid corrupted limb dark current measurements, the final flight instrument configuration has been adjusted early during the routine operations phase by raising the tangent altitude from 150 km to 250 km. At this height, the spatial stray light is reduced by an order of magnitude to 5-10 BU/sec, thus allowing an estimation of the orbital dark variation.
Further investigations into the spatial stray light in 2007 revealed that a significant fraction of the stray light most likely originates from residual grooves in the diamond-turned telescope mirror (Fig. 6-11). The regular grooves act as a grating before the entrance slit and cause a wavelength dependent shifted scene to be recorded with the intended scene. The shift is below 1° at UV wavelengths and can be seen to extend to about 3° at 1000 nm and longer.
Fig. 6-11: Spatial stray light in channels 1-6 as a function of the LoS distance from the Sun. Close to the Sun stray light contributions are strongest (red areas). The tilted bands of different strengths are caused by diffraction from residual grooves in the telescope mirror. The measurements shown here were collected in close vicinity of the Sun. By varying the distance between Sun and IFoV, characterising the wavelength dependent diffracted signal was possible. (Courtesy: DLR-IMF)
105
6.4 Thermal Performance Ice on Detectors 7 and 8
Already during SODAP it became obvious that the infrared channels 7 and 8 began to show a significant loss of radiance response in the weeks after the SRC had been opened. Investigations indicated that an ice layer growing on top of the cylindrical lens covering the detectors was responsible for this. It affected only channels 7 and 8 because these are the detectors operated at lowest temperatures. A likely source of the contaminant water is the carbon-fibre-reinforced plastic structure of ENVISAT. The water contained in the compound started to outgas once the platform was in orbit and condensed on the cold surfaces in channels 7 and 8. Obviously, the venting holes in the multilayer insulation covering SCIAMACHY could not efficiently support the outgassing of the instrument. Over a period of only a few months, the ice layer reduced the throughput in channels 7 and 8 by almost 80% (see Fig. 6-6). Methods to stop accumulation of ice were limited and only the application of decontamination means was finally selected to become the operational countermeasure. Decontamination Decontamination capabilities are among the requirements for thermal operations. Detailed pre-launch analysis had shown that the efficiency of the RRU on the SRC to dissipate energy from the detectors to open space might decrease with time due to contamination of volatile molecules on the RRU surface. Cooling via the RRU usually yields detector temperatures below the lower limit. Therefore, trim heaters counterbalance this effect by additional heating. When contamination decreases RRU efficiency, detectors become less cold and thus, TC heater power (which is used to raise temperatures to keep detectors within limits) approaches zero. To re-establish the initial RRU efficiency, a decontamination mode had been originally foreseen with the goal of removing any contaminants from the RRU surface by heating up the SRC for a few days. During this decontamination procedure any measurements would have been stopped. The SRC decontamination heaters would have been turned on for the warm-up phase while ATC and TC heaters would have remained at their current operational levels. Such a SRC decontamination would either have been required when one of the TC heaters would have reached a power of 0 W or, as originally required, at least twice per year.
Because of the necessity to heat up the detectors as much as possible to effectively get rid of the ice layers on channels 7 and 8, this decontamination procedure was redefined in the Commissioning Phase to form a Non-Nominal Decontamination (NNDEC) to be used during routine operations. During a NNDEC not only the SRC decontamination heaters provide energy to the optical subsystem but also ATC and TC heaters are switched to their maximum power. Measurements continue throughout warm-up and cool-down, contrary to what had been defined for the original decontamination procedure. In the warm-up phase of NNDEC, channels 7 and 8 reach temperatures of 267 K and the OBM approaches a temperature of -3° C. The duration of the warm-up phase was also extended to 15 days. This method no longer creates a long data gap since data analysis still permits retrieval of – somewhat degraded – information from the UV-VIS channels even at elevated temperatures. Active Thermal Control
To keep the OBM and detectors within the specified temperature limits is one of the key requirements of instrument performance. Several of the parameters determining the precision of calibrated spectra, e.g. dark current or wavelength calibration, are highly temperature sensitive. Therefore, with the start of routine operations, monitoring of the thermal status of the OBM and detectors was one of the prime tasks. Each week, average OBM and detector temperatures per orbit, together with ATC heater power consumption, have to be monitored, following the procedures outlined in the IOM. The OBM temperature, since controlled via the ATC, is kept autonomously within limits. Only when an ATC heater power approaches its lower limit, new setpoints have to be defined.

106
In the first years of operations, the ATC settings as of June 2002 provided a very stable average orbital OBM temperature of -17.90° C (Fig. 6-12). No adjustments were necessary for several years into the mission. The ATC heater power history displayed the expected seasonal modulation and a decrease –
Fig. 6-12: Mean OBM temperature per orbit. On orbit average, the ATC system keeps the OBM within 0.001° C of the selected temperature. (Courtesy: DLR-IMF)
Fig. 6-13: Power consumption of the 3 heaters (Nadir, Limb and RAD A) of the ATC system. The curve follows a seasonal variation with an expected long-term decrease most prominent for the ATC-Nadir heater. The glitch in ATC-Nadir and ATC-Limb powers in October 2008 is caused by the ATC readjustment. (Courtesy: DLR-IMF)

107
most pronounced in the ATC-Nadir heater – indicated signs of degradation (Fig. 6-13). This was, however, much smaller than predicted. During the months of the annual seasonal minimum, i.e. November and December, the orbital mean ATC-Nadir power slowly approached the specified lower limit. In October 2008, modified ATC settings had to be commanded to ensure safe ATC operations and a stable OBM temperature for the coming years of the extended mission. During this readjustment, the ATC-Nadir power was increased and the ATC-Limb power decreased resulting in almost no effect on the OBM temperature. Thermal Control Contrary to the stable ATC behaviour, the detector temperature control requires occasional manual adjustments due to environmental variations. Whenever the weekly monitoring indicates that one of the detectors will violate the limit in the near future, FOCC is requested to command new trim heater power settings to bring the particular channel temperature well back in range. Since channels 4 and 5 have the highest temperature sensitivity, most of the TC adjustments were caused by these detectors. Early 2003, the temperatures selected by the TC settings for June 2002 were considered not to be optimum. Therefore, in a number of TC adjustments during February 2003, the detector temperatures were brought into new ranges (see Table 3-4 in chapter 3). Since then, control of the seasonal thermal variations requires only very few adjustments each year (Fig. 6-14). With the calibration improving over time, it had turned out to even tolerate detector temperatures a few 0.1° C above or below their limits. For a period of 5-6 orbits after the adjustment, quality of the measurement data of the modified channel can be reduced because the temperature gradient exceeds the specified limit of 0.1-0.3 K/orbit for channels 5-8.
Decontamination is a vital part of thermal operations. Monitoring of the TC heater power led to the conclusion that RRU efficiency does not degrade with the rate estimated before launch. It was
Fig. 6-14: Mean detector temperatures per orbit for channels 1-6. Decontamination intervals with elevated temperatures and periods after instrument saving with too low temperatures are omitted. The resulting curves display the seasonal variation. Steps are due to TC adjustments, mainly affecting channels 4 and 5. The increase around orbit 5000 corresponds to an overall TC correction to establish new temperature ranges. (Courtesy: DLR-IMF)

108
therefore decided to abandon the original requirement of two decontaminations per year and initiate a NNDEC only when the ice induced throughput reduction of channels 7 and 8 had reached unacceptable levels. Early during the routine phase, decontaminations occurred more frequently since experience had to be gained about the most appropriate duration of the warm-up phase. Then, with a frequency of twice per year, NNDEC were executed, one in summer and one in winter. However, these NNDEC achieved only a temporary removal of the ice layers. Due to accidental non-nominal events, either in the warm-up or cool-down, almost none of the executed NNDECs were identical. Improvement of the throughput for channel 7 after decontamination showed erratic behaviour without a clear explanation. Only when the cool-down phase of the NNDEC was modified by introducing a well specified transfer to STANDBY mode with subsequent ‘recovery’, the throughput in channels 7 and 8 remained at high values for long periods. The hypothesis is that a second cold trap exists which may be activated by forcing low temperatures in the cool-down. At the beginning of the cool-down, water is still uncondensed and can deposit on the second cold trap, thus leaving the optical path of detectors 7 and 8 void of ice to a large extent. The new procedure was implemented operationally for the decontamination in winter 2004/2005. It removed almost all the ice from the light path of channel 7 and kept the reduction in channel 8 to less than 30%. After operating channels 7 and 8 without another decontamination for 4 years, the same NNDEC procedure was applied in winter 2008/2009 and delivered a similar recovery of the SWIR throughput.
The temperature behaviour of the infrared channels 7 and 8 is largely driven by the ice conditions. Ice also covers the gold plated aluminium structures of the detector suspension leading to an increased infrared absorption and thus to radiatively heated detectors. This results in a slow but steady rising temperature. Immediately after a decontamination, ice is removed and temperatures are at the selected cold level from where they start to increase – caused by the growth of the ice layer – until the next decontamination is started or an equilibrium with a stable ice layer is reached (Fig. 6-15).
Fig. 6-15: Mean detector temperatures per orbit for the SWIR channels 7 and 8. Displayed data are as in Fig. 6-14. The graphs are the result of growing ice (increase) and occasional decontaminations (drop to lower values). Between orbit 10600 and 10900, two TC adjustments had a significant impact on the SWIR detector temperatures. (Courtesy: DLR-IMF)
109
6.5 Line-of-Sight Performance
Scanners Because of their design, both the ESM and the ASM were not considered to be critical mechanical subsystems. When the end of the nominal specified mission lifetime was reached in March 2007, however, the scanners became subject of regular monitoring. This ensured early detection of potential degradation of the scanner performance and development of appropriate countermeasures. The scanner current parameters, which are downlinked as part of the Housekeeping (HK) telemetry stream, have been considered suitable for the purpose of scanner monitoring. Since state 65 (scanner maintenance and ADC calibration) is scheduled each orbit, the acquired HK telemetry provides good statistics even though the measurement phase of state 65 only lasts about 45 sec. With a rate of 1/16 Hz, about 2-3 telemetry readings are obtained at each state execution. Due to the design of state 65, a distinct pattern of the ASM and ESM clockwise, counterclockwise and mean current is expected. As long as this pattern does not change, no degradation of the scanner performance is deduced. Over the past 7 years, the ASM current pattern remained rather stable. At the end of 2007, the ESM mean current began to deviate from its previous curve, reached a plateau value and started to decrease again. This behaviour is not fully understood and therefore subject to further investigations. Because continuous ESM operations occur in both nadir and limb states, usage of this scanner is much more frequent than that of the ASM. Therefore, degradation effects might emerge earlier. However, the pointing performance of both scanners remained stable and seems unrelated to the observed scanner currents effect.
Extra Mispointing Since the Commissioning Phase it is well known that SCIAMACHY’s LoS exhibits small inconsistencies. These include an elevation jump of about -0.04° in the SO&C window when acquiring the Sun with the Sun Follower in elevation above the atmosphere after following the solar trajectory with a predicted elevation rate in the ESM control. In the sub-solar window an elevation jump of about -0.02° occurs, again when the Sun Follower captures the Sun in elevation above the atmosphere. Before launch the misalignment of the instrument LoS in all three axes had been measured. The corresponding parameters are given in Table 6-3. They are stored on-board as part of the engineering parameters and compensated in the scanner control via the optical zero correction. Thus, the observed pointing inconsistencies could not be attributed to this known misalignment. Their origin was instead modelled by an extra mispointing which is not necessarily only reflecting an additional misalignment of the instrument axes but could be associated with all components impacting the complete measurement planning and execution chain, as there are
extra instrument misalignment (pitch, roll, yaw) ESM/ASM offset extra platform attitude mispointing (pitch, roll, yaw) FOCC planning and scheduling s/w scanner control s/w Sun Follower control loop
Best agreement with the pointing inconsistencies in solar observations was achieved when assuming extra mispointings as listed in Table 6-3. The values in pitch and roll turned out to be so large that a significant impact had to be expected when retrieving altitudes from limb measurements (Gottwald et al. 2007).

110
Axis Instrument Misalignment (°) Extra Mispointing (°)
pitch +0.000630 -0.026 ± 0.003
roll +0.001662 -0.020 ± 0.001
yaw -0.227464 +0.009 ± 0.008
Table 6-3: SCIAMACHY instrument misalignment measured before launch and modelled extra mispointing. Tangent Height SCIAMACHY’s limb mode is a powerful technique to sense the atmosphere with global coverage and high vertical resolution. A necessity for obtaining useful measurements is the accuracy of reconstructing altitudes in general and tangent heights in particular from elevation and azimuth angles (von Savigny et al. 2005). Because of the large distances involved in limb geometry – about 3200 km from the instrument to the Earth horizon – even small pointing uncertainties translate into large tangent height errors. For SCIAMACHY on ENVISAT, a pitch pointing error of 1 arcmin shifts retrieved profiles by 1 km.
Early in the mission, it was recognised that the operationally generated tangent height information differs by as much as 3 km from what was expected. The reference tangent heights were derived from the TRUE (Tangent Height Retrieval by UV-B Exploitation) method (Kaiser et al. 2004), which uses the so-called ‘knee’ as a spectral signature for retrieving limb pointing information. The TRUE results are considered reliable as long as the technique is restricted to tropical latitudes, e.g. between 20°N and 20°S, where stratospheric and lower mesospheric ozone variability is small. The offset between the operational tangent heights and those derived via the ‘knee’ method showed a strong seasonal variation with a mean amplitude of 0.8 km and a constant bias of 0.5 km. The sinusoidal seasonal modulation was superimposed on a linear trend with a gradient of about 0.4 km per year.
SCIAMACHY’s findings were compliant with a detailed analysis of pointing information from GOMOS and MIPAS. ENVISAT’s on-board processing of state vector parameters uplinked from ground was identified to be the source of the observed pointing inaccuracy. In a corrective action, the s/w algorithm for deriving such parameters on-ground was upgraded and finally implemented in December 2003 around orbit 9300 (Bargellini et al. 2006). This resulted in a reduction of the tangent height jumps observed around the times of the daily updates of the on-board state vector and of the seasonal variation of the tangent height offset. When using residual ENVISAT platform pointing information in pitch, roll and yaw, the mean amplitude of the offset amounted now to about 0.2 km with the linear gradient reduced by a factor of 3. However, the bias increased to 1.5 km and remained practically stable over a year (Fig. 6-16).
Exploiting the full capabilities of limb data obtained by SCIAMACHY required additional improvement in altitude retrievals. It was indeed achieved via the extra mispointing model. Adding the correction angles from Table 6-3 in the calculation of geolocations reduced the tangent height bias to almost 0 km as obvious in Fig. 6-16 with an uncertainty of 100 m. Having obtained such a high accuracy in altitude determination permitted investigations on even smaller residual effects. A seasonal trend with an amplitude of 150 m became obvious. In addition, indications for a tangent height trend with a rate of a few 10 m per year exist. Further investigations are ongoing to prove their validity, understand their origin and correct for it.

111
6.6 Mission Extension Since its launch in March 2002, the ENVISAT mission proved to be very successful concerning both the platform and the instrument payload complement. When the end of the specified nominal mission lifetime was reached in early 2007, it was decided to continue with platform and instrument operations for another 3.5 years until 2010. In this phase of the mission extension, the high mission performance could be maintained. After platform and sensors had convincingly demonstrated that very valuable information about the Earth system can be acquired even after 2010, ESA and the participating national agencies approved another mission extension period lasting from the second half of 2010 to the end of 2013, at least. Orbit Modification One of the major mission limiting factors is available fuel (see chapter 2). With the requirement to deposit ENVISAT at the end of the mission in an orbit with different altitude to reduce the risk of collisions with other Earth Observation satellites, sufficient hydrazine must be kept in the fuel tanks for the final orbit lowering manoeuvre which consumes for an altitude change of 1 km about 2 kg of fuel. It has been decided that the disposal orbit shall be commanded when the first phase of the mission extension ends. Thus, the second phase will be operated in an orbit different from the nominal ENVISAT orbit. All the fuel remaining after the altitude manoeuvre, estimated to be slightly more than 20 kg, will then be available for orbit control. If the fuel demanding inclination maintenance is discarded, altitude manoeuvres will be possible until 2013 (Frerick et al. 2007).
Assuming that the altitude is decreased by 17.4 km, the modified ENVISAT orbit in the second mission extension phase will be characterised by a repeat cycle of 30 days, i.e. 431 orbits. Its orbital period of 6014 sec is shorter than the nominal one of about 6036 sec. No longer readjusting the inclination is equivalent to a slightly drifting inclination at a rate of 0.046°/year. This affects the Mean
Fig. 6-16: Tangent height offsets as determined from operational data products and TRUE retrieved profile information. Prior to December 2003, the bias had a strong harmonic variation (red). After the update of the on-board propagator model and including residual platform mispointing, the variation was reduced but a constant offset persisted (yellow). When the extra mispointing is introduced in geolocation retrieval this offset vanishes (blue). (Courtesy: IUP-IFE, University of Bremen)

112
Local Solar Time (MLST), which will also leave the specified value of 22:00 ± 5 min after a while. The maximum excursion occurs 1.5 years after the orbit modification when a value of 22:09 is reached. Then the MLST approaches 22:00 again and will start to drift to earlier values with the end of 2013 (Fig. 6-17).
Fig. 6-17: Inclination (left axis) and MLST (right axis) drift of the ENVISAT orbit during the mission extension phase until 2013 (top). The bottom panel shows an example how the orbit interval from end of the SO&C window to the start of the eclipse (left axis) and the solar elevation at sub-solar condition (right axis) changes when the orbit altitude is lowered. The yellow lines indicate the lower and upper limit of the NCWM window. (Courtesy: DLR-IMF)

113
Impact on Instrument Performance Operating SCIAMACHY in the 2010-2013 timeframe means more than doubling the instrument’s in-orbit lifetime. This will partially occur in a different orbit. Therefore, impacts on the instrument performance are expected from
Orbit: SCIAMACHY as an instrument with multi-viewing capabilities is strongly dependent on the status of the LoS during measurements. Because of the modified orbit the visibility of terrestrial and celestial targets along the orbit changes.
Time: With evolving time, the subsystems of the instrument degrade. Having extended the lifetime well beyond the specified time, span stronger degradation than predicted for nominal End-of-Life (EOL) must be expected.
Degradation in the extended mission is treated in two ways. One is via reconfiguring the affected subsystems as long as sufficient margins in configurable parameters are available. The other concerns improvements in calibration and monitoring which helps to use measurement data obtained in a degraded environment for retrievals.
The flexibility of SCIAMACHY operations control permits to compensate for the modified orbit to a large degree. It requires a reconfiguration of the instrument by updating certain engineering and measurement parameters as well as states and timelines (Gottwald et al. 2009). Usually, the TCFoV for each viewing geometry is so wide that the Sun and the Moon are still visible even when the MLST approaches its extreme value. The only exception occurs when the Sun hits the upper edge of the sub-solar window for a short time period, making sub-solar measurements impossible (Fig. 6-17). Thus, the mission scenarios need not be changed and the scientific requirements can be fulfilled even until 2013.
SCIAMACHY’s life limited items (LLI) require particular attention in extended mission operations. They shall only execute the specified activations defined by individual in-flight LLI budgets from on-ground tests and analyses. Safe operations aim at not exceeding these budgets over the mission lifetime, including extension phases. The usage of LLIs is therefore monitored regularly and compared with the corresponding in-flight budget. Assuming that the mission scenarios remain stable, the LLI executions can be extrapolated until the end of 2013. The in-flight budget will not be reached for any of the LLI, except for the Nadir Calibration Window Mechanism (NCWM), in more than 11 years of operations. Only the accumulated NCWM activations will slightly violate the allocated limit. However, this is uncritical since the rate of sub-solar measurements can be adjusted accordingly any time during the mission.

114
References Bargellini, P., Garcia Matatoros, M.A., Ventimiglia, L. and Suen, D. 2006. ENVISAT Attitude and Orbit Control In-Orbit Performance: An Operational View. Proc. 6th Internatl. Conf. on Guidance, Navigation and Control Systems, Loutraki, Greece, ESA SP-606. Frerick, J., Duesmann, B. and Canela, M. 2007. 2010 and Beyond – The ENVISAT Mission Extension. Proc. ENVISAT Symposium 2007, Montreux, Switzerland, ESA-SP-636. Gottwald, M., Krieg, E., Slijkhuis, S., von Savigny, C., Noël, S., Bovensmann, H. and Bramstedt, K. 2007. Determination of SCIAMACHY LOS Misalignements. Proc. ENVISAT Symposium 2007, Montreux, Switzerland, ESA-SP-636. Gottwald, M., Krieg, E., Lichtenberg, G., Noël, S., Bramstedt, K., Bovensmann, H. and Snel, R. 2009. SCIAMACHY Instrument Status – from 2010 to 2013. Proc. ESA Atmos. Science Conf., Barcelona, Spain, ESA-SP-676. Kaiser, J.W., von Savigny, C., Eichmann, K.-U., Noël, S., Bovensmann, H. and Burrows, J.P. 2004. Satellite Pointing Retrieval from Atmospheric Limb Scattering of Solar UV-B Radiation. Can. J. Phys., 82, 1041-1052. Snel, R. and Tilstra, G. 2008. SCIAMACHY Scan Angle Degradation (SRON-SCIA-PhE-RP-23). Technical Document, SRON. van Soest, G. 2005. Investigation of SCIAMACHY Limb Stray Light (SRON-EOS-RP-05-006). Technical Document, SRON. available at http://www.sron.nl/~SCIA_CAL/SCIACALdocuments.php/ von Savigny, C., Kaiser, J.W., Bovensmann, H., Burrows, J.P., McDermid, I.S. and Leblanc, T. 2005. Spatial and temporal characterization of SCIAMACHY limb pointing errors during the first three years of the mission. Atmos. Chem. Phys., 5, 2593-2602.