6. y-12 environmental monitoring programs · y-12 environmental monitoring programs 6-1 6. ......
TRANSCRIPT

Y-12 Environmental Monitoring Programs 6-1
6. Y-12 Environmental Monitoring Programs
Compliance and environmental monitoring programs required by federal and state regulation and by DOEorders are conducted at the Y-12 National Security Complex for air, water, and groundwater environmentalmedia.
6.1 Y-12 COMPLEX RADIO-LOGICAL AIRBORNEEFFLUENT MONITORING
The release of radiological contaminants,primarily uranium, into the atmosphere at theY-12 National Security Complex (Y-12 Complex)occurs almost exclusively as a result of plantproduction, maintenance, and waste managementactivities. NESHAP regulations for radionuclidesrequire continuous emission sampling of majorsources (a “major source” is considered to be anyemission point that potentially can contributemore than 0.1 mrem/year EDE equivalent to anoff-site individual). During 2002, 42 of the55 stacks suitable for continuous monitoring werejudged to be major sources. Eighteen of the stackswith the greatest potential to emit significantamounts of uranium are equipped with alarmedbreakthrough detectors, which alert operationspersonnel to process-upset conditions or to adecline in filtration-system efficiencies, allowingthem to investigate and correct the problem beforea significant release occurs. As of January 1,2002, the Y-12 Complex had continuous moni-toring capability on a total of 55 stacks, 44 ofwhich were active and 11 of which were tem-porarily shut down.
Emissions from unmonitored process andlaboratory exhausts, categorized as minor emis-sion sources, are estimated according to calcula-tion methods approved by the EPA. In 2002, therewere 41 unmonitored processes operated by Y-12.These are included as minor sources in the Y-12Complex source term.
Uranium and other radionuclides are handledin millicurie quantities at facilities within theboundary of the Y-12 Complex as part of BJC,ORNL, and BWXT Y-12 laboratory activities.Twenty-eight minor emission points were identi-fied from laboratory activities at facilities within
the boundary of the Y-12 Complex as beingoperated by BWXT Y-12. In addition, the BWXTY-12 Analytical Chemistry Organization labora-tory is operated in a leased facility that is notwithin the ORR boundary and is locatedapproximately a mile east of the Y-12 Complexon Union Valley Road. The emissions from theAnalytical Chemistry Organization Union Valleylaboratory are included in the Y-12 Complexsource term. Eight minor emission points wereidentified at the laboratory. The releases fromthese emission points are minimal, however, andhave a negligible impact on the total Y-12Complex dose.
Emissions from Y-12 Complex room ventila-tion systems are estimated from radiation controldata collected on airborne radioactivity concentra-tions in the work areas. Areas where the monthlyaverage concentration exceeded 10% of the DOEderived air concentration worker-protection guide-lines are included in the annual emission estimate.One emission point in Building 9212 wasidentified in 2002 where room ventilation emis-sions exceeded 10% of the guidelines. However,because this enclosure exhausted to stack UB-110,its contribution was not specifically identified andwas included in the stack emissions.
6.1.1 Sample Collection andAnalytical Procedure
Uranium stack losses were measured con-tinuously on monitored operating process exhauststacks in 2002. Particulate matter (includinguranium) was filtered from the stack emissions.Filters at each location were changed routinely,from one to three times per week, and wereanalyzed for total uranium. In addition, the samp-ling probes and tubing were removed quarterlyand were washed with nitric acid; the washingwas analyzed for total uranium. At the end of theyear, the probe-wash data were included in the

Oak Ridge Reservation
6-2 Y-12 Environmental Monitoring Programs
Fig. 6.1. Total curies of uranium dischargedfrom the Y-12 Complex to the atmosphere,1997–2002.
Fig. 6.2. Total kilograms of uraniumdischarged from the Y-12 Complex to theatmosphere, 1997–2002.
final calculations in determining total emissionsfrom each stack.
6.1.2 Results
An estimated 1.07 × 10⁻² Ci (3.8 kg) ofuranium was released into the atmosphere in 2002as a result of Y-12 activities (Figs. 6.1 and 6.2).The specific activity of enriched uranium is muchgreater than that of depleted uranium, and about82% of the curie release was composed ofemissions of enriched uranium particulate, eventhough approximately 3.5% of the total mass ofuranium released was enriched material.
6.2 Y-12 COMPLEXNONRADIOLOGICALAIRBORNE EMISSIONSMONITORING
The release of nonradiological contaminantsinto the atmosphere at the Y-12 Complex occursas a result of plant production, maintenance, wastemanagement operations, and steam generation.Most process operations are served by ventilationsystems.
In CY 2002, the Y-12 Complex had 32 indi-vidual air permits. Approximately two-thirds ofthe permitted air sources release primarily non-radiological contaminants. The remaining one-third of the permitted sources process primarilyradiological materials. TDEC air permits for thenonradiological sources do not require stack
sampling or monitoring except for the opacitymonitors used at the steam plant to ensure com-pliance with visible emission standards. For non-radiological sources where direct monitoring ofairborne emissions is not required, monitoring ofkey process parameters is done to ensure com-pliance with all permitted emission limits. In thefuture, when the Y-12 Complex is issued its first-ever major-source (CAA Title V) operatingpermit, reporting of key process parameters isexpected to increase. Also, a new requirement forthe steam plant will require continuous emissionmonitoring for nitrogen oxides beginning in 2003.
The 2002 Y-12 Complex annual emission feewas calculated based on 10,033 tons per year ofallowable emission of regulated pollutants, withan annual emission fee of $130,429. In accordancewith TDEC regulations, Rule 1200-3-26-.02(9)(i),when there is no applicable standard or permitcondition for a pollutant, the allowable emissionsare based on the maximum actual emissions calcu-lations (maximum design capacity for8760 h/year). More than 90% of the Y-12 Com-plex pollutant emissions to the atmosphere areattributed to the operation of the steam plant. Theemission fee rate was based on $13 per tonof regulated-pollutant allowable emissions. Theactual emissions are much lower than the allow-able amount; however, major sources are requiredto pay their annual emission fees based onallowable emissions until the issuance of themajor source operating permit.

Annual Site Environmental Report
Y-12 Environmental Monitoring Programs 6-3
Table 6.1. Actual vs allowable air emissions from theOak Ridge Y-12 Complex, 2002
Pollutant
Emissions(tons/year) Percentage of
allowableActual Allowable
Particulate 24 931 2.6
Sulfur dioxide 2,748 20,803 13.2
Nitrogen oxidesa 1,007 7,718 13.1
Volatile organic compoundsa 2 37 5.4
Carbon monoxidea 23 543 4.2
aWhen there is no applicable standard or enforceable permit condition forsome pollutants, the allowable emissions are based on the maximum actualemissions calculation as defined in Tennessee Department of Environmentand Conservation Rule 1200-3-26-.02(2)(d)3 (maximum design capacity for8760 h/year). The emissions for both the actual and allowable emissions werecalculated based on the latest EPA compilation of air pollutant emissionfactors. (EPA 1995 and 1998. Compilation of Air Pollutant Emission FactorsAP-42, Fifth Edition, Volume 1: Stationary Point and Area Sources. U.S.Environmental Protection Agency, Research Triangle Park, N.C.January 1995 and September 1998.)
6.2.1 Results
The primary source of criteria pollutants atthe Y-12 Complex is the steam plant, where coaland natural gas are burned. Information regardingactual vs allowable emissions from the steamplant is provided in Table 6.1. In addition, theannual toxic release inventory report (required byEPCRA Sect. 313) provides information on othernonradiological Y-12 Complex air emissions(Sect. 2.2.16).
The east and west Y-12 Steam Plant stackopacity monitors were each operational more than99% of the time in 2002. Condition 9 of thecurrent Y-12 Stream Plant air permit requires thatcalibration error tests of the opacity monitoringsystems be performed on a biennial basis. The lastcalibration error tests for the opacity monitoringsystems were conducted on April 17 and 18, at theY-12 Steam Plant. The next tests will beperformed in April 2003. During 2002, there wasone 6-min period of excess emissions and oneoccasion when the monitor was out of service.Quarterly reports of the status of the Y-12 SteamPlant opacity monitors are submitted to personnelat TDEC within 30 days after the end of eachcalendar quarter. Table E.4 in Appendix E is a
record of excess emissions and out-of-serviceconditions for the east and west stack opacitymonitors for 2002.
6.3 Y-12 COMPLEX AMBIENTAIR MONITORING
In 1994, Y-12 Complex personnel issuedEvaluation of the Ambient Air MonitoringProgram at the Oak Ridge Y-12 Plant (MMES1994b) and worked with DOE and TDEC inreviewing the ambient air program for applic-ability and usefulness of the data. There are nofederal regulations, state regulations, or DOEorders that require this monitoring. All ambient airmonitoring systems at the Y-12 Complex areoperated as a best management practice. With thereduction of plant operations and improvedemission and administrative controls, levels ofmeasured pollutants have decreased significantlyduring the past several years. In addition, majorprocesses that result in emission of enriched anddepleted uranium are equipped with stacksamplers that have been reviewed and approvedby EPA to meet requirements of the NESHAPregulations. ORR air sampling stations, operated

Oak Ridge Reservation
6-4 Y-12 Environmental Monitoring Programs
Fig. 6.3. Locations of ambient air monitoring stations at the Y-12 Complex.
by ORNL in accordance with DOE orders, arelocated around the reservation. Their locationswere selected so that areas of potentially highexposure to the public are monitored continuouslyfor parameters of concern.
With agreement from TDEC personnel, theambient air-sampling program at the Y-12 Com-plex was significantly reduced, effective at theend of 1994. All sampling for fluoride, totalsuspended particulates, and particulate matter lessthan 10 microns in diameter (PM10) wasdiscontinued, and all but 3 of the 12 uraniumsamplers were shut down. Effective April 1, 1999,an agreement was reached according to whichTDEC personnel took over responsibility forsampling and analysis of the three remaininguranium samplers at the Y-12 Complex. Theuranium samplers were operated by the TDECduring 2002. On December 6, 1999, DOEsubmitted to TDEC a letter providing justificationfor reducing the number of on-site mercury-monitoring stations from four to two. EffectiveJanuary 1, 2000, operation of the two monitorslocated in the interior of the Complex (nearBuildings 9805-1 and 9422-13) was discontinued.The two boundary mercury-monitoring stations(stations 2 and 8) remain in operation. The loca-tions of these monitoring stations are shown inFig. 6.3. During 2002, the project to restart thehydrogen fluoride system at Building 9212 wasplaced on hold and will be reevaluated duringCY 2003.
6.3.1 Mercury
The Y-12 Complex ambient air monitoringprogram for mercury was established in 1986 as abest management practice. The objectives of theprogram are to establish a historical database ofmercury concentration in ambient air at the Y-12Complex, identify spatial and temporal trends inmercury vapor concentrations at Y-12, anddemonstrate protection of the environment andhuman health from releases of mercury from Y-12to the atmosphere. Beginning in CY 2000, thenumber of program monitoring stations wasreduced from four to two (see discussion inSect. 6.3). The two stations, Ambient Air StationNo. 2 and Ambient Air Station No. 8, are locatednear the east and west boundaries of the Y-12Complex, respectively (see Fig. 6.3). Since theirestablishment in 1986, stations 2 and 8 havemonitored mercury in ambient air continuouslywith the exception of short periods of downtimedue to power or equipment outages. In addition tothe Y-12 Complex monitoring stations, a controlor reference site was operated on Chestnut Ridgein the Walker Branch Watershed (Rain GaugeNo. 2) for a 20-month period in 1988 and 1989 toestablish background concentrations.
At each of the monitoring sites, airbornemercury vapor is collected by pulling ambient airthrough a sampling train consisting of a Teflonfilter, a flow-limiting orifice, and an iodated char-

Annual Site Environmental Report
Y-12 Environmental Monitoring Programs 6-5
Table 6.2. CY 2002 summary results for the Y-12 Complex mercury in ambient air monitoring programResults for the 1986 through 1988 monitoring period are shown for reference
Ambient air monitoring stations
Mercury vapor concentration (:g/m3)
2002Average
2002Maximum
2002Minimum
1986–1988Average
Station No. 2 (east end of Y-12) 0.004 0.0347 0.0017 0.010
Station No. 8 (west end of Y-12) 0.005 0.0130 0.0014 0.033
Reference Site, Rain Gauge No. 2 (1988a) N/A N/A N/A 0.006
Reference Site, Rain Gauge No. 2 (1989b) N/A N/A N/A 0.005
aData for period from February 9 through December 31, 1988. bData for period from January 1 through October 31, 1989.
coal glass sampling tube or trap. The flow-limiting orifice restricts air flow through thesampling train to ~1 L/min, although actual flowrates are measured weekly with a calibratedflowmeter. The iodated charcoal sampling tubesare changed out routinely, every 7 days. The char-coal in each trap is then analyzed for totalmercury by using cold vapor atomic fluorescenceafter acid digestion. Average concentration ofmercury vapor in air for each 7-day samplingperiod is calculated by dividing the total quantityof mercury collected on the charcoal by the totalvolume of air pulled through the charcoal trapduring the sampling period. During the first fewyears of the program, the Teflon filters in thesampling train were analyzed for particulatemercury, but this practice was discontinued in1989 after results revealed very low to undetec-table levels of particulate mercury.
As reported in previous annual site environ-mental reports, over the 17 years of the moni-toring program, average annual mercury vaporconcentrations at the Y-12 Complex mercurymonitoring sites have declined, especially sincethe initial 3 years of the monitoring program(1986 through 1988). Average mercury vaporconcentrations at Ambient Air Station 8 havedeclined almost tenfold and threefold at Station 2since the 1986–1988 period. Recent averageannual concentrations at the two boundarystations located at the east and west ends of theY-12 Complex are comparable to those measured
in 1988 and 1989 at the Chestnut Ridge referencesite and only slightly elevated above concen-trations reported for continental background (i.e.,~0.002 :g/m3). For 2002, the average mercuryconcentration was 0.0040 :g/m3 for Station 2(N = 46; standard error = ±0.0007) and0.0050 :g/m3 for Station 8 (N = 50; standard error= ±0.0004). These concentrations are higher,though not significantly different (Student’s t-test), than average concentrations reported for2001 (i.e., Station 2 = 0.0034 :g/m3; Station 8 =0.0042 :g/m3). Table 6.2 summarizes the 2002mercury results and lists the results from the1986–1988 period for comparison. Figure 6.4illustrates temporal trends in mercury concen-trations for the two active mercury-monitoringsites since the inception of the program in 1986through December 2002.
In conclusion, annual average ambientmercury concentrations during 2002 at the Y-12east and west boundary monitoring sites are com-parable to reference levels measured on ChestnutRidge in 1988 and 1989 and approach the averagevalues reported for continental background. Theseconcentrations are well below the AmericanConference of Governmental Industrial Hygienistsworkplace threshold limit value of 25 :g/m3
(time-weighted average for a normal 8-h workdayand 40-h work week) and the EPA referenceconcentration of 0.3 :g/m3 for mercury forchronic inhalation exposure.

Oak Ridge Reservation
6-6 Y-12 Environmental Monitoring Programs
Fig. 6.4. Temporal trends in mercury vapor concentration for the two active airborne mercury monitoringsites at the Oak Ridge Y-12 Complex, July 1986 through July 2002. The dashed line represents the EPAreference concentration of 0.3 :g/m3.
6.4 LIQUID DISCHARGES—Y-12 COMPLEX RADIO-LOGICAL MONITORINGSUMMARY
A radiological monitoring plan is in place atthe Y-12 Complex to address compliance withDOE orders and NPDES Permit TN002968. Thepermit, issued in 1995, required Y-12 to reevalu-ate its radiological monitoring plan and to submitresults from the monitoring program quarterly asan addendum to the NPDES Discharge Moni-toring Report. There were no discharge limits setby the NPDES permit for radionuclides; therequirement is to monitor and report. A revisedplan (LMES and H&R 1995) was fully imple-mented in 1995. The radiological monitoring planwas expanded at that time to allow sufficientcollection of data, such that an assessment ofalpha, beta, and gamma emitters, could be made.The intent was to more appropriately identifyparameters to be monitored and to establish
analytical detection limits necessary for doseevaluations.
Based on an analysis of operational history,expected chemical and physical relationships, andhistorical monitoring results, the plan was updatedagain in October 1997 (LMES 1997b). Under theexisting plan, effluent monitoring is conducted atthree types of locations: (1) treatment facilities,(2) other point-source and area-source discharges,and (3) instream locations. Operational historyand past monitoring results provide a basis forparameters routinely monitored under the plan(Table 6.3).
The radiological monitoring plan alsoaddresses monitoring of the sanitary sewer. TheY-12 Complex is permitted to discharge domesticwastewater to the city of Oak Ridge publiclyowned treatment works under Industrial andCommercial User Wastewater Discharge PermitNo. 1-91. As required by the discharge permit,radiological monitoring of this discharge isconducted and reported to the city of Oak Ridge,although there are no city-established limits.

Annual Site Environmental Report
Y-12 Environmental Monitoring Programs 6-7
Table 6.3. Radiological parameters monitored at the Y-12 Complex in 2002
Parameters Specific isotopes Rationale for monitoring
Uranium isotopes 238U, 235U, 234U, total U,weight % 235U
These parameters reflect the major activity,uranium processing, throughout the history ofY-12 and are the dominant detectable radiologicalparameters in surface water
Fission and activation products 90Sr, 3H, 99Tc, 137Cs These parameters reflect a minor activity at Y-12,processing recycled uranium from reactor fuelelements, from the early 1960s to the late 1980s,and will continue to be monitored as tracers forbeta and gamma radionuclides, although theirconcentrations in surface water are low
Transuranium isotopes 241Am, 237Np, 238Pu,239/240Pu These parameters are related to recycle uraniumprocessing. Monitoring has continued because oftheir half-lives and presence in groundwater
Other isotopes of interest 232Th, 230Th, 228Th, 226Ra,228Ra
These parameters reflect historical thoriumprocessing and natural radionuclides necessary tocharacterize background radioisotopes
Potential sources of radionuclides discharging tothe sanitary sewer have been identified inprevious studies at the Y-12 Complex as part of aninitiative to meet the “as low as reasonablyachievable” goals. The radiological monitoringneeds for the sanitary sewer were reviewed andsummarized in the 1997 update to the plan (LMES1997b).
Radiological monitoring of storm water is alsorequired by the NPDES permit. A comprehensivemonitoring plan has been designed to fullycharacterize pollutants in storm water runoff. Themost recent revision of this plan was issued inNovember 2002, Storm Water Pollution Preven-tion Plan for the Oak Ridge Y-12 Plant (BWXT2002) and incorporates radiological-monitoringrequirements. There are 77 storm water outfallsand monitoring points located at the Y-12Complex, and the NPDES permit requirescharacterization of a minimum of 25 storm wateroutfalls per year.
6.4.1 Results
Radiological monitoring plan locationssampled in 2002 are noted in Fig. 6.5. Table 6.4identifies the monitored locations, the frequencyof monitoring, and the sum of the percentages ofthe DOE derived concentration guides (DCGs) forradionuclides measured in 2002. Radiological datawere well below the allowable DCGs.
In 2002, the total mass of uranium andassociated curies released from the Y-12 Complexat the easternmost monitoring station, Station 17on Upper East Fork Poplar Creek, and thewesternmost monitoring station, at Bear Creekkilometer (BCK) 4.55 (the former NPDESOutfall 304), was 281 kg, or 0.132 Ci (Table 6.5).Figure 6.6 illustrates a 5-year trend of thesereleases. The total release is calculated by multi-plying the average concentration (grams per liter)by the average flow (million gallons per day).Converting units and multiplying by 365 days peryear yields the calculated discharge.
The City of Oak Ridge Industrial and Com-mercial User Wastewater Discharge Permit allowsthe Y-12 Complex to discharge wastewater to betreated at the Oak Ridge publicly owned treatmentworks through the East End Sanitary SewerMonitoring Station, also identified as SS-6(Fig. 6.5). Compliance samples are collected atthis location. No single radionuclide in the Y-12contribution to the sanitary sewer exceeded 4% ofthe DCGs. Summed percentages of DCGs calcul-ated from the Y-12 contribution to the sewer isabout one. Results of radiological monitoringwere reported to the city of Oak Ridge in quarterlymonitoring reports.
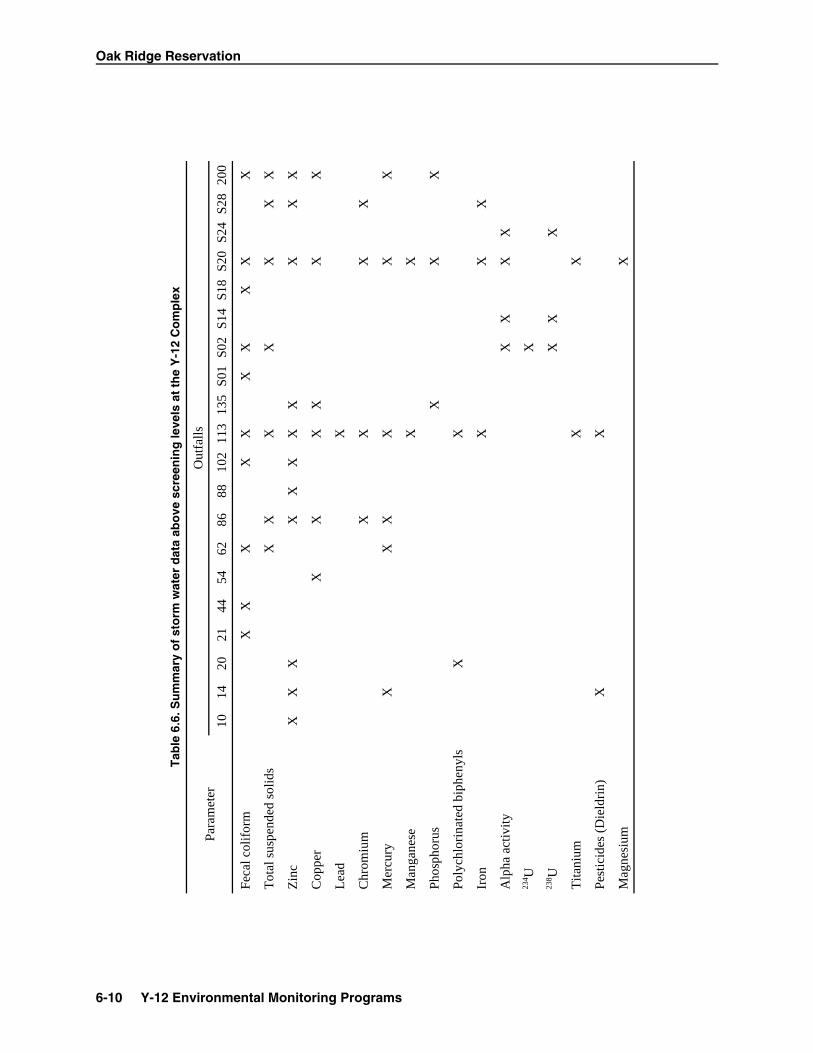
Table 6.6 presents a summary of 2002 stormwater data that exceeded screening levels. Moredetailed results are given in EnvironmentalMonitoring on the Oak Ridge Reservation: 2002

Oak Ridge Reservation
6-8 Y-12 Environmental Monitoring Programs
Fig. 6.5. Surface water and sanitary sewer radiological sampling locations at the Y-12 Complex.
Table 6.4. Summary of Y-12 Complex radiological monitoring plan sample requirements
OutfallNo.
LocationSample
frequencySample type
Sum of DCGa
percentage
Y-12 Complex wastewater treatment facilities501 Central Pollution Control Facility 1/week Composite during
batch operation2
502 West End Treatment Facility 1/week 24-hour composite 16503 Steam Plant Wastewater Treatment Facility 1/week 24-hour composite No flow512 Groundwater Treatment Facility 1/week 24-hour composite 2.8520 (402)b Steam condensate 1/week Grab No flow551 Central Mercury Treatment Facility 1/month 24-hour composite 2.9
Other Y-12 Complex point and area source dischargesS17 (301)b Kerr Hollow Quarry 1/month 24-hour composite 1.6S19 (302)b Rogers Quarry 1/month 24-hour composite 1.9
Y-12 Complex instream locationsBCK 4.55 (304)b Bear Creek, plant exit (west) 1/week 7-day composite 5Station 17 East Fork Poplar Creek, plant exit (east) 1/week 7-day composite 2.2200 North/south pipes 1/week 24-hour composite 4.1
Y-12 Complex Sanitary SewerSS-6 East End Sanitary Sewer Monitoring Station 1/weekc 7-day composite 1
aDCG = the derived concentration guide found in DOE Order 5400.5. bOutfall identifications were changed by the National Pollutant Discharge Elimination System permit effectiveJuly 1, 1995. Former outfall identifications are shown here in parentheses. cGamma emitters are analyzed once per year.

Annual Site Environmental Report
Y-12 Environmental Monitoring Programs 6-9
Table 6.5. Release of uranium fromthe Y-12 Complex to the off-siteenvironment as a liquid effluent,
1998–2002
YearQuantity released
Cia kg
Station 17
1998 0.076 127
1999 0.07 123
2000 0.063 126
2001 0.043 82
2002 0.062 140
Outfall 304
1998 0.091 148
1999 0.096 183
2000 0.093 168
2001 0.065 136
2002 0.07 141
a1 Ci = 3.7E+10 Bq.
Fig. 6.6. Five-year trend of Y-12 Complex release ofuranium to surface water.
Results (DOE 2003b). (See http://www.ornl.gov/aser.) Uranium remains the dominant radiologicalconstituent and increases during storm flow. Thisincrease is likely due to increased groundwaterflow and storm water runoff from historicallycontaminated areas.
6.5 NONRADIOLOGICALLIQUID DISCHARGES—Y-12 COMPLEX SURFACEWATER AND LIQUIDEFFLUENTS
The current Y-12 NPDES permit, issued onApril 28, 1995, and effective on July 1, 1995,requires sampling, analysis, and reporting forapproximately 92 outfalls. Major outfalls arenoted in Fig. 6.7. The number is subject to changeas outfalls are eliminated or consolidated or ifpermitted discharges are added. Currently, Y-12has outfalls and monitoring points in thefollowing water drainage areas: East Fork PoplarCreek, Bear Creek, and several unnamed tribu-taries on the south side of Chestnut Ridge. Thesecreeks and tributaries eventually drain to theClinch River.
Discharges to surface water allowed under thepermit include storm drainage, cooling water,cooling tower blowdown, steam condensate, andtreated process wastewaters, including effluentsfrom wastewater treatment facilities. Groundwaterinflow into sumps in building basements andinfiltration to the storm drain system are alsopermitted for discharge to the creek. Themonitoring data collected by the sampling andanalysis of permitted discharges are compared toNPDES limits if a limit exists for each parameter.Some parameters, defined as “monitor only,” haveno specified limits.
The water quality of surface streams in thevicinity of the Y-12 Complex is affected bycurrent and historical legacy operations. Dis-charges from the Y-12 Complex processes flowinto East Fork Poplar Creek before the water exitsthe Y-12 Complex. East Fork Poplar Creekeventually flows through the city of Oak Ridge toPoplar Creek and into the Clinch River. BearCreek water quality is affected by area sourcerunoff and groundwater discharges. The NPDESpermit requires regular monitoring and stormwater characterization in Bear Creek and severalof its tributaries.
The effluent limitations contained in thepermit are based on the protection of water qualityin the receiving streams. The permit emphasizesstorm water runoff and biological, toxicological,
Oak Ridge Reservation
6-10 Y-12 Environmental Monitoring Programs
Tab
le 6
.6. S
um
mar
y o
f st
orm
wat
er d
ata
abo
ve s
cree
nin
g le
vels
at
the
Y-1
2 C
om
ple
x
Para
met
erO
utfa
lls
1014
2021
4454
6286
8810
211
313
5S0
1S0
2S1
4S1
8S2
0S2
4S2
820
0
Feca
l col
ifor
mX
XX
XX
XX
XX
X
Tot
al s
uspe
nded
sol
ids
XX
XX
XX
X
Zin
cX
XX
XX
XX
XX
XX
Cop
per
XX
XX
XX
Lea
dX
Chr
omiu
mX
XX
X
Mer
cury
XX
XX
XX
Man
gane
seX
X
Phos
phor
usX
XX
Poly
chlo
rina
ted
biph
enyl
sX
X
Iron
XX
X
Alp
ha a
ctiv
ityX
XX
X23
4 UX
238 U
XX
X
Tita
nium
XX
Pest
icid
es (
Die
ldri
n)X
X
Mag
nesi
umX

Annual Site Environmental Report
Y-12 Environmental Monitoring Programs 6-11
Fig. 6.7. Major Y-12 Complex NPDES outfalls.
and radiological monitoring. Some of the require-ments in the permit and the status of complianceare as follows:• chlorine limitations based on water quality
criteria at the headwaters of East Fork PoplarCreek (monitoring ongoing);
• instream pH limitations on tributaries to BearCreek and various other tributaries on thesouth side of Chestnut Ridge (monitoringongoing);
• a radiological monitoring plan requiringmonitoring and reporting of uranium andother isotopes at pertinent locations (seeSect. 6.4);
• implementation of a storm water pollutionprevention plan and sampling andcharacterization of storm water at a minimumof 25 locations per year (see Sect. 6.5.2.);
• a requirement to manage the flow of EastFork Poplar Creek such that a minimum flowof 7 million gal/day is guaranteed by addingraw water from the Clinch River to theheadwaters of East Fork Poplar Creek (seeSect. 6.5.4);
• toxicity limitation for the headwaters of EastFork Poplar Creek (see Sect. 6.6); and
• quarterly toxicity testing at the wastewatertreatment facilities and storm drain locations(see Sect. 6.6).
An agreed-to consent order, datedSeptember 27, 1999, resolved outstanding appeals
to the NPDES permit by deleting mercurymonitoring requirements and instream limits fromthe permit and deferring them to the CERCLAprogram. The CERCLA record of decision willdefine any mercury remediation requirements forEast Fork Poplar Creek. As required, an NPDESpermit application was submitted in October1999, six months prior to the expiration date ofthe current permit (April 28, 2000). SinceApril 28, 2000, the Y-12 Complex has continuedoperation under the current permit.
6.5.1 Sanitary Wastewater
Sanitary wastewater from the Y-12 Complexis discharged to the city of Oak Ridge publiclyowned treatment works under Industrial andCommercial Users Wastewater PermitNumber 191. Monitoring is conducted under theterms of the permit for a variety of organic andinorganic pollutants. During 2002, the wastewaterflow in this system averaged about681,000 gal/day (2,576,000 L/day).
Compliance sampling is conducted at the EastEnd Sanitary Sewer Monitoring Station (SS-6,Fig. 6.5) weekly. This monitoring station is alsoused for 24-h flow monitoring. As part of the cityof Oak Ridge pretreatment program, city per-sonnel use this monitoring station to performcompliance monitoring as required by pretreat-ment regulations.

Oak Ridge Reservation
6-12 Y-12 Environmental Monitoring Programs
6.5.2 Storm Water
The development and implementation of astorm water pollution prevention plan at the Y-12Complex is designed to minimize the discharge ofpollutants in storm water runoff. This planrequires (1) characterization of storm water bysampling during storm events, (2) implementationof measures to reduce storm water pollution,(3) facility inspections, and (4) employee training.
Storm water outfalls at the Y-12 Complex arelocated in subbasins (drainage areas) and areroutinely sampled as required by the NPDESpermit. The outfalls are categorized into fourcategories based on characteristics of thedischarged water and are grouped within eachcategory based on similarity as to land use of areadrained and possible pollutants. A full chemicaland radiological characterization of the dischargeduring a rain event is not required of all stormwater outfalls each year. Representative samplingis permitted due to similarity within the sameoutfall groupings. A minimum of 25 storm wateroutfalls is required to be sampled and charac-terized each year during storm events, includingboth grab and composite sampling.
Each year approximately 1500 chemicalanalyses are conducted on storm water samples atthe Y-12 Complex. By assessing the quality ofstorm water discharges from the site and bydetermining potential sources of pollutantsaffecting storm water, effective controls can beidentified and put into place to reduce or eliminatethese pollutant sources.
The storm water pollution prevention plan isreviewed at least annually and is updated asnecessary to reflect changes in operations and toincorporate revised monitoring strategies based ondata from past years. The most recent revision ofthis plan was issued in November 2002.
6.5.3 Results and Progress inImplementing CorrectiveActions
In 2002, the Y-12 Complex experienced fourNPDES excursions. There were nine excursions in2001, six excursions in 2000, and four in 1999.Additional details on all Y-12 NPDES permitexcursions recorded in 2002 and the associated
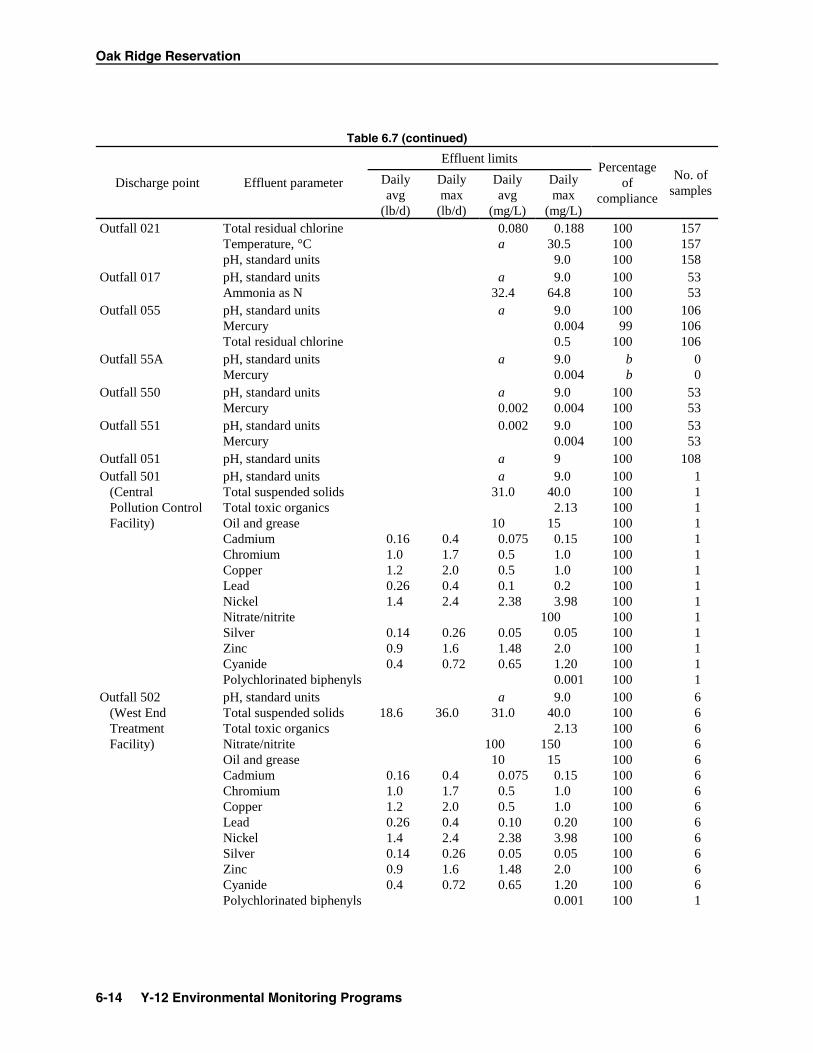
corrective actions are summarized in Appendix D,Table D.1. Table 6.7 lists the NPDES compliancemonitoring requirements and the 2002 compliancerecord.
During 2002, the Y-12 Complex experiencedtwo exceedances of the Industrial and CommercialUsers Wastewater Permit for discharge of sanitarywastewater to the city of Oak Ridge publiclyowned treatment works. Table 6.8 lists theIndustrial and Commercial Users WastewaterPermit compliance monitoring requirements andthe 2002 compliance record. Both of the exceed-ances, one for nickel (0.0362 mg/L) on January 9,2002, and one for copper (0.306 mg/L) June 20,2002, were of an unknown origin, and no specificcorrective actions were taken. Measurements forboth parameters have been well within permitlimits since the time of the specific exceedances.
Review of storm water data from past yearsindicates that pollutant loads increase duringstorm events and that water quality may beaffected by uncovered scrap metal storage sites.For example, some outfalls are showing levelsabove screening limits of total suspended solids,fecal coliform, PCBs, and metals (Zn, Cu, Pb, Cr,Hg, Mn, P, Fe, U, and Ti) during storm events(see Table 6.6). However, some monitoredpollutants are not present at specific outfalls.Detailed storm water data summary tables aregiven in Environmental Monitoring on the OakRidge Reservation: 2002 Results (DOE 2003b).(See http://www.ornl.gov/ aser/.)
6.5.4 Flow Management (orRaw Water)
Because of concern about maintaining waterquality and stable flow in the upper reaches ofEast Fork Poplar Creek, the NPDES permitrequires addition of Clinch River water to theheadwaters of East Fork Poplar Creek (North/South Pipe-Outfall 200 area) so that a minimumflow of 7 million gal/day (26.5 million L/day) ismaintained at the point where East Fork PoplarCreek leaves the reservation (Station 17). Thepermit required that this project be implementedby March 1997, but the work was completedahead of schedule (August 1996). With the com-pletion of this project, instream water tempera-tures decreased approximately 5°C (fromapproximately 26°C at the headwaters).

Annual Site Environmental Report
Y-12 Environmental Monitoring Programs 6-13
Table 6.7. NPDES compliance monitoring requirements and record for the Y-12 ComplexJanuary through December 2002
Discharge point Effluent parameter
Effluent limitsPercentage
ofcompliance
No. ofsamples
Dailyavg
(lb/d)
Dailymax
(lb/d)
Dailyavg
(mg/L)
Dailymax
(mg/L)Outfall 066 pH, standard units a 9 b 0Outfall 068 pH, standard units a 9 b 0Outfall 117 pH, standard units a 9 b 0Outfall 073 pH, standard units
Total residual chlorinea 9.0
0.5bb
0
Outfall 077 pH, standard unitsTotal residual chlorine
a 9.00.5
100100
1212
Outfall 122 pH, standard unitsTotal residual chlorine
a 9.00.5
bb
0
Outfall 133 pH, standard unitsTotal residual chlorine
a 9.00.5
bb
0
Outfall 125 pH, standard unitsTotal residual chlorine
a 9.00.5
10092
1413
Category I outfalls (storm water, steam condensate, cooling tower blowdown, and groundwater)
pH, standard units a 9 100 69
Category I outfalls (Outfalls S15 and S16)
pH, standard units a 10 100 4
Category II outfalls (cooling water, steam condensate, storm water, and groundwater)
pH, standard unitsTotal residual chlorine
a 9.00.5
100100
13972
Category II outfalls (S21, S22, S25, S26, S27, S28, and S29)
pH, standard units a 10 100 26
Outfall S19 (Rogers Quarry)
pH, standard units a 9 100 12
Category III outfalls (storm water, cooling water, cooling tower blowdown, steam condensate, and groundwater)
pH, standard unitsTotal residual chlorine
a 9.00.5
100100
161143
Outfall 201 (below the North/South pipes)
Total residual chlorineTemperature, °CpH, standard units 8.5
0.011aa
0.01930.5
99100100
158157157
Outfall 200 (North/ South pipes)
Oil and grease 10 15 100 159
Oak Ridge Reservation
6-14 Y-12 Environmental Monitoring Programs
Table 6.7 (continued)
Discharge point Effluent parameter
Effluent limitsPercentage
ofcompliance
No. ofsamples
Dailyavg
(lb/d)
Dailymax
(lb/d)
Dailyavg
(mg/L)
Dailymax
(mg/L)Outfall 021 Total residual chlorine
Temperature, °CpH, standard units
0.080a
0.18830.5
9.0
100100100
157157158
Outfall 017 pH, standard unitsAmmonia as N
a32.4
9.064.8
100100
5353
Outfall 055 pH, standard unitsMercuryTotal residual chlorine
a 9.00.0040.5
10099
100
106106106
Outfall 55A pH, standard unitsMercury
a 9.00.004
bb
00
Outfall 550 pH, standard unitsMercury
a0.002
9.00.004
100100
5353
Outfall 551 pH, standard unitsMercury
0.002 9.00.004
100100
5353
Outfall 051 pH, standard units a 9 100 108Outfall 501 (Central Pollution Control Facility)
pH, standard unitsTotal suspended solidsTotal toxic organicsOil and greaseCadmiumChromiumCopperLeadNickelNitrate/nitriteSilverZincCyanidePolychlorinated biphenyls
0.161.01.20.261.4
0.140.90.4
0.41.72.00.42.4
0.261.60.72
a31.0
100.0750.50.50.12.38
0.051.480.65
9.040.0
2.1315
0.151.01.00.23.98
1000.052.01.200.001
100100100100100100100100100100100100100100
11111111111111
Outfall 502 (West End Treatment Facility)
pH, standard unitsTotal suspended solidsTotal toxic organicsNitrate/nitriteOil and greaseCadmiumChromiumCopperLeadNickelSilverZincCyanidePolychlorinated biphenyls
18.6
0.161.01.20.261.40.140.90.4
36.0
0.41.72.00.42.40.261.60.72
a31.0
10010
0.0750.50.50.102.380.051.480.65
9.040.0
2.13150
150.151.01.00.203.980.052.01.200.001
100100100100100100100100100100100100100100
66666666666661

Annual Site Environmental Report
Y-12 Environmental Monitoring Programs 6-15
Table 6.7 (continued)
Discharge point Effluent parameter
Effluent limitsPercentage
ofcompliance
No. ofsamples
Dailyavg
(lb/d)
Dailymax
(lb/d)
Dailyavg
(mg/L)
Dailymax
(mg/L)Outfall 503 (Steam Plant Wastewater Treatment Facility)
pH, standard unitsTotal suspended solidsOil and greaseIronCadmiumChromiumCopperLeadZinc
12562.6
4.17
0.834.17
4.17
41783.4
4.17
0.834.17
4.17
a30.010
1.00.0750.200.200.101.0
9.040.015
1.00.150.200.400.201.0
bbbbbbbbb
000000000
Outfall 512 (Groundwater Treatment Facility)
pHIronPolychlorinated biphenyls
a 9.01.00.001
100100100
118118
12
Outfall 520 pH, standard units 9 b 0Outfall 05A pH 9 b 0 aNot applicable. bNo discharge.
Table 6.8. Y-12 Complex Discharge Point SS6, Sanitary Sewer Station 6January through December 2002
Effluent parameterNumber of
samplesDaily average value
(effluent limit)aDaily maximum value
(effluent limit)bPercentage ofcompliance
pH, standard units 54 c 9/6d 100Silver 52 0.05 0.1 100Arsenic 52 0.01 0.015 100Benzene 12 0.01 0.015 100Biochemical oxygen demand 52 200 300 100Cadmium 52 0.0033 0.005 100Chromium 52 0.05 0.075 100Copper 52 0.14 0.21 98Cyanide 12 0.041 0.062 100Iron 52 10 15 100Mercury 52 0.023 0.035 100Kjeldahl nitrogen 52 45 90 100Methylene chloride 12 0.027 0.041 100Nickel 52 0.021 0.032 98Oil and grease 52 25 50 100Lead 52 0.049 0.074 100Phenols—total recoverable 50 0.3 0.5 100Suspended solids 52 200 300 100Toluene 12 0.01 0.02 100Trichloroethene 12 0.018 0.027 100Zinc 52 0.35 0.75 100 aUnits in milligrams per liter unless otherwise indicated. bIndustrial and Commercial Users Wastewater Permit limits. cNot applicable. dMaximum value/minimum value.

Oak Ridge Reservation
6-16 Y-12 Environmental Monitoring Programs
During CY 2002 the flow of upper East ForkPoplar Creek was maintained in accordance withthe permit conditions. The average daily flowduring CY 2002 was 9.2 million gal/day.
6.6 BIOMONITORINGPROGRAM
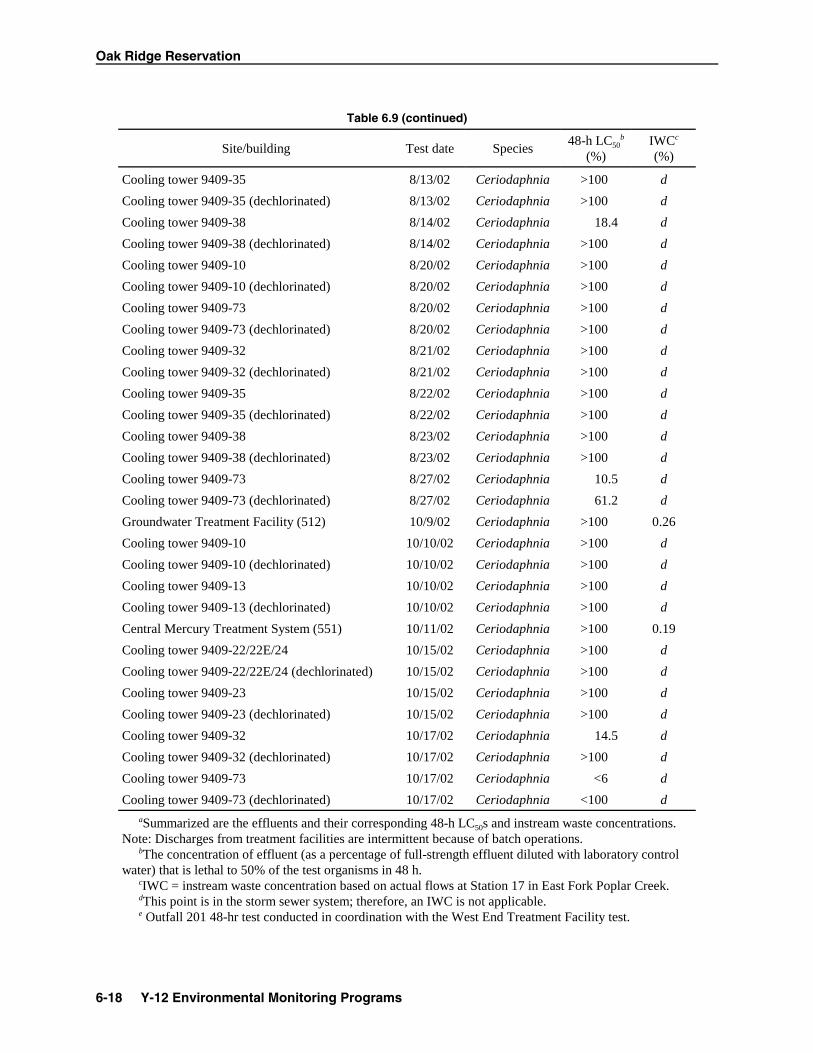
In accordance with the 1995 NPDES permit(Part III-C, p. 39), a biomonitoring program thatevaluates an East Fork Poplar Creek instreammonitoring location (Outfall 201), wastewatertreatment system discharges, and locations in thestorm sewer system is required. Table 6.9 sum-marizes the results of biomonitoring testsconducted during 2002 on effluent samples fromwastewater treatment systems and storm drainagesystems. The results of the biomonitoring tests areexpressed as the concentration of effluent that islethal to 50% of the test organisms (LC50) duringa 48-hour period. Thus, the lower the value, themore toxic an effluent. The LC50 is compared tothe effluent’s calculated instream waste concen-tration to determine the likelihood that thedischarged effluent would be harmful to aquaticlife in the receiving stream. If the LC50 is muchgreater than the instream waste concentration, it isless likely that there is an instream impact.
Effluent samples from each of the fourwastewater treatment system discharges weretested at least once during 2002 usingCeriodaphnia dubia. With LC50s greater than100% in each of four tests, effluents from theCentral Mercury Treatment System were con-sistently nontoxic throughout the year. Effluentfrom the Central Pollution Control Facility wasalso nontoxic in the one test conducted in 2002. Infour tests during 2002, the LC50s for effluent fromthe Groundwater Treatment Facility ranged from62.2% to greater than 100%. A LC50 of 16.5% wasmeasured in the single 2002 test of effluent fromthe West End Treatment Facility. In all cases thecalculated instream waste concentrations of theeffluent were less than the LC50s, suggesting thateffluents from the individual treatment facilitieswould not be acutely toxic to the aquatic life ofEast Fork Poplar Creek.
Various locations in the storm drainagesystem upstream of outfalls 200 and 201 were alsomonitored during the year, with an emphasis ontesting cooling tower discharges. When chlorine
or similar chemicals (i.e., bromine) were detectedin a storm sewer sample, side-by-side tests wereconducted with a sample that was treated(dechlorinated) to remove the chlorine orchlorine-like chemical. In all cases where toxicitywas detected in the nontreated sample (LC50 lessthan 100%), survival was higher in the dechlor-inated sample than in the nontreated sample. Inmost cases, the full-strength dechlorinated sampledid not continue to reduce Ceriodaphnia survival,indicating that toxicity was due solely to chlorineor similar chemicals. In the few cases whereCeriodaphnia survival continued to be reducedafter dechlorination, additional sources of toxicityare implicated. Because flow is not measured atthese storm-sewer points, it is not possible toknow the contribution of each to the total flow atOutfall 201 (i.e. the instream waste concen-tration). It is notable, however, that the results ofthe biomonitoring tests at Outfall 201 (Table 6.10)demonstrated that when all discharges werecombined (treated effluent, storm sewercontribution, plus flow management water) theresult was a consistent absence of toxicity atOutfall 201.
Table 6.10 summarizes the “no-observed-effect concentrations” (NOECs) and 96-hourLC50s for the instream monitoring locationOutfall 201. The NOEC is the concentration ofeffluent that does not reduce survival, growth, orreproduction of the biomonitoring test organismsduring a 6- or 7-day test. Thus, like the LC50, thelower the value, the more toxic the effluent. Waterfrom the instream monitoring point, Outfall 201,was tested four times in 2002 using fatheadminnow larvae (Pimephales promelas) andCeriodaphnia dubia. The NOECs were 100% forall Ceriodaphnia and fathead minnow tests; the96-h LC50s were consistently greater than 100%for both Ceriodaphnia and fathead minnows.
6.7 BIOLOGICALMONITORING ANDABATEMENT PROGRAMS
The NPDES permit issued to the Y-12National Security Complex in 1995 mandates aBiological Monitoring and Abatement Program(BMAP) with the objective of demonstrating thatthe effluent limitations established for the facility

Annual Site Environmental Report
Y-12 Environmental Monitoring Programs 6-17
Table 6.9. Y-12 Complex Biomonitoring Program summary information for wastewater treatmentsystems and storm sewer (cooling tower) effluents for 2002a
Site/building Test date Species48-h LC50
b
(%)IWCc
(%)
Cooling tower 9409-10 1/10/02 Ceriodaphnia 8.0 d
Cooling tower 9409-10 (dechlorinated) 1/10/02 Ceriodaphnia >100 d
Cooling tower 9409-13E 1/10/02 Ceriodaphnia 36.4 d
Cooling tower 9409-13E (dechlorinated) 1/10/02 Ceriodaphnia >100 d
Central Mercury Treatment System (551) 1/11/02 Ceriodaphnia >100 0.08
Cooling tower 9409-20 1/15/02 Ceriodaphnia 11.8 d
Cooling tower 9409-20 (dechlorinated) 1/15/02 Ceriodaphnia >100 d
Cooling tower 9409-22E 1/15/02 Ceriodaphnia 8.5 d
Cooling tower 9409-22E (dechlorinated) 1/15/02 Ceriodaphnia >100 d
Groundwater Treatment Facility (512) 1/15/02 Ceriodaphnia >100 0.11
Central Pollution Control Facility (501) 4/5/02 Ceriodaphnia >100 0.13
Groundwater Treatment Facility (512) 4/11/02 Ceriodaphnia 74.0 0.03
Cooling tower 9409-23 4/11/02 Ceriodaphnia >100 d
Cooling tower 9409-23 (dechlorinated) 4/11/02 Ceriodaphnia >100 d
Cooling tower 9409-26 4/11/02 Ceriodaphnia 8.3 d
Cooling tower 9409-26 (dechlorinated) 4/11/02 Ceriodaphnia >100 d
Central Mercury Treatment System (551) 4/12/02 Ceriodaphnia >100 0.09
Cooling tower 9409-15 4/16/02 Ceriodaphnia <6 d
Cooling tower 9409-15 (dechlorinated) 4/16/02 Ceriodaphnia 54.4 d
Cooling tower 9409-32 4/16/02 Ceriodaphnia >100 d
Cooling tower 9409-32 (dechlorinated) 4/16/02 Ceriodaphnia >100 d
Outfall 201e 6/5/02 Ceriodaphnia >100 d
West End Treatment Facility (502) 6/5/02 Ceriodaphnia 16.5 0.91
Outfall 200 6/12/02 Ceriodaphnia >100 d
Cooling tower 9409-15 7/11/02 Ceriodaphnia >100 d
Cooling tower 9409-15 (dechlorinated) 7/11/02 Ceriodaphnia >100 d
Cooling tower 9409-22/22E/24 7/11/02 Ceriodaphnia 71.8 d
Cooling tower 9409-22/22E/24 (dechlorinated) 7/11/02 Ceriodaphnia >100 d
Groundwater Treatment Facility (512) 7/11/02 Ceriodaphnia 62.2 0.05
Central Mercury Treatment System (551) 7/12/02 Ceriodaphnia >100 0.07
Cooling tower 9409-13 7/16/02 Ceriodaphnia >100 d
Cooling tower 9409-13 (dechlorinated) 7/16/02 Ceriodaphnia >100 d
Cooling tower 9409-20 7/16/02 Ceriodaphnia >100 d
Cooling tower 9409-20 (dechlorinated) 7/16/02 Ceriodaphnia >100 d
Oak Ridge Reservation
6-18 Y-12 Environmental Monitoring Programs
Table 6.9 (continued)
Site/building Test date Species48-h LC50
b
(%)IWCc
(%)
Cooling tower 9409-35 8/13/02 Ceriodaphnia >100 d
Cooling tower 9409-35 (dechlorinated) 8/13/02 Ceriodaphnia >100 d
Cooling tower 9409-38 8/14/02 Ceriodaphnia 18.4 d
Cooling tower 9409-38 (dechlorinated) 8/14/02 Ceriodaphnia >100 d
Cooling tower 9409-10 8/20/02 Ceriodaphnia >100 d
Cooling tower 9409-10 (dechlorinated) 8/20/02 Ceriodaphnia >100 d
Cooling tower 9409-73 8/20/02 Ceriodaphnia >100 d
Cooling tower 9409-73 (dechlorinated) 8/20/02 Ceriodaphnia >100 d
Cooling tower 9409-32 8/21/02 Ceriodaphnia >100 d
Cooling tower 9409-32 (dechlorinated) 8/21/02 Ceriodaphnia >100 d
Cooling tower 9409-35 8/22/02 Ceriodaphnia >100 d
Cooling tower 9409-35 (dechlorinated) 8/22/02 Ceriodaphnia >100 d
Cooling tower 9409-38 8/23/02 Ceriodaphnia >100 d
Cooling tower 9409-38 (dechlorinated) 8/23/02 Ceriodaphnia >100 d
Cooling tower 9409-73 8/27/02 Ceriodaphnia 10.5 d
Cooling tower 9409-73 (dechlorinated) 8/27/02 Ceriodaphnia 61.2 d
Groundwater Treatment Facility (512) 10/9/02 Ceriodaphnia >100 0.26
Cooling tower 9409-10 10/10/02 Ceriodaphnia >100 d
Cooling tower 9409-10 (dechlorinated) 10/10/02 Ceriodaphnia >100 d
Cooling tower 9409-13 10/10/02 Ceriodaphnia >100 d
Cooling tower 9409-13 (dechlorinated) 10/10/02 Ceriodaphnia >100 d
Central Mercury Treatment System (551) 10/11/02 Ceriodaphnia >100 0.19
Cooling tower 9409-22/22E/24 10/15/02 Ceriodaphnia >100 d
Cooling tower 9409-22/22E/24 (dechlorinated) 10/15/02 Ceriodaphnia >100 d
Cooling tower 9409-23 10/15/02 Ceriodaphnia >100 d
Cooling tower 9409-23 (dechlorinated) 10/15/02 Ceriodaphnia >100 d
Cooling tower 9409-32 10/17/02 Ceriodaphnia 14.5 d
Cooling tower 9409-32 (dechlorinated) 10/17/02 Ceriodaphnia >100 d
Cooling tower 9409-73 10/17/02 Ceriodaphnia <6 d
Cooling tower 9409-73 (dechlorinated) 10/17/02 Ceriodaphnia <100 d
aSummarized are the effluents and their corresponding 48-h LC50s and instream waste concentrations.Note: Discharges from treatment facilities are intermittent because of batch operations. bThe concentration of effluent (as a percentage of full-strength effluent diluted with laboratory controlwater) that is lethal to 50% of the test organisms in 48 h. cIWC = instream waste concentration based on actual flows at Station 17 in East Fork Poplar Creek. dThis point is in the storm sewer system; therefore, an IWC is not applicable. e Outfall 201 48-hr test conducted in coordination with the West End Treatment Facility test.

Annual Site Environmental Report
Y-12 Environmental Monitoring Programs 6-19
protect the classified uses of the receiving stream,East Fork Poplar Creek. The BMAP consists offour major tasks that reflect complementaryapproaches to evaluating the effects of Y-12 Com-plex discharges on the aquatic integrity of EastFork Poplar Creek. These tasks are (1) toxicitymonitoring, (2) biological indicator studies,(3) bioaccumulation studies, and (4) ecologicalsurveys of the periphyton, benthic macro-invertebrate, and fish communities.
Trends of increases in species richness anddiversity at upstream locations over the lastdecade, along with similar but more subtle trendsin a number of other BMAP indicators, demon-strate that the overall ecological health of EastFork Poplar Creek continues to improve. How-ever, the pace of improvement in the health ofEast Fork Poplar Creek has slowed in recentyears, and fish and invertebrate communitiescontinue to be degraded in comparison withsimilar communities in reference streams.
6.7.1 Toxicity Monitoring
Toxicity monitoring employs EPA-approvedmethods with Ceriodaphnia dubia and fatheadminnows to provide systematic information that isused to verify the biological water quality of East
Fork Poplar Creek at intervals throughout theyear. Ceriodaphnia tests were conducted quarterlyin 2002 for one site upstream of Bear Creek Road[East Fork Poplar Creek kilometer (EFK) 24.1]. Inaddition, quarterly toxicity tests with both fatheadminnows and Ceriodaphnia were conducted atOutfall 201 as required by the Y-12 Complex’sNPDES permit. Because of the close proximity ofOutfall 201 (an instream NPDES location in upperEast Fork Poplar Creek) to EFK 25.1, the tests ofwater from Outfall 201 also met the intent of theY-12 BMAP Plan (Adams et al. 2000) to conductquarterly toxicity tests at the latter location.
No evidence for toxicity was observed in anyof the 2002 Ceriodaphnia tests (both East ForkPoplar Creek sites) or fathead minnow tests(Outfall 201). These results are consistent with thefindings of previous Ceriodaphnia and fatheadminnow tests conducted since flow managementbegan in the latter half of 1996. Similarly, toxicityof East Fork Poplar Creek water in other chronictests involving fish embryos and clams, whichappear more sensitive to water quality conditionsin the stream, continues to decrease. Fish embryo-larval test results are discussed in Sect. 6.7.3;clam tests are discussed in Sect. 6.7.4.
Table 6.10. Y-12 Complex Biomonitoring Program summary informationfor Outfall 201 for 2002a
Site Test date SpeciesNOECb
(%)96-h LC50
c
(%)
Outfall 201 1/9 CeriodaphniaFathead minnow
100100
>100>100
Outfall 201 4/10 CeriodaphniaFathead minnow
100100
>100>100
Outfall 201 7/10 CeriodaphniaFathead minnow
100100
>100>100
Outfall 201 10/9 CeriodaphniaFathead minnow
100100
>100>100
aSummarized are the no-observed effect concentrations (NOECs) and the 96-h LC50sfor the instream monitoring location, Outfall 201. bNOEC as a percentage of full-strength effluent from Outfall 201 diluted withlaboratory control water. The NOEC must equal one of the test concentrations and isthe concentration that does not reduce Ceriodaphnia survival or reproduction orfathead minnow survival or growth. cThe concentration of effluent (as a percentage of full-strength effluent diluted withlaboratory control water) that is lethal to 50% of the test organisms in 96 h.

Oak Ridge Reservation
6-20 Y-12 Environmental Monitoring Programs
Fig. 6.8. Semiannual average mercury concentrations in muscle fillets of redbreast sunfish andwater in East Fork Poplar Creek at Station 17 through spring 2002.
6.7.2 Bioaccumulation Studies
Mercury and PCBs have been historicallyelevated in East Fork Poplar Creek fish relative tofish in uncontaminated reference streams. Fish aremonitored regularly in East Fork Poplar Creek formercury and PCBs to assess spatial and temporaltrends in bioaccumulation associated with on-going remedial activities and plant operations. Aspart of this monitoring effort, redbreast sunfish(Lepomis auritus) were sampled twice during2002 from the mid to upper reaches of East ForkPoplar Creek and were analyzed for tissue concen-trations of these two environmental contaminants.Largemouth bass (Micropterus salmoides) werecollected once in 2002 from a site in upper EastFork Poplar Creek (EFK 23.4) to monitormaximum bioaccumulation in larger piscivorousfish of the system. Stoneroller minnows(Campostoma anomalum) were collected fromEFK 24.5 to evaluate potential ecological
concerns associated with the accumulation ofother metals by these prey fish.
Mercury concentrations remained muchhigher during 2002 in fish from East Fork PoplarCreek than in fish from reference streams.Elevated mercury concentrations in Upper EastFork Poplar Creek fish indicate that the Y-12Complex remains a continuing source of mercuryto fish in the stream. Following significantdecreases in the mid-1990s, mercury concen-trations in water in Upper East Fork Poplar Creekhave continued to fall, although less dramaticallyin recent years, while mercury concentrations infish have remained relatively constant over thelast several years (Fig. 6.8).
PCB concentrations measured in East ForkPoplar Creek sunfish during 2002 were withinranges typical of past monitoring efforts at thesesites (Fig. 6.9). Mean PCB concentrations wereagain highest at sampling locations upstream ofBear Creek Road, indicating a continuing PCBsource or sources within the Y-12 Complex.

Annual Site Environmental Report
Y-12 Environmental Monitoring Programs 6-21
Fig. 6.9. Mean concentrations of PCBs in redbreast sunfish muscle fillets in East Fork PoplarCreek at Station 17 through spring 2002.
6.7.3 Biological IndicatorStudies
The biological indicator task is designed toevaluate the effects of water quality and otherenvironmental variables on the health and repro-ductive condition of individual fish and fishpopulations in East Fork Poplar Creek. Redbreastsunfish were sampled from three sites in East ForkPoplar Creek and from two reference streams inthe spring of 2002 prior to the onset of thebreeding season. A fish embryo-larval test usingthe medaka (Oryzias latipes), a small model fish,was conducted on water from several sites in EastFork Poplar Creek in order to test the ability offish young to successfully develop in the stream.
Overall trends in many contamination-relatedbioindicators suggest that there has beenmeasurable improvement in overall fish health inUpper East Fork Poplar Creek in recent years.However, the health and reproductive condition ofsunfish from East Fork Poplar Creek sitesupstream of Bear Creek remains lower in severalrespects than in fish from reference sites ordownstream East Fork Poplar Creek sites.
East Fork Poplar Creek water had no adverseeffect on fish embryos in a single medakaembryo-larval toxicity test conducted during 2002.This is the first year since these tests began in the
early 1990s that water from sites in East ForkPoplar Creek did not prove to be toxic to varyingdegrees in this sensitive test involving fish earlydevelopmental stages.
6.7.4 Ecological Surveys
Periphyton was monitored quarterly during2002 from three sites along East Fork PoplarCreek. Algal biomass and photosynthetic ratesremained higher than in reference streams.Concentrations of various metals continued to beelevated in East Fork Poplar Creek periphyton.
Fish communities were monitored in thespring and fall of 2002 at five sites along EastFork Poplar Creek and at two reference streams.In recent years, overall species richness and thenumber of pollution-sensitive fish species haveincreased at all sampling locations below LakeReality (Fig. 6.10). However, fish communities inEast Fork Poplar Creek continue to lag behindreference stream communities in these and otherimportant metrics of community health.
Benthic macroinvertebrate communities weremonitored at three sites in East Fork Poplar Creekand at two reference streams in the spring and fallof 2002. The macroinvertebrate communities atEFK 23.4 and EFK 24.4 remained significantlydegraded as compared with reference communi-

Oak Ridge Reservation
6-22 Y-12 Environmental Monitoring Programs
Fig. 6.10. Comparison of mean abundance of sensitive fish species collected during each yearfrom 1985 through 2002 from four sites in East Fork Poplar Creek and a reference site (Brushy Fork).Results for an additional site in Upper East Fork Poplar Creek (EFK 24.4) and a second reference site (HindsCreek) are not shown.
ties (Fig. 6.11). Increases in total richness and therichness of pollution-tolerant taxa continue at theUpper East Fork Poplar Creek sites, although thepace of improvement in benthic macroinvertebratecommunities has slowed in recent years.
The effects of in situ exposure on clamgrowth and survival were tested during 2002 atthree sites in East Fork Poplar Creek and at threereference streams. As in similar tests conducted inprevious years, clam survival was significantlyimpacted at EFK 23.4 and EFK 24.4, and growthwas reduced at all tested East Fork Poplar Creeksites. However, clam survival at the two UpperEast Fork Poplar Creek locations significantlyimproved in the 2002 test as compared withprevious tests.
6.8 Y-12 COMPLEX AMBIENTSURFACE WATERMONITORING
Routine surface water surveillance moni-toring, above and beyond that required by theNPDES permit, is performed as a best manage-ment practice. The Y-12 Environmental Com-pliance Department staff monitor the surfacewater as it exits from each of the three hydro-geologic regimes that serve as an exit pathway forsurface water (Fig. 6.12).
Monitoring is conducted in East Fork PoplarCreek at Station 17 (9422-1) near the junction ofScarboro and Bear Creek roads. The currentsampling program consists of two 48-h com-posites plus a 3-day weekend composite. Thesesamples are analyzed for mercury, ammonia-N,ICP metals, and total suspended solids.

Annual Site Environmental Report
Y-12 Environmental Monitoring Programs 6-23
Fig. 6.11. Total taxonomic richness (mean number of taxa/sample) and totaltaxonomic richness of the Ephemeroptera, Plecoptera, and Trichoptera (meannumber of EPT taxa/sample) of the benthic macroinvertebrate communities inEast Fork Poplar Creek and two reference sites, one on Brushy Fork and oneon Hinds Creek (BFK 7.6 and HCK 20.6), spring data only. (EPT taxa includerelatively pollution-sensitive species.)
Monitoring is conducted in Bear Creek atBCK 4.55 (former NPDES Station 304), which isat the western boundary of the Y-12 Complex areaof responsibility. A surveillance sample (a 7-daycomposite sample) is collected monthly foranalysis for mercury; anions (sulfate, chloride,nitrate, nitrite); ICP metals; total phenols; andtotal suspended solids.
The exit pathway from the Chestnut RidgeHydrogeologic Regime is monitored via NPDESlocation S19 (former NPDES Station 302) atRogers Quarry. S19 is an instream location ofMcCoy Branch and is sampled monthly (a 24-hcomposite) for ICP metals. The NPDES require-ment for this location other than a pH limit is tomonitor and report metals data only.

Oak Ridge Reservation
6-24 Y-12 Environmental Monitoring Programs
Fig. 6.12. Locations of Y-12 Complex surface water surveillance sampling stations.
In addition to these exit pathway locations, anetwork of real-time monitors is located atinstream locations along Upper East Fork PoplarCreek and at key points on the storm drain systemthat flows to the creek. The Surface WaterHydrological Information Support System isavailable for real-time water quality measure-ments, such as pH, temperature, dissolved oxygen,conductivity, and chlorine. The locations arenoted in Fig. 6.13. Not all locations or parametersare operated on a routine basis.
For nonradiological parameters that aresampled and detected above the analytical methodreporting detection limit, the data are comparedwith Tennessee water quality criteria. The mostrestrictive of either the freshwater fish and aquaticlife criterion maximum concentration or therecreation concentration for organisms onlystandard is used. This comparison serves as arecord of water quality, and the comparison tostate water quality criteria limits is for informa-tional purposes only; as such, no attempt is madeto achieve the lowest possible detection limit forall parameters.
More than 4900 surface water surveillancesamples were collected in 2002. Comparisonswith Tennessee water quality criteria indicate that
only mercury and copper from samples collectedat Station 17 were detected at values exceeding acriteria maximum. Results are shown inTable 6.11. Of all the parameters measured in thesurface water as a best management practice,mercury is the only demonstrated contaminant ofconcern.
Additional surface-water sampling is con-ducted on Bear Creek in accordance with the Y-12Groundwater Protection Program to monitortrends throughout the Bear Creek HydrogeologicRegime (see Sect. 6.10.3.3).
6.9 Y-12 SEDIMENTSAMPLING
Historical data have shown that mercury,PCBs, and isotopes of uranium are present atdetectable levels in sediment. Therefore, as a bestmanagement practice, the Y-12 Complex main-tains an annual sampling program to determinewhether these constituents are accumulating in thesediments of East Fork Poplar Creek and BearCreek as a result of Y-12 Complex discharges.Results of the most recent monitoring activity are

Annual Site Environmental Report
Y-12 Environmental Monitoring Programs 6-25
Fig. 6.13. Surface Water Hydrological Information Support System monitoring locations.
Table 6.11. Surface water surveillance measurements exceeding Tennesseewater quality criteria at the Y-12 Complex, 2002
Parameterdetected
LocationNumber of
samples
Concentration (mg/L) Water qualitycriteria(mg/L)
Number ofmeasurements
exceeding criteriaDetection
limitMax Avg
Copper Station 17 149 0.02 0.022 <0.02 0.0177 1
Mercury Station 17 365 0.00021 0.0173 <0.0005 0.000051 365
given in Table 6.12. The monitoring resultsindicate that the levels of mercury and isotopes ofuranium and thorium have not significantlychanged. The PCB level did increase this year atthe Station 17 site but this finding is based ononly one result.
This activity is also used to comply with DOEOrder 5400.5, which states in Chapter II.3.a.2 thatmeasures be taken to prevent the buildup ofradionuclides in sediments caused by releases ofwaste streams to natural waterways. The orderlimits the amount of activity that may be presentin released settleable solids. Because wastestreams from the Y-12 Complex have very lowsettleable-solid contents, this sampling program tomeasure activity in the sediments of East ForkPoplar Creek and Bear Creek is used to determinewhether a buildup of radionuclide concentrationsis occurring.
6.10 GROUNDWATERMONITORING AT THEY-12 COMPLEX
More than 200 sites have been identified atthe Y-12 Complex that represent known orpotential sources of contamination to theenvironment as a result of past waste managementpractices. Figure 6.14 depicts the major facilitiesconsidered as known and/or potential contaminantsource areas for which groundwater monitoringwas performed during CY 2002. Because of thiscontamination, extensive groundwater monitoringis required to comply with regulations and DOEorders.
During CY 2002, routine groundwater moni-toring at Y-12 was conducted primarily by twoprograms, the Y-12 Groundwater ProtectionProgram, managed by BWXT Y-12 LLC, and theWater Resources Restoration Program, managedby Bechtel Jacobs Company, LLC. Each program

Oak Ridge Reservation
6-26 Y-12 Environmental Monitoring Programs
Tab
le 6
.12.
Res
ult
s o
f Y
-12
Co
mp
lex
sed
imen
t m
on
ito
rin
g
Para
met
er19
99+
/–M
DA
a20
00+
/–M
DA
2001
+/–
MD
A20
02+
/–M
DA
Stat
ion
1722
6 Ra
(pC
i/g)
2.4
0.31
0.02
6–0
.67
0.48
0.30
–0.0
200.
910.
065
0.05
30.
056
0.56
228 T
h (p
Ci/g
)0.
570.
082
0.02
20.
072
0.15
0.27
0.03
90.
056
0.09
80.
0006
30.
0035
0.00
5823
0 Th
(pC
i/g)
0.50
0.07
40.
081
0.79
0.3
0.16
0.11
0.06
40.
062
–0.0
150.
006
0.00
5723
2 Th
(pC
i/g)
0.48
0.07
70.
003
0.10
0.09
90.
130.
042
0.04
30.
062
0.00
200.
0029
0.00
4423
4 U (
pCi/g
)2.
70.
290.
002
1.4
0.19
0.01
71.
50.
260.
063
0.25
0.03
90.
0054
235 U
(pC
i/g)
0.11
0.02
50.
003
0.07
80.
030.
007
0.05
00.
041
0.02
30.
012
0.00
780.
0072
238 U
(pC
i/g)
2.8
0.3
0.00
63
0.37
0.01
41.
20.
220.
044
0.31
0.04
40.
0054
Mer
cury
(:g
/g)
14.6
18.5
6.67
8.14
Tot
al p
olyc
hlor
inat
ed
biph
enyl
s ( :
g/kg
)28
018
027
014
00
BC
K 9
.422
6 Ra
(pC
i/g)
2.5
0.24
0.05
70.
920.
50.
411.
00.
770.
075
0.26
0.09
60.
3122
8 Th
(pC
i/g)
0.52
0.06
50.
009
0.54
0.19
0.16
0.51
0.13
0.03
80.
510.
070.
0075
230 T
h (p
Ci/g
)0.
240.
034
0.00
40.
380.
150.
110.
210.
075
0.01
60.
210.
038
0.00
7423
2 Th
(pC
i/g)
0.41
0.05
80.
002
0.28
0.13
0.07
80.
410.
110.
016
0.37
0.05
50.
0043
234 U
(pC
i/g)
3.6
0.45
0.02
03.
50.
420.
016
1.1
0.21
0.08
32.
10.
210.
0043
235 U
(pC
i/g)
0.20
0.05
90.
010
0.16
0.04
70.
0079
0.11
0.06
10.
022
0.10
0.02
20.
0051
238 U
(pC
i/g)
7.6
0.89
0.00
86.
70.
770.
0064
2.5
0.37
0.04
24.
10.
40.
0045
Mer
cury
(:g
/g)
0.21
50.
262
0.18
70.
277
Tot
al p
olyc
hlor
inat
ed
biph
enyl
s ( :
g/kg
)35
034
055
059
0
a M
inim
um d
etec
tabl
e ac
tivity
.

Annual Site Environmental Report
Y-12 Environmental Monitoring Programs 6-27
Fig. 6.14. Known or potential contaminant sources for which groundwater monitoring was performed during CY 2002.
is responsible for monitoring groundwater to meetspecific compliance requirements. In CY 2002,the Groundwater Protection Program performedmonitoring to comply with DOE orders, while theWater Resources Restoration Program performedgroundwater monitoring in compliance withCERCLA and RCRA. In addition to the moni-toring performed by the Water Resources Restora-tion Program, BJC, monitors groundwater at thesolid waste disposal landfills on Chestnut Ridgeand the Environmental Management WasteManagement Facility (CERCLA) in Bear CreekValley.
Although the Groundwater ProtectionProgram, the Water Resources RestorationProgram, and other projects have differing techni-cal objectives and responsibilities, considerableefforts are made to maintain consistency ingroundwater monitoring activities at the Y-12Complex. Communication among the programshas been crucial in eliminating any redundanciesin monitoring activities. In addition, communica-tion and mutual cooperation provided for moreconsistent and efficient data collection, evalua-
tion, and overall quality. All groundwatermonitoring data obtained by all programs areevaluated to provide comprehensive reporting bythe Groundwater Protection Program.
6.10.1 Hydrogeologic Setting
The Y-12 Complex is divided into threehydrogeologic regimes, which are delineated bysurface water drainage patterns, topography, andgroundwater flow characteristics. The regimes arefurther defined by the waste sites they contain.These regimes include the Bear Creek Hydro-geologic Regime, the Upper East Fork PoplarCreek Hydrogeologic Regime, and the ChestnutRidge Hydrogeologic Regime (Fig. 6.15). Most ofthe Bear Creek and Upper East Fork Poplar Creekregimes are underlain by the ORR Aquitards. Theextreme southern portion of these two regimes isunderlain by the Maynardville Limestone, whichis part of the Knox Aquifer. The entire ChestnutRidge regime is underlain by the Knox Aquifer(Fig. 1.6).

Oak Ridge Reservation
6-28 Y-12 Environmental Monitoring Programs
Fig. 6.15. Hydrogeologic regimes at the Y-12 Complex.
In general, groundwater flow in the watertable interval follows topography. Shallowgroundwater flow in the Bear Creek regime andthe Upper East Fork regime is divergent from atopographic and groundwater table divide locatednear the western end of the Y-12 Complex. Theflow directions of shallow groundwater east andwest of the divide are predominantly easterly andwesterly, respectively. This divide defines theboundary between the Bear Creek and Upper EastFork regimes. In addition, flow converges towardthe primary surface streams from Pine Ridge andChestnut Ridge. In the Chestnut Ridge regime, agroundwater table divide exists that approxi-mately coincides with the crest of the ridge.Shallow groundwater flow, therefore, tends to betoward either flank of the ridge, with dischargeprimarily to surface streams and springs located inBethel Valley to the south and Bear Creek Valleyto the north.
In Bear Creek Valley, groundwater in theintermediate and deep intervals moves predomin-antly through fractures in the ORR Aquitards,converging toward and moving through fracturesand solution conduits in the Maynardville Lime-stone. Karst development in the MaynardvilleLimestone has a significant impact on ground-water flow paths in the water table andintermediate intervals. In general, groundwaterflow parallels the valley and geologic strike.Groundwater flow rates in Bear Creek Valley vary
widely; they are very slow within the deepinterval of the ORR aquitards but can be quiterapid within solution conduits in the MaynardvilleLimestone.
The rate of groundwater flow perpendicular togeologic strike from the ORR aquitards to theMaynardville Limestone has been estimated to bevery slow below the water table interval. Mostcontaminant migration appears to be via surfacetributaries to Bear Creek or along utility tracesand buried tributaries in the Upper East Forkregime. In the Bear Creek regime, strike-paralleltransport of some contaminants can occur withinthe ORR aquitards for significant distances.Continuous elevated levels of nitrate within theORR Aquitards are known to extend east and westfrom the S-3 Site for thousands of feet. Volatileorganic compounds at source units in the ORRAquitards, however, tend to remain close tosource areas because they tend to adsorb to thebedrock matrix, diffuse into pore spaces withinthe matrix, and degrade prior to migrating to exitpathways, where rapid transport for long distancesdoes occur. Regardless, extensive volatile organiccompound contamination occurs throughoutgroundwater in both the Bear Creek and UpperEast Fork regimes.
Groundwater flow in the Chestnut Ridgeregime is almost exclusively through fractures andsolution conduits in the Knox Group. Dischargepoints for intermediate and deep flow are not well

Annual Site Environmental Report
Y-12 Environmental Monitoring Programs 6-29
Table 6.13. Types and numbers of groundwater monitoring stations sampledat the Y-12 Complex during CY 2002
Bear Creek Chestnut RidgeUpper East Fork
Poplar CreekTotal
Conventional wells 67 40 51 158
Multiport wells 0 0 1 1
Surface water 17 5 10 32
Springs 6 4 2 12
Total number of monitoring stations 90 49 64 203
known. Groundwater is currently presumed toflow primarily toward Bear Creek Valley to thenorth and Bethel Valley to the south. Groundwaterfrom intermediate and deep zones may dischargeat certain spring locations along the flanks ofChestnut Ridge. Following the crest of the ridge,water table elevations decrease from west to east,demonstrating an overall easterly trend ingroundwater flow.
6.10.2 Well Installation andPlugging andAbandonment Activities
A number of monitoring devices are routinelyused for groundwater data collection at Y-12.Monitoring wells are permanent devices used forthe collection of groundwater samples; these areinstalled according to established regulatory andindustry specifications. Piezometers are primarilytemporary devices used to measure groundwatertable levels and are often constructed of polyvinylchloride or other low-cost materials. Otherdevices or techniques are sometimes employed togather data, including well points and pushprobes. No compliance monitoring wells wereinstalled in CY 2002. However, one characteriza-tion well was installed at the east end of Y-12 nearUpper East Fork Poplar Creek and twopiezometers were installed at the EMWMF site.The characterization well was installed as amultiport monitoring system with eight discretemonitoring intervals for monitoring a proposedtreatability study to evaluate bioremediationpotential of the East End volatile organiccompound plume. The two piezometers wereinstalled around the EMWMF site to evaluate
groundwater elevations for design of a secondwaste cell.
Well plugging and abandonment activities areconducted to protect human health and theenvironment, maintain the Y-12 monitoring wellnetwork, and to meet operational needs. Wellsthat are damaged beyond rehabilitation, thatinterfere with planned construction activities, orfrom which no useful data can be obtained, areselected for plugging and abandonment. In 2002,three wells were plugged and abandoned. Thesewells were located in the Oil Landfarm WasteManagement Area and were plugged during thefinal remedial actions at the Boneyard/Burnyard.
6.10.3 CY 2002 MonitoringProgram
Groundwater monitoring in CY 2002 wasperformed to comply with DOE orders andregulations by the Groundwater ProtectionProgram, Water Resources Restoration Program,and other BJC projects. Compliance requirementswere met by the monitoring of 159 wells,12 springs, and 32 surface water locations(Table 6.13). Figure 6.16 shows the locations ofORR perimeter/exit pathway groundwater moni-toring stations as specified in the ORR Environ-mental Monitoring Plan.
Comprehensive water quality results of moni-toring activities at Y-12 in CY 2002 are presentedin the annual Groundwater Monitoring Report(BWXT 2003).
Details of monitoring efforts performedspecifically for CERCLA baseline and remedia-tion evaluation are published in the FY 2002 andFY 2003 Water Resources Restoration Program

Oak Ridge Reservation
6-30 Y-12 Environmental Monitoring Programs
Fig. 6.16. Locations of ORR perimeter/exit pathway well, spring, and surface water monitoring stations in the Environmental Monitoring Plan for the Oak Ridge Reservation.
Sampling and Analysis Plans (BJC 2001),Sampling and Analysis Plan for the WaterResources Restoration Program for Fiscal Year2003 Oak Ridge Reservation, Oak Ridge,Tennessee (BJC 2002b), and the 2003 Remedia-tion Effectiveness Report (DOE 2003).
Groundwater monitoring compliancereporting to meet RCRA post-closure permitrequirements can be found in the RCRA annualreports (BJC 2003a, BJC 2003b, BJC 2003c).
6.10.4 Y-12 GroundwaterQuality
Historical monitoring efforts have shown thatfour types of contaminants have affected ground-water quality at Y-12: nitrate, volatile organiccompounds, metals, and radionuclides. Of these,nitrate and volatile organic compounds are themost widespread. Some radionuclides, particularlyuranium and 99Tc, are significant, principally inthe Bear Creek regime and the western and centralportions of the Upper East Fork regime. Tracemetals, the least extensive groundwatercontaminants, generally occur in a small area oflow-pH groundwater at the western end of Y-12,
near the S-2 and S-3 Sites. Historical data haveshown that plumes from multiple source unitshave mixed with one another and that con-taminants (other than nitrate and 99Tc) are nolonger easily associated with a single source.
6.10.4.1 Upper East Fork PoplarCreek HydrogeologicRegime
The Upper East Fork regime contains con-taminant source areas and surface water andgroundwater components of the hydrogeologicsystem within the production complex and UnionValley to the east and off the ORR. Among thethree hydrogeologic regimes at Y-12, the UpperEast Fork regime encompasses most of the knownand potential sources of surface and groundwatercontamination. A brief description of wastemanagement sites is given in Table 6.14.Chemical constituents from the S-3 Site (primarilynitrate and 99Tc) dominate groundwater contamin-ation in the western portion of the Upper EastFork regime, while groundwater in the easternportion, including Union Valley, is predominantlycontaminated with volatile organic compounds.

Annual Site Environmental Report
Y-12 Environmental Monitoring Programs 6-31
Table 6.14. History of waste management units and underground storage tanks included in CY 2002groundwater monitoring activities, Upper East Fork Poplar Creek Hydrogeologic Regimea
Site Historical data
New Hope Pond Built in 1963. Regulated flow of water in Upper East Fork Poplar Creek beforeexiting the Y-12 Complex grounds. Sediments include PCBs, mercury, and uraniumbut not hazardous according to toxicity characteristic leaching procedure. Closedunder RCRA in 1990
Salvage Yard Scrap MetalStorage Area
Used from 1950 to present for scrap metal storage. Some metals contaminated withlow levels of depleted or enriched uranium. Runoff and infiltration are the principalrelease mechanisms to groundwater
Salvage Yard Oil/ SolventDrum Storage Area
Primary wastes included waste oils, solvents, uranium, and beryllium. Both closedunder RCRA. Leaks and spills represent the primary contamination mechanisms forgroundwater
Salvage Yard Oil StorageTanks
Used from 1978 to 1986. Two tanks used to store PCB-contaminated oils, bothwithin a diked area
Salvage Yard DrumDeheader
Used from 1959 to 1989. Sump tanks 2063-U, 2328-U, and 2329-U receivedresidual drum contents. Sump leakage is a likely release mechanism to groundwater
Building 81-10 Area Staging facility. Potential historical releases to groundwater from leaks and spills ofliquid wastes or mercury. The building structure was demolished in 1995
Rust Garage Area Former vehicle and equipment maintenance area, including four former petroleumUSTs. Petroleum product releases to groundwater are documented
9418-3 Uranium Oxide Vault Originally contained an oil storage tank. Used from 1960 to 1964 to dispose ofnonenriched uranium oxide. Leakage from the vault to groundwater is the likelyrelease mechanism
Fire Training Facility Used for hands-on fire-fighting training. Sources of contamination to soil includeflammable liquids and chlorinated solvents. Infiltration is the primary releasemechanism to groundwater
Beta-4 Security Pits Used from 1968 to 1972 for disposal of classified materials, scrap metals, andliquid wastes. Site is closed and capped. Primary release mechanism to groundwateris infiltration
S-2 Site Used from 1945 to 1951. An unlined reservoir received liquid wastes. Infiltration isthe primary release mechanism to groundwater
Waste Coolant ProcessingArea
Used from 1977 to 1985. Former biodegradation facility used to treat wastecoolants from various machining processes. Closed under RCRA in 1988
East End Garage Used from 1945 to 1989 as a vehicle fueling station. Five USTs used for petroleumfuel storage were excavated, 1989 to 1993. Petroleum releases to the groundwaterare documented
Coal Pile Trench Located beneath the current steam plant coal pile. Disposals included solidmaterials (primarily alloys). Trench leachate is a potential release mechanism togroundwater
aAbbreviationsPCB = polychlorinated biphenyl.RCRA= Resource Conservation and Recovery Act.UST = underground storage tank
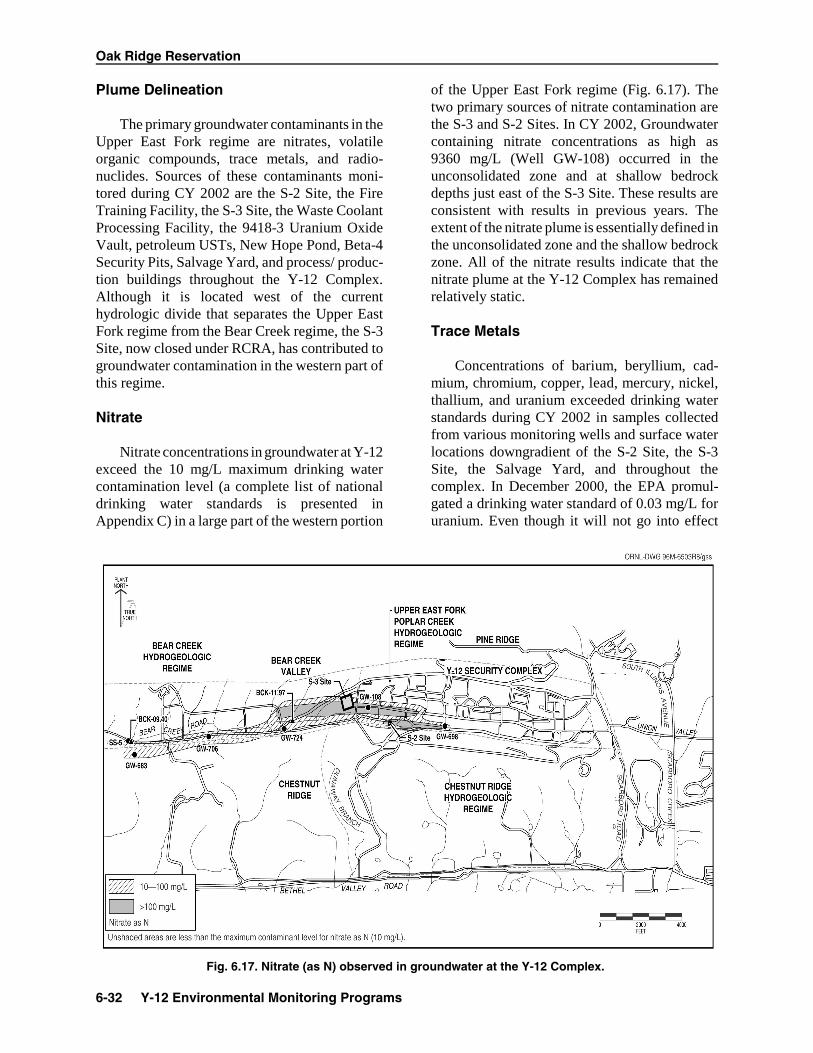
Oak Ridge Reservation
6-32 Y-12 Environmental Monitoring Programs
Fig. 6.17. Nitrate (as N) observed in groundwater at the Y-12 Complex.
Plume Delineation
The primary groundwater contaminants in theUpper East Fork regime are nitrates, volatileorganic compounds, trace metals, and radio-nuclides. Sources of these contaminants moni-tored during CY 2002 are the S-2 Site, the FireTraining Facility, the S-3 Site, the Waste CoolantProcessing Facility, the 9418-3 Uranium OxideVault, petroleum USTs, New Hope Pond, Beta-4Security Pits, Salvage Yard, and process/ produc-tion buildings throughout the Y-12 Complex.Although it is located west of the currenthydrologic divide that separates the Upper EastFork regime from the Bear Creek regime, the S-3Site, now closed under RCRA, has contributed togroundwater contamination in the western part ofthis regime.
Nitrate
Nitrate concentrations in groundwater at Y-12exceed the 10 mg/L maximum drinking watercontamination level (a complete list of nationaldrinking water standards is presented inAppendix C) in a large part of the western portion
of the Upper East Fork regime (Fig. 6.17). Thetwo primary sources of nitrate contamination arethe S-3 and S-2 Sites. In CY 2002, Groundwatercontaining nitrate concentrations as high as9360 mg/L (Well GW-108) occurred in theunconsolidated zone and at shallow bedrockdepths just east of the S-3 Site. These results areconsistent with results in previous years. Theextent of the nitrate plume is essentially defined inthe unconsolidated zone and the shallow bedrockzone. All of the nitrate results indicate that thenitrate plume at the Y-12 Complex has remainedrelatively static.
Trace Metals
Concentrations of barium, beryllium, cad-mium, chromium, copper, lead, mercury, nickel,thallium, and uranium exceeded drinking waterstandards during CY 2002 in samples collectedfrom various monitoring wells and surface waterlocations downgradient of the S-2 Site, the S-3Site, the Salvage Yard, and throughout thecomplex. In December 2000, the EPA promul-gated a drinking water standard of 0.03 mg/L foruranium. Even though it will not go into effect
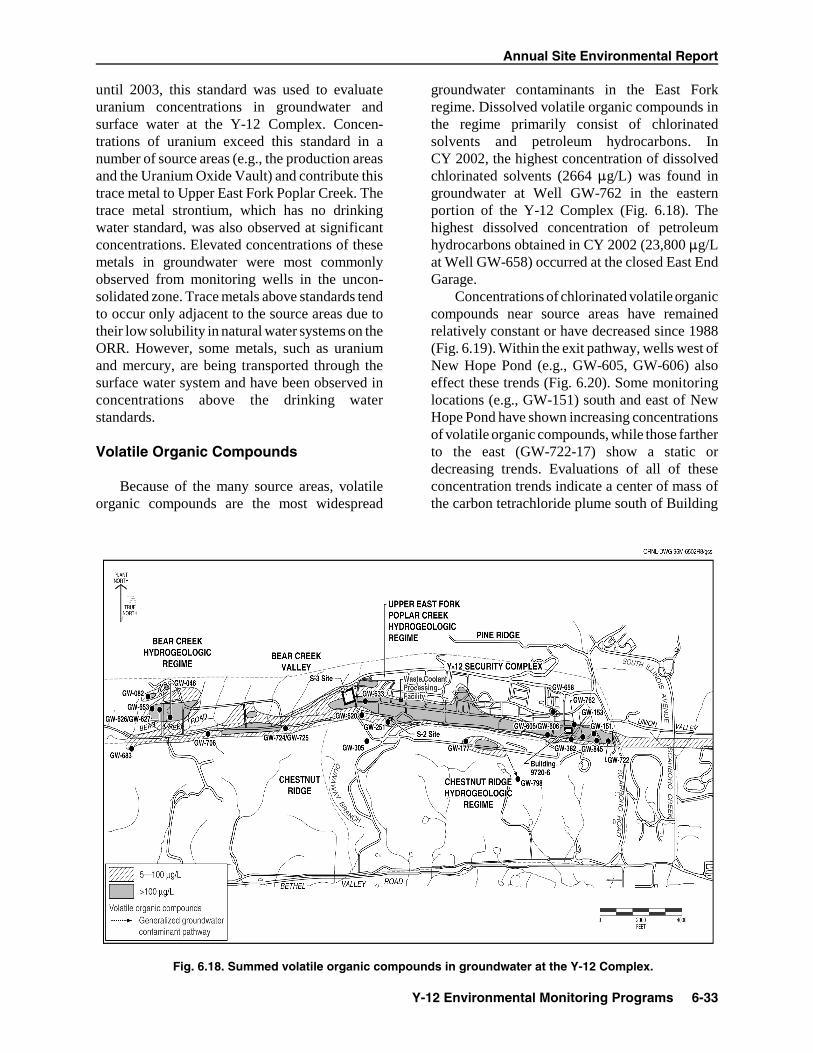
Annual Site Environmental Report
Y-12 Environmental Monitoring Programs 6-33
Fig. 6.18. Summed volatile organic compounds in groundwater at the Y-12 Complex.
until 2003, this standard was used to evaluateuranium concentrations in groundwater andsurface water at the Y-12 Complex. Concen-trations of uranium exceed this standard in anumber of source areas (e.g., the production areasand the Uranium Oxide Vault) and contribute thistrace metal to Upper East Fork Poplar Creek. Thetrace metal strontium, which has no drinkingwater standard, was also observed at significantconcentrations. Elevated concentrations of thesemetals in groundwater were most commonlyobserved from monitoring wells in the uncon-solidated zone. Trace metals above standards tendto occur only adjacent to the source areas due totheir low solubility in natural water systems on theORR. However, some metals, such as uraniumand mercury, are being transported through thesurface water system and have been observed inconcentrations above the drinking waterstandards.
Volatile Organic Compounds
Because of the many source areas, volatileorganic compounds are the most widespread
groundwater contaminants in the East Forkregime. Dissolved volatile organic compounds inthe regime primarily consist of chlorinatedsolvents and petroleum hydrocarbons. InCY 2002, the highest concentration of dissolvedchlorinated solvents (2664 :g/L) was found ingroundwater at Well GW-762 in the easternportion of the Y-12 Complex (Fig. 6.18). Thehighest dissolved concentration of petroleumhydrocarbons obtained in CY 2002 (23,800 :g/Lat Well GW-658) occurred at the closed East EndGarage.
Concentrations of chlorinated volatile organiccompounds near source areas have remainedrelatively constant or have decreased since 1988(Fig. 6.19). Within the exit pathway, wells west ofNew Hope Pond (e.g., GW-605, GW-606) alsoeffect these trends (Fig. 6.20). Some monitoringlocations (e.g., GW-151) south and east of NewHope Pond have shown increasing concentrationsof volatile organic compounds, while those fartherto the east (GW-722-17) show a static ordecreasing trends. Evaluations of all of theseconcentration trends indicate a center of mass ofthe carbon tetrachloride plume south of Building

Oak Ridge Reservation
6-34 Y-12 Environmental Monitoring Programs
Fig. 6.19. Volatile organic compound concentrations in groundwater in selected wells near sourceareas in the Upper East Fork Poplar Creek Hydrogeologic Regime.
9720-6 that is moving east. Data show thatvolatile organic compounds are most extensive inshallow groundwater. However, when con-taminants migrate into the Maynardville Lime-stone, they tend to concentrate at depths between100 and 500 ft, as exemplified by vertical carbontetrachloride distribution (Fig. 6.21).
The CY 2002 monitoring results generallyconfirm findings from the previous years ofmonitoring. A continuous dissolved plume ofvolatile organic compounds in groundwater in thebedrock zone extends eastward from the S-3 Siteover the entire length of the regime (Fig. 6.18).The primary sources are the Waste Coolant
Processing Facility and production areas through-out the Y-12 Complex.
Chloroethene compounds (tetrachloroethene,trichloroethene, dichloroethene, and vinylchloride) tend to dominate the volatile organicplume composition in the western and centralportions of Y-12. However, tetrachloroethene andisomers of dichloroethene are almost ubiquitousthroughout the extent of the plume, indicatingmany source areas. Chloromethane compounds(carbon tetrachloride, chloroform, and methylenechloride) are the predominant volatile organiccompounds in the eastern portion of Y-12.

Annual Site Environmental Report
Y-12 Environmental Monitoring Programs 6-35
Fig. 6.20. Summed volatile organic compound concentrations in selected wells near New Hope Pond and exit pathway wells.

Oak Ridge Reservation
6-36 Y-12 Environmental Monitoring Programs
Fig. 6.21. Maximum carbon tetrachloride concentrations in Maynardville Limestone at depths between 200 and 500 ft.

Annual Site Environmental Report
Y-12 Environmental Monitoring Programs 6-37
Fig. 6.22. Gross alpha activity in groundwater at the Y-12 Complex.
Monitoring wells at two former petroleumhydrocarbon contaminant sources (Rust GarageArea and East End Garage) were sampled toevaluate the present condition of groundwater.Wells GW-633 and GW-658 are located at thewest and east ends of the East Fork Regime,respectively. Well GW-633 shows a significantincrease in concentration since the early 1990s.Well GW-658 shows petroleum hydrocarbonconcentrations consistent with those observedduring the early 1990s. These observationsindicate that there is still an accumulation of con-taminants within and surrounding each well.
Radionuclides
The primary alpha-emitting radionuclidesfound in the East Fork regime during CY 2002 areisotopes of uranium. Groundwater with grossalpha activity greater than 15 pCi/L (the drinkingwater standard) occurs in scattered areasthroughout the East Fork regime (Fig. 6.22).Historical data show that gross alpha activityconsistently exceeds the drinking water standardand is most extensive in groundwater in theunconsolidated zone in the western portion of
Y-12 near the S-3 Site. However, the highest levelof gross alpha activity (1271 pCi/L) observedduring CY 2002 was observed in groundwaterfrom Well GW-154, east of the Former OilSkimmer Basin. Other areas of elevated grossalpha activity are present within the productionareas in the western portion of Y-12, near the S-2Site, and east of the 9418-3 Uranium Oxide Vault.
The primary beta-emitting radionuclidesobserved in the East Fork regime during CY 2002are uranium and 99Tc. Elevated gross beta activityin groundwater in the East Fork regime shows apattern similar to that observed for gross alphaactivity (Fig. 6.23) where uranium is the primaryradionuclide contaminant. In general, gross betaactivity consistently exceeds the annual averagescreening level of 50 pCi/L in groundwater in thewestern portion of the regime, with the primarysource being the S-3 Site.
Exit Pathway and Perimeter Monitoring
Exit pathway groundwater monitoringactivities in the East Fork regime in CY 2002involved continued collection and trending of datafrom exit pathway monitoring stations. Data

Oak Ridge Reservation
6-38 Y-12 Environmental Monitoring Programs
Fig. 6.23. Gross beta activity in groundwater at the Y-12 Complex.
collected to date indicate that volatile organiccompounds are the primary class of contaminantsthat are migrating through the exit pathways in theEast Fork regime (Fig. 6.18). These compoundsare migrating at depths to 500 ft and appear to berestricted to the Maynardville Limestone, theprimary intermediate to deep groundwater exitpathway on the East End of Y-12 (Fig. 6.21).Concentrations are typically higher at depthbecause most dilution and mixing with rainfalland Upper East Fork Poplar Creek occur in theshallow portions of the Maynardville limestone. Inaddition, most of the volatile organic con-taminants at Y-12 are denser than water; there-fore, they tend to migrate downward within thesubsurface. The deep fractures and solutionchannels that constitute flow paths within theMaynardville Limestone appear to be wellconnected, resulting in the migration of thesecontaminants for substantial distances off theORR into Union Valley to the east of Y-12.
In addition to the intermediate to deeppathways within the Maynardville Limestone,shallow groundwater within the water table
interval near New Hope Pond, Lake Reality, andUpper East Fork Poplar Creek is also monitored.Historically, volatile organic compounds havebeen observed near Lake Reality from wells, adewatering sump, and the New Hope Pond distri-bution channel underdrain. In this area, shallowgroundwater flows north-northeast through thewater table interval east of New Hope Pond andLake Reality, following the path of the distribu-tion channel for Upper East Fork Poplar Creek.
During CY 2002, the observed concentrationsof volatile organic compounds at the New HopePond distribution channel underdrain continue toremain low. This may be because the continuedoperation of a groundwater plume-capture systemin Well GW-845 (Fig. 6.21) south of the spillwaymay be reducing the levels of volatile organiccompounds in the area. The installation of thissystem by the BJC was completed in June 2000.This system pumps groundwater from theintermediate bedrock depth to mitigate off-sitemigration of volatile organic compounds. Ground-water is continuously pumped from theMaynardville Limestone at about 25 gpm, passes

Annual Site Environmental Report
Y-12 Environmental Monitoring Programs 6-39
Fig. 6.24. Surface water sampling locations north of Pine Ridge (NPR), 2002. (GHK = Gum Hollow kilometer.)
through a treatment system to remove the volatileorganic compounds, and then discharges to UpperEast Fork Poplar Creek.
Monitoring wells near Well GW-845 haveshown some encouraging response to pumpingactivities. The multi-port system installed in WellGW-722 permits sampling of ten discrete zoneswithin the Maynardville Limestone between 87and 560 ft below ground surface. This well hasbeen instrumental in characterizing the verticalextent of the east-end plume of volatile organiccompounds and is critical in the evaluation of theeffectiveness of the plume capture system.Monitoring results from some sampled zones inWell GW-722 indicate reductions in volatileorganic compounds due to groundwater pumpingupgradient at Well GW-845. Other wells, such asGW-605 and GW-382, also show decreases thatmay be attributable to the plume capture systemoperation. These indicators show that operation ofthe plume capture system is decreasing volatileorganic compounds upgradient and downgradientof Well GW-845.
A possible consequence of pumping from wellGW-845 is the drawing of other inorganic con-taminants from upgradient sources. Increases inconcentrations of uranium and gross alpha andbeta activities have been observed in upgradientmonitoring well GW-154. This well has historic-ally possessed elevated levels of uranium above
background attributed to the nearby Former OilSkimmer Basin. Nevertheless, the observedincreases may be because downgradient pumpinginduces increased flow of contaminants from thisupgradient well.
Three wells, located in the large gap in PineRidge through which Upper East Fork PoplarCreek exits Y-12, are used to monitor shallow,intermediate, and deep groundwater intervals.Shallow groundwater moves through this exitpathway, and very strong upward vertical flowgradients exist; two of the three wells located inthis area are artesian (water flows from the wellcasing due to unusually high naturally occurringwater pressure). Monitoring of these wells sinceabout 1990 has not shown that any contaminantsare moving via this exit pathway.
Five sampling locations continue to be moni-tored north and northwest of Y-12 to evaluatepossible contaminant transport from the ORR(Fig. 6.24). These locations are consideredunlikely groundwater or surface water contamin-ant exit pathways; however, monitoring wasperformed due to recent concerns regardingpotential health impacts from Y-12 operations tonearby residences. Two of the stations monitoredtributaries that drain the north slope of Pine Ridgeon the ORR and discharge into the adjacentScarboro Community. One location monitors anupper reach of Mill Branch, which discharges into

Oak Ridge Reservation
6-40 Y-12 Environmental Monitoring Programs
the residential areas along Wiltshire Drive. Theremaining two locations monitor Gum HollowBranch as it discharges from the ORR and flowsadjacent to the Country Club Estates community.Samples were obtained and analyzed for metals,inorganic parameters, volatile organic compounds,and gross alpha and gross beta activities. Therewere no results that exceeded a drinking waterstandard, nor were there any indications thatcontaminants were being discharged from theORR into these communities.
6.10.4.2 Union Valley Monitoring
Groundwater monitoring data obtained in1993 provided the first strong indication thatvolatile organic compounds were being trans-ported off the ORR through the deep Maynard-ville Limestone exit pathway. The Upper EastFork Poplar Creek remedial investigation (DOE1998) provided a discussion of the nature andextent of the volatile organic compounds.
In CY 2002, monitoring of locations in UnionValley continued, showing an overall decreasingtrend in the concentrations of contaminantsforming the groundwater contaminant plume inUnion Valley.
Under the terms of an interim record ofdecision, administrative controls, such as restric-tion on potential future groundwater use, havebeen established. Additionally, the previouslydiscussed plume capture system (Well GW-845)was installed and initiated to reduce volatileorganic compounds in Union Valley (DOE2003a).
6.10.4.3 Bear Creek HydrogeologicRegime
Located west of Y-12 in Bear Creek Valley,the Bear Creek regime is bounded to the north byPine Ridge and to the south by Chestnut Ridge.The regime encompasses the portion of BearCreek Valley extending from the west end of theY-12 Complex to Highway 95. Table 6.15describes each of the waste management siteswithin the Bear Creek regime.
Plume Delineation
The primary groundwater contaminants in theBear Creek regime are nitrate, trace metals,volatile organic compounds, and radionuclides.The S-3 Site is a source of all four of thesecontaminants. The Oil Landfarm waste manage-ment area, consisting of the Oil Landfarm, theBoneyard/Burnyard, the Hazardous ChemicalDisposal Area, and Landfill I, is a significantsource of uranium, other trace metals, and volatileorganic compounds. Other sources of volatileorganic compounds include the Rust Spoil Area,and the Bear Creek Burial Grounds wastemanagement area. Dense nonaqueous phaseliquids (DNAPLs), heavier-than-water solventsthat have a low water solubility, exist at depths asgreat as or greater than 270 ft below the BearCreek Burial Grounds. The DNAPLs consistprimarily of volatile organic compounds such astetrachloroethene, trichloroethene, 1,1-dichloro-ethene, 1,2-dichloroethene, and high concentra-tions of PCBs.
Contaminant plume boundaries are essentiallydefined in the bedrock formations that directlyunderlie many waste disposal areas in the BearCreek regime, particularly the Nolichucky Shale.The elongated shape of the contaminant plumes inthe Bear Creek regime is the result of preferentialtransport of the contaminants parallel to strike inboth the Knox Aquifer and the ORR Aquitards.
Nitrate
Unlike many groundwater contaminants,nitrate is highly soluble and moves easily withgroundwater. The limits of the nitrate plumeprobably define the maximum extent of sub-surface contamination in the Bear Creek regime.The horizontal extent of the nitrate plume isessentially defined in groundwater in the upper tointermediate part of the aquitard and aquifer [lessthan 300 ft (91 m) below the ground surface].
Data obtained during CY 2002 indicate thatnitrate concentrations in groundwater exceed thedrinking water standard in an area that extendswest from the S-3 Site for approximately 12,000 ft(3,660 m) down Bear Creek Valley (Fig. 6.17).Nitrate concentrations greater than 100 mg/Lpersist out to about 3000 ft (915 m) west of theS-3 Site, indicating no significant change from

Annual Site Environmental Report
Y-12 Environmental Monitoring Programs 6-41
Table 6.15. History of waste management units included in CY 2002 groundwater monitoring activities,Bear Creek Hydrogeologic Regimea
Site Historical data
S-3 Site Four unlined surface impoundments constructed in 1951. Received liquid nitricacid/uranium-bearing wastes via the Nitric Acid Pipeline until 1983. Closed andcapped under RCRA in 1988. Infiltration was the primary release mechanism togroundwater
Oil Landfarm Operated from 1973 to 1982. Received waste oils and coolants tainted with metalsand PCBs. Closed and capped under RCRA in 1989. Infiltration was the primaryrelease mechanism to groundwater. Part of the Oil Landfarm waste management area
Boneyard Used from 1943 to 1970. Unlined shallow trenches used to dispose of constructiondebris and to burn magnesium chips and wood. Excavated and restored in 2002
Burnyard Used from 1943 to 1968. Wastes, metal shavings, solvents, oils, and laboratorychemicals were burned in two unlined trenches. Excavated and restored in 2002
Hazardous ChemicalDisposal Area
Used from 1975 to 1981. Built over the burnyard. Handled compressed gas cylindersand reactive chemicals. Residues placed in a small, unlined pit. Excavated andrestored in 2002 as part of Boneyard/Burnyard remedial activities
Sanitary Landfill I Used from 1968 to 1982. TDEC-permitted, nonhazardous industrial landfill. May bea source of certain contaminants to groundwater. Closed and capped under TDECrequirements in 1985. Part of the Oil Landfarm waste management area
Bear Creek Burial Grounds:A, C, and Walk-in Pits
A and C received waste oils, coolants, beryllium and uranium, various metallicwastes, and asbestos into unlined trenches and standpipes. Walk-in Pits receivedchemical wastes, shock-sensitive reagents, and uranium saw fines. Activities ceasedin 1981. Final closure certified for A (1989), C (1993), and the Walk-in Pits (1995).Infiltration is the primary release mechanism to groundwater
Bear Creek Burial Grounds:B, D, E, J, and Oil RetentionPonds 1 and 2
Burial Grounds B, D, E, and J, unlined trenches, received depleted uranium metaland oxides and minor a mounts of debris and inorganic salts. Ponds 1 and 2, built in1971 and 1972, respectively, captured waste oils seeping into two Bear Creektributaries. The ponds were closed and capped under RCRA in 1989. Certification ofclosure and capping of Burial Grounds B and part of C was granted February 1995
Rust Spoil Area Used from 1975 to 1983 for disposal of construction debris, but may have includedmaterials bearing solvents, asbestos, mercury, and uranium. Closed under RCRA in1984. Site is a source of volatile organic compounds to shallow groundwateraccording to CERCLA remedial investigation
Spoil Area I Used from 1980 to 1988 for disposal of construction debris and other stable, nonradwastes. Permitted under TDEC solid waste management regulations in 1986; closurebegan shortly thereafter. Soil contamination is of primary concern. CERCLA recordof decision issued in 1996
SY-200 Yard Used from 1950 to 1986 for equipment and materials storage. No documented wastedisposal at the site occurred. Leaks, spills, and soil contamination are concerns.CERCLA record of decision issued in 1996
Above-Grade LLW StorageFacility
Constructed in 1993. Consists of six above-grade storage pads used to store inert,low-level radioactive debris and solid wastes packaged in steel containers
aAbbreviationsCERCLA = Comprehensive Environmental Response, Compensation, and Liability Act.LLW = low-level waste.PCB = polychlorinated biphenyl.RCRA = Resource Conservation and Recovery Act.TDEC = Tennessee Department of Environment and Conservation.

Oak Ridge Reservation
6-42 Y-12 Environmental Monitoring Programs
previous years. Historically, the highest nitrateconcentrations are observed adjacent to the S-3Site in groundwater in the unconsolidated zoneand at shallow depths [less than 100 ft (30.5 m)below ground surface] in the Nolichucky Shale.Furthermore, elevated concentrations of nitratehave been observed as deep as 740 ft (226 m)below ground surface. Surface water nitrateresults exceeding the drinking water standardduring CY 2002 were observed as far as 15,400 ft(4,694 m) west of the S-3 Site.
Trace Metals
During CY 2002, uranium, barium, cadmium,chromium, lead, beryllium, nickel, thallium,arsenic, mercury, and selenium have beenidentified from groundwater monitoring as thetrace metal contaminants in the Bear Creek regimethat exceeded the drinking water standards.Historically, elevated concentrations of thesemetals were observed at shallow depths near theS-3 Site. Disposal of acidic liquid wastes at thissite reduced the pH of the groundwater, whichallows the metals to remain in solution. Elsewherein the Bear Creek regime, where natural geo-chemical conditions prevail, these trace metalsmay occur sporadically and in close associationwith source areas because conditions are typicallynot favorable for dissolution and migration. InCY 2002, these trace metals were evident atelevated concentrations within the surface waterand groundwater downgradient of the S-3 Site, theBear Creek Burial Ground, and the Oil Landfarmwaste management areas.
The most prevalent trace metal contaminantobserved within the Bear Creek regime isuranium, indicating that geochemical conditionsare favorable for its migration. The Boneyard/Burnyard site has been identified as the primarysource of uranium contamination of surface waterand groundwater. Uranium is typically observedat concentrations exceeding the drinking waterstandard of 0.03 mg/L in shallow monitoringwells, springs, and surface water locations down-gradient from all of the waste areas. Uraniumconcentrations above the drinking water standardwere observed in surface water monitoringstations over 2.6 miles (4.2 km) from Bear CreekBurial Ground, the westernmost waste area. BJCperformed the final remedial actions at the
Boneyard/Burnyard during the summer of 2002with the objective of removing materialscontributing to surface water and groundwatercontamination to meet existing record-of-decisiongoals. Approximately 87,000 yd3 of wastematerials were excavated and placed in theEnvironmental Management Waste ManagementFacility. The site was backfilled and compactedwith clay and final restoration was completed inOctober 2002 (DOE 2003a).
Other trace metal contaminants that have beenobserved in the Bear Creek regime are boron,cobalt, and strontium. Concentrations of thesemetals have commonly exceeded backgroundvalues in groundwater near contaminant sourceareas.
Volatile Organic Compounds
Volatile organic compounds are widespread ingroundwater in the Bear Creek regime (Fig. 6.18).The primary compounds are tetrachloroethene,trichloroethene, 1,2-dichloroethene, 1,1,1-tri-chloroethane, and 1,1-dichloroethane. In mostareas, they are dissolved in the groundwater, andDNAPL accumulations occur in bedrock morethan 250 ft (76 m) below the Bear Creek BurialGround waste management area. Groundwater inthe aquitards that contains detectable levels ofvolatile organic compounds occurs primarilywithin about 1000 ft (305 m) of the source areas.The highest concentrations observed in CY 2002in the unconsolidated zone in the Bear CreekRegime occurred at the Bear Creek Burial Groundwaste management area in monitoring WellGW-046, with a maximum summed volatileorganic compound concentration of 4664 :g/L.The extent of the dissolved plumes of volatileorganic compounds is greater in the underlyingbedrock. The highest levels in the Bear Creekregime occur in bedrock, just south of the BearCreek Burial Ground waste management area.Historical levels have been as high as7,000,000 :g/L in groundwater near the sourcearea. The maximum summed volatile organiccompound concentration observed in the BearCreek Regime was from the bedrock interval was10,823 :g/L (well GW-626). Well GW-626monitors the shallow (68–78 ft below groundsurface) bedrock interval downgradient of theBear Creek Burial Ground waste management

Annual Site Environmental Report
Y-12 Environmental Monitoring Programs 6-43
area. Well GW-627, which monitors the inter-mediate bedrock interval (254–270 ft belowground surface), has continued to exhibit anincrease in volatile organic compound concen-tration (Fig. 6.25). The increasing trends observedin wells GW-082, GW-627, and GW-653 indicatethat some migration of volatile organic com-pounds is occurring. This migration through theaquitards parallel to the valley axis and toward theexit pathway (Maynardville Limestone) isoccurring in both the unconsolidated and bedrockintervals.
Significant transport of volatile organic com-pounds has occurred in the MaynardvilleLimestone. Data obtained from exit pathwaymonitoring locations show that in the vicinity ofthe water table, an apparently continuousdissolved plume extends for about 12,000 ft(3,660 m) westward from the S-3 Site to just westof the Bear Creek Burial Ground waste manage-ment area. Typical summed concentrationsobserved in CY 2002 in the Maynardville Lime-stone range from 221 :g/L in the central part ofthe regime (Well GW-725) to less than detectablelevels approximately 12,000 ft (3,660 m) to thewest of the S-3 site.
Radionuclides
The primary radionuclides identified in theBear Creek regime are isotopes of uranium and99Tc. Neptunium-237, 241Am, radium, strontium,thorium, plutonium, and tritium are secondary andless widespread radionuclides, primarily presentin groundwater near the S-3 Site.
Evaluations of the extent of these radio-nuclides in groundwater in the Bear Creek regimeduring CY 2002 were based primarily on measure-ments of gross alpha activity and gross betaactivity. If the annual average gross alpha activityin groundwater samples from a well exceeded15 pCi/L (the drinking water standard for grossalpha activity), then one (or more) of the alpha-emitting radionuclides (e.g., uranium) wasassumed present in the groundwater monitored bythe well. A similar rationale was used for annualaverage gross beta activity that exceeded50 pCi/L. Technetium-99, a more volatileradionuclide, is qualitatively screened by grossbeta activity analysis and, at certain monitoringlocations, is evaluated isotopically.
Groundwater with elevated levels of grossalpha activity occurs near the S-3 Site and the OilLandfarm waste management areas (Fig. 6.22). Inthe bedrock interval, gross alpha activity exceeds15 pCi/L in groundwater in the Nolichucky Shaleonly near source areas. Data obtained from exitpathway monitoring stations show that gross alphaactivity in groundwater in the MaynardvilleLimestone exceeds the drinking water standard for12,000 ft (3,660 m) west of the S-3 Site (e.g.,GW-684). Average gross alpha activities abovethe drinking water standard in surface watersamples were observed about 3.0 miles (4.8 km)west of the S-3 Site.
The distribution of gross beta radioactivity ingroundwater in the unconsolidated zone is similarto that of gross alpha radioactivity (Fig. 6.23).During CY 2002, gross beta activity exceeded50 pCi/L within the Maynardville Limestoneapproximately 12,000 ft (3,660 m) from the S-3Site (Fig. 6.23) to exit pathway picket A (i.e.,Well GW-061 and SS-5). As seen with grossalpha activities, surface water gross beta activitiesabove the drinking water standard were observedabout 3 miles (4.8 km) west of the S-3 Site.Technetium-99 activities mimic the gross betaactivity distribution across the Bear Creek regime.
Exit Pathway and Perimeter Monitoring
Exit pathway monitoring began in 1990 toprovide data on the quality of groundwater andsurface water exiting the Bear Creek regime. TheMaynardville Limestone is the primary exitpathway for groundwater. Bear Creek, whichflows across the Maynardville Limestone in muchof the Bear Creek regime, is the principal exitpathway for surface water. Various studies haveshown that surface water in Bear Creek, springsalong the valley floor, and groundwater in theMaynardville Limestone are hydraulicallyconnected. The western exit pathway well transect(Picket W) serves as the ORR perimeter welllocation for the Bear Creek regime (Fig. 6.16).
Exit pathway monitoring consists of con-tinued monitoring at four well transects (pickets)and selected springs and surface water stations.Groundwater quality data obtained during CY2002 from the exit pathway monitoring wellsindicate that contaminated groundwater does notconsistently occur above drinking water standards

Oak Ridge Reservation
6-44 Y-12 Environmental Monitoring Programs
Fig. 6.25. Volatile organic compound concentrations in Bear Creek Burial Grounds Wells GW-627,GW-653, and GW-082.

Annual Site Environmental Report
Y-12 Environmental Monitoring Programs 6-45
beyond the western side of the Bear Creek BurialGround waste management area (Fig. 6.26). How-ever, nitrate and uranium concentrations and grossalpha and gross beta activities exceeding theirrespective drinking water standards have beenobserved in surface water west of the burialgrounds (BWXT 2003).
Surface water and spring samples collectedduring CY 2002 indicate that spring dischargesand water in upper reaches of Bear Creek containmany of the compounds found in the groundwater.The concentrations in the creek and springdischarge decrease with distance downstream ofthe waste disposal sites (Fig. 6.27). Long-termslightly increasing gross alpha activity trends inmiddle and lower Bear Creek (BCK-09.40 andBCK 04.55) were observed, probably indicatingthat the Oil Landfarm waste management area isa significant contributor of alpha-emitting con-taminants (i.e., uranium) to surface water. Con-tinued follow-up evaluations of these downstreamsurface water monitoring locations will beperformed to assess the effectiveness of theremediation of the Boneyard/Burnyard site.
6.10.4.4 Chestnut RidgeHydrogeologic Regime
The Chestnut Ridge Hydrogeologic Regime issouth of Y-12 and is flanked to the north by BearCreek Valley and to the south by Bethel ValleyRoad (Fig. 6.15). The regime encompasses theportion of Chestnut Ridge extending fromScarboro Road, east of Y-12, to Dunaway Branch,located just west of Industrial Landfill II.
The Chestnut Ridge Security Pits area is theonly documented source of groundwater con-tamination in the regime. Contamination from theSecurity Pits is distinct and does not mingle withplumes from other sources. Table 6.16 sum-marizes the operational history of waste manage-ment units in the regime.
Plume Delineation
The horizontal extent of the volatile organiccompound plume at the Chestnut Ridge SecurityPits is reasonably well defined in the water tableand shallow bedrock zones (Fig. 6.18). Ground-water quality data obtained during CY 2002indicates that the western lateral extent of the
plume of volatile organic compounds at the sitehas not changed significantly from previous years(GW-177, Fig. 6.28). However, an increase inthese contaminants at well GW-798 shows thatsome migration is occurring (Fig. 6.28).
Nitrate
Nitrate concentrations were below thedrinking water standard of 10 mg/L at all moni-toring stations.
Trace Metals
Groundwater concentrations of trace metalsexceeded regulatory standards during CY 2002 atfour locations. Concentrations above the drinkingwater standard for nickel were observed insamples from three monitoring wells. One surfacewater monitoring station showed elevated concen-trations of arsenic.
Nickel concentrations above the drinkingwater standard (0.1 mg/L) were observed from awell at the Industrial Landfill IV and from twowells at the United Nuclear Corporation site(Fig. 6.14). The presence of nickel in groundwatersamples from monitoring wells at both theLandfill IV and the United Nuclear site isprobably due to corrosion of well casings. This isfurther supported by the high concentrations ofchromium seen in one of the wells at the UnitedNuclear site. Nickel and chromium are bothprimary components of stainless steel, and thepresence of both potentially indicates theoccurrence of corrosion and subsequent dis-solution of stainless-steel well casing and screenmaterials (Jones 1999).
Elevated concentrations of arsenic above thedrinking water standard (0.05 mg/L) wereobserved in one surface water monitoring locationdownstream from the Filled Coal Ash Pond,which is monitored under a CERCLA record ofdecision (DOE 2003a). A constructed wetlands isbeing utilized to prevent surface water contamin-ation by effluent from the Filled Coal Ash Pond.The location where elevated arsenic levels weredetected is upgradient of this wetland area.Downgradient of the wetlands, concentrations arenoticeably lower (below the drinking waterstandard for arsenic).

Oak Ridge Reservation
6-46 Y-12 Environmental Monitoring Programs
Fig. 6.26. Concentrations of selected contaminants in exit pathway monitoring Wells GW-724,GW-706, and GW-683 in the Bear Creek Hydrogeologic Regime.

Annual Site Environmental Report
Y-12 Environmental Monitoring Programs 6-47
Fig. 6.27. Concentrations of selected groundwater contaminants in Bear Creek.

Oak Ridge Reservation
6-48 Y-12 Environmental Monitoring Programs
Volatile Organic Compounds
Efforts to delineate the extent of volatileorganic compounds in groundwater attributable tothe Chestnut Ridge Security Pits have been inprogress since 1987. A review of historical dataindicates that concentrations of volatile organiccompounds in groundwater at the site havegenerally decreased since 1988. However, the
CY 2002 monitoring in and around the ChestnutRidge Security Pits showed a different picture.Well GW-177 (western side of Security Pits) wasmonitored, and stable levels of volatile organiccompounds continued to be observed, indicatingthat interior portions of the plumes are notdecreasing substantially. Additionally, a generalincreasing trend in volatile organic compounds ingroundwater samples from monitoring well
Table 6.16. History of waste management units included in CY 2002 groundwater monitoring activities,Chestnut Ridge Hydrogeologic Regimea
Site Historical data
Chestnut Ridge SedimentDisposal Basin
Operated from 1973 to 1989. Received soil and sediment from New Hope Pond andmercury-contaminated soils from the Y-12 Complex. Site was closed under RCRAin 1989. Not a documented source of groundwater contamination
Kerr Hollow Quarry Operated from 1940s to 1988. Used for the disposal of reactive materials,compressed gas cylinders, and various debris. RCRA closure (waste removal) wasconducted between 1990 and 1993. Certification of closure with some wastesremaining in place was approved by TDEC February 1995
Chestnut Ridge Security Pits Operated from 1973 to 1988. Series of trenches for disposal of classified materials,liquid wastes, thorium, uranium, heavy metals, and various debris. Closed underRCRA in 1989. Infiltration is the primary release mechanism to groundwater
United Nuclear CorporationSite
Received about 29,000 drums of cement-fixed sludges and soils demolitionmaterials, and low-level radioactive contaminated soils. Closed in 1992; CERCLArecord of decision has been issued
Industrial Landfill II Central sanitary landfill for the Oak Ridge Reservation. Detection monitoring underpostclosure plan has been ongoing since 1996
Industrial Landfill IV Permitted to receive only nonhazardous industrial solid wastes. Detectionmonitoring under TDEC solid-waste-management regulations has been ongoingsince 1988
Industrial Landfill V New facility completed and initiated operations April 1994. Baseline groundwatermonitoring began May 1993 and was completed January 1995. Currently underTDEC solid-waste-management detection monitoring
Construction/DemolitionLandfill VI
New facility completed and initiated operations December 1993. Baselinegroundwater quality monitoring began May 1993 and was completed December1993. Currently under permit-required detection monitoring per TDEC
Construction/DemolitionLandfill VII
New facility; construction completed in December 1994. TDEC granted approval tooperate January 1995. Baseline groundwater quality monitoring began in May 1993and was completed in January 1995. Permit-required detection monitoring perTDEC was temporarily suspended October 1997 pending closure ofconstruction/demolition Landfill VI. Reopened and began waste disposal operationsin April 2001
Filled Coal Ash Pond Site received Y-12 Steam Plant coal ash slurries. A CERCLA record of decision hasbeen issued. Remedial action complete
aAbbreviationsCERCLA = Comprehensive Environmental Response, Compensation, and Liability Act.RCRA = Resource Conservation and Recovery Act.TDEC = Tennessee Department of Environment and Conservation.

Annual Site Environmental Report
Y-12 Environmental Monitoring Programs 6-49
Fig. 6.28. Summed VOC concentrations in Wells GW-177 and GW-798.
GW-798, to the southeast and downgradient of theChestnut Ridge Security Pits, has been developingsince CY 2000 (Fig. 6.28). The volatile organiccompounds detected are characteristic of theChestnut Ridge Security Pits plume; in CY 2002the constituent tetrachloroethene consistentlyexceeded the drinking water standard (5 :g/L).These results indicate that there is somevariability in plume behavior depending on
location and that some migration is occurringthrough the developed fracture and conduit systemof the karst dolostone to the southeast.
The volatile organic compound concentrationsobserved in Well GW 305, located immediately tothe southeast of Landfill IV, do not appear to beincreasing as seen in previous years (Fig. 6.29).Concentrations of the volatile organic compounds

Oak Ridge Reservation
6-50 Y-12 Environmental Monitoring Programs
Fig. 6.29. Volatile organic compound concentrations in Industrial Landfill IV Well GW-305.
in Well GW 305 have remained below applicabledrinking water standards.
Radionuclides
In CY 2002, Gross alpha activities werebelow the drinking water standard of 15 pCi/L atall monitoring stations. Gross beta activities werebelow the screening level of 50 pCi/L at allmonitoring stations except at monitoring wellGW-205 at the United Nuclear site. This locationhas consistently exceeded 50 pCi/L gross betaactivity since August 1999 with the exception ofthe sample from January 30, 2002 (47.23 pCi/L).Isotopic analyses show a correlative increase inthe beta-emitting radionuclide 40K, which is not aknown contaminant of concern at the UnitedNuclear site. The source of the radioisotope is notknown.
Exit Pathway and Perimeter Monitoring
Contaminant and groundwater flow paths inthe karst bedrock underlying the Chestnut Ridgeregime have not been well characterized byconventional monitoring techniques. Tracerstudies have been used in the past to attempt toidentify exit pathways. Based on the results oftracer studies to date, no springs or surfacestreams that represent discharge points forgroundwater have been conclusively correlated toa waste management unit that is a known orpotential groundwater contaminant source.
Monitoring of natural groundwater exit path-ways is a basic monitoring strategy in a karstregime such as that of Chestnut Ridge. Perimetersprings and surface water tributaries were moni-tored to determine if contaminants are exiting thedowngradient southern side of the regime. Foursprings and five surface water monitoringlocations were sampled during CY 2002. Nocontaminants were detected at these naturaldischarge points.