6.0 future demand - taupodc.govt.nz term... · 6.1 factors affecting demand ... growth in...
TRANSCRIPT

Future Demand
____________________________________________________________________________________________________________ Taupō District Council Page 1 Solid Waste Asset Management Plan 2018
6.0 FUTURE DEMAND
6.1 Factors Affecting Demand
There are a number of factors that influence demand for the Solid Waste assets and services
within the Taupō District. These are described below and include:
Transfer Station location
Refuse Collection area boundaries
Expanded recycling options
Tourism
Out of district home ownership
Service provision by the private sector
Growth in development and therefore population / economic activity
Community expectations
Changes in level of level of service through primary drivers such as legislation
Lifestyle trends
Economic instruments
Council policy and plans
Product Stewardship schemes
Changes in legislation and National direction
Solid Waste Bylaw
Education
Commercial competition
Events
Public holidays
New products and product development
6.2 Demand Management
Demand management is:
“……the modification customer demands for services in order to maximise use of
existing assets or to reduce or defer the need for new assets.”
A unique feature of demand management in Taupō District is the managing of the fluctuating
demand. Taupō has a large percentage of unoccupied dwellings which means that the base
demand as compared to dwelling numbers is low. However this demand increases significantly
during peak holiday periods, tourist seasons and when there are large events in town.
One of the key objectives of demand management is to seek non-asset solutions (such as
reduction, reuse and recycling) as alternatives to constructing new asset based solutions.
The use of economic instruments is playing an ever increasing roll in the modification of
customer demands. By applying or not applying a charge, Council can provide the incentive or
disincentive that will promote the objectives of its Waste Management and Minimisation Plan.
An example of this is the pricing of green waste less than waste disposal, which results in the
community separating this material to achieve a saving, and results in a usable material for
Council and the diversion of green waste to tip face and the reduction of greenhouse gases.
The overall service provision cost must be funded, but by using the correct combination of
Future Demand
____________________________________________________________________________________________________________ Taupō District Council Page 2 Solid Waste Asset Management Plan 2018
rates and fees and charges to create the correct cost differential, waste diversion can be
achieved and behaviours changed for the better.
Council will continue to try and identify material in the waste stream that can be recycled and
or reused such as the crushed concrete, currently being sold from the Broadlands Rd Landfill.
During the identification of new waste minimisation opportunities Council must analyse
whether the service is sustainable environmentally and economically. Waste that has no
residual value and thus needs a high level of financial support from Council must be
thoroughly investigated as to its suitability for extra funding.
Criteria for extra funding would be cost, volume of material per cubic metre or tonne diverted
from Landfill and the amount of public good as well as long term sustainability issues and
current legislation. Most opportunities will pass or fail on the cost factor, but opportunities to
divert more waste become more economical and sustainable the higher the cost to dispose to
landfill.
Council’s current policy of charging for waste going to disposal and allowing a free (Rate
Funded) recycling drop off has kept a high level of recycling participation.
Council as a landfill owner must also keep in mind that waste diverted from landfill will have
an effect on the revenue from the site which may need to be funded elsewhere.
Waste legislation is set to further drive waste minimisation in NZ with central government able
to identify priority products that must then come under a product stewardship program, this
may in the future reduce the cost to rate payers and place the cost of recovery on the
purchaser of products. (Currently no products have been identified by Government after 10
years). Taupo District along with the majority of other Council’s continue to lobby government
regarding product stewardship, and recently passed a remit with 90% support that supported
Container Deposit legislation for containers, as yet government are still yet to implement
change.
The packaging industry vigorously challenge this direction as the cost of recovery of material
will then fall on the industry they represent not on rate payers that may or may not have used
their product.
The Waste Minimisation Act 2008 has put in place a waste levy on tonnes to landfill(currently
$10 per tonne), the levy’s purpose is two fold, firstly to increase the cost of waste disposal and
therefore drive diversion and secondly the revenue gained from the levy will be used to
promote further waste minimisation initiatives. Council will receive funds from the Levy based
on district population and can make extra applications to a consolidated fund outside of the
Population criteria.
The introduction of a waste levy has had cost implications for Council in regards to reporting of
information, handling of monies for the Levy and the making of applications for funding of
waste minimisation programs. This extra cost has been factored into the operational budgets
for the cost centre.
Central Government are currently reviewing the effectiveness of the levy, but no conclusion as
to changes in the value of how it is divided up has been made to date. The Local Government
view is that the levy should apply to a greater range of disposal facilities as currently the levy
falls on Landfills as classified under the act which then drives waste to cheaper and less
environmentally controlled disposal sites.
Asset based solutions include:
Increasing the size of current facilities to cater for increases in peak demand
Construction of additional cells at the Broadlands Road landfill
Provision of compacting street refuse bins in high use areas
Future Demand
____________________________________________________________________________________________________________ Taupō District Council Page 3 Solid Waste Asset Management Plan 2018
The Broadlands Rd Landfill resource consent conditions require that Council has an
independent peer reviewer that undertakes inspections of capital works such as new cell
developments but also provides guidance on day to day operations. The reports provided by
the peer reviewer can effect maintenance requirements. Asbuilts from capital works are kept
on file as well as forwarded to the Regional Council.
Council has one disposal site for residual waste in the district being the Broadlands Rd landfill.
This site can easily cope with increased waste volumes but Council does have the discretion to
"ring fence" the site for the district and stop waste coming into the district from other areas
that may have higher residual waste charges. Council’s landfill consent allows for 50,000
tonnes of waste per year with the current tonnage being half that amount.
The Broadlands Rd landfill enables Council to avoid the cost of refuse charges from other
facilities as well as the cost of transporting waste and utilise a portion of the disposal fee to
support waste minimisation programs.
Council could also choose to receive waste from out of the district to increase the revenue
stream from the site but this will shorten the life of the landfill.
The consent for the Broadlands Rd landfill expires in 2027 and prior to that council will apply
for a new consent to run the site.
In 2017 Opus International produced a development plan for the landfill that identified an
additional 600,000 landfill fill volume, but this will require 354,000 cubic metres of cut volume
to be removed, some of which will be used as fill material as the site develops.
Based on the Cell 2D tender the rough order development cost for the landfill south of 2D and
2C1 would be $6.8M (including 20% contingency). This equates to around $11.30m/3 of void.
While higher than the average from previous cells of around $6.20, it is still highly economic
compared to the landfill charges or the cost of transferring waste out of district. Primarily the
higher the unit cost arises from the very large cut to waste required in the southern ridge, so
any strategy that can use this material elsewhere will aid the overall economics.
Council owns and operates 5 RTS sites that ring the lake that cater for the smaller urban areas
as well as rural members of the community. Changes in refuse disposal demand can be
managed by the increasing or decreasing the numbers of refuse haulage bins taken to landfill
and hours of operation for the individual sites.
Due to cost, Council only services urban areas with its kerbside collection contract but all
district transfer station facilities can handle the full suite of recyclables as well as additional
items.
The Kerbside refuse and recycling contractor has the ability to off load and stockpile waste and
recyclables at district facilities to enable him to cater for increases in demand caused by
seasonal population increases. Council also incentivises waste minimisation practises by rate
funding services where waste disposal is predominantly user pays funded.
The market for recovered materials can impact the service levels that Council and the
commercial market provides as the demand for material fluctuates which impacts the return
value. Recently we have seen steel prices reduce which has meant that the RTS sites are now
starting to receive end of life cars, which they have not seen for the last 8 year as they still
had a residual value.
Recovered product quality is a major factor in being able to support the collection and sale of
product.

Future Demand
____________________________________________________________________________________________________________ Taupō District Council Page 4 Solid Waste Asset Management Plan 2018
Council’s current kerbside service relies on the community to sort material into selected
products so that they can easily deposited into the collection vehicle. This process provides
high quality end product with virtually zero contamination. Low contamination rates mean
easier access to overseas markets and higher return values. Comingled collection
methodologies require intensive post collection sorting and comingled collection models have
contamination rates of around 18%.
By having a rate portion in the solid waste cost centre, Council achieves a number of
outcomes:
Lessens the ability for competitors to compete with service delivery which would
undermine Councils ability to provide services.
Council acquires funding for the district facilities from out of district home owners
Allows council to manipulate pricing to incentivise diversion
Council has incorporated smart technology into the provision of street litter bins in the district.
Council currently has 35 Big Belly compactor bins located in Turangi, Taupo and Kinloch. These
bins have the capacity of ten conventional 60L bins as they compact the refuse once it reaches
a certain level. The bins are also powered by solar energy and let the collection contractor
know when they are full, thus reducing vehicle movements.
Bins have been deployed in high use areas and have greatly reduced the incidences of over
flowing refuse bins and windblown litter. Another benefit is the reduction in the number of
refuse bins scattered around.
Over the past two years Council has seen an increase in waste volume from the average
18500 tonnes per year to now around 25000 tonnes per year. This sharp increase is directly
linked to an increase in economic activity after the economic lull over the last period.

Future Demand
____________________________________________________________________________________________________________ Taupō District Council Page 5 Solid Waste Asset Management Plan 2018
Recycling volumes have also increased proportionally but the main contributor to the increase
is the construction and development sector.
This is a difficult market to deal with as construction sites have multiple parties accessing the
site at different times with no one party being responsible for the diversion of waste materials
or implementing recycling systems.
Most construction site operators compare the time and cost and energy of diverting material to
the amount and cost savings and quickly abandon the option.
This coupled with cheap large scale waste disposal options in the form of skips makes waste
reduction a difficult proposition.
If material is diverted there is still a lack of local markets that are prepared to utilise this type
of material.
6.3 Plans Related to Growth
In addition to the general Council planning documents such as the District Plan there are other
planning documents that relate to demand in relation to the Solid Waste assets and services.
These include:
Growth Management Taupō 2050 - The Council’s asset management plans need to be aligned
with the strategy to ensure more efficient and affordable provision of infrastructure for the
identified growth areas.
Infrastructure Strategy
Taupō Urban Structure Plan
Taupō Town Structure Plan
Kinloch Structure Plan
Taupō West Structure Plan
6.4 Growth
6.4.1 GROWTH MANAGEMENT STRATEGY
In June 2006 the Council adopted Taupō District 2050 (TD2050), the Growth Management
Strategy for the District. The growth management strategy identifies where urban growth is
anticipated so that land use and infrastructure planning can be aligned. TD2050 has been
incorporated into the District Plan by way of plan changes, particularly Plan Change 21 which
identifies the future urban growth areas.
This strategic approach to integrating land use and infrastructure is intended to be supported
by subsequent structure planning of the urban growth areas to identify the detailed settlement
pattern and infrastructure servicing. Council has prepared structure plans for:
Kinloch
Mapara Valley
South-western Bays Settlements (including Turangi); and
Commercial and industrial areas within Taupō Township
A growth model was developed based on the anticipated population increase and associated
residential lot increases in TD2050. The growth model is reviewed and updated every three
years prior to the review of the asset management plans and development of the long term
plan. The review of the growth model is based on census data estimates, feedback from
developers and analysis of resource consents.

Future Demand
____________________________________________________________________________________________________________ Taupō District Council Page 6 Solid Waste Asset Management Plan 2018
NEW LOTS TO BE CREATED
Consideration has been given to the optimistic discussions with developers, actual consent numbers over the past three years, demographic considerations1 and officers’ estimates when estimating the potential lot numbers outlined in the DC Policy and the Growth Model.
The table below outlines those estimates for the next ten years. The areas that are not predicted to have any growth due to current capacity levels, such as, Hatepe, Motuoapa, Whareroa, and Five Mile Bay/Waitahanui have been removed.
Taupō South 25 55 55 55 55 55 55 55 30 30
Nukuhau/Brentwood/
Poihipi/Huka Falls
25 35 55 35 30 30 30 30 30 30
Taupō Town 20 20 20 20 20 20 20 20 20 20
Total Lots Created 70 110 130 110 105 105 105 105 80 80
Acacia Bay (including lower Mapara Rd)
Total Lots Created 2 2 2 2 2 2 2 2 2 2
Kinloch
Total Lots Created 10 22 0 12 0 7 0 0 0 0
Mapara Valley
Total Lots Created 5 5 5 5 5 5 5 5 5 5
Five Mile Bay/Waitahanui 0 0 0 0 0 0 0 0 0 0
Total Lots Created 0 0 0 0 0 0 0 0 0 0
Turangi
Total Lots Created 2 2 2 2 2 2 2 2 2 2
Pukawa/Omori/ Kuratau
Total Lots Created 18 15 18 0 3 0 3 0 3 0
Rural Other
Total Lots Created 5 5 5 5 5 5 5 5 5 5
Table: Estimated lots created over the period 2018-28 from the Taupō Growth Model
OCCUPANCY PER DWELLING
The long term trend for more than fifty years has been for a decrease in the number of people per dwelling. This is true across all ages. Occupancy among aging populations is especially low, with widowed partners typically living alone.
1 Jackson, N., “Taupō District, Demographic Trends and Projections, National Institute of Demographic and Economic Analysis”, June 2014.

Future Demand
____________________________________________________________________________________________________________ Taupō District Council Page 7 Solid Waste Asset Management Plan 2018
Council uses a Household Unit Equivalent (HUE) to convert between population figures and the number of dwellings. Current Census data shows the HUE is approximately 2.6 people per household. Statistics New Zealand projects the average occupancy rate will decrease to 2.1 by 2021 due to an aging population and changes in family structures.
In Taupō District, this figure is complicated by holiday homes which form approximately 30%2 of the district’s dwellings. This figure is difficult to fully determine due to the difference between out-of-town ratepayers and what is likely to be deemed a holiday home.
However, as a consequence of this high number of possibly empty homes for a significant part of the year Council needs to consider peak usage and populations when determining demand. This peak demand is particularly relevant when considering demand on infrastructure, such as water and wastewater outlined in detail in the DC Policy and Taupō Growth Model.
Council’s original Solid Waste Management Strategy identified that Council should provide
refuse disposal sites at maximum distance of 15 Km from Urban settlements. This philosophy
was based upon the idea that all travel distances should be comparable for all communities
and so that a constant level of service was provided. The advent of more commercial operators
providing services in the market have meant that Council has to date not had to invest in the
provision of extra disposal sites.
Council’s review of the Waste Minimisation Plan has identified that the status quo in regards to
additional infrastructure for the next tens years is the best direction for Council as it allows for
a mix of Council and commercial service delivery and enables the community to chose what
best suits their needs.
A number of commercial waste collection service providers are now operating in the market
and local residents have the ability to contract to these service providers and thus potentially
negate the need for capital investment by Council in new infrastructure. Council needs to be
flexible and be ready to adjust service provision depending on the market.
Any increase growth in the rural areas can be catered for by the existing transfer stations
located around the district. These facilities transport waste back to the Broadlands Road
Landfill. Any increase in volume of waste due to growth would mean an increase in operational
cost as Transfer Station skip bins will be emptied more often but this increase in cost will be
offset some what by the extra revenue gained from the increased refuse volumes.
As the economy has seen an upturn in activity this has resulted in waste tonnages trending
upwards, with a 20% increase in tonnages reflected across the country.
Council will continue to review operational opening hours at district facilities to ensure that the
community continues to have access to refuse and recycling opportunities, these opening
hours will be determined based on cost of service provision versus service delivery to the
community.
6.4 Meeting increased/changing demand
Increased/changing demand can be met by using a number of methods including;
- Non Asset
- Capital
- Operational
6.4.1 NON ASSET SOLUTIONS
- Product stewardship i.e. others undertaking recovery of products
2 Statistics NZ data

Future Demand
____________________________________________________________________________________________________________ Taupō District Council Page 8 Solid Waste Asset Management Plan 2018
- Landfill bans for some products (stumps, Haz waste E-Waste Tyres etc.)
- Education programs
- New Waste minimisation initiatives
- Operating hours
- Commercial Market
6.4.2 CAPITAL EXPENDITURE DUE TO CHANGES IN DEMAND
The development of 1304 lots in the district in the coming ten years will not require new
infrastructure as council already has a network of facilities around the district to cater for
refuse disposal and recycling service provision, but Council will of course have to continue to
extend the cell footprint at the Broadlands Rd landfill but this extension has been planned and
was not been bought about by growth requirements.
Growth has impacted the Kinloch and Turangi transfer stations as the operational footprints
has remained the same for the last twenty years. Both sites need tweaking to enable them to
cope with peak demand (December-March). The current area for vehicle movements and
parking is insufficient at the Kinloch site, and the current recycling capacity is also now not
coping at both Kinloch and Turangi. Funds have been provided for an upgrade of the facilities,
and Council may have to look closely at the current operating hours at Kinloch as growth
continues.
6.4.3 OPERATIONAL EXPENDITURE DUE TO CHANGES IN DEMAND
The development of 1304 lots in the district in the coming ten years will have an impact on
operational costs but these costs will be partially off-set by fees and charges revenue. The
service delivery cost for urban kerbside waste collection is totally user pays with the fee cost
covering the collection and disposal costs of the waste, as the urban area grows there will be
some additional rate funding needed to cover the cost of recyclable recovery.
Waste statistics identify that people in the Taupō district dispose of .669kgs of waste per
annum and with a HEU value of 2.6 and additional average of 78 houses per year this will only
equate to an increase of 125 tonnes of waste per year which can easily be catered for with the
existing assets and services provided by Council.
The Taupō District ageing population could also see over time a reduction of these numbers as
older people don’t produce as much waste as those houses with young families.
Funding of this expenditure is discussed in the financial section of this asset management plan
(section 9) and strategies for operation and maintenance of assets in section 4.
- Increase of Kerbside Collection area to cater for extension of urban areas.
- Additional recycling services
In 2017 Council undertook a Swapp survey that identified waste volumes and composition.
This has enabled Council to understand the types of waste that are being disposed of and thus
plan service delivery to help minimise the amount that goes to landfill. As Council operates the
only municipal landfill, Council's weighbridge system, “Landfill Three Thousand”, can identify
changes in waste tonnages on a daily basis. Data from the weighbridge is downloaded each
night. Councils kerbside service is also monitored by way of tonnage over the weighbridge and
bag stickers sold. In peak kerbside collection times in Turangi and Mangakino the contractor

Future Demand
____________________________________________________________________________________________________________ Taupō District Council Page 9 Solid Waste Asset Management Plan 2018
can utilise the transfer stations to off load refuse and recyclables allowing them extra capacity
to complete collection runs.
Table 6.1 - Primary composition of overall waste to Broadlands Road landfill - 19 February-18 March 2017
Overall waste to landfill - Primary composition 19 February-18 March 2017
% of weight Tonnes/week Tonnes per annum
(indicative only)
Paper 10.2% 50 T/week 2,532 T/annum
Plastics 12.3% 61 T/week 3,065 T/annum
Organics 24.0% 119 T/week 5,974 T/annum
Ferrous metals 2.9% 15 T/week 730 T/annum
Non-ferrous metals 0.8% 4 T/week 193 T/annum
Glass 2.4% 12 T/week 589 T/annum
Textiles 7.5% 37 T/week 1,868 T/annum
Sanitary paper 6.0% 30 T/week 1,504 T/annum
Rubble 10.9% 54 T/week 2,717 T/annum
Timber 20.0% 99 T/week 4,988 T/annum
Rubber 1.3% 6 T/week 316 T/annum
Potentially hazardous 1.7% 8 T/week 425 T/annum
TOTAL 100.0% 496 T/week 24,901 T/annum
Figure 6.1 - Primary composition of overall waste to Broadlands Road landfill - 19 February-18 March 2017
Future Demand
____________________________________________________________________________________________________________ Taupō District Council Page 10 Solid Waste Asset Management Plan 2018
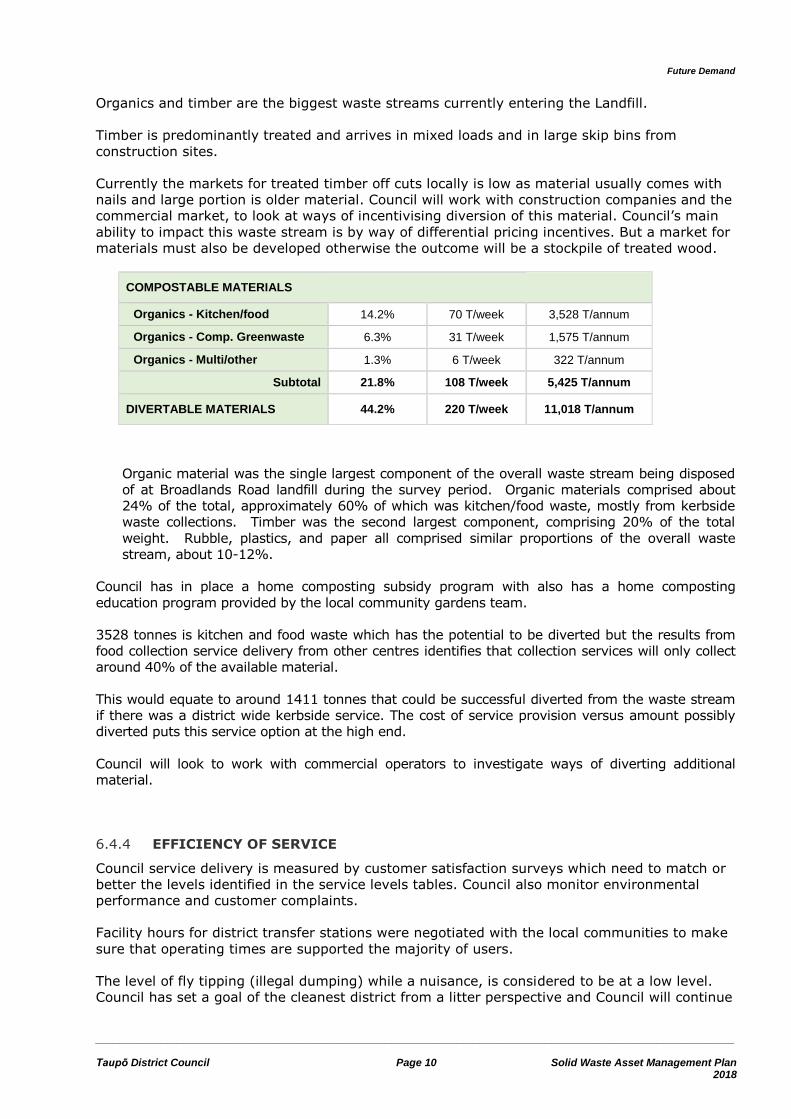
Organics and timber are the biggest waste streams currently entering the Landfill.
Timber is predominantly treated and arrives in mixed loads and in large skip bins from
construction sites.
Currently the markets for treated timber off cuts locally is low as material usually comes with
nails and large portion is older material. Council will work with construction companies and the
commercial market, to look at ways of incentivising diversion of this material. Council’s main
ability to impact this waste stream is by way of differential pricing incentives. But a market for
materials must also be developed otherwise the outcome will be a stockpile of treated wood.
COMPOSTABLE MATERIALS
Organics - Kitchen/food 14.2% 70 T/week 3,528 T/annum
Organics - Comp. Greenwaste 6.3% 31 T/week 1,575 T/annum
Organics - Multi/other 1.3% 6 T/week 322 T/annum
Subtotal 21.8% 108 T/week 5,425 T/annum
DIVERTABLE MATERIALS 44.2% 220 T/week 11,018 T/annum
Organic material was the single largest component of the overall waste stream being disposed
of at Broadlands Road landfill during the survey period. Organic materials comprised about
24% of the total, approximately 60% of which was kitchen/food waste, mostly from kerbside
waste collections. Timber was the second largest component, comprising 20% of the total
weight. Rubble, plastics, and paper all comprised similar proportions of the overall waste
stream, about 10-12%.
Council has in place a home composting subsidy program with also has a home composting
education program provided by the local community gardens team.
3528 tonnes is kitchen and food waste which has the potential to be diverted but the results from
food collection service delivery from other centres identifies that collection services will only collect
around 40% of the available material.
This would equate to around 1411 tonnes that could be successful diverted from the waste stream
if there was a district wide kerbside service. The cost of service provision versus amount possibly
diverted puts this service option at the high end.
Council will look to work with commercial operators to investigate ways of diverting additional
material.
6.4.4 EFFICIENCY OF SERVICE
Council service delivery is measured by customer satisfaction surveys which need to match or
better the levels identified in the service levels tables. Council also monitor environmental
performance and customer complaints.
Facility hours for district transfer stations were negotiated with the local communities to make
sure that operating times are supported the majority of users.
The level of fly tipping (illegal dumping) while a nuisance, is considered to be at a low level.
Council has set a goal of the cleanest district from a litter perspective and Council will continue
Future Demand
____________________________________________________________________________________________________________ Taupō District Council Page 11 Solid Waste Asset Management Plan 2018
to monitor litter levels throughout the district. The provision of the Big Belly refuse compaction
bins has provided extra capacity to cope with peak demands.
The commercial market also provides services in areas where Council does not, these services
cover the larger commercial users and the rural community.
The commercial market also operates at the kerbside providing a raft of collection options for
refuse bags and bins, as well as for green waste.
6.5 Infrastructure Acquired From Developers
Council will not acquire any Solid Waste assets from developers
6.6 Community Expectations
Customers are primarily concerned with expansion of existing network services such as:
Recycling and recovery options
Facility operating hours
Litter bin locations and serviceability
Site safety
Environmental protection
Waste disposal affordability
6.7 Tourism
The Taupo district sees a massive increase in visitor numbers over the summer peak period,
and also when holding major sporting events such as the round the lake challenge and the
Ironman.
This is taken into account, as we design assets for peak demand rather than permanent
population.
For kerbside refuse and recycling collection, peak demands are dealt with by the contractor by
having additional resources available. These peaks have been identified during the time of
contract tender.
The landfill and transfer station operations show an increase in recyclable and recoverable
items as well as an increase in refuse and district transfer station sites have changes in
operation hours. Volume increases are dealt with by Councils contractors providing additional
staff and equipment.
Council also increases its education campaign regarding services available so that visitors to
the district are made aware of what is available to them.
Overall Waste is dependent on population as people create waste but services still need to be
provided to cater for the peak. Services such as the kerbside collection service still also need
to drive all the streets in the urban areas as it can never be determined if the houses are
occupied or not.
Per capita disposal of waste - comparison with 2008 and 2013
The per capita disposal of waste to landfill by residents of Taupō District in 2017 is calculated
in Error! Reference source not found. and compared to the same figures for 2008 and
2013.

Future Demand
____________________________________________________________________________________________________________ Taupō District Council Page 12 Solid Waste Asset Management Plan 2018
The per capita figure is calculated, first, for all waste to landfill and, then, for all waste to
landfill with special wastes excluded. The annual figures for special waste tonnages have also
been provided by Council. For 2017, a total of 154 tonnes of special wastes were recorded by
the weighbridge at Broadlands Road RRC.
Per capita disposal of waste to landfill - 2008, 2013, and 2017
Per capita disposal of waste
to landfill
2017 2013
2008
Usually resident population
Taupō District 37,000 34,300 32,148
T/annum to landfill –
including special wastes
24,901
T/annum
18,118
T/annum
19,700
T/annum
Per capita disposal of waste
to landfill – including special
wastes
0.673
T/capita/an
num
0.528
T/capita/an
num
0.613
T/capita/an
num
T/annum to landfill –
excluding special wastes
24,747
T/annum
17,612
T/annum
18,913
T/annum
Per capita disposal of waste
to landfill – excluding special
wastes
0.669
T/capita/an
num
0.513
T/capita/an
num
0.588
T/capita/an
num
Based on tonnage data, per capita disposal of waste to landfill (including special wastes) has
increased by 27% between 2013 and 2017, from 0.528 T/capita/annum to 0.673
T/capita/annum.
Per capita disposal of waste - comparison with other areas
The Taupō District per capita figure for landfilled waste, including special wastes, is compared
to disposal figures from other local authorities previously surveyed by Waste Not Consulting in
Error! Reference source not found.. The figures in Error! Reference source not found.
do not include cover materials. The national average has been calculated using MfE’s waste
levy data 3 and Stats NZ usually resident population estimates4.
Taupō District disposal rates compared to other areas
Overall waste to landfill including
special wastes (excluding cover
materials)
Tonnes per capita
per annum
Gisborne District 2010 0.305
Waimakariri District 2012 0.311
Westland District 2011 0.331
Ashburton District 2015 0.366
Napier/Hastings 2016 0.495
Southland region 2011 0.500
Tauranga and WBOP District
2014/15 0.524
Christchurch City 2012 0.524
Taupō District 2013 0.528
Napier/Hastings 2016 0.548
Wellington region 2016 0.608
3 http://www.mfe.govt.nz/waste/waste-disposal-levy/monthly-levy-graph 4http://www.stats.govt.nz/browse_for_stats/population/estimates_and_projections/NationalPopulationEstimates_HOTPAt30Jun16.aspx

Future Demand
____________________________________________________________________________________________________________ Taupō District Council Page 13 Solid Waste Asset Management Plan 2018
Hamilton City 2013 0.668
Taupō District 2017 0.673
New Zealand 2016 0.713
Queenstown Lakes District 2012 0.735
Rotorua District 2009 0.736
Auckland region 2012 0.803
The per capita disposal rate for Taupō District in 2017 was marginally lower than the New
Zealand average for 2016 but higher than most other provincial centres. Areas with high
tourism activity, such as Taupō, Queenstown, and Rotorua, tend to have higher per capita
disposal rates than areas with lower levels of tourism activity. Tourism activity generates
waste but tourist are not counted as usually resident by the census.
Higher disposal rates are also associated with areas with high numbers of holiday homes. This
affects the per capita disposal rates, as non-permanent residents are not counted in the
census as being usually resident. Approximately 40% of dwellings in Taupō District are not
permanently occupied.5 Users of holiday homes generate waste but the occupants are not
included in the population statistics.
5 Taupo District Growth Model 2015-2025LTP