600 mhz incentive auction: market variability analysis · 600 mhz incentive auction: market...
TRANSCRIPT
Roberson and Associates, LLC
600 MHz Incentive Auction: Market Variability Analysis
Prepared for T-Mobile, USA
by Roberson and Associates, LLC
9/23/2013 Roberson and Associates, LLC 1
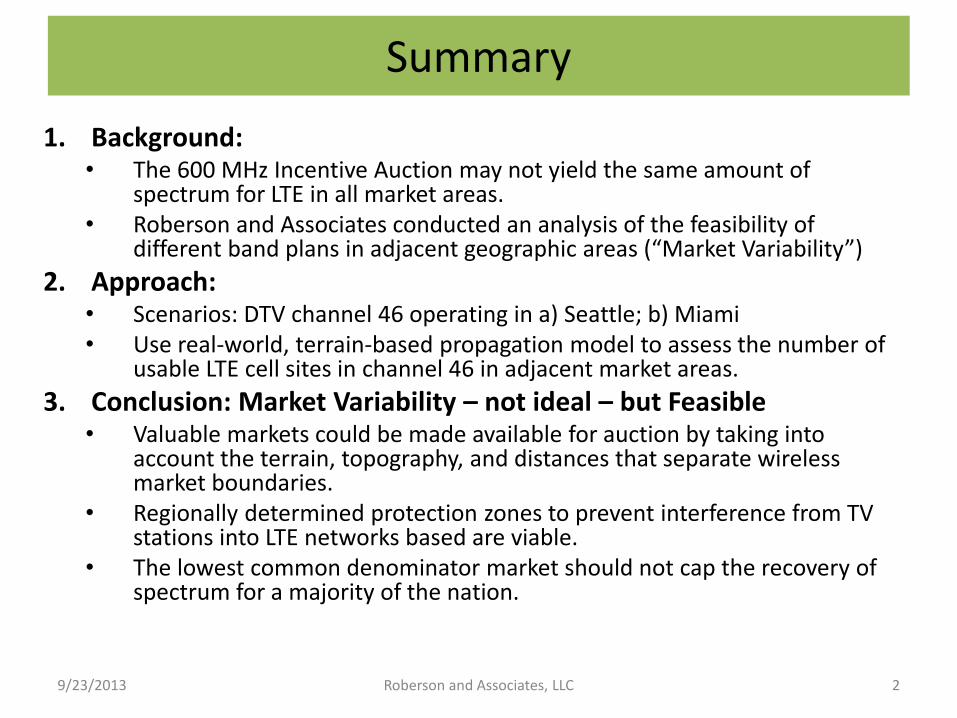
1. Background: • The 600 MHz Incentive Auction may not yield the same amount of
spectrum for LTE in all market areas. • Roberson and Associates conducted an analysis of the feasibility of
different band plans in adjacent geographic areas (“Market Variability”)
2. Approach: • Scenarios: DTV channel 46 operating in a) Seattle; b) Miami • Use real-world, terrain-based propagation model to assess the number of
usable LTE cell sites in channel 46 in adjacent market areas.
3. Conclusion: Market Variability – not ideal – but Feasible • Valuable markets could be made available for auction by taking into
account the terrain, topography, and distances that separate wireless market boundaries.
• Regionally determined protection zones to prevent interference from TV stations into LTE networks based are viable.
• The lowest common denominator market should not cap the recovery of spectrum for a majority of the nation.
Summary
9/23/2013 Roberson and Associates, LLC 2
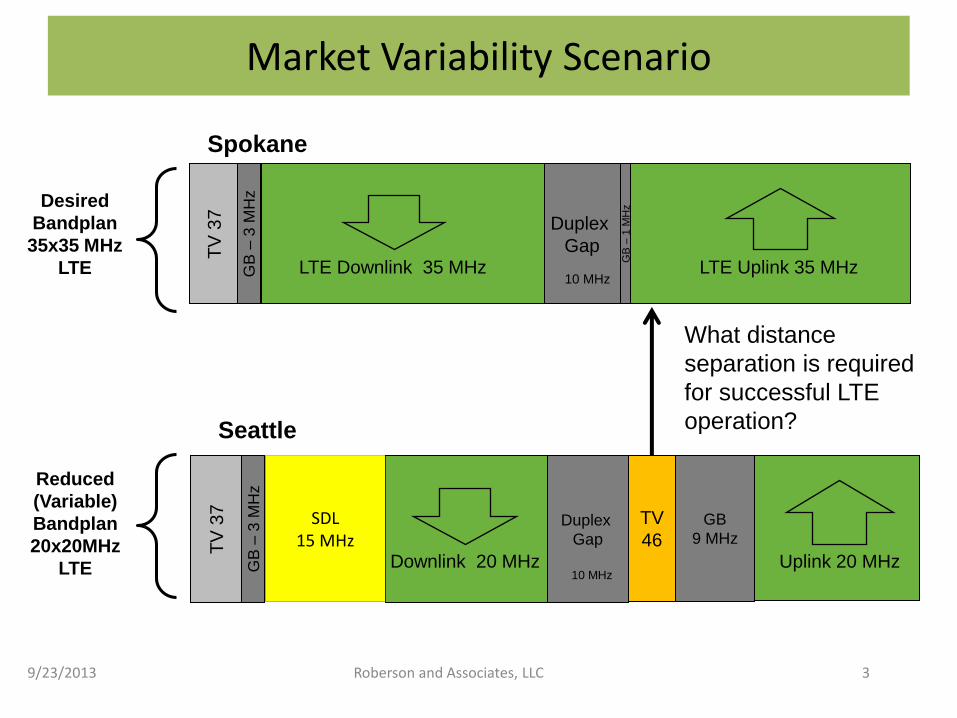
Market Variability Scenario
9/23/2013 Roberson and Associates, LLC 3
Duplex
Gap TV
37
GB
– 3
MH
z
LTE Downlink 35 MHz LTE Uplink 35 MHz 10 MHz
GB
– 1
MH
z
Duplex
Gap
TV
37
Downlink 20 MHz Uplink 20 MHz 10 MHz
TV
46 GB
9 MHz
GB
– 3
MH
z
SDL 15 MHz
Spokane
Seattle
What distance
separation is required
for successful LTE
operation?
Desired
Bandplan
35x35 MHz
LTE
Reduced
(Variable)
Bandplan
20x20MHz
LTE
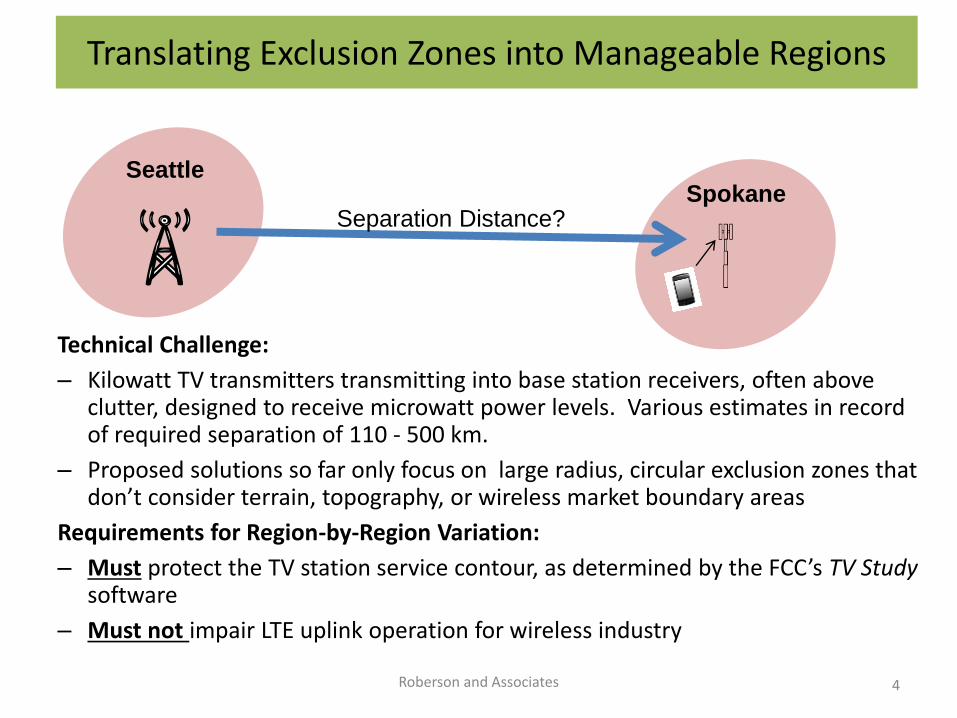
Translating Exclusion Zones into Manageable Regions
Roberson and Associates 4
Spokane Seattle
Separation Distance?
Technical Challenge:
– Kilowatt TV transmitters transmitting into base station receivers, often above clutter, designed to receive microwatt power levels. Various estimates in record of required separation of 110 - 500 km.
– Proposed solutions so far only focus on large radius, circular exclusion zones that don’t consider terrain, topography, or wireless market boundary areas
Requirements for Region-by-Region Variation:
– Must protect the TV station service contour, as determined by the FCC’s TV Study software
– Must not impair LTE uplink operation for wireless industry
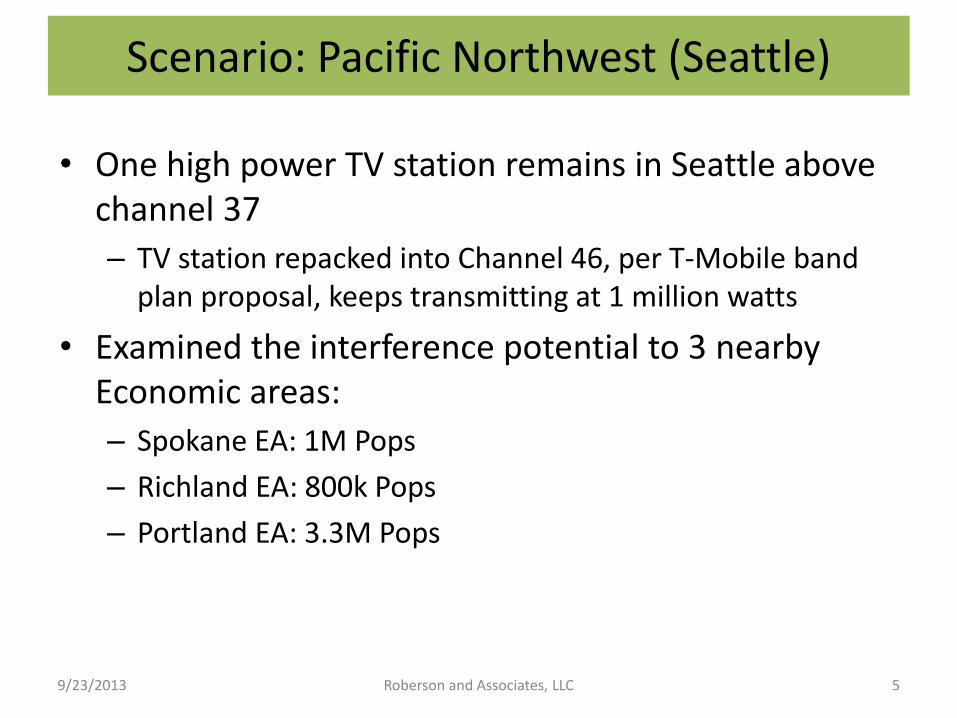
Scenario: Pacific Northwest (Seattle)
• One high power TV station remains in Seattle above channel 37
– TV station repacked into Channel 46, per T-Mobile band plan proposal, keeps transmitting at 1 million watts
• Examined the interference potential to 3 nearby Economic areas:
– Spokane EA: 1M Pops
– Richland EA: 800k Pops
– Portland EA: 3.3M Pops
9/23/2013 Roberson and Associates, LLC 5
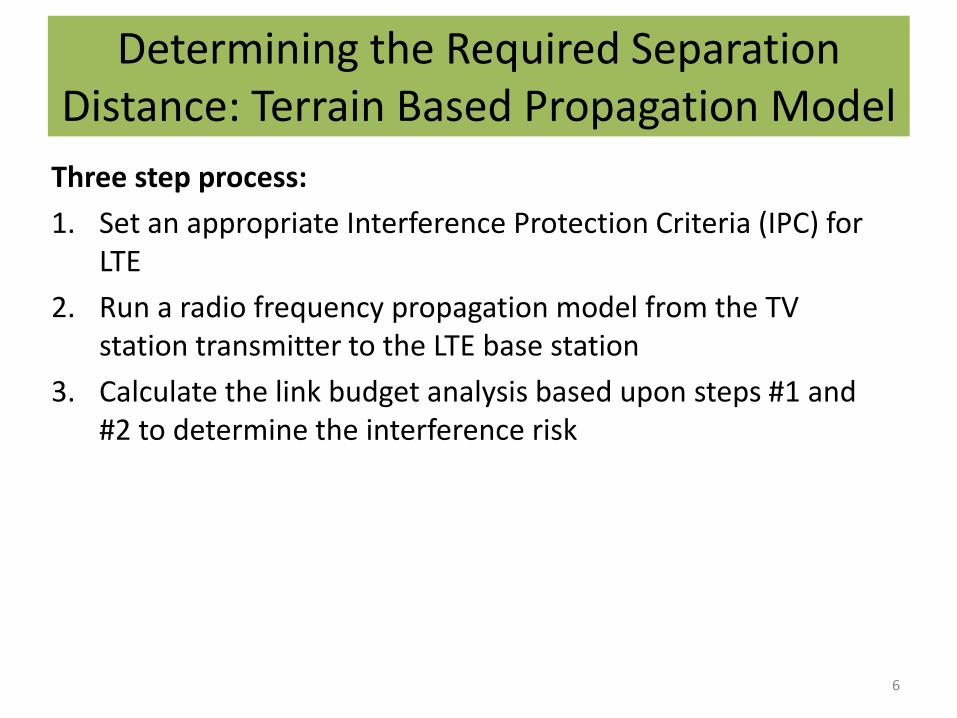
Determining the Required Separation Distance: Terrain Based Propagation Model
Three step process:
1. Set an appropriate Interference Protection Criteria (IPC) for LTE
2. Run a radio frequency propagation model from the TV station transmitter to the LTE base station
3. Calculate the link budget analysis based upon steps #1 and #2 to determine the interference risk
6
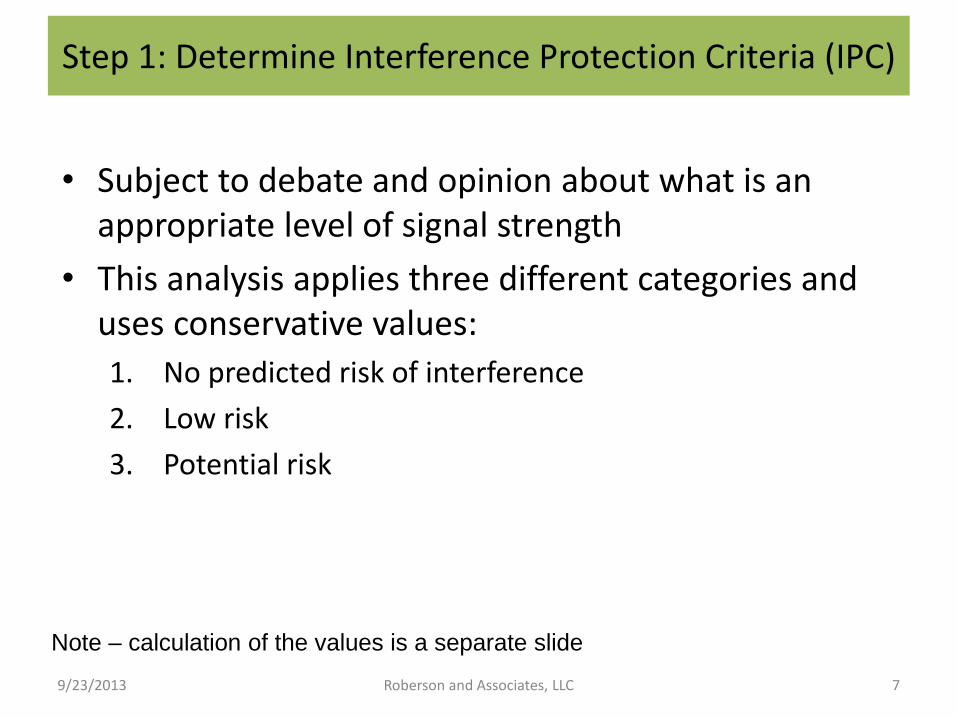
Step 1: Determine Interference Protection Criteria (IPC)
• Subject to debate and opinion about what is an appropriate level of signal strength
• This analysis applies three different categories and uses conservative values:
1. No predicted risk of interference
2. Low risk
3. Potential risk
9/23/2013 Roberson and Associates, LLC 7
Note – calculation of the values is a separate slide
9/23/2013 Roberson and Associates, LLC 8
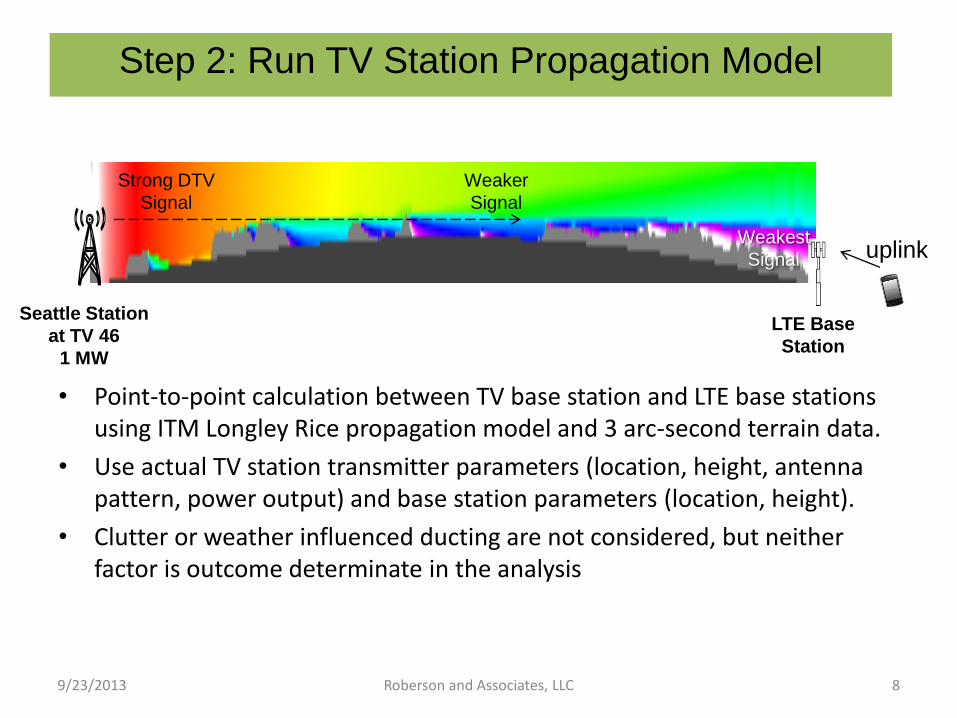
Step 2: Run TV Station Propagation Model
Seattle Station
at TV 46
1 MW
LTE Base
Station
Strong DTV
Signal
Weaker
Signal
Weakest
Signal uplink
• Point-to-point calculation between TV base station and LTE base stations using ITM Longley Rice propagation model and 3 arc-second terrain data.
• Use actual TV station transmitter parameters (location, height, antenna pattern, power output) and base station parameters (location, height).
• Clutter or weather influenced ducting are not considered, but neither factor is outcome determinate in the analysis
9/23/2013 Roberson and Associates, LLC 9
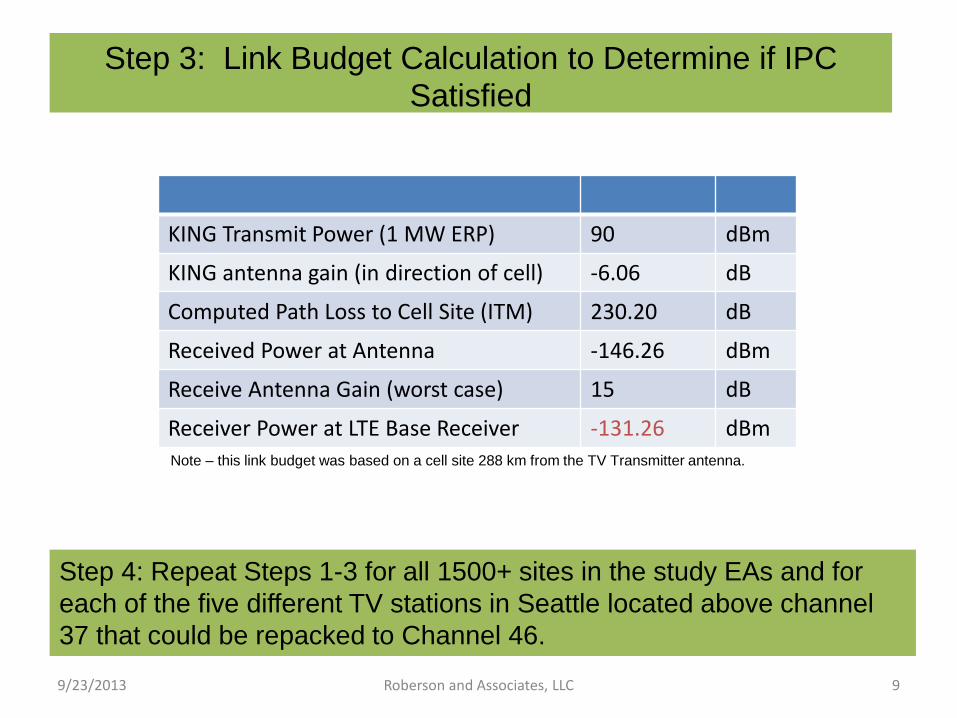
Step 3: Link Budget Calculation to Determine if IPC Satisfied
KING Transmit Power (1 MW ERP) 90 dBm
KING antenna gain (in direction of cell) -6.06 dB
Computed Path Loss to Cell Site (ITM) 230.20 dB
Received Power at Antenna -146.26 dBm
Receive Antenna Gain (worst case) 15 dB
Receiver Power at LTE Base Receiver -131.26 dBm Note – this link budget was based on a cell site 288 km from the TV Transmitter antenna.
Step 4: Repeat Steps 1-3 for all 1500+ sites in the study EAs and for
each of the five different TV stations in Seattle located above channel
37 that could be repacked to Channel 46.
9/23/2013 Roberson and Associates, LLC 10
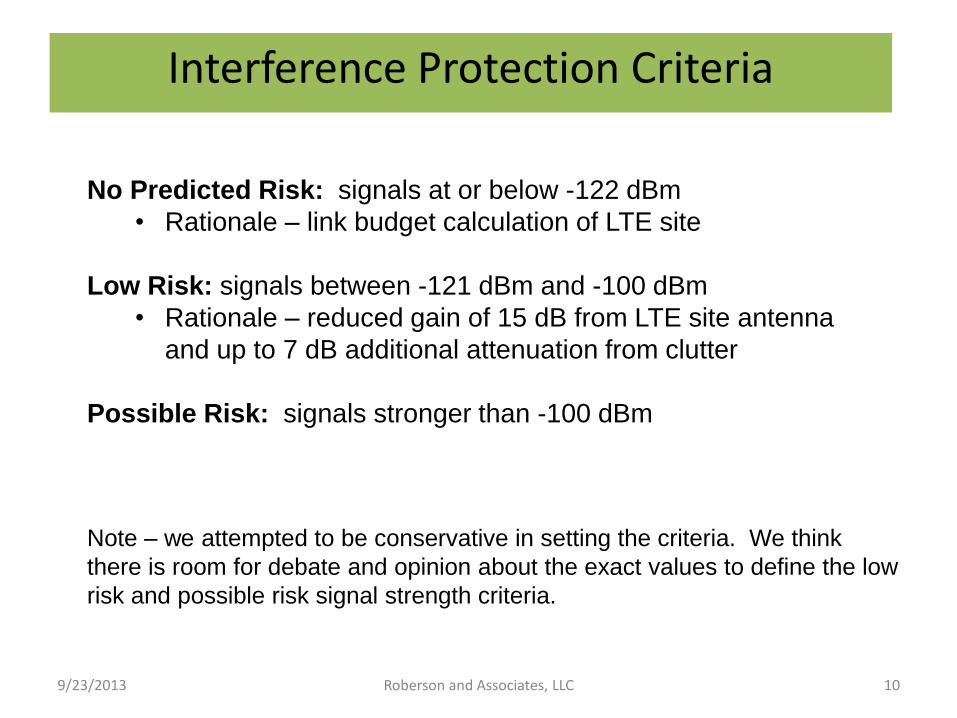
Interference Protection Criteria
No Predicted Risk: signals at or below -122 dBm
• Rationale – link budget calculation of LTE site
Low Risk: signals between -121 dBm and -100 dBm
• Rationale – reduced gain of 15 dB from LTE site antenna
and up to 7 dB additional attenuation from clutter
Possible Risk: signals stronger than -100 dBm
Note – we attempted to be conservative in setting the criteria. We think
there is room for debate and opinion about the exact values to define the low
risk and possible risk signal strength criteria.
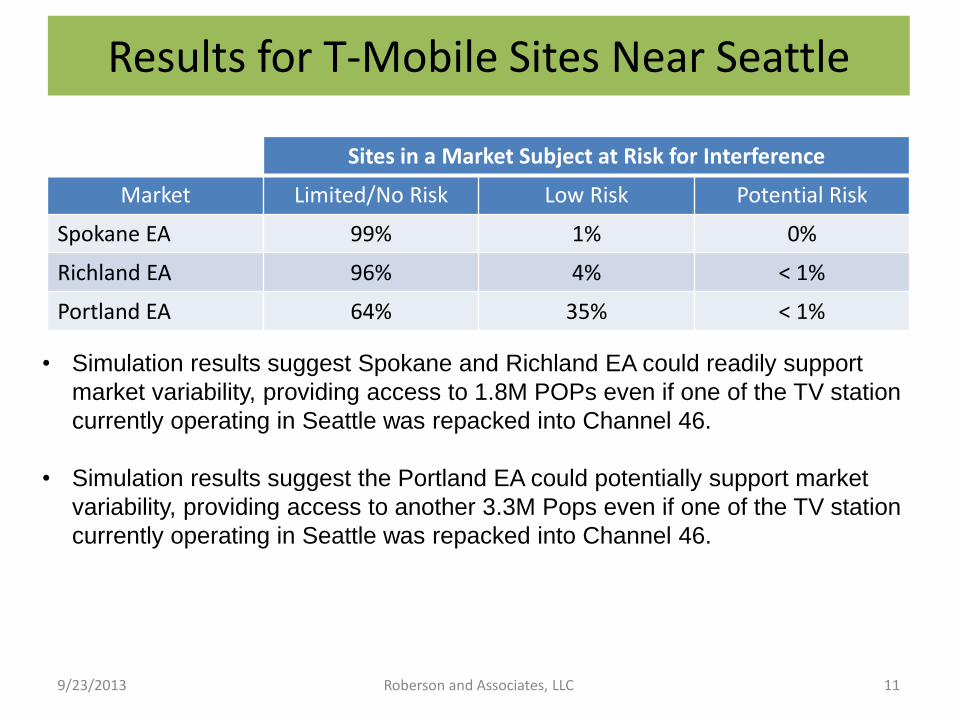
Results for T-Mobile Sites Near Seattle
9/23/2013 Roberson and Associates, LLC 11
Sites in a Market Subject at Risk for Interference
Market Limited/No Risk Low Risk Potential Risk
Spokane EA 99% 1% 0%
Richland EA 96% 4% < 1%
Portland EA 64% 35% < 1%
• Simulation results suggest Spokane and Richland EA could readily support
market variability, providing access to 1.8M POPs even if one of the TV station
currently operating in Seattle was repacked into Channel 46.
• Simulation results suggest the Portland EA could potentially support market
variability, providing access to another 3.3M Pops even if one of the TV station
currently operating in Seattle was repacked into Channel 46.
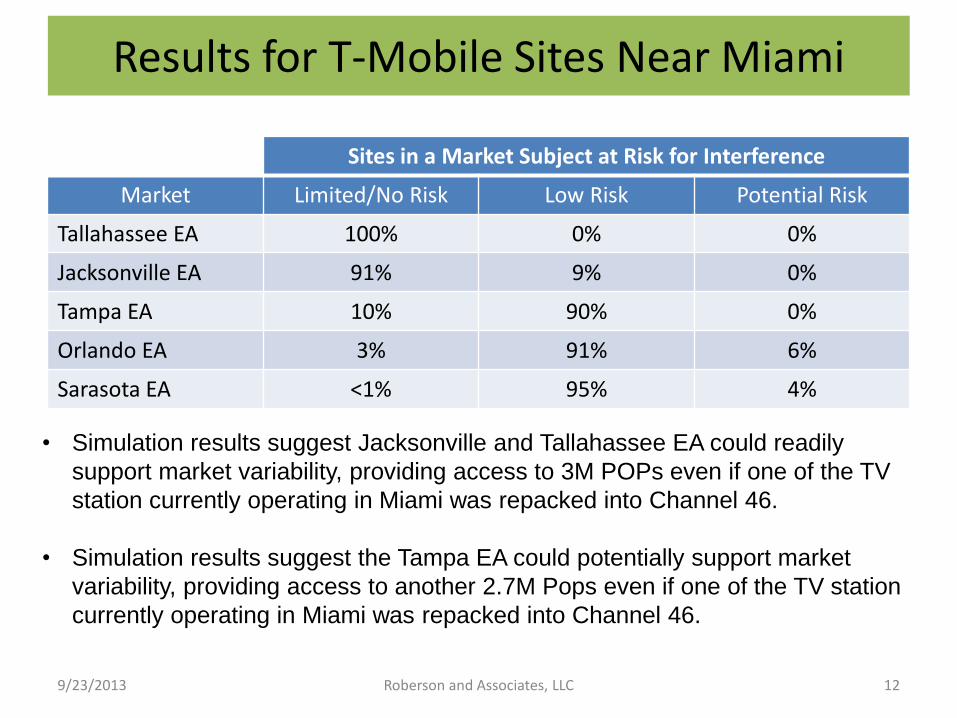
Results for T-Mobile Sites Near Miami
9/23/2013 Roberson and Associates, LLC 12
Sites in a Market Subject at Risk for Interference
Market Limited/No Risk Low Risk Potential Risk
Tallahassee EA 100% 0% 0%
Jacksonville EA 91% 9% 0%
Tampa EA 10% 90% 0%
Orlando EA 3% 91% 6%
Sarasota EA <1% 95% 4%
• Simulation results suggest Jacksonville and Tallahassee EA could readily
support market variability, providing access to 3M POPs even if one of the TV
station currently operating in Miami was repacked into Channel 46.
• Simulation results suggest the Tampa EA could potentially support market
variability, providing access to another 2.7M Pops even if one of the TV station
currently operating in Miami was repacked into Channel 46.
BACKUP
9/23/2013 Roberson and Associates, LLC 13
9/23/2013 Roberson and Associates, LLC 14
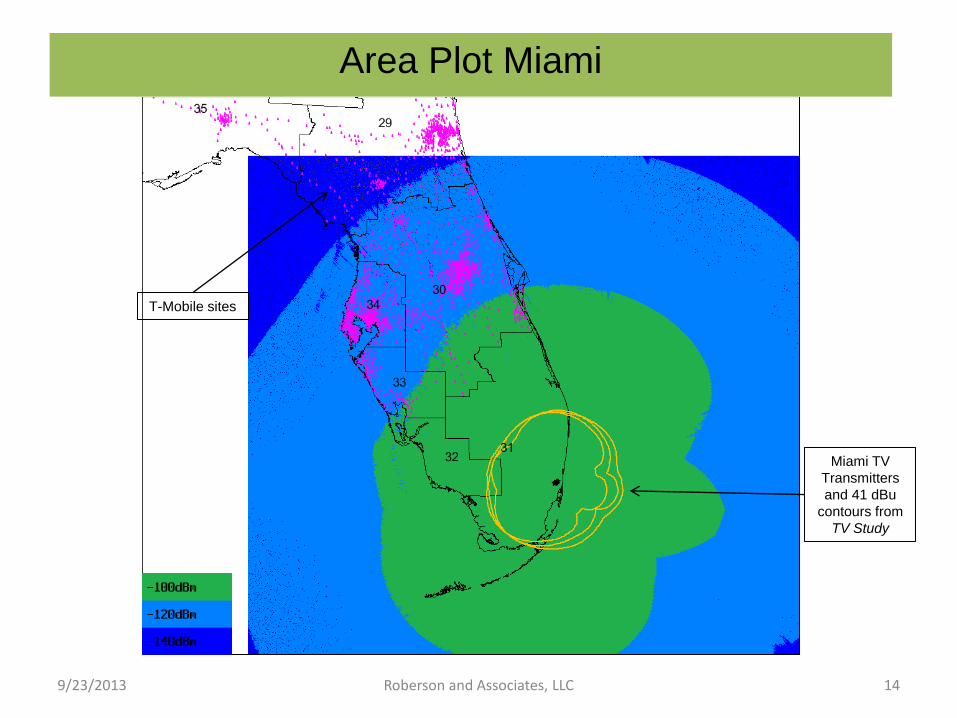
Area Plot Miami
Miami TV
Transmitters
and 41 dBu
contours from
TV Study
T-Mobile sites
9/23/2013 Roberson and Associates, LLC 15
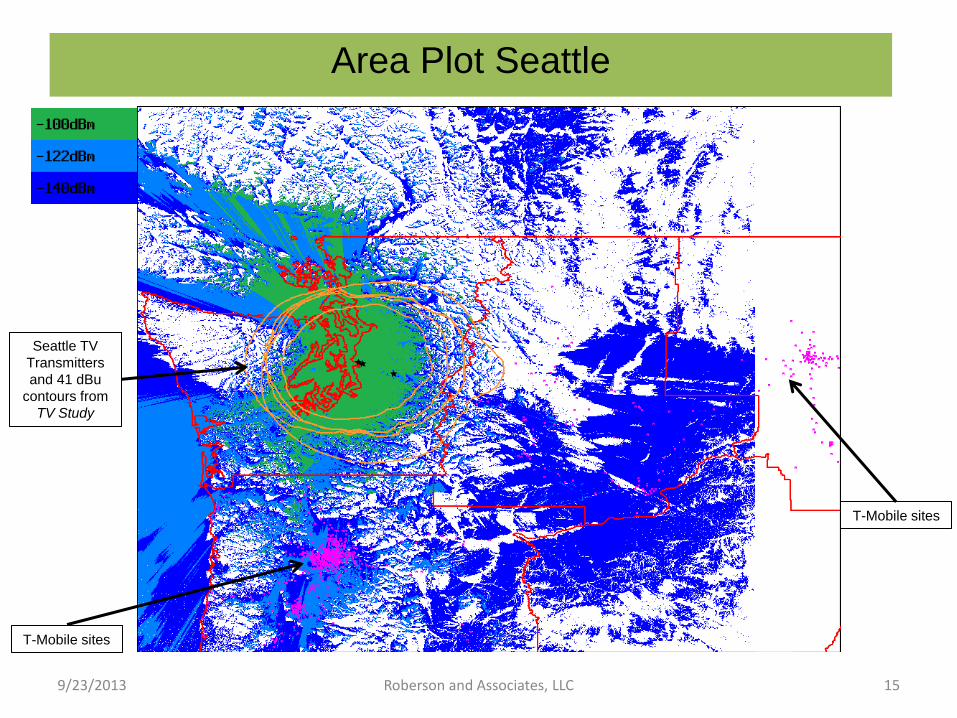
Area Plot Seattle
Seattle TV
Transmitters
and 41 dBu
contours from
TV Study
T-Mobile sites
T-Mobile sites
9/23/2013 Roberson and Associates, LLC 16
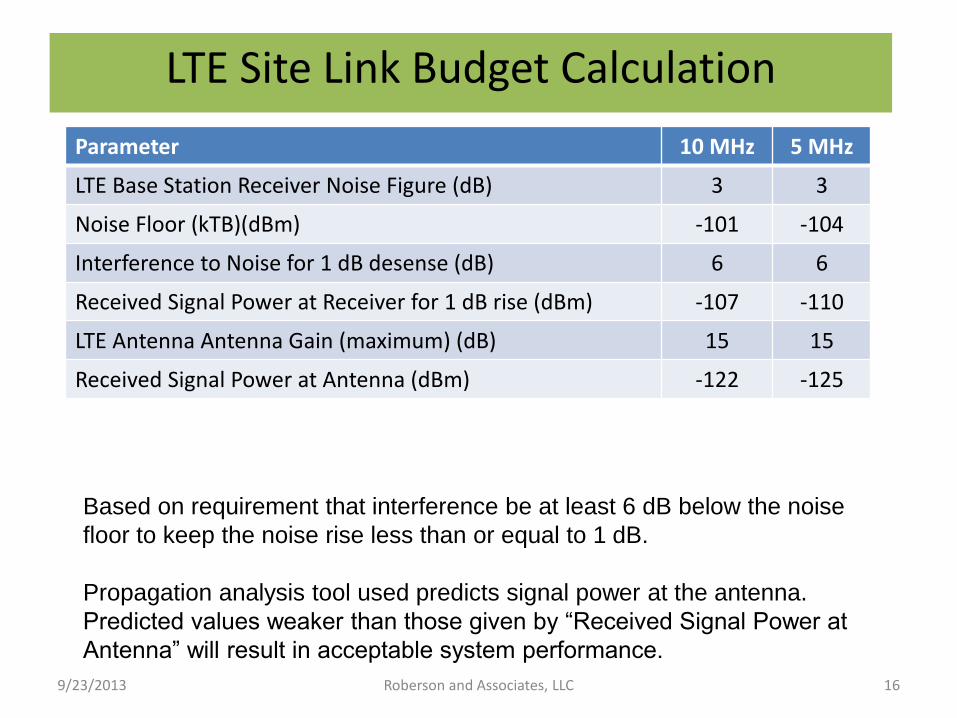
LTE Site Link Budget Calculation
Parameter 10 MHz 5 MHz
LTE Base Station Receiver Noise Figure (dB) 3 3
Noise Floor (kTB)(dBm) -101 -104
Interference to Noise for 1 dB desense (dB) 6 6
Received Signal Power at Receiver for 1 dB rise (dBm) -107 -110
LTE Antenna Antenna Gain (maximum) (dB) 15 15
Received Signal Power at Antenna (dBm) -122 -125
Based on requirement that interference be at least 6 dB below the noise
floor to keep the noise rise less than or equal to 1 dB.
Propagation analysis tool used predicts signal power at the antenna.
Predicted values weaker than those given by “Received Signal Power at
Antenna” will result in acceptable system performance.
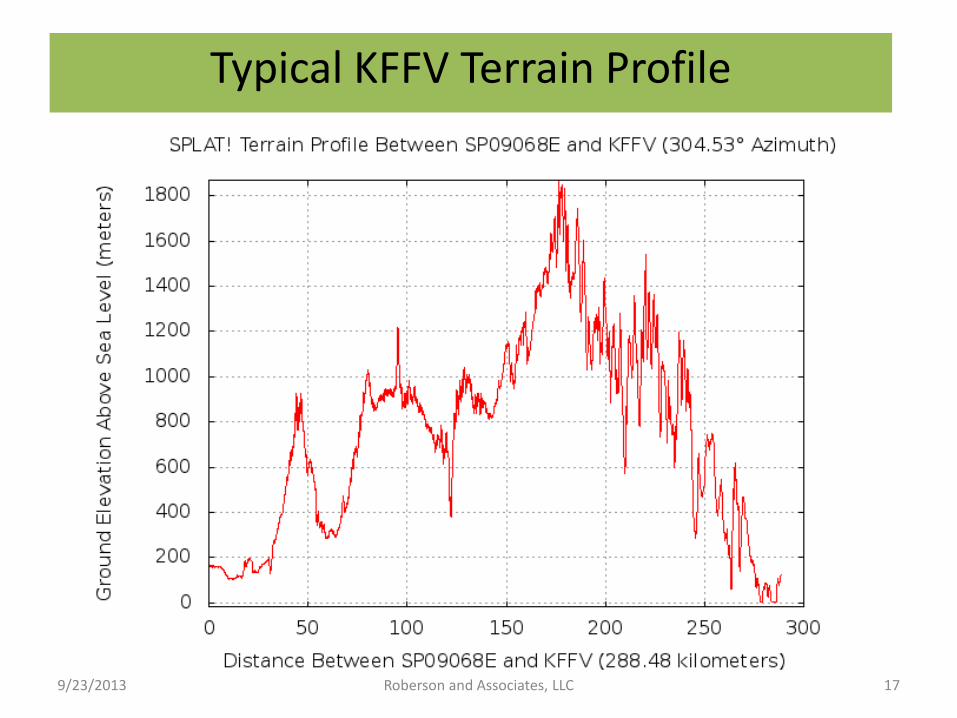
9/23/2013 Roberson and Associates, LLC 17
Typical KFFV Terrain Profile