60th highway geology symposium - terracon.com · th highway geology symposium ... ryan turner,...
TRANSCRIPT
1
60th HIGHWAY GEOLOGY SYMPOSIUM
www.HighwayGeologySymposium.org BUFFALO, NEW YORK
September 29 - October 1, 2009
PROCEEDINGS
HOSTED BY: NEW YORK STATE THRUWAY AUTHORITY NEW YORK STATE DEPARTMENT OF TRANSPORTATION NEW YORK STATE MUSEUM

2
TABLE OF CONTENTS
Proceedings Papers Table of Contents�…�…�…�…�…�…�…�…�…�…�…�…�…�…�…�…�…�….3
60th HGS Organizing Committee Members�…�…�…�…�…�…�…�…�…�…�…�…�…�…�…..�….6
Steering Committee Officers�…�…�…�…�…�…�…�…�…�…�…�…�…�…�…�…..�…�…�…..�…�…�…7
Steering Committee Members�…�…�…�…�…�…�…�…�…�…�…�…�…�…�…�…�…�…�…..�…�…...8
History, Organization and Function�…�…�…�…�…�…�…�…�…�…�…�…�…�…�….�…�…�….�…10
Emeritus Members�…�…�…�…�…�…�…�…�…�…�…�…�…�…�…�…�…�…�…�…�…�…..�…�…�…�…..13
Medallion Award Winners�…�…�…�…�…�…�…�…�…�…�…�…�…�…�…�…�…�…�…�…�…�…..�….14
Future Symposia Schedule�…�…�…�…�…�…�…�…�…�…�…�…�…�…�…�…...........................15
Sponsors�…�…�…�…�…�…�…�…�…�…�…�…�…�…�…�…�…�…�…�…�…�…�…�…�…�…�…...�…�…�….16
Exhibitors�…�…�…�…�…�…�…�…�…�…�…�…�…�…�…�…�…�…�…�…�…�…�…�…�…..�….................17
Conference Agenda�…�…�…�…�…�…�…�…�…�…�…�…�…�…�…�…�…�…�…�…�…�…�…�…�…�….18

3
PROCEEDINGS PAPERS 1.1. High Bridge Area Roadway Slide, Letchworth State Park, Portageville,
New York …………………………….………………………………………………. ...22
Andrew J. Nichols, P.E.; James Bojarski, P.E.
1.2. Remediation of the SR 15 Welcome Center Landslide……….……………..….. 35
David R. Scherer, P.E.; Robert E. Johnson, P.E.; Paul J. Lewis, P.E.
1.3. Rio Blanco Landslide Failure Between Rifle and Meeker Colorado – Investigation, Design and Emergency Mitigation Using Lightweight Expanded Polystyrene Fill……………..……….………………… .... 49
Ben Arndt, P.E., P.G.; Peter Mertes, P.E.; Bahram Seifipour, P.E. 2.1 Innovations in Rockfall Barriers and the New European
Standard ETAG 027……………………………………………………………….……62
Frank Amend
2.2 Controlling Large Rockfalls on Steep Slopes, the Kama Bluffs Experience……………………………………………….……………………………….71
David F. Wood; Peter McKenna; Derek Daneff; Stephen Senior
2.3. Ring Net Drapery for Rockfall Protection: Installation Observations…….......................................................................................................89
M. Fish; T.C. Badger; S.M. Lowell; D. Journeaux
2.4. Protection from High Energy Rockfall Impacts Using Teramesh Embankments: Design and Experiences……………………………......................107
Ghislain Brunet; Giorgio Giacchetti; Paola Bertolo; Daniele Peila
2.5. Post Foundations for Flexible Rockfall Fences………………………………...….125 Ryan Turner, P.E.; John D. Duffy, P.G., C.E.G.; John P. Turner, Ph.D., P.E.
3.1. Role of Stratigraphy in Cut Slope Design for Horizontay-Bedded Sequences of Competent and Incompetent Rocks of Eastern Ohio……………………….…141
Yonathan Admassu; Abdul Shakoor
4
3.2. Green River Bridge Pier 1 Landslide, King County, Washington………………………………………………………………………….…… 158
T.C. Badger; E.L. Smith; S.M. Lowell; M. Frye; J. Cuthbertson; T.M. Allen
3.3. Getting It Right the Third Time – Reconstruction of Interstate 476 Over Unstable Karst in Plymouth Metting, PA…………….….….……………………….. 169
Bruce Shelly, P.E.; Sarah McInnes, P.E.
3.4. US-50 Big Horn Sheep Canyon, Fremont County, Colorado – A Rockfall Mitigation Case Study………....….............................................................................179
Chad Lukkarila; John Hunyadi; William C.B. Gates
3.5. Colorado Rockfall Simulation Program Version 5.0 ………….............................. 189
Ryan Bartingale, E.I.T.; Jerry Higgins, Ph.D., P.E.; Richard Andrew, P.E.; Alan Rock; Runing Zhang
4.1. A Proactive Approach to Limit Potential Impacts from Blasting to Drinking Water Supply Well, Windham, New Hampshire...................................................................201
Krystle Pelham; Dick Land, P.G.; Jay R. Smerenkanicz, P.G.; William Miller, P.G.
4.2. Remediation of Soft Clay Utilizing the ‘Dry Mix Method”…..…………………….... 218
Shawn W. Logan, P.E.; Michael Mann, P.E.; Brian Rose; Jonathan Kolber; Michael L. Grant, P.E.
4.3. Load-Settlement Model of Rock Sockets from O-Cell Testing……………..……... 237
John P.Turner, Ph.D., P.E.; Reid Buell, R.G., C.H.G., C.E.G; Xing Zheng
4.4. Field Trip Overview – Scoby Hill Landslide – Route 219…………………......…....254
Brent A. Black, C.E.G, R.G.; George Machan, P.E.
5.1. The Practical Solution for a Cave Located on a School Campus in Central Kentucky………….………………….…....................................................................... 267
` Richard Wilson, P.G.
5.2. Some Notes on the Geotechnical Investigation Process……………………..........283
Verne C. McGuffey, P.E.
5.3. High Energy Rockfall Embankment Constructed Using a Freestanding Woven Wire Mesh Reinforced Soil Structure in British Columbia, Canada…………........290
Michael Simmons, P.E.; Steve Pollak, P.E.; Beth Peirone, P.E.
5
5.4. SH 20 Keetonville Hill Landslide Repair Rogers County, Oklahoma…………..….302
James B. Nevels, Jr.; Vincent G. Reidenbach, Ph.D., P.E.
5.5. Review of Bridge Sites Visited for NCHRP Project 24-29: Scour at Bridge Foundations on Rock…………….…………………………….. ……………………..….323
Jeffery R. Keaton; Su K. Mishra
6.1. Condition Assessment of Earth Reinforcements for Asset Management……......348
Kenneth L. Fishman, Ph.D., P.E.; Robert A Gladstone, P.E.; John J. Wheeler, P.E.
6.2. Rock Slope Stabilization Projects Letchworth State Park Portageville, New York……………………….………………………………………………………………….. 366
Michael J. Mann, P.E.; Ken Wojtkowski, P.E.; Donald Owens; David Herring
6.3. Rock Slope Stabilization Using Spider System ……………………………..…….….389
Joseph C. Bigger
6.4. Terrain Reconnaissance at New York State Department of Transportation…...…407 Doughlas Hadjin 6.5 The Use of Time Domain Reflectometry (TDR) to Monitor an Active Landslide....423
S.D. Neely, P.E.; A.M.Viera, Ph.D.
423
6.5
THE USE OF TIME DOMAIN REFLECTOMETRY(TDR) TO MONITOR AN ACTIVE LANDSLIDE
S. D. NEELY, P.E. (TERRACON)9
A.M. VIEIRA, PH. D. (TERRACON) 10
Abstract: The northernmost ½ mile of the 1999 realignment of SR 87 (approx. MP 224) has
experienced slope and retaining wall failures that were initiated during the 2004/2005 winter
storms. Subsequently, on March 21, 2008, a landslide closed SR 87. Arizona Department of
Transportation (ADOT) addressed the 2008 landslide with an emergency remediation project, and
is now evaluating the potential impacts of the recent and ancient landslide complex with an
extensive investigation and monitoring program. The monitoring program consists of multiple
Inclinometers, TDR cables and VWP. The TDR cables have been monitored with automatic data
acquisition and data transfer. The monitoring system was also set up to alert multiple personnel
once threshold values had been exceeded. Measurement of displacement using the TDR
could be obtained for approximately 4 to 8 times greater displacements than were
measured by the inclinometers. Results suggest the TDR can be used to determine rate of
ground movement provided calibration curves are obtained for each location. The cost of
the TDR system was very inexpensive when added to the inclinometer installation. Some of our
lessons learned will be enumerated.
INTRODUCTION
A landslide occurred on March 21, 2008 that partially blocked the southbound lanes of
State Route 87 (SR-87). The landslide resulted from excavation activities associated with
9 S. D. Neely, P.E.. Principal/Geotechnical Services
Manager Terracon Consultants, Inc.: Phoenix Office. 4685 S. Ash Avenue, Suite H-4, Tempe, AZ 85282. 10
A. M. Vieira, Ph.D.. Staff Engineer Terracon Consultants, Inc.: Phoenix Office. 4685 S. Ash Avenue, Suite H-4, Tempe, AZ 85282.
424
creating the highway through-cut for the re-alignment of SR-87. The Arizona
Department of Transportation (ADOT) contracted with AECOM to conduct explorations
and perform engineering analyses to develop mitigation measures relative to the
landslide. The Arizona Department of Transportation also contracted with Terracon to
perform measurements of the landslide area using Time Domain Reflectometry (TDR) to
supplement inclinometer and vibrating wire piezometer (VWP) data collected during the
on-site monitoring program. The TDR monitoring system also included a telemetry
station with an automated alert system that contacted ADOT and Terracon personnel
when threshold values were exceeded.
This paper will describe the geology comprising the SR-87 landslide, the TDR
equipment, the technology of TDR, the analyses and interpretation of the data, and
present a comparison of TDR data with that of inclinometer data obtained from the same
boring locations.
PROJECT DESCRIPTION
The material used to describe the landslide and surrounding geology was provided by
AECOM 11 in their initial report to ADOT.
Landslide: For purposes of mapping landslide units, the paleoslide and recent slides are
each given the same unit name, Qls, regardless of age of first sliding. In this paper
11 AECOM
2777 East Camelback Road, Suite 200 Phoenix, AZ 85016.

425
�“ancient�” or �“paleo-�” refers to the large ancient slide and �“recent�” or �“March 2008 slide�”
refers to the smaller slide that occurred on March 21, 2008, and failed into the roadway
resulting in the temporary road closures.
The ancient slide occurs as a subtle landform mainly unrecognizable to the layperson and
subtle enough to be overlooked even by some professional geologists. Slides of this size
and scale are rarely encountered in Arizona. However, it is not uncommon in general for
ancient slides in similarly soft sedimentary rock to go unnoticed and unmapped on
regional geologic maps. To the untrained eye, this paleoslide is relatively
indistinguishable from the surrounding hilly and mountainous terrain.
The following aerial photograph depicts the relationship of the landslide and the SR87
highway cut passing through it, and covers the overall geomorphic character of the slide
mass.

426
Figure 1: May 2008 Aerial Stereo Photo Pair Showing Current SR 87 Alignment and the Ancient Landslide Extending from Bottom Left to Upper Right of Photo
The geomorphic characteristics of the large paleoslide, as previously stated, are subtle.
From the clearly demarcated headscarp in the southern portion of the picture one can
observe the blocky nature of the slide mass. The upper portion of the slide mass appears
to consist of relatively coherent rock blocks translated and rafted downward northeast in
the main direction of sliding. Back rotation of these blocks on the upper portion of the
slide mass has created sag basins, or grabens, resulting in closed depressions that
seasonally collect and pond water after heavy precipitation events. Some conspicuous
drainages were also observed in this area, where the break in slope at the top of the slide
mass meets the lower edge of the headscarp, and are suspected to be tension or other
landslide related ground cracks.
427
The stability of the ancient slide is presently being monitored. From a perspective of
gross stability, based on months of monitoring and observations, the ancient paleoslide
appears to be dormant. However, localized areas of the highway through cut near the
northbound (NB) and southbound (SB) walls have begun to show some slow creep-type
movement (an approximate rate of inch per year). Yet, no indications of movement
have been observed in the slope inclinometers or TDR cable measurements that monitor
deep within the upper central portion of the large paleoslide above (southwest) the
roadway.
Geologic and Geotechnical Profile: The site area is predominated by minor basalt
flows capping Miocene-age sedimentary rock. The sedimentary rock is generally
characterized as a fining upwards basin fill sequence with thicknesses greater than 400
feet. The basin is underlain by a Foliated Paleozoic schist basement rock.
Qls, Landslide (Pleistocene-Holocene): �– The landslide is composed of chaotic masses
of rock that have been transported down and away from their bedrock source on the order
of tens to hundreds of feet. The ancient landslide appears to have occurred entirely
within the Tga unit primarily along shears in the bedded claystone in the upper Tga
section, and includes boulders of units Tbp and Tbb. Movement is along a basal slide
plane and along numerous internal breaks of great complexity. A maximum slide
thickness of 237 feet has been observed in the drill core.

428
Tga, Gravel with arkosic matrix (Miocene) �– The Tga unit is a major basin-filling unit
at this locale and is a generally fining upwards fluvial sequence (and possibly lacustrine
due to the fine-grained claystone and clayey siltstone facies). The unit Tga is the primary
geologic unit involved in both the paleo and March 2008 landslides. The unit Tga is
comprised of interstratified sandstone and claystone with minor discrete layers of low
shear strength clayey siltstone (10 degree residual shear strength) prone to bedding plane
failure and cut slope instability. Approximately the upper 200 feet (thickness varies)
encountered in the drill core is comprised of translated and slightly tilted, relatively
coherent blocks of weak sedimentary rock involved in the ancient slide, with
approximately 80 to 100 feet of sandstone overlying approximately 100 to 110 feet of
claystone with numerous slickensided, highly sheared zones of great complexity. Clast
content in the sandstone member varies from about 10 percent to 50 percent. The
material is moderately well-bedded; poorly to moderately sorted and generally poorly
consolidated, but with local moderately indurated beds, becoming more indurated with
depth. Throughout most of the map area this unit is the basal Tertiary unit resting
directly on the Proterozoic basement.
Shear plane frequency observed in drill core decreases significantly below the elevation
of the bottom of the interpreted ancient slide plane. Occasional shears (mostly high angle
dip and rake) occur below the ancient slide and are interpreted to be an imprint of
millions of years tectonic faulting preserved in the deeper more indurated sandstone
member. Estimated thicknesses in the areas outside the landslide may be in excess of 450
feet.
429
Xasu, Schistose rocks, undivided �– Wide variety of felsic schist, shale, siltstone,
sandstone, conglomerate and minor mafic volcanic rocks, which exhibited grey to light
purple in color as encountered in drill core. The schist unit forms the Paleozoic basement
for the site area, and locally underlies the Tgm and Tga units separated by unconformity
representing a billion and half years of missing rock record at this site, likely the result of
regional uplift and erosion or non-deposition. The structure and stratigraphy of these
greenschist facies metamorphic rocks are controversial among research geologists that
study the early formation of the western North American continental crust. Less frequent
occasional shears or faults observed in the drill core present at elevations well below the
ancient slide within the schist are interpreted to be an imprint of many millions of years
of tectonic faulting preserved in the upper weathered schist of the Paleozoic basement.
Monitoring System: The monitoring system for the landslide has consisted of the following:
Inclinometers placed to depths of 30 to 400 feet;
TDR cables placed to similar depths; and,
Vibrating Wire Piezometers.
Most of the inclinometers were installed with TDR cables and the top of the cable was
exposed within a vault. The research for this paper has focused on three specific
Inclinometer/TDR locations, namely, B-25, B-30 and B-31. It should be noted that B-25
was installed in May 2008, as part of the immediate investigation after the March 2008
430
failure, and B-30 and B-31 were installed in September, approximately 4 months after B-
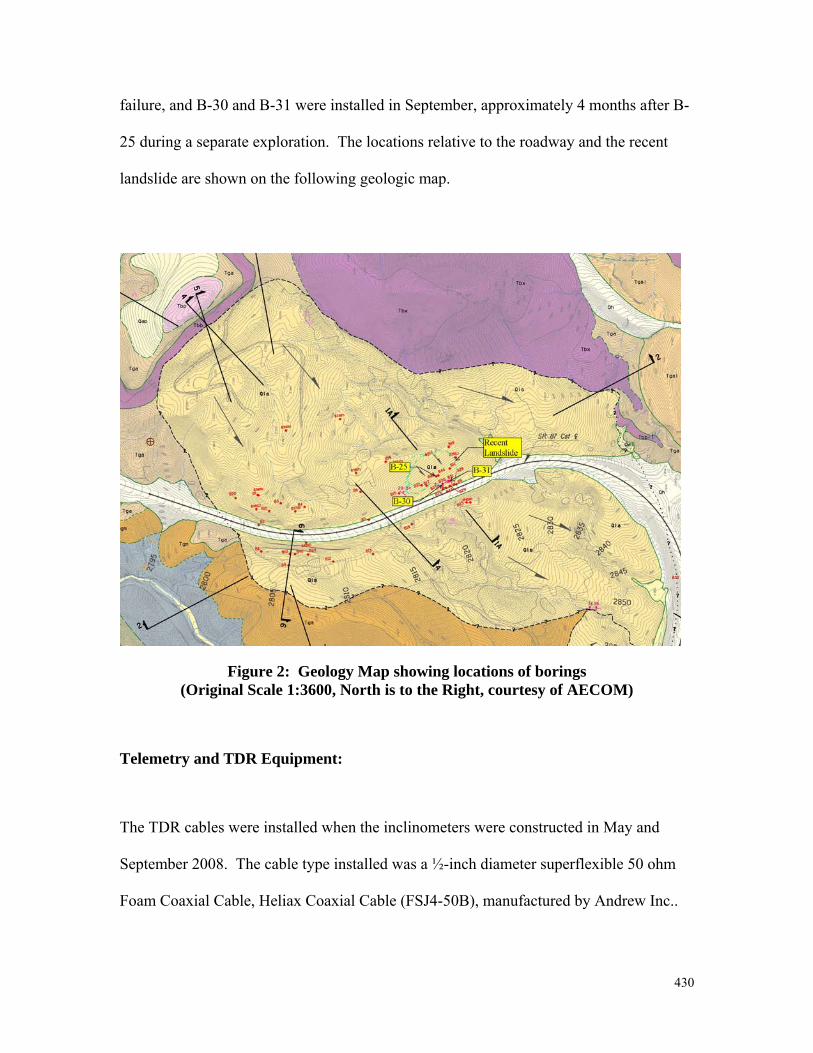
25 during a separate exploration. The locations relative to the roadway and the recent
landslide are shown on the following geologic map.
Figure 2: Geology Map showing locations of borings (Original Scale 1:3600, North is to the Right, courtesy of AECOM)
Telemetry and TDR Equipment:
The TDR cables were installed when the inclinometers were constructed in May and
September 2008. The cable type installed was a ½-inch diameter superflexible 50 ohm
Foam Coaxial Cable, Heliax Coaxial Cable (FSJ4-50B), manufactured by Andrew Inc..
431
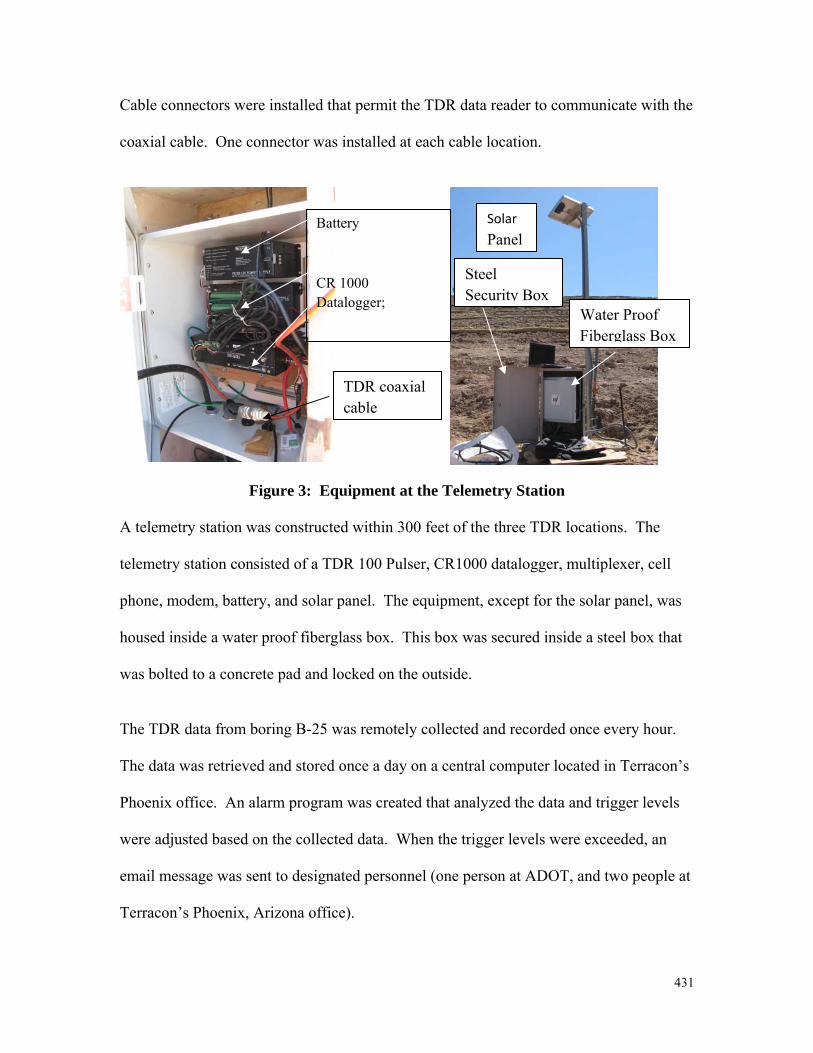
Cable connectors were installed that permit the TDR data reader to communicate with the
coaxial cable. One connector was installed at each cable location.
Figure 3: Equipment at the Telemetry Station A telemetry station was constructed within 300 feet of the three TDR locations. The
telemetry station consisted of a TDR 100 Pulser, CR1000 datalogger, multiplexer, cell
phone, modem, battery, and solar panel. The equipment, except for the solar panel, was
housed inside a water proof fiberglass box. This box was secured inside a steel box that
was bolted to a concrete pad and locked on the outside.
The TDR data from boring B-25 was remotely collected and recorded once every hour.
The data was retrieved and stored once a day on a central computer located in Terracon�’s
Phoenix office. An alarm program was created that analyzed the data and trigger levels
were adjusted based on the collected data. When the trigger levels were exceeded, an
email message was sent to designated personnel (one person at ADOT, and two people at
Terracon�’s Phoenix, Arizona office).
Battery
CR 1000 Datalogger;
TDR coaxial cable
Solar
Panel
Steel Security Box
Water Proof Fiberglass Box
432
In addition to the telemetry station, a manual TDR cable fault locator was used during the
monitoring program. The fault locator equipment used was a Riser Bond TDR model
1270A. This manual TDR was used to obtain the data for borings B-30 and B-31.
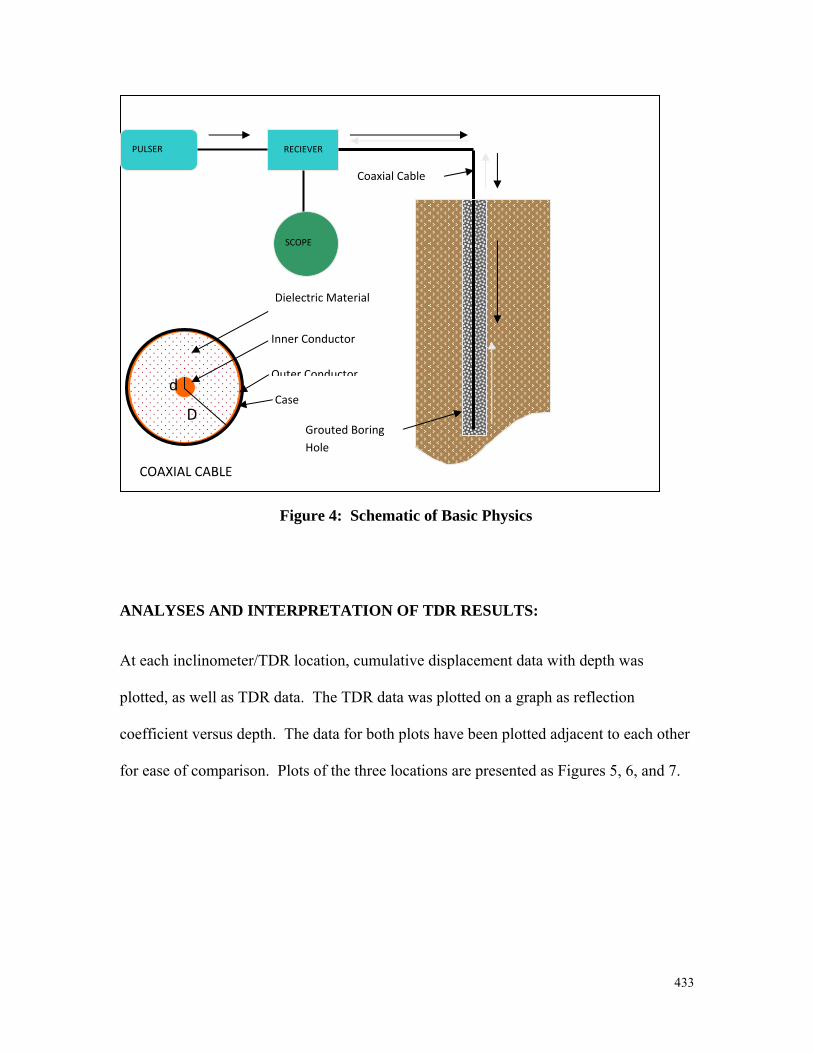
Technology of TDR: The TDR pulser generates an electric pulse that is propagated
down the coaxial cable. A receiver records a signal reflection. Many pulses are read
over time, which creates a scan that generates a waveform. The waveform shows the
variation of signal amplitude with time. The signal amplitude can be normalized in the
form of a reflection coefficient, which is a ratio of the signal amplitude sent down the
cable compared with the signal amplitude measured at the receiver. The time delay
between the pulse and the reflection, and the change in the signal amplitude (reflection
coefficient) uniquely determine a cable fault. The cable fault location is determined by a
relationship between the velocity of propagation of the signal, cable properties and time.
A schematic drawing showing the key elements of the TDR system is presented on
Figure 4.
433
Figure 4: Schematic of Basic Physics
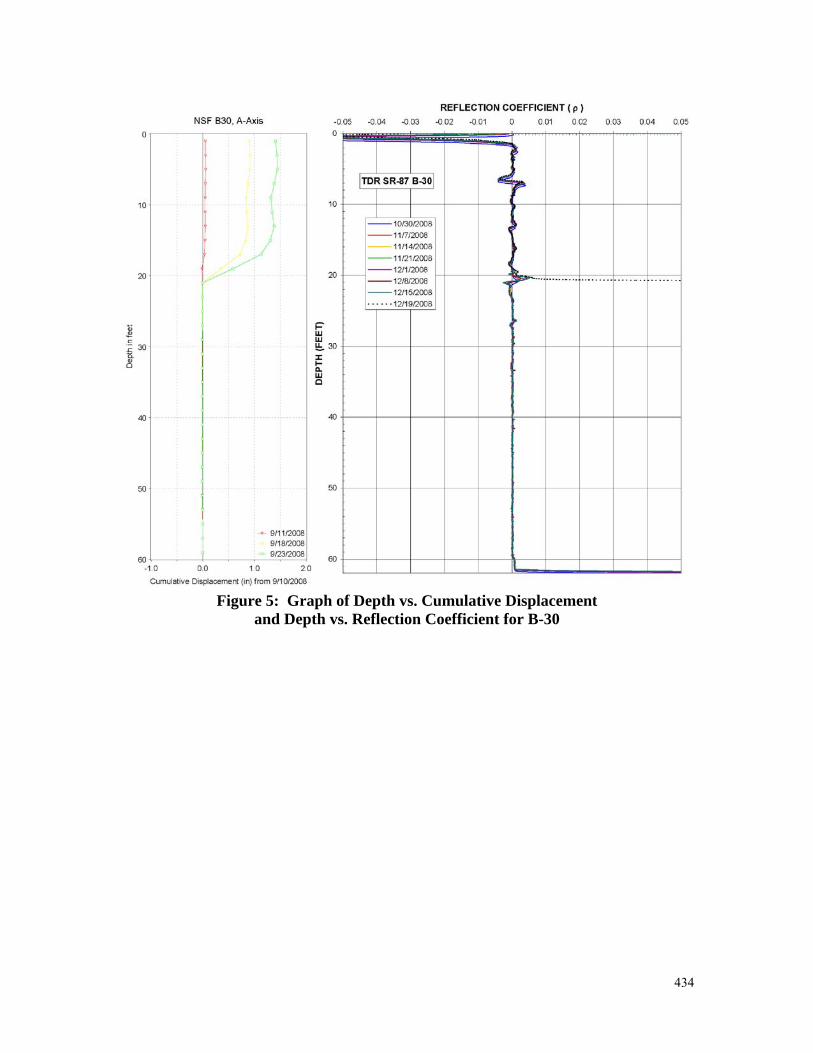
ANALYSES AND INTERPRETATION OF TDR RESULTS:
At each inclinometer/TDR location, cumulative displacement data with depth was
plotted, as well as TDR data. The TDR data was plotted on a graph as reflection
coefficient versus depth. The data for both plots have been plotted adjacent to each other
for ease of comparison. Plots of the three locations are presented as Figures 5, 6, and 7.
RECIEVERPULSER
SCOPE
Inner Conductor
Outer Conductor
Case
Dielectric Material
COAXIAL CABLE
d
DGrouted BoringHole
Coaxial Cable
434
Figure 5: Graph of Depth vs. Cumulative Displacement
and Depth vs. Reflection Coefficient for B-30
435
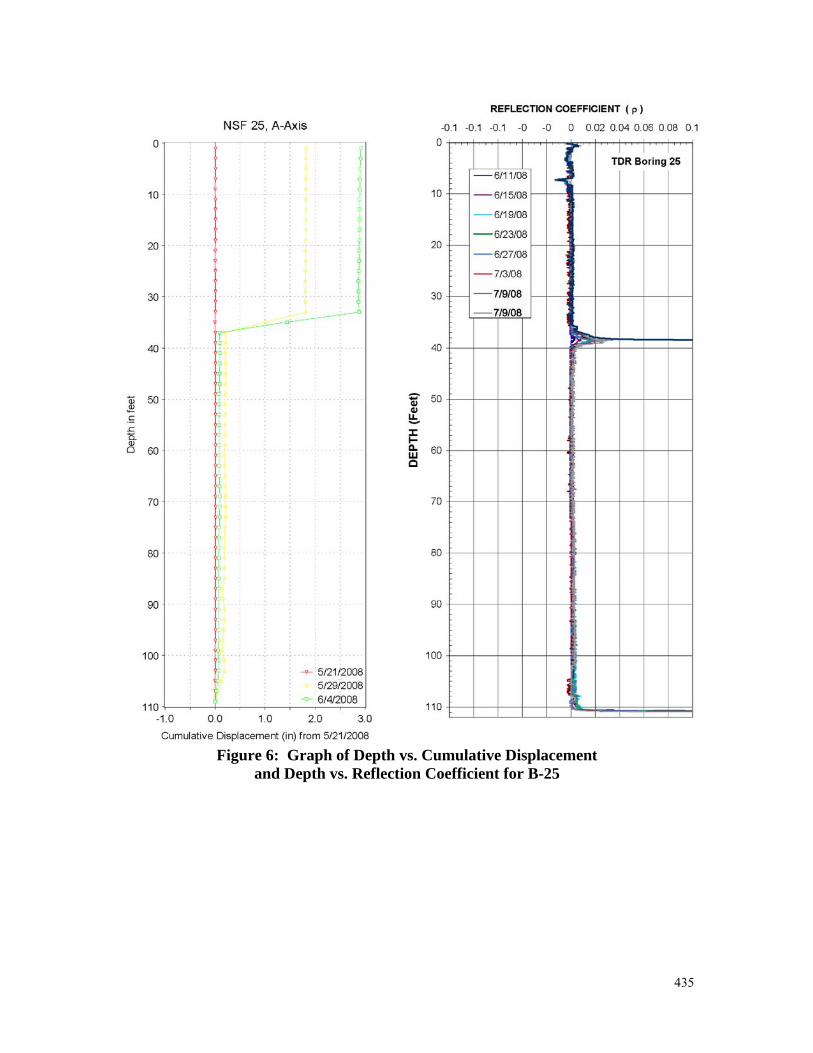
Figure 6: Graph of Depth vs. Cumulative Displacement
and Depth vs. Reflection Coefficient for B-25
436
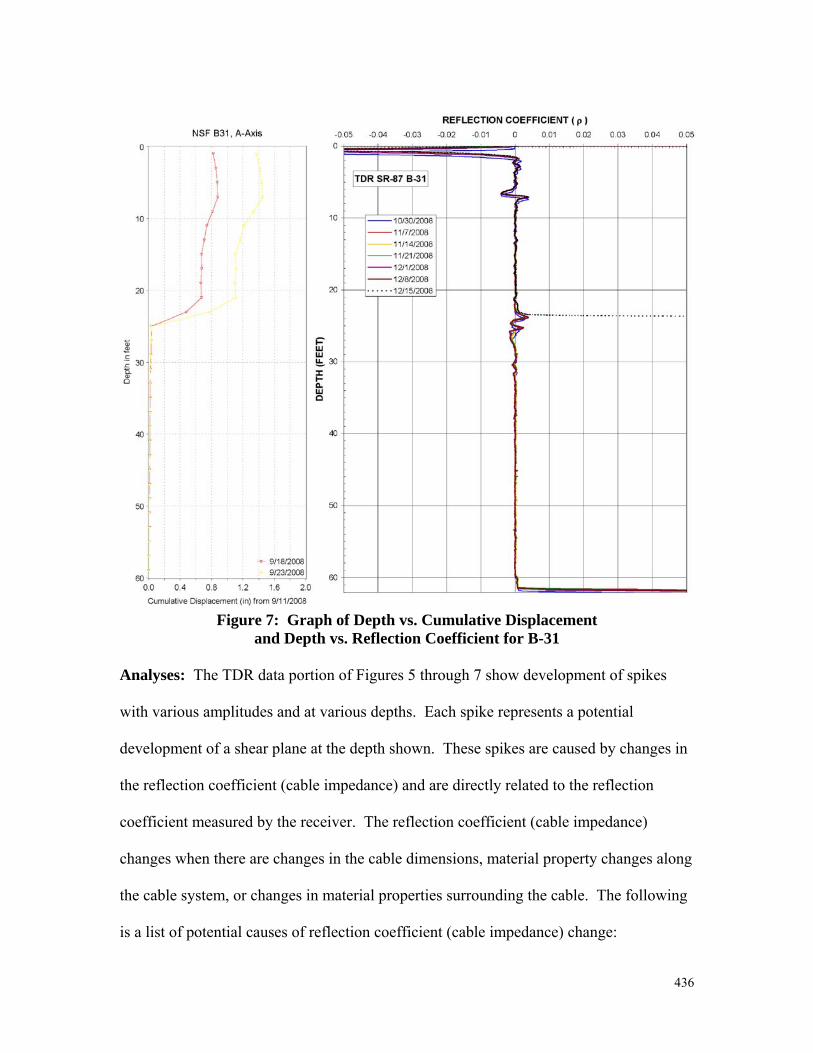
Figure 7: Graph of Depth vs. Cumulative Displacement
and Depth vs. Reflection Coefficient for B-31
Analyses: The TDR data portion of Figures 5 through 7 show development of spikes
with various amplitudes and at various depths. Each spike represents a potential
development of a shear plane at the depth shown. These spikes are caused by changes in
the reflection coefficient (cable impedance) and are directly related to the reflection
coefficient measured by the receiver. The reflection coefficient (cable impedance)
changes when there are changes in the cable dimensions, material property changes along
the cable system, or changes in material properties surrounding the cable. The following
is a list of potential causes of reflection coefficient (cable impedance) change:
437
Connection between the lead cable and the ½-inch cable (material
properties along the cable system),
Noise during data collection (material properties along the cable system or
surrounding materials),
Cable damage during installation (cable dimension change), and
Ground movement (cable dimension change).
The first spike observed on the graphs at the beginning of the plotted TDR data is caused
by the connection between the lead cable and the main cable, and is generally of high
amplitude. In general, subsequent spikes of low amplitude are caused by noise and minor
cable damage occurring during cable installation. The resulting spikes from these two
causes will not grow in amplitude with time. The fourth cause of spikes (i.e. ground
movement) will show an increase in amplitude with time as the ground continues to move
and subsequently reducing the cross sectional area of the coaxial cable. Spike amplitudes
caused by ground movement can increase up to a point where the cable is sheared or
pinched-off at the failure plane causing the ground movement.
Low and medium amplitude data caused by noise or dented cable can appear as a potential
shear plane and may lead to incorrect conclusions by inexperienced end users. Careful,
reproducible, methodology should be employed when collecting, downloading and
reducing the TDR data. Depth errors may be caused by changes in the signal velocity of
propagation in the cable, a change in cable reference, or interpretation error. It is important
when reading TDR data to have the correct cable depth and if possible reference marks.
438
The reference marks are used to calibrate the TDR readings with the known distance
between the marks. Usually the top of the TDR cable serves as the zero depth reference.
Data Interpretation: Based on the TDR data graphics, in each of the three locations, the
high amplitude spike at the beginning of each cable is caused by changes in reflection
coefficient (impedance) between the lead cable and the beginning of the ½-inch cable.
The high amplitude spike shown at the end of the cable indicates a very high degree of
reflection or near �“infinite�” impedance.
The data results for B-25 show various low amplitude (reflection coefficient, <0.004)
and high amplitude (reflection coefficient, 0.02) spikes along the cable. Similar low
and high amplitude spikes are observed on the graphs for B-30 and B-31.
At the B-25 TDR cable location, a high amplitude spike along the cable is shown on the
figure. The high amplitude spike at a depth of 38 feet is a shear plane along which
ground movement has occurred. This shear plane is in close agreement with the ground
movement depth recorded by the B-25 inclinometer (approximate depth of 32 to 36 feet).
The medium amplitude spike that occurs at a depth of approximately 7 feet, is assumed to
be an indication of cable deformation during installation of the TDR. Note that the
amplitude of this spike at 7 feet does not change with time.
Data Comparison: Figure No. 8 shows a graph of the cumulative displacement vs.
time, and the reflection coefficient vs. time for each inclinometer/TDR location. The
initial readings for B-25 and B-31 were removed to better define the slope of the line
defining the rate of change of the reflection coefficient for these two locations.
439
The following are observations and analyses of the graphed data.
The plot of cumulative displacement vs. time is linear for the three
inclinometers. The time is of such a short duration due to the amount of
movement occurring and the inability of the inclinometer to be used after
nearly 3 inches of displacement had occurred. There was a potential to not
retrieve the equipment below the shear plane depth if excessive
movement, beyond the 3-inch displacement, had developed.
The TDR reflection coefficient varies through time, but is generally linear.
Statistically, the coefficient of determination (R2) has values of 0.887,
0.978 and 0.998 indicating that representing the data as linear is
reasonable. Other published data (e.g. O�’Connor and Dowding, 1999)
concurs with this linear behavior.
The inclinometer data was obtained prior to acquiring of the initial TDR
data. Because of the excessive casing deformation as mentioned before,
the acquisition of inclinometer data ceased prior to collection of the initial
TDR data.
The rate of slope movement immediately after installation of the
inclinometers would appear to be constant based on the cumulative
displacement data. Based on this inclinometer data, one can conclude the
rate of movement of the active landslide is constant in the area where the
borings are located. Based on assuming a constant rate of slope
movement and the rate of change for the reflection coefficient with time is
also linear, the results strongly suggest the TDR could be used to

440
determine the total differential movement at the shear plane prior to
shearing of the TDR cable.
Based on the inclinometer data presented in Figure 8, the rate of slope
movement was constant over the small strains measured by the
inclinometers. The TDR reflection coefficient data indicates the rate of
slope movement/displacement continued to be constant. Measurement of
displacement using the TDR could be obtained for approximately 4 to 8
times greater displacements than were measured by the inclinometer.
TDR at B-25, B-30 and B-31
y = 0.0033x + 0.7R2 = 1
y = 0.0088x - 2.1279R2 = 0.9985
y = 0.0095x - 0.0011R2 = 1
y = 4E-05x - 0.0276R2 = 0.9783
y = 2E-06x + 0.0003R2 = 0.9297
y = 4E-06x - 0.004R2 = 0.887
0
0.005
0.01
0.015
0.02
0.025
0.03
0.035
0.04
0 500 1000 1500 2000 2500
TIME (h)
REF
LEC
TIO
N C
OEF
FIC
IEN
T (
)
-0.5
0
0.5
1
1.5
2
2.5
3
CU
MU
LATI
VE D
ISPL
AC
EMEN
T (in
)
TDR Data - B-25TDR Data - B-30TDR Data - B-31Inclinometer Data-B-31Inclinometer Data-B-30Inclinometer Data-B-25Linear (Inclinometer Data-B-31)Linear (Inclinometer Data-B-25)Linear (Inclinometer Data-B-30)Linear (TDR Data - B-25)Linear (TDR Data - B-31)Linear (TDR Data - B-30)
Figure 8: Graph of Cumulative Displacement vs. Time and Reflection Coefficient vs. Time for B-25, B-30 & B-31
441
Conclusions: Based on the results presented herein, the TDR reflection coefficient data
indicates the rate slope movement/displacement continued to be constant. Measurement
of displacement using the TDR could be obtained for approximately 4 to 8 times greater
displacements than were measured by the inclinometer. Therefore, the cost-benefit of the
borings can be prolonged by using a TDR system.
Based on this assumed constant rate and on the rate of change for the reflection
coefficient with time is also linear, the results strongly suggest the TDR can be used to
determine the rate of ground movement of the landslide at the TDR cable locations,
provided calibration curves are obtained for each location. More inclinometers installed
with TDR cables and simultaneous readings are needed to confirm the findings of this
paper.
The use of TDR at very small strains is not sensitive enough to accurately quantify the
amount of movement that is occurring. It is our opinion that this is due to the
inclinometer casing, which acts as a tensile member immediately adjacent to the TDR
cable.
Benefits of TDR monitoring:
The TDR cable is capable of undergoing much greater deformation than
an inclinometer, with a significantly reduced initial capital cost ($2.50/ft.
installed for the TDR cable vs. $21.00/ft. installed for inclinometer
casing). The potential loss of equipment is also removed since with the
TDR method there is no equipment down the hole except for the cable.
442
This is a cost savings of approximately $5,000 per inclinometer probe
should the probe be lost down the hole.
The TDR remote monitoring system is a reliable system to identify and
locate slope surface failure.
It is easy to set up the telemetry system up for continuous monitoring at
remote locations provided cell phone coverage is available. This allows
for a reliable alarm system if properly installed.
The telemetry system can also be used to monitor additional
instrumentation such as VWP, inclinometers, extensometers, etc. The
telemetry system will reduce numerous man hours in travel to and from
the site and allows for continuous monitoring.
Short Comings of TDR Technology/Monitoring:
The TDR requires calibration graphics, as shown on Figure 8, or historical
data development in order to provide quantitative data.
Requires careful analysis of data in order to identify and differentiate real
shear from cable noise.
The data is not distinctive with regard to direction of movement.
Initial cost is high for telemetry equipment.
Lesson Learned:
Grout strength and inclinometer casing can influence the deflection of the
coaxial cable at very small strains, and the reflected signal in the TDR
cable.
443
Uniform crimps equally spaced along the cable during the cable
installation assists immensely in determining the rate of wave propagation
along the cable.
REFERENCES
O�’Conner, Kevin M., Dowding, Charles H., 1999, �“GeoMeasurements by Pulsing TDR Cables and Probes.�“CRC Press, Boca Raton, Florida, pp. 15-22.