62 fortes
TRANSCRIPT
8/12/2019 62 Fortes
http://slidepdf.com/reader/full/62-fortes 1/14
Fortes, Correia
1
OVERVIEW OF MAJOR BRAZILIAN AIR
CARGO TERMINALS
João Luiz de Castro Fortes
Anderson Ribeiro Correia
Aeronautics Institute of Technology - ITA
Pca. Mal. do Ar Eduardo Gomes, 50
São José dos Campos – SP – Brazil
Phone/Fax: +55 12 3947 6837
ABSTRACT
This paper brings up an overview of the four largest Brazilian air cargo terminals: São Paulo,Campinas, Manaus, and Rio de Janeiro International Airport, which processes more than 60 % of aircargo operations in Brazil. The analysis is done through three aspects: (1) an analysis of their currentcargo processing capacity, (2) the current and growing demand scenario, (3) and the possibleimprovement alternatives. The methodology used to estimate the cargo capacity was developed byINFRAERO (federal company that manages the 67 major Brazilian airports). Data has been collectedin these four airports in order to apply this methodology, including: dimensions and layout of terminal
components, degree of mechanization, duration of storage, mix and flow characteristics of cargo, andgeneral procedures. Current cargo volumes were obtained in order to evaluate the utilization of theseterminals. In addition to that, official demand forecasts have been collected in order to evaluatenecessary investments, if necessary. Finally, several improvement alternatives were proposed toaccommodate future cargo demand at these air cargo terminals. These alternatives range from changesin lay-out, processes and procedures, to investments in new terminal areas. The results indicate thatsignificant capacity can be added to these terminals, with little money spending; in this case, currentand short term demand might be accommodated in these terminals. For future demand, however, long-term new investments will be necessary, especially for São Paulo and Viracopos Airport.
Keywords: Air Cargo Terminal, Capacity, Demand Forecast
INTRODUCTION
In order to prevent unnecessary and undesirable interference between surface access passenger traffic
and land side freight movements, cargo operations are ideally well separated from the passenger
terminal area. Therefore, even the frequent air traveller tends to regard the passenger terminal as the
hub of all important comings and goings in the daily activities of the airport. The airport designer,
however, cannot overlook air cargo, for this is an important and steadily increasing area of civil
aviation (Ashford and Wright, 1992).
Traditionally, the air transport had its commercial value associated with the transport of passengers,while the other modes of transport used by humans, since animal traction vehicles to road vehicles, rail
8/12/2019 62 Fortes
http://slidepdf.com/reader/full/62-fortes 2/14
Fortes, Correia
2
and maritime transport have always been in charge of its largest generation wealth. The air freight
continued as a byproduct of the passenger transport until the mid-1970s, when it came to be seen as an
independent business and profit-oriented (Chen and Chou, 2006). Nowadays, the value that combines
the speed of the aircraft that can carry the load draws more and more sectors of the economy. Trade in
high technology products, innovations with high value-added products with high density value,
express delivery and perishable items are typical of the current air cargo (Tozi et. al., 2009).
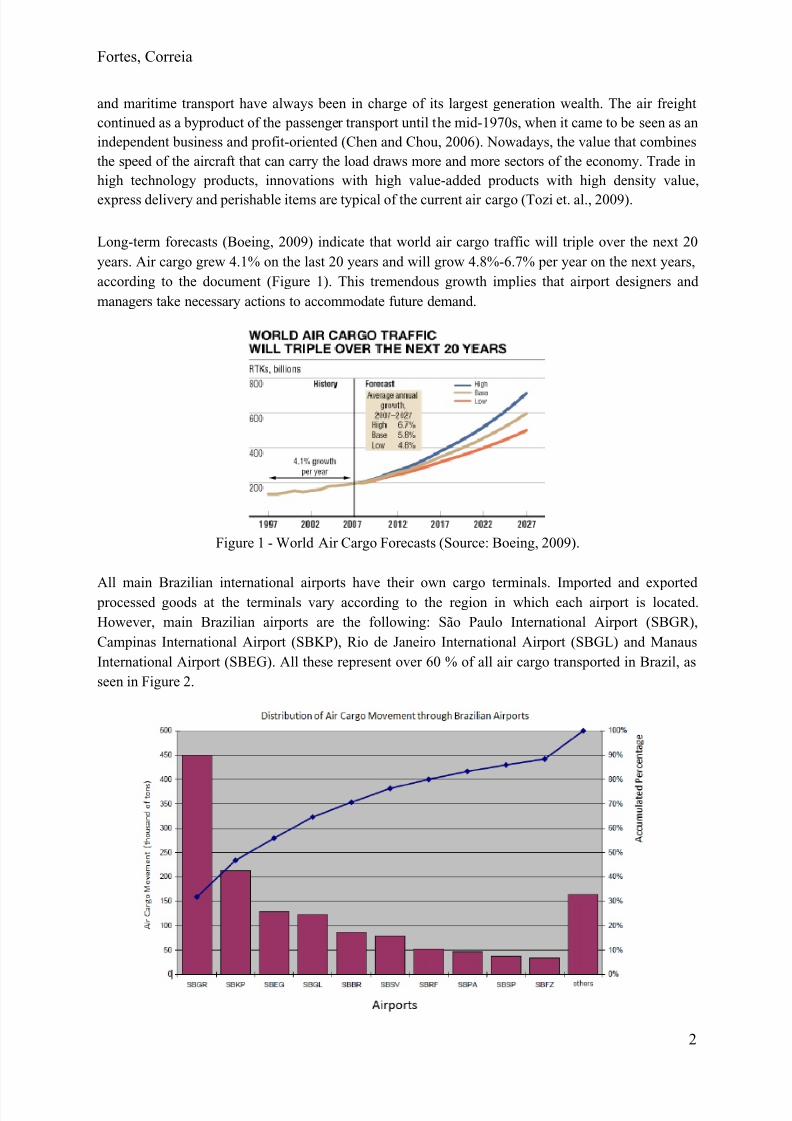
Long-term forecasts (Boeing, 2009) indicate that world air cargo traffic will triple over the next 20
years. Air cargo grew 4.1% on the last 20 years and will grow 4.8%-6.7% per year on the next years,
according to the document (Figure 1). This tremendous growth implies that airport designers and
managers take necessary actions to accommodate future demand.
Figure 1 - World Air Cargo Forecasts (Source: Boeing, 2009).
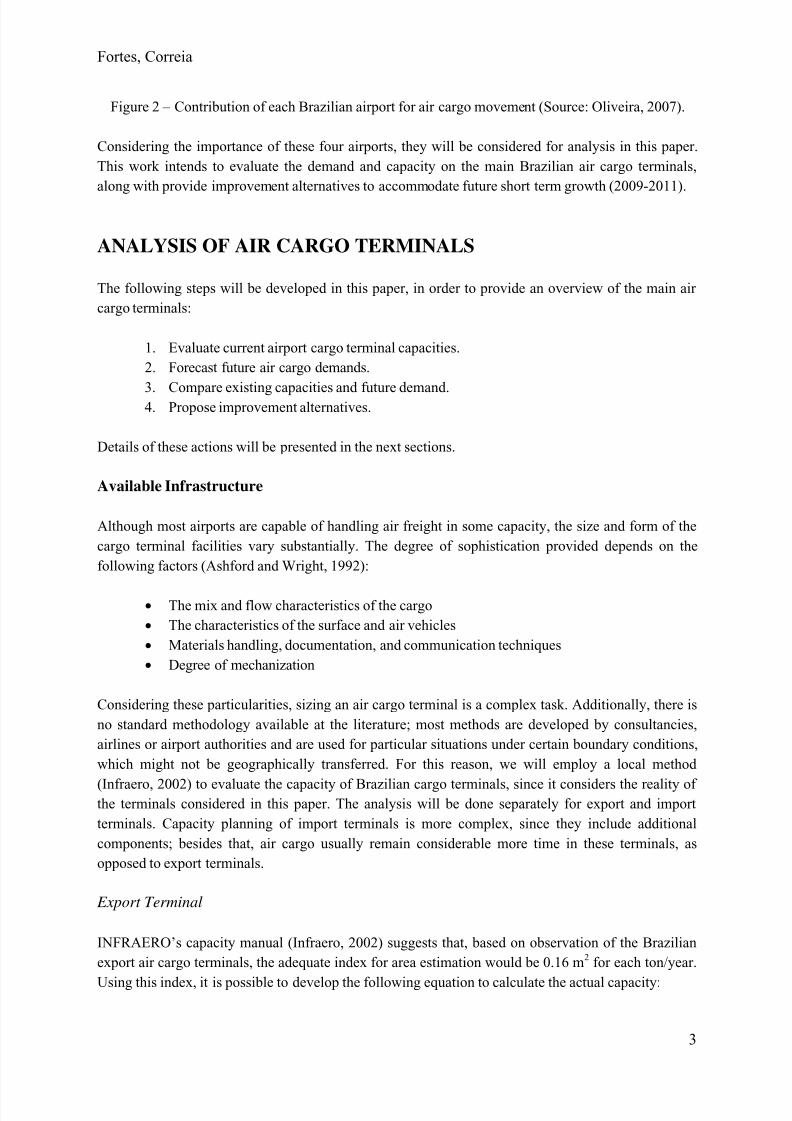
All main Brazilian international airports have their own cargo terminals. Imported and exported processed goods at the terminals vary according to the region in which each airport is located.
However, main Brazilian airports are the following: São Paulo International Airport (SBGR),
Campinas International Airport (SBKP), Rio de Janeiro International Airport (SBGL) and Manaus
International Airport (SBEG). All these represent over 60 % of all air cargo transported in Brazil, as
seen in Figure 2.
8/12/2019 62 Fortes
http://slidepdf.com/reader/full/62-fortes 3/14
Fortes, Correia
3
Figure 2 – Contribution of each Brazilian airport for air cargo movement (Source: Oliveira, 2007).
Considering the importance of these four airports, they will be considered for analysis in this paper.
This work intends to evaluate the demand and capacity on the main Brazilian air cargo terminals,
along with provide improvement alternatives to accommodate future short term growth (2009-2011).
ANALYSIS OF AIR CARGO TERMINALS
The following steps will be developed in this paper, in order to provide an overview of the main air
cargo terminals:
1. Evaluate current airport cargo terminal capacities.
2. Forecast future air cargo demands.
3.
Compare existing capacities and future demand.4. Propose improvement alternatives.
Details of these actions will be presented in the next sections.
Available Infrastructure
Although most airports are capable of handling air freight in some capacity, the size and form of the
cargo terminal facilities vary substantially. The degree of sophistication provided depends on the
following factors (Ashford and Wright, 1992):
• The mix and flow characteristics of the cargo
• The characteristics of the surface and air vehicles
• Materials handling, documentation, and communication techniques
• Degree of mechanization
Considering these particularities, sizing an air cargo terminal is a complex task. Additionally, there is
no standard methodology available at the literature; most methods are developed by consultancies,
airlines or airport authorities and are used for particular situations under certain boundary conditions,
which might not be geographically transferred. For this reason, we will employ a local method
(Infraero, 2002) to evaluate the capacity of Brazilian cargo terminals, since it considers the reality ofthe terminals considered in this paper. The analysis will be done separately for export and import
terminals. Capacity planning of import terminals is more complex, since they include additional
components; besides that, air cargo usually remain considerable more time in these terminals, as
opposed to export terminals.
Export Terminal
INFRAERO’s capacity manual (Infraero, 2002) suggests that, based on observation of the Brazilian
export air cargo terminals, the adequate index for area estimation would be 0.16 m2 for each ton/year.
Using this index, it is possible to develop the following equation to calculate the actual capacity:

8/12/2019 62 Fortes
http://slidepdf.com/reader/full/62-fortes 4/14
Fortes, Correia
4
(1)
Where,
Cexp is the actual capacity calculated;
Aav is the available area for air cargo storage;
iexp is the index provided by the capacity manual (0.16 m2 for each ton/year).
Import Terminal
INFRAERO’s capacity manual (Infraero, 2002) proposed the following equation:
(2)
Where,
Cimp is the capacity for the import terminal;
a is the index which varies according to the level of mechanization of the terminal – 0.04 ton/m3
without transelevator and 0.06 ton/m3 with transelevator;
h is the average storage in the warehouse;
A is the available area in the warehouse for storage;
t is storage time;
i is the percentage of the terminal used for unclaimed cargo.
Although the percentage of terminal used for unclaimed cargo is not counted directly into the formula,
it impacts directly in the capacity because it represents how much of the warehouse is being used for
storage of this kind of cargo. This means that high values of i would decrease the value of A, affecting
capacity.
Cargo Movement Data and Terminal Characteristics
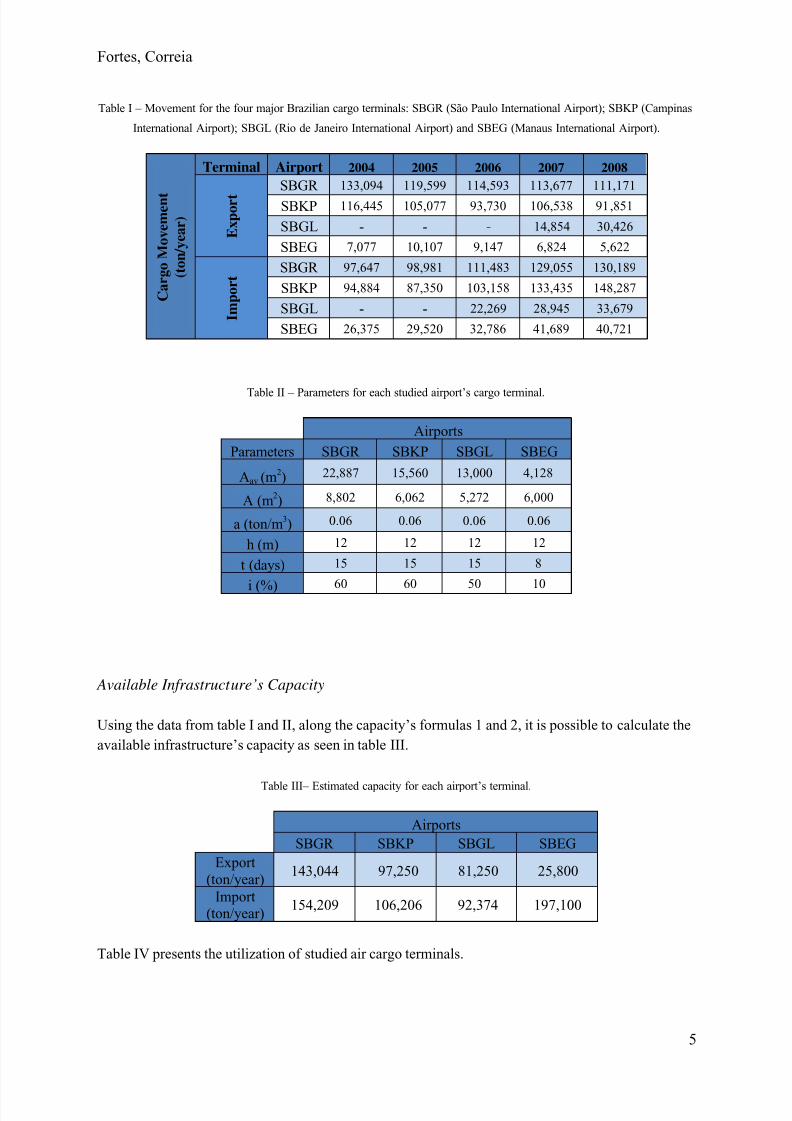
Cargo movements have been collected for the airports of study and are presented in Table I. As it can
be seen, the data for Rio de Janeiro International Airport was restricted for 2007 and 2008 since export
operations has begun only on middle 2007. For that airport, 2004 and 2005 data for import movement
was not available as well.
8/12/2019 62 Fortes
http://slidepdf.com/reader/full/62-fortes 5/14
Fortes, Correia
5
Table I – Movement for the four major Brazilian cargo terminals: SBGR (São Paulo International Airport); SBKP (Campinas
International Airport); SBGL (Rio de Janeiro International Airport) and SBEG (Manaus International Airport).
C a r g o M o v e m e n t
( t o n / y e a r )
Terminal Airport 2004 2005 2006 2007 2008
E x p o r t
SBGR 133,094 119,599 114,593 113,677 111,171
SBKP 116,445 105,077 93,730 106,538 91,851
SBGL - - - 14,854 30,426
SBEG 7,077 10,107 9,147 6,824 5,622
I m p o r t
SBGR 97,647 98,981 111,483 129,055 130,189
SBKP 94,884 87,350 103,158 133,435 148,287
SBGL - - 22,269 28,945 33,679
SBEG 26,375 29,520 32,786 41,689 40,721
Table II – Parameters for each studied airport’s cargo terminal.
Airports
Parameters SBGR SBKP SBGL SBEG
Aav (m2) 22,887 15,560 13,000 4,128
A (m2) 8,802 6,062 5,272 6,000
a (ton/m3) 0.06 0.06 0.06 0.06
h (m) 12 12 12 12
t (days) 15 15 15 8
i (%) 60 60 50 10
Available Infrastructure’s Capacity
Using the data from table I and II, along the capacity’s formulas 1 and 2, it is possible to calculate the
available infrastructure’s capacity as seen in table III.
Table III– Estimated capacity for each airport’s terminal.
Airports
SBGR SBKP SBGL SBEG
Export
(ton/year)143,044 97,250 81,250 25,800
Import(ton/year)
154,209 106,206 92,374 197,100
Table IV presents the utilization of studied air cargo terminals.
8/12/2019 62 Fortes
http://slidepdf.com/reader/full/62-fortes 6/14
Fortes, Correia
6
Table IV – Utilization factor along last years for each airport.
U t i l i z a t i o n f a c t o r ( % )
Terminal Airport 2004 2005 2006 2007 2008
E x p o r t
SBGR 93% 84% 80% 79% 78%
SBKP 120% 108% 96% 110% 94%
SBGL - - - 18% 37%
SBEG 27% 39% 35% 26% 22%
I m p o r t SBGR 63% 64% 72% 84% 84%
SBKP 89% 82% 97% 126% 140%
SBGL - - 24% 31% 36%
SBEG 13% 15% 17% 21% 21%
The high level of utilization factor for both SBGR and SBKP are justified by the fact that these two
airports are the ones which are closer to the Brazilian largest industrial area, São Paulo, and most of all
air freight in Brazil goes through them. Also, these two airports work as hub for air cargo, receiving
cargo from others airports’ terminals, since some flights to another countries only departure from
there.
Demand Forecasts
The air freight movements is, like any economical activity, strongly impacted by external factors such
as the country’s Gross Internal Product growth, international economic crisis, import and export
industry activity, etc. Estimating the demand growth is not always a simple task since there are several
variables involved in the process. Therefore, due to the lack of a longer time series for air freight
movement (only 5 years were available), it was made an estimative for growth for the next 3 years (up
to 2011). This way, the many variables which impact it are less likely to change significantly, yielding
a more reliable forecast.
There are several demand forecast methods available at the literature, including the following: delphi,
regression analysis, econometric models, and time-series analysis. Due to its simplicity and usefulness,
time series will be employed in this paper. The time series analysis combines the variations of
demand, as follows (Ballou, 2003):
F = T x S x C x R (3)
Where
F = forecasted demand
T = trend level

8/12/2019 62 Fortes
http://slidepdf.com/reader/full/62-fortes 7/14
Fortes, Correia
7
S = seasonality index
C = cyclical index
R = residual index
Cyclical and residual index is considered as 1.00 in this paper. Most probably, the cyclical index
would not impact a short term forecast, like the one developed in this paper. Trend levels are evaluated
as follows:
T = a + b t (4)
Where
T = time in years
and
∑
∑
−
−=
22
)()()(
t N t
t D N t Db
t
(5)
t b Da −= (6)
where
N = number of observations used for development of trend level Dt = current demand in time t
D = average demand in N periods of time
t = average of t throughout N periods of time.
Seasonality will not be considered in our model, since we are using yearly data. Additionally, air cargo
seasonality of demand usually occurs within a year period.
In order to build the time series forecast, we used the LOGWARE software, which is a free software
used by logistics students around the world. The input for each forecast are similar for all airports: it
was used the air cargo demand data inside table I, the number of years to be forecasted, the number of periods which will used to compute the error (for all cases it was used to series) and the number of
periods used to model initialization (in this case it was 2 periods). Due to scarcity of data, it was not
possible to do a reliable forecast for Rio de Janeiro International Airport.
São Paulo International Airport
According to Figure 3, the trend for export demand in SBGR is decreasing for the next years. The
decreasing of export for the last years can be explained by the fact that Brazilian currency has been
increasing over the U.S. dollar. That is, Brazilian products are being less competitive for international
trade. Table V presents the forecasted values for the next 3 years. For this series estimation, the values

8/12/2019 62 Fortes
http://slidepdf.com/reader/full/62-fortes 8/14
Fortes, Correia
8
of mean absolute deviation (MAD) and root mean square error (RMSE) are respectively 3,190.22
ton/year and 3,268.16 ton/year.
Figure 2 – Time Series Forecast for export demand in SBGR.
Table V – Demand Forecasted for export in SBGR.
Year 2009 2010 2011
Forecasted Demand(ton/year)
106,070 100,970 95,870
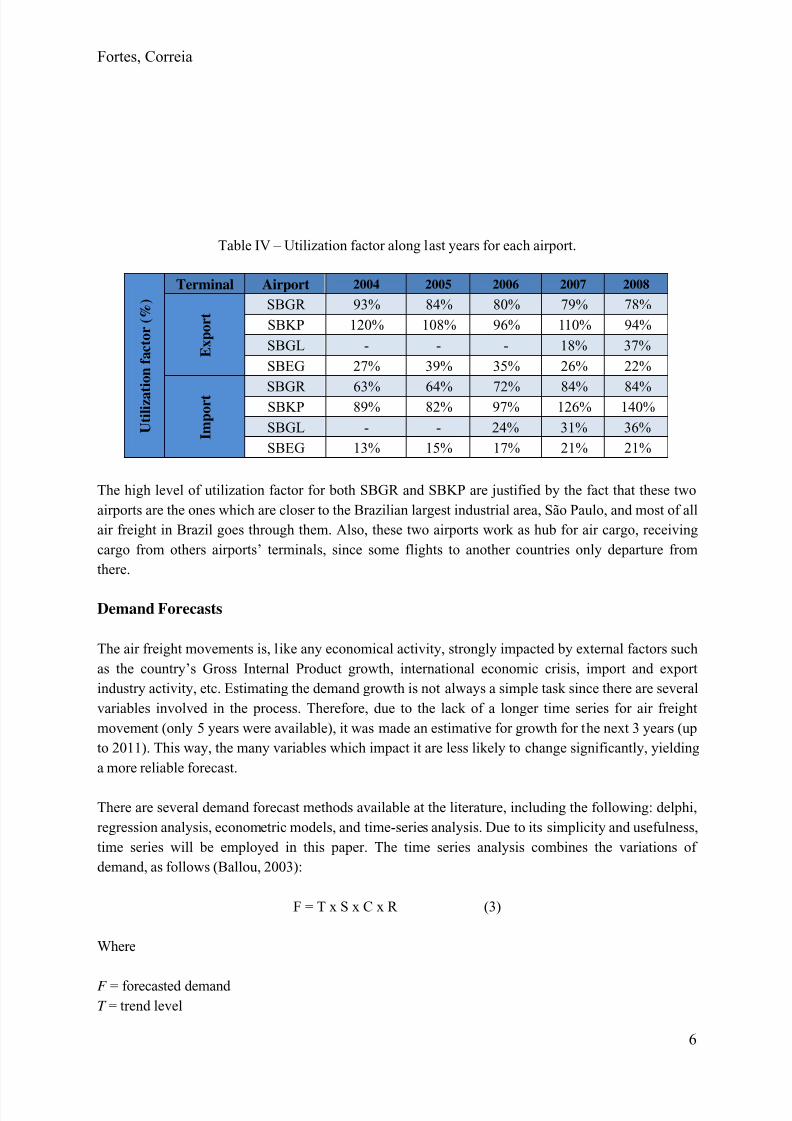
As it can be seen in Figure 4, on the other hand, the trend for import demand in SBGR is increasing
for the next years. The increasing of import can be explained by the same reason of decreasing in
import. The Brazilian currency increasing its value compared to the U.S. dollar has the opposite effect
for importation. International products get cheaper in Brazilian internal market due to this fact, turning
them more attractive than national products. Besides that, the Brazilian economy has been increasing
on the last years, except by 2009, which was affected by the global crisis. Table VI brings the values
forecasted for the next 3 years. For this series estimation, the values of MAD and RMSE are
respectively 8,537.11 ton/year and 8,542.89 ton/year.
8/12/2019 62 Fortes
http://slidepdf.com/reader/full/62-fortes 9/14
Fortes, Correia
9
Figure 3 – Time Series Forecast for import demand in SBGR.
Table VI – Demand Forecasted for import in SBGR.
Year 2009 2010 2011
Forecasted Demand(ton/year)
139,539 148,888 158,238
Campinas International Airport
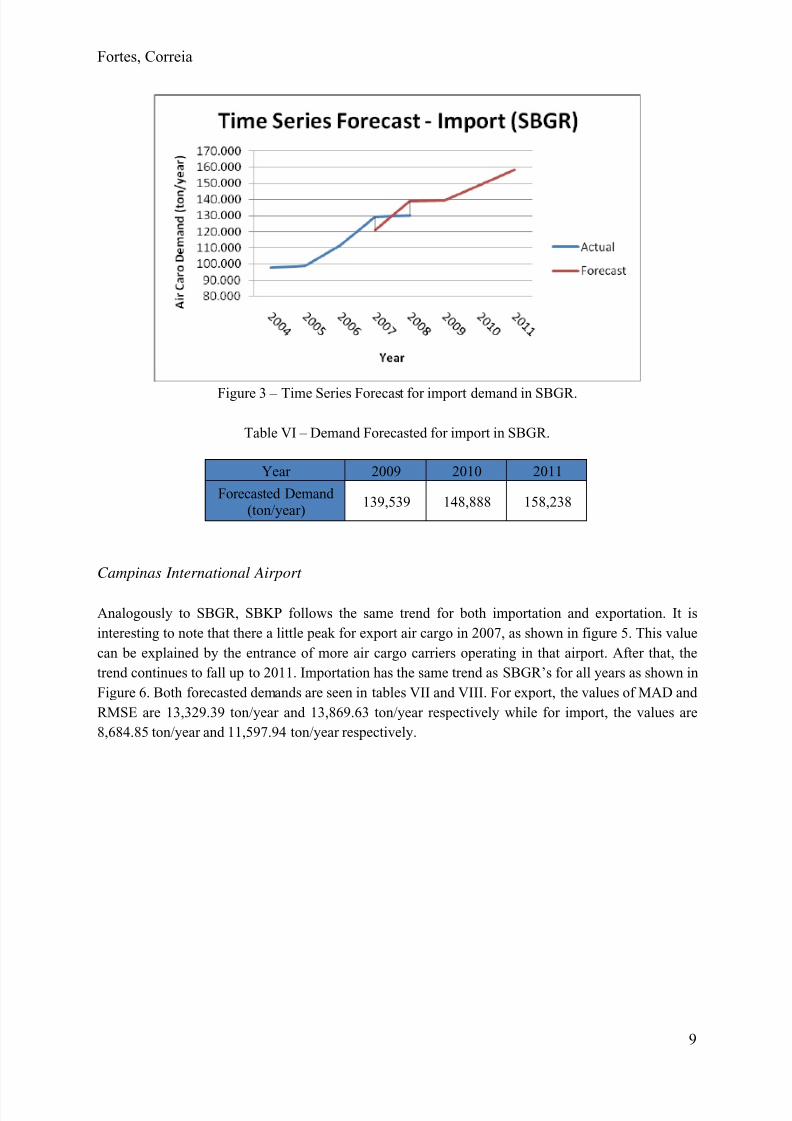
Analogously to SBGR, SBKP follows the same trend for both importation and exportation. It is
interesting to note that there a little peak for export air cargo in 2007, as shown in figure 5. This value
can be explained by the entrance of more air cargo carriers operating in that airport. After that, the
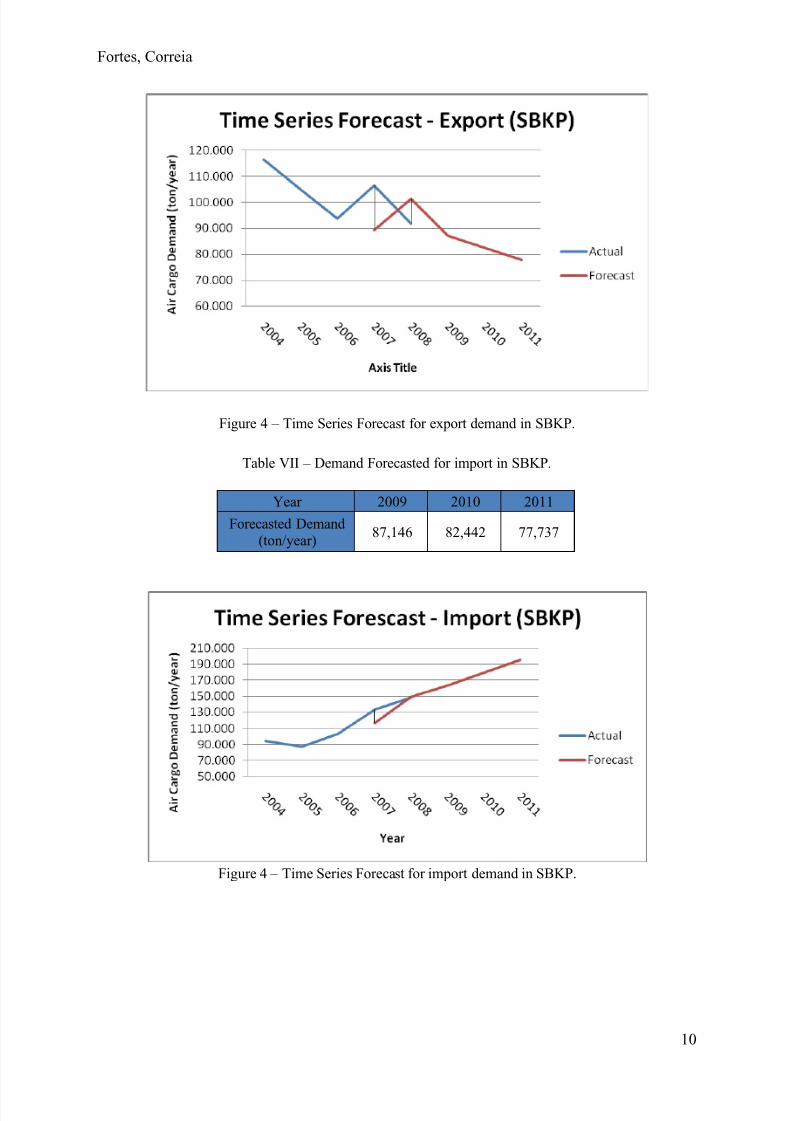
trend continues to fall up to 2011. Importation has the same trend as SBGR’s for all years as shown in
Figure 6. Both forecasted demands are seen in tables VII and VIII. For export, the values of MAD and
RMSE are 13,329.39 ton/year and 13,869.63 ton/year respectively while for import, the values are
8,684.85 ton/year and 11,597.94 ton/year respectively.
8/12/2019 62 Fortes
http://slidepdf.com/reader/full/62-fortes 10/14
Fortes, Correia
10
Figure 4 – Time Series Forecast for export demand in SBKP.
Table VII – Demand Forecasted for import in SBKP.
Year 2009 2010 2011
Forecasted Demand(ton/year)
87,146 82,442 77,737
Figure 4 – Time Series Forecast for import demand in SBKP.
8/12/2019 62 Fortes
http://slidepdf.com/reader/full/62-fortes 11/14
Fortes, Correia
11
Table VIII – Demand Forecasted for import in SBKP.
Year 2009 2010 2011
Forecasted Demand(ton/year)
164,031 179,775 195,519
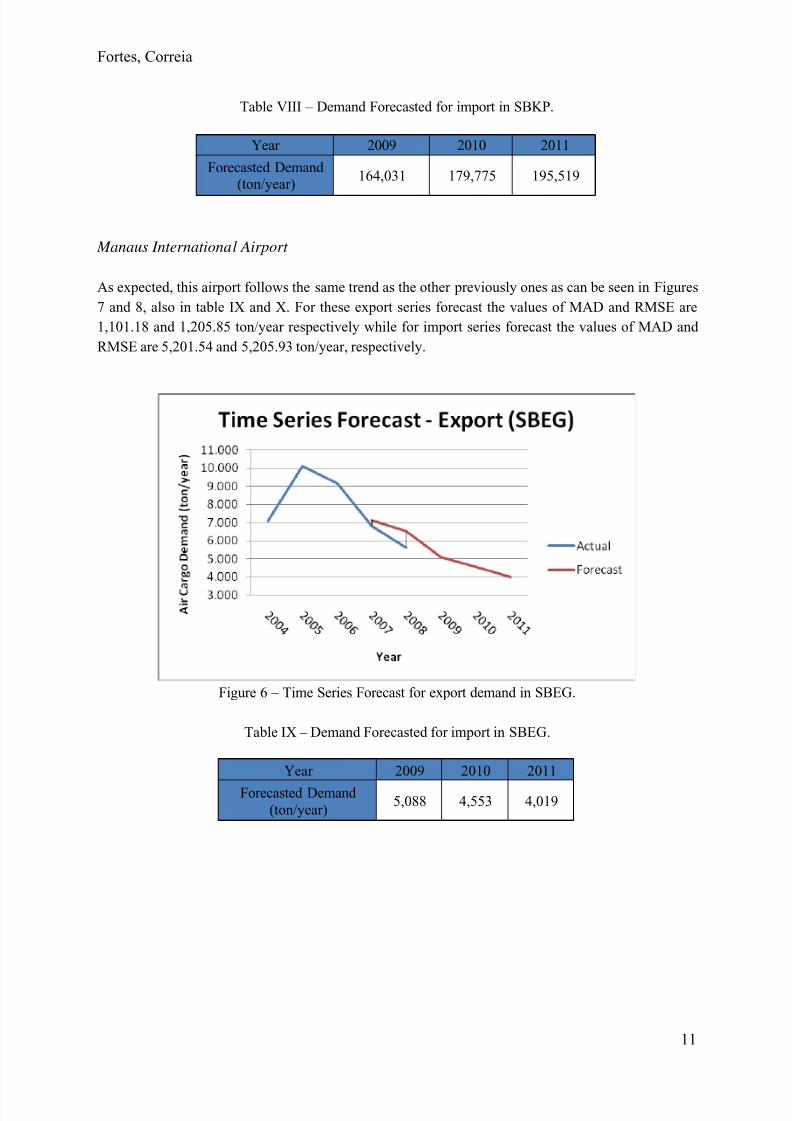
Manaus International Airport
As expected, this airport follows the same trend as the other previously ones as can be seen in Figures
7 and 8, also in table IX and X. For these export series forecast the values of MAD and RMSE are
1,101.18 and 1,205.85 ton/year respectively while for import series forecast the values of MAD and
RMSE are 5,201.54 and 5,205.93 ton/year, respectively.
Figure 6 – Time Series Forecast for export demand in SBEG.
Table IX – Demand Forecasted for import in SBEG.
Year 2009 2010 2011
Forecasted Demand
(ton/year)5,088 4,553 4,019

8/12/2019 62 Fortes
http://slidepdf.com/reader/full/62-fortes 12/14
Fortes, Correia
12
Figure 7 – Time Series Forecast for import demand in SBEG.
Table X – Demand Forecasted for export in SBEG.
Year 2009 2010 2011
Forecasted Demand(ton/year)
44,646 48,571 52,496
Demand/Capacity Analysis
Table XI presents the utilization index (demand/capacity) of the three studied airports.
Table XI – Utilization factor for each forecasted demand.
Airport 2009 2010 2011
U t i l i z a t i o n F a c t o r ( % )
E x p o r t SBGR 74% 71% 67%
SBKP 90% 85% 80%
SBEG 20% 18% 16%
I m
p o r t SBGR 90% 97% 103%
SBKP 154% 169% 184%
SBEG 23% 25% 27%
As it was expected, the utilization factors for export terminals are getting lower as years pass by. Since
the time series forecast showed a decreasing trend for exportation, these results seems more than
obvious. Table IV showed that both the most critical airports are SBGR and SBKP, which are close to
saturation degree. However, as forecasted demand showed, these two terminals will take advantage of
demand reduction in the years to reduce their utilization factor.
On the other hand, the condition for import terminals seems quite critical for the next years. Both for
SBGR and SBKP, the utilizations factors show that the available capacity will not be enough to absorb
the growing demand. For SBKP, the necessary capacity in 2011 will be almost twice bigger than

8/12/2019 62 Fortes
http://slidepdf.com/reader/full/62-fortes 13/14

8/12/2019 62 Fortes
http://slidepdf.com/reader/full/62-fortes 14/14
Fortes, Correia
14
REFERENCES
Ashford, N & Wright (1992). Airport Engineering. 3rd
. Edition, John-Wiley & Sons Inc., New York.
Ballou, R. (2003). Business Logistics: Supply Chain Management . Prentice Hall, 5th. Edition.
Boeing (2009). World Air Cargo Forecast. www.boeing.com/commercial/cargo/01_06.htm
Chen, C.H. and Chou, S. Y. (2006) Framework for Air Cargo Terminal Design: Procedure and CaseStudy. Journal of Industrial Technology, v. 22, No. 1.
INFRAERO. (2002). Handbook of Criteria and Conditions for Airport Plannning – “Manual de
Critérios e Condicionantes de Planejamento Aeroportuário”. Internal Publication.
Oliveira, D. S. (2007). Operational Performance Study of Brazilian Airport Cargo Terminals -
“Estudo do Desempenho Operacional dos Aeroportos Brasileiros relativo ao Movimento de
Cargas”. Aeronautics Institute of Technology, Msc Thesis.
Tozi, L. A., Correia, A. R., Müller, C. and Mendes, D. S. (2009). Verification of Determinant Factorsof Decision for Customers of Air Cargo Terminals. Journal of the Brazilian Air
Transportation Research Society, v. 5, No. 1, pp. 1-24 (In-press).