62 ieee transactions on learning technologies, vol. 5, no. 1
TRANSCRIPT

The Journal of Applied Business Research – Spring 2005 Volume 21, Number 2
113
Using Cash-To-Cash To Benchmark
Service Industry Performance M. Theodore Farris II, (E-mail: [email protected]), University of North Texas
Paul D. Hutchison, (E-mail: [email protected]), University Of North Texas
Ronald W. Hasty, (E-mail: [email protected]), University Of North Texas
ABSTRACT
The cash-to-cash (C2C) metric is a measurement tool which may be used to bridge the management
of firms and functions in a supply chain. C2C can be used by management to improve firm liquidity
position and overall firm value. Measuring C2C also offers a consistent measure across time, helps
to identify the greatest leverage points and opportunities for improvement, serves as a means to set
goals for improvement within the supply chain, and can help to optimize the entire supply chain,
instead of sub-optimizing individual portions. In this study, the authors illustrate the calculation of
cash-to-cash, investigate changes in C2C between product and service industries to identify key
differences, review and discuss key leverage points of C2C, and provide insights for today’s service
industry managers to understand the C2C metric from both accounting and supply chain
management perspectives. Data in this study can also be used for benchmarking purposes.
INTRODUCTION
he purpose of this study is to expand previous research on cash-to-cash (C2C) by examining direct
comparisons of the metric for companies in the product and service industries and providing additional
insights about C2C specific to service industries. As management of the supply chain continues to
evolve, the cash-to-cash metric is one of the currently available measurement tools to transform the relationships
between firms and functions of the supply chain into a value chain by helping to synergistically optimize the entire
process through a systems approach. C2C can be easily calculated and provides the difference based on days from
when suppliers are paid and payment is received from customers. Further, cash-to-cash analysis can be used to
compare companies and industries by common traits.
Over the years, there have been several research studies that have examined C2C and its utilization by firms.
Beed (1981) suggests using the metric to spot inventory and accounts receivables problems. Byers et al. (1997)
support using cash-to-cash to manage operating assets. Phillips (1999) cites cash-to-cash as an important key
performance indicator. Farris and Hutchison (2002) propose opportunities for extending cash-to-cash as a benchmark
for supply chain management. Luc (1993), Ward (2004) and Skomorowsky (1988) link cash-to-cash to profitability,
earnings, and net income, respectively. Farris and Hutchison (2003), also Hutchison and Farris (2003), compare cash-
to-cash performance for benchmarking purposes for 5,884 companies across 31 industries. They also identify clear
industry-wide changes within a petroleum supply chain (Hutchison and Farris, 2004).
The organization of this paper includes an overview of the C2C concept, discussion of the metric’s
importance, and a review of the C2C calculation. Additionally, C2C comparisons between service and product
industries, service industry performance and characteristics, managing C2C key leverage points, using C2C to help
optimize the supply chain, limitations of the study, future research questions, and conclusions and managerial
implications are presented. The authors encourage the reader to look beyond using the metric as an internal measure
and embrace the opportunity to extend the metric to help optimize the entire system.
T

The Journal of Applied Business Research – Spring 2005 Volume 21, Number 2
114
OVERVIEW OF C2C CONCEPT
Cash-to-cash or cash conversion cycle is a composite metric that has been described as “the average days
required to turn a dollar invested in raw material into a dollar collected from a customer” (Stewart 1995). The process
for calculating cash-to-cash requires adding days of inventory plus days of accounts receivable and subtracting days of
accounts payable. Therefore, C2C bridges material activities with suppliers, production operations, distribution
functions, and outbound sales activities. Todd Ackerman, director of the Performance Management Group states,
"We find this metric of great value, and we emphasize it. Only one-third of the companies I encounter have any
notion of it at all. The Chief Information Officer can use it to help create a dashboard, a series of metrics, that drives
the organizational behavior required to optimize the business model (Slater 2000)."
Cash-to-cash may be depicted graphically as presented in Figure 1 which compares the C2C cycle for Sears
with WalMart Stores in 2001.1 This figure evidences a rather long cycle of 135.6 days for Sears, while WalMart has a
very short cycle of 18.3 days. Comparisons also suggest that Sears has more inventory days (28.1), more accounts
receivable days (155.5), and more accounts payable days (66.3) than WalMart Stores. Since each variable must be
viewed in the context of a firm’s mission and market, interpretation of these results is limited, yet examining all three
variables in combination provides a clear understanding of C2C for a company.
Figure 1 Sears vs. Wal-Mart Stores Cash-To-Cash Cycle 2001
aData source = Research Insights 7.6 database (formerly CompuStat).
IMPORTANCE OF C2C METRIC
The cash-to-cash metric is important from both accounting and supply chain management perspectives. It
can be used for accounting purposes in the determination of firm liquidity and organizational valuation. A shorter
cash conversion cycle, implying that fewer days cash are tied up in working capital and not offset by "free" financing
in the form of deferred payments, results in more liquidity for the firm (Soenen 1993). Also, a shorter conversion
cycle results in a higher present value of net cash flows generated by the assets and therefore, a higher firm value.

The Journal of Applied Business Research – Spring 2005 Volume 21, Number 2
115
For supply chain management activities, the metric serves as a universal measurement bridging the processes
into and out of the firm using common accounting measurements. The measures also offer useful and readily
available benchmarking data. The only known publication of benchmark C2C measurements features data from a
study by Pitiglio, Rabin, Todd, & McGrath (2000) that summarizes the metric for more than 320 technology-based
companies. Table 1 reflects the results presented in their study that suggest that best-in-class manufacturers (as they
defined it) typically have a significant advantage in their C2C cycle time compared to the industry medians.
Table 1 Cash-To-Cash Cyclea
Industry Best-in-Class Median
Computers and Electronics 28.7 75.1
Consumer Packaged Goods 24.7 66.6
Defense and Industrial 18.5 67.6
Pharmaceuticals and Chemicals 33.4 91.2
Telecommunications 44.4 100.2 aData source = Performance Measurement Group’s two-year benchmarking study of more than 110 participants (PRTM 2000).
Variable data represent days.
RESEARCH METHODOLOGY
To accomplish this study’s purpose, an initial dataset from the Research Insights 7.6 (formerly CompuStat)
database contained 21,608 companies. Next, the sample was culled by removing companies with incomplete data,
reducing the usable set of data to a total of 5,884 firms. Variables extracted for each firm included four-digit Standard
Industrial Classification (SIC) code, inventory, accounts receivable, and accounts payable.
C2C calculations involved utilizing inventory, accounts receivable, and accounts payable for each firm. To
convert each of these into a common, dynamic measure, they are transformed from dollars to days. The following
calculations were performed:
(1) Inventory(C2C) = Inventory ($) x 365
Cost of Sales ($)
(2) Receivables(C2C) = Accounts Receivable ($) x 365
Net Sales ($)
(3) Payables(C2C) = Accounts Payable ($) x 365
Cost of Sales ($)
Then, cash-to-cash is determined for each firm using the following formula:
(4) Calculated Cash-to-Cash Cycle = Inventory(C2C) + Receivables(C2C) - Payables(C2C)
Finally, each firm and its C2C metric is categorized by SIC code. Industry representative C2C is based on
medians due to extreme outlier issues that would substantially distort C2C means.
PRODUCT VERSUS SERVICE INDUSTRIES
To better understand service industry C2C performance, it is important to place it in perspective by
comparisons with all firms and the product industry. Table 2 presents the variable medians and C2C data for all firms
in product-based and service-based companies. The results for all three variables for service industries are lower than
the results for all firms and product industries. As would be expected, a key difference for product industries is higher

The Journal of Applied Business Research – Spring 2005 Volume 21, Number 2
116
levels of inventory while service industries have lower levels. Also, the significant variations in the inventory variable
impacted C2C, resulting in 35.7 days for services, 72.4 days for all firms, and 97.6 days for products.
Table 2 Product vs. Service Industries Cash-To-Cash Cycle 2001a
n Inventory Accounts
Receivable
Accounts
Payable C2C
All Firms 5,884 62.4 61.0 51.0 72.4
Products 3,216 85.8 59.4 47.6 97.6
Services 2,668 27.7 49.9 41.9 35.7 aData source = Research Insights 7.6 database (formerly CompuStat). Variable data represent days. Due to undue
weighting from outliers, SIC medians were utilized for the inventory, accounts receivable, and accounts payable
variables. Next, the medians were averaged.
Figure 2 depicts the same data for product and service industries yet in graphic form. It clearly shows the
variable differences: 58.1 days for inventory, 9.5 days for accounts receivable, and 5.7 days for accounts payable.
Overall, this results in a C2C difference of 61.9 days between product and service industries.
Figure 2 Product vs. Service Industries Cash-To-Cash 2001
aData source = Research Insights 7.6 database (formerly CompuStat).
SERVICE INDUSTRY PERFORMANCE
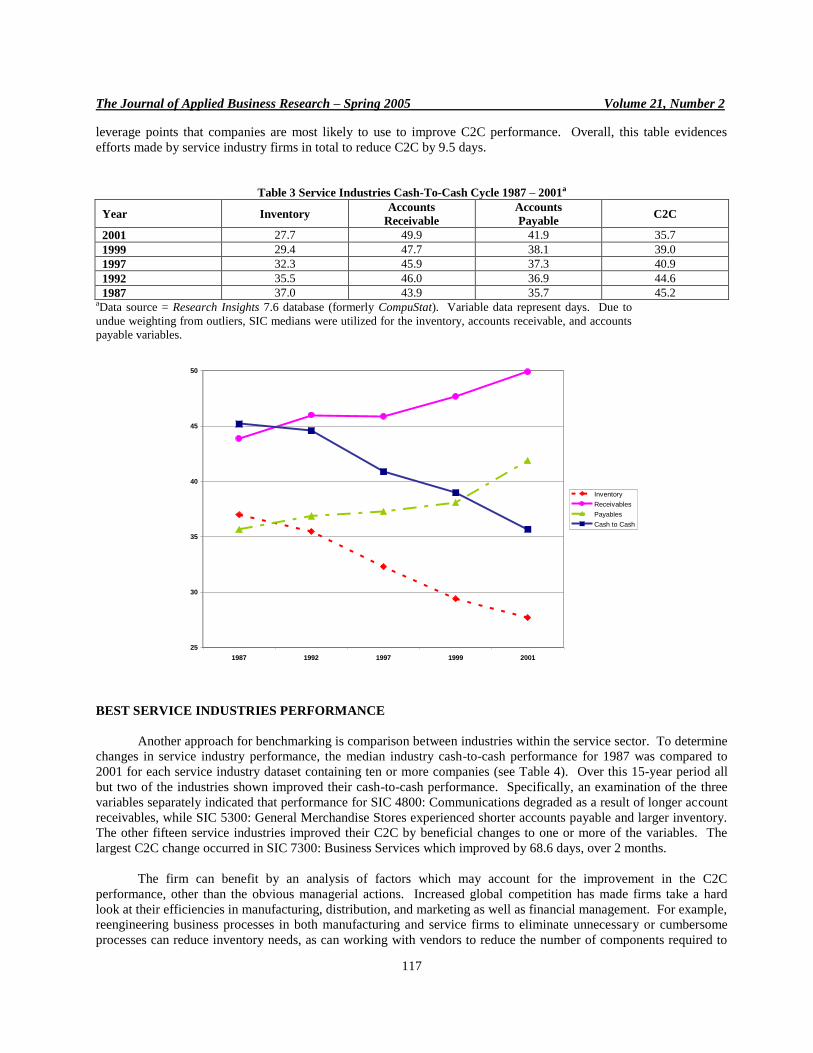
Knowledge about the management of the C2C metric may be gained by comparing changes in performance
over time. Cash-to-cash performance in the service industry has improved relatively over time as depicted in Table 3,
which shows variable and C2C changes from 1987 to 2001, a 15-year period. There was improvement with two of the
three variables during the time period reviewed. The largest change was 9.3 days for inventory reduction, followed by
extension of accounts payable by 6.2 days. From an overall perspective, there was a direct relationship between
changes in accounts payable and accounts receivables. These improvements provide knowledge regarding the
The Journal of Applied Business Research – Spring 2005 Volume 21, Number 2
117
leverage points that companies are most likely to use to improve C2C performance. Overall, this table evidences
efforts made by service industry firms in total to reduce C2C by 9.5 days.
Table 3 Service Industries Cash-To-Cash Cycle 1987 – 2001a
Year Inventory Accounts
Receivable
Accounts
Payable C2C
2001 27.7 49.9 41.9 35.7
1999 29.4 47.7 38.1 39.0
1997 32.3 45.9 37.3 40.9
1992 35.5 46.0 36.9 44.6
1987 37.0 43.9 35.7 45.2 aData source = Research Insights 7.6 database (formerly CompuStat). Variable data represent days. Due to
undue weighting from outliers, SIC medians were utilized for the inventory, accounts receivable, and accounts
payable variables.
25
30
35
40
45
50
1987 1992 1997 1999 2001
Inventory
Receivables
Payables
Cash to Cash
BEST SERVICE INDUSTRIES PERFORMANCE
Another approach for benchmarking is comparison between industries within the service sector. To determine
changes in service industry performance, the median industry cash-to-cash performance for 1987 was compared to
2001 for each service industry dataset containing ten or more companies (see Table 4). Over this 15-year period all
but two of the industries shown improved their cash-to-cash performance. Specifically, an examination of the three
variables separately indicated that performance for SIC 4800: Communications degraded as a result of longer account
receivables, while SIC 5300: General Merchandise Stores experienced shorter accounts payable and larger inventory.
The other fifteen service industries improved their C2C by beneficial changes to one or more of the variables. The
largest C2C change occurred in SIC 7300: Business Services which improved by 68.6 days, over 2 months.
The firm can benefit by an analysis of factors which may account for the improvement in the C2C
performance, other than the obvious managerial actions. Increased global competition has made firms take a hard
look at their efficiencies in manufacturing, distribution, and marketing as well as financial management. For example,
reengineering business processes in both manufacturing and service firms to eliminate unnecessary or cumbersome
processes can reduce inventory needs, as can working with vendors to reduce the number of components required to

The Journal of Applied Business Research – Spring 2005 Volume 21, Number 2
118
make a product. It is interesting to watch a service business like Krispy Kreme Doughnuts Corporation spend capital
on sophisticated automated processes and equipment along with premixed components to reduce inventory. At the
same time sophisticated forecasting models help predict demand which may be the single biggest, yet most
overlooked tool that service firms can use to reduce inventory.
Table 4 Service Industries Changes In Cash-To-Cash 1987 vs. 2001a
SIC Industry 1987 2001 Change
7300 Business Services 109.7 41.1 +68.6
4000 Railroad Transportation 38.8 -2.3 +41.1
5000 Wholesale Trade–Durable Goods 106.2 80.9 +25.3
5700 Home Furniture and Furnishings 78.9 54.9 +24.0
5600 Apparel and Accessory Stores 97.1 76.3 +20.8
4900 Electric, Gas, and Sanitary Services 42.2 22.0 +20.2
7900 Amusement and Recreation 16.4 0.8 +15.6
4500 Air Transportation 22.5 9.1 +13.4
5100 Wholesale Trade–Non-Durable Goods 37.1 26.5 +10.6
8700 Engineering and Accounting Services 74.5 65.1 + 9.4
8000 Health Services 56.9 48.5 + 8.4
5800 Eating and Drinking Places -0.6 -4.5 + 3.9
9900 Nonclassifiable Establishments 114.0 112.1 + 1.9
5400 Food Stores 17.2 16.4 + 0.8
5900 Miscellaneous Retail 69.1 68.4 + 0.7
4800 Communications 0.9 5.5 - 4.6
5300 General Merchandise Stores 87.6 112.3 -24.7 aData source = Research Insights 7.6 database (formerly CompuStat). Variable data represent days. Due to undue
weighting from outliers, SIC medians were utilized for the inventory, accounts receivable, and accounts payable
variables. Companies had to be in existence in both 1987 and 2001 to be included. Only industries with >10 companies
reporting all the necessary components to calculate cash-to-cash are presented.
SERVICE INDUSTRIES BY CHARACTERISTIC
The C2C elements (inventory, accounts receivable, and accounts payable) vary within the service industries.
Therefore, another tool to be used by management is benchmarking of industry characteristics which allows a
particular industry to identify others for comparison of performance. Since medians serve to generalize industry
characteristics and to further understand how each industry fits relative to others, all industries were rank-ordered
based on median performance for the three C2C variables and then split 50 percent into “High” and “Low” categories.
Figure 3 shows a 2 x 2 x 2 matrix that was created to classify service industries by these variables.
MANAGING C2C FOR SERVICE FIRMS
Once cash-to-cash has been calculated for a firm and comparisons made, the next logical step is to employ
efforts to manage it better. This involves an effort that must have both a cross-functional approach within the firm and
a collaborative approach throughout the supply chain between the firm, tier 1 and tier 2 suppliers, and its customers.
Essentially, improving C2C involves decreasing inventory or accounts receivable days, or extending accounts payable
days. This can be approached separately or trade-offs can be made among the three variables collectively. Each of
the actions may raise ethical issues depending on how they are implemented. At one time a “channel captain” may
have taken the position that whatever the firm did to optimize its own welfare was satisfactory regardless of the
consequences on suppliers or customers. In today’s highly competitive global supply chains, enlightened managers
recognize that actions which do not consider the ethical and financial consequences of their decisions may lead to
adverse consequences ranging from adverse publicity to having suppliers and customers abandon them. As noted
below, approaching the trade-offs from an overall supply chain perspective should focus on action which lead to
optimizing the entire supply chain.

The Journal of Applied Business Research – Spring 2005 Volume 21, Number 2
119
Figure 3 Service Industries Cash-To-Cash Map 2001a
High Inventory
High
Receivables
High Payables
6100 Non-Depository Institutions 6200 Security and Commodity Brokers
Low Payables
6500 Real Estate 9900 Nonclassifiable Establishments
Low
Receivables
High Payables
NONE
Low Payables
5000 Wholesale Trade–Durable Goods 5200 Building Materials, Garden Supply
5300 General Merchandise Stores
5500 Auto Dealers and Gas Stations 5600 Apparel and Accessory Stores
5700 Home Furniture and Furnishings
5900 Miscellaneous Retail
Low Inventory
High
Receivables
High Payables
4700 Transportation Services 4800 Communications
6000 Depository Institutions 6700 Holding and Other Investment Offices
7300 Business Services
Low Payables
6300 Insurance Carriers
8000 Health Services
8700 Engineering and Accounting Services
Low
Receivables High Payables
7800 Motion Pictures
Low Payables
4000 Railroad Transportation 4100 Local/Suburban Transportation
4200 Motor Freight
4400 Water Transportation 4500 Air Transportation
4600 Pipelines except Natural Gas
4900 Electric, Gas, and Sanitary Services
5100 Wholesale Trade–Non-Durable Goods
5400 Food Stores
5800 Eating and Drinking Places 6400 Insurance Agents, Brokers, and Service
7000 Hotels and Lodging
7200 Personal Services 7500 Auto Repair Services
7600 Miscellaneous Repair Services
7900 Amusement and Recreation 8200 Education Services
8300 Social Services
aData source = Research Insights 7.6 database (formerly CompuStat). Due to undue weighting from outliers, SIC medians were utilized for
variable categorization as HIGH or LOW.

The Journal of Applied Business Research – Spring 2005 Volume 21, Number 2
120
Many of the suggested C2C management techniques are simply a result of implementing basic accounting
principles and focusing on the key leverage points:
1. Reduce Inventory Days of Supply
While most service firms do not have large amounts of inventory, efforts can be directed to better maintain
and control it. Many outside the firm view inventory as a barometer of efficiency. Specifically, evaluations should be
made regularly regarding Reorder Points (ROP) and Economic Order Quantities (EOQ). Inventory can also be
classified into two primary categories, optimum and overage. Optimum inventory is defined as “the exact amount of
inventory required to support immediate needs.” Overage inventory is “additional inventory beyond that required to
support immediate requirements” (Farris 1996). Overage can be broken down further into “good,” excess inventories
held for strategic reasons such as anticipation of a materials price increase, and “bad,” excess inventory burdening the
system. Basic inventory management should reduce overage classified as bad first.
Other inventory strategies can be utilized to improve this variable for the C2C model. These include: real-
time inventory tracking, Collaborative Planning, Forecasting, and Replenishment (CPFR), and synchronizing
supply/demand planning. For example, using advanced technology such as RFID and its associated hardware and
software to provide real-time inventory information throughout the supply chain can be a win-win for all members.
Not only can total inventory in the system be reduced, but sales can grow as the in-stock rate increases. In addition,
the number of returns and obsolescence costs are less when fresher inventory is available for sale. And, the ethical
dilemmas are deduced as the firm looks for strategies which do more than simply try to push inventory backwards or
forwards in the supply chain simply because of its power to do so.
2. Reduce Average Accounts Receivable Days
Expediting receivables collections is the next leverage point examined for improving the cash-to-cash metric.
The days-sales-outstanding term captures the ratio of accounts receivable to average-daily sales and thus, provides a
"days" measure of outstanding receivables (Stewart 1995).
The following suggestions are common actions employed by many firms to improve accounts receivable
collection. One of the most effective mechanisms to encourage faster payments and increase receivables collection is
to offer discount terms for early payment (Boardman and Ricci 1985). There is also evidence that companies with
low days-sales-outstanding tend to follow up quickly on delinquent accounts (Stewart 1995). Further, interest could
be assessed on delinquent accounts and future orders for those customers could require Cash On Delivery (COD)
payments.
Other approaches for expediting receivables include using lock boxes, where post office boxes are obtained
in close proximity to customers, the boxes are serviced daily, and deposits made daily with banks to company
accounts. Additionally, customers could be provided pre-addressed, stamped envelopes to improve payment time
(Walz 1999). Another suggestion is to require full payment at time of order or a substantial deposit. Acceptance of
electronic payments from customers would also expedite receivables and eliminate float time.
3. Extend Average Accounts Payable Days
The final approach to improving the cash-to-cash metric is to extend average accounts payable days
associated with inventory and therefore, obtain interest-free financing. While the objective with accounts receivable
was to increase the collection of cash, the goal with accounts payable is the opposite, to control and slow down
payment of firm cash until the last possible moment.
There are many ways to extend accounts payable. Each should consider the cost of the burden placed on the
other members of the supply chain. A firm may make scheduled partial payments rather than one full payment;
change the frequency of employee payroll disbursements from weekly to monthly; or extend payments by utilizing
interest-free lines of credit or credit cards. A firm can also utilize electronic payment for raw materials, inventory,

The Journal of Applied Business Research – Spring 2005 Volume 21, Number 2
121
wages, and expenses so that payment is made at its optimum C2C time. Finally, commissions for sales personnel
could be credited when accounts receivable are paid rather than at point of sale (Walz 1999).
While these suggestions for improving the C2C variables are not all-inclusive, implemented separately or
together they can improve cash-to-cash. Firms are encouraged to determine their own approaches to improving C2C
and its variables within the context of their firm’s mission and market.
USING CASH-TO-CASH TO HELP OPTIMIZE THE SUPPLY CHAIN
As previously noted, caution must be exercised by firms in the utilization of the cash-to-cash metric for
optimizing the supply chain, instead of focusing only on the metrics within the company and sub-optimizing the
overall economics of the supply chain. Consider the example of a retailer with a cost of capital of 15% that extends its
accounts payable of $1,000,000 by ten days with a supplier that has a cost of capital of 18%. It is a common practice
for large North American retailers to force an adjustment of accounts payable in tough economic times. While this
action saves the retailer $4,110, it costs the supplier $4,932 and adds $822 to the overall supply chain cost structure.
No doubt at some point the supplier must recoup this additional cost.
An alternative action, which implements the concept of supply chain partners working together for mutual
benefit, is to have the retailer pay the $1,000,000 ten days earlier in return for a share of the supplier’s savings. As a
result of exchanging ten days of 18% cost of capital for 15% cost of capital, the overall supply chain cost structure is
reduced by $822, savings which may be split between the supply chain partners. Under this scenario, in return for a
lower cost of accounts receivables from the retailer, the supplier would be expected to reduce prices to the retailer by
$4,521 in return for the reduction of working capital costs of $4,932.
Using the cash-to-cash metric to manage the supply chain:
Offers increased visibility of more decision variables in the supply chain.
Increases optimization of decisions for the supply chain.
Reduces sub-optimization of financial decisions within firms.
Aids supplier decision making by eliminating the uncertainty of customer actions.
If used properly, the cash-to-cash metric can result in reduced supply chain structure costs, increasing
profitability for supply chain partners, and potentially driving out costs for the end consumer.
LIMITATIONS OF THE STUDY
As with any study, there are limitations present in this research. One limitation is the data itself. Companies
often manage the accounting numbers that are reported at the end of accounting periods. For example, an emphasis on
inventory reduction management at the end of an accounting period may occur. Another limitation is the accuracy of
the data in the Research Insights database. Finally, a limitation is the assumption that data from companies
represented in the database from 1986 through 2001 can be generalized to all firms in the service industry.
SUGGESTIONS FOR FUTURE RESEARCH
There are many research questions that should be addressed to assist firm management and enhance C2C.
This paper has shown that the components of C2C have significantly improved over the past fifteen years. Therefore,
an important research question would be to determine how outside influences such as technology and the economy
have influenced these improvements. Research should also be directed at determining the most critical leverage
points when managing C2C cycles. Future analysis within industries themselves may also offer further knowledge
into developing realistic expectations of the C2C metric based on a particular industry, type of business process,
product value, and size of a company. As C2C permeates through the supply chain, there are also research questions
to explore concerning power in the channel and the influence of cash management on a trading partner’s C2C cycle

The Journal of Applied Business Research – Spring 2005 Volume 21, Number 2
122
and profitability. For companies that appear to be very successful in terms of their C2C cycles, case based research
could provide insights beyond that gained from analysis financial data.
Some companies do not traditionally report inventories as a part of their balance sheet, choosing instead to
represent inventory assets as capital items. For example, Perot Systems, an information technology outsourcing firm,
purchases computer hardware for installation at customer locations but does not report it as inventory. These firms
were excluded from the present study. Therefore, this introduces the question as to whether there is a significant
difference between those service firms reporting inventory and those aggregating these purchases in capital assets. It
also raises the issue of whether these non-inventory service firms should have a different equation to calculate cash-to-
cash metrics.
CONCLUSIONS AND MANAGERIAL IMPLICATIONS
The cash-to-cash metric is becoming an important measure as it bridges across inbound material activities
with suppliers, through operations, and the sales and outbound logistics activities with customers. This study
presented an overview of cash-to-cash and its calculation, comparisons between product and service industries,
benchmarking data for service industries, discussion of key C2C leverage points, and future research questions. This
research provides managers in today’s service firm environment with an understanding of the C2C metric, its relative
importance from both accounting and supply chain management perspectives, and comparative data for assessment.
Finally, those managers with cash-to-cash knowledge will be better positioned to assist companies in service
industries with improving firm liquidity position and overall value.
There are several managerial implications related to using the C2C metric. First, it serves as a measure of
change across time. Dell Computer Company chooses to report C2C changes in the company’s quarterly financial
reports to its stockholders. This provides interested parties with a quick snapshot of changes to three of the most
important variables of cash flow. Second, cash-to-cash can be beneficial as a means of setting goals for improvement
within the supply chain. Not only is C2C data readily available across the supply chain, it allows members to readily
see the trade-offs between companies. Third, this research study offers insights about C2C for service industries that
can be used for benchmarking purposes. This paper is the first known case of comparable C2C data specific to service
industries. Further, it supports comparisons between different sectors of the service industries. Fourth, previous
studies have found that the liquidity reflected in the cash-to-cash metric can be a strong determinant of profitability.
While a detailed study is forthcoming by the authors, preliminary evidence suggests this does hold true for service
industries, as well as manufacturing industries. Finally, understanding how the C2C metric has changed over the last
fifteen years provides knowledge about which variables offer the greatest leverage points and opportunities for
improvement. Fifteen of seventeen industries had their C2C improve between 1987 and 2001 suggesting two key
points: 1) improving C2C must be an on-going effort. Companies that do not improve their C2C will soon find that
their competitor has improved their C2C and earned a competitive advantage. 2) Historic changes in C2C (noted in
Table 4) show a clear departure from the effectiveness of General Merchandise Stores (SIC 5300) toward niche
competitors such as Home Furniture and Furnishings (SIC 5700) and Apparel and Accessory Stores (SIC 5600). It
may be proffered that improvements in C2C in these niche industries have contributed to the increased
competitiveness against General Merchandise Stores.
ENDNOTES
1. Data source = Research Insights 7.6 database (formerly CompuStat).
REFERENCES
1. Beed, Teresa, “Using Operating Cycle Figures To Spot Inventory And Accounts Receivable Problems,”
Montana Business Quarterly, Vol. 19, No. 3 (autumn), p. 23, 1981.
2. Boardman, Calvin M. and Kathy J. Ricci, “Defining Selling Terms: Economics Of Delaying Payment-How
Does Your Industry Compare?” Credit & Financial Management, Vol. 87, No. 3, pp. 31-33, 1985.

The Journal of Applied Business Research – Spring 2005 Volume 21, Number 2
123
3. Byers, Steve S., John C. Groth, and Marilyn K. Wiley, “Managing Operating Assets To Create Value,”
Management Decision, Vol. 35, No. 2, p. 133, 1997.
4. Farris II, M. Theodore, “Utilizing Inventory Flow Models With Suppliers,” Journal Of Business Logistics,
Vol. 17, No. 1, pp. 35-62, 1996.
5. Farris II, M. Theodore Farris and Paul D. Hutchison, “Cash-To-Cash: The New Supply Chain Management
Metric,” International Journal of Physical Distribution & Logistics Management, Vol. 32, Nos. 3-4, pp. 288-
298, 2002.
6. Farris II, M. Theodore and Paul D. Hutchison, “Measuring Cash-To-Cash Performance,” The International
Journal of Logistics Management, Vol. 14, No. 2, pp. 83-91, 2003.
7. Hutchison, Paul D. and M. Theodore Farris II, “Cash-To-Cash Assessment And Benchmarks In The Oil And
Gas Industry,” Oil, Gas, & Energy Quarterly, Vol. 51, No 3, pp. 479-491, 2003.
8. Hutchison, Paul D. and M. Theodore Farris II, “Managing The Cash-To-Cash Cycle To Increase Firm Value,”
Today’s CPA, Vol. 31, No. 5 (March/April), pp. 18-23, 2004.
9. Phillips, Harvey, “E-Commerce Shortens The Supply Chain,” New Zealand Manufacturer, (Sept./Oct.), pp.
12-14, 1999.
10. Pitiglio, Rabin, Todd, & McGrath (PRTM), “PRTM Survey: Top Performers Cut SCM Costs To 4% Of
Sales,” MDM 29.16, Aug. 25 - The Performance Measurement Group, LLC (PMG), a subsidiary of
management consultants PRTM, released results of the first survey in its 1999-2000 online Supply-Chain
Management Benchmarking Series (www.supply-chain.org), 2000.
11. Research Insights, McGraw-Hill Companies (formally CompuStat), 1993-2002.
12. Slater, Derek, “By The Numbers,” Supply Chain Best Practices Issue of CIO Magazine, Vol. 13, No. 16
(June 1), p. 34, 2000.
13. Skomorowsky, Peter, “The Cash To Cash Cycle And Net Income,” The CPA Journal, Vol. 58, No. 12
(December), pp. 84-85, 1988.
14. Soenen, Luc A., “Cash Conversion Cycle And Corporate Profitability,” Journal Of Cash Management, Vol.
13, No. 4, p. 53, 1993.
15. Stewart, Gordon, “Logistics Supply Chain Performance Benchmarking Study Reveals Keys To Supply Chain
Excellence,” Information Management Vol. 8, No. 2, pp. 38-44, 1995.
16. Walz, D., “Walz On-Line Lecture,” (www.trinty.edu/dwalz/3301f99/sld160.htm), 1999.
17. Ward, Peter, “Cash-To-Cash Is What Counts,” Journal of Commerce, (February 16), p. 1, 2004.

The Journal of Applied Business Research – Spring 2005 Volume 21, Number 2
124
NOTES