641 - core · by paolo emilio mistrulli. ... columba, alessio d’ignazio, xavier freixas, eugenio...
TRANSCRIPT

Temi di discussione(Working papers)
Sep
tem
ber
200
7
641
Num
ber
Assessing financial contagion in the interbank market: Maximum entropy versus observed interbank lending patterns
by Paolo Emilio Mistrulli

The purpose of the Temi di discussione series is to promote the circulation of working papers prepared within the Bank of Italy or presented in Bank seminars by outside economists with the aim of stimulating comments and suggestions.
The views expressed in the articles are those of the authors and do not involve the responsibility of the Bank.
Editorial Board: Domenico J. Marchetti, Marcello Bofondi, Michele Caivano, Stefano Iezzi, Andrea Lamorgese, Francesca Lotti, Marcello Pericoli, Massimo Sbracia, Alessandro Secchi, Pietro Tommasino.Editorial Assistants: Roberto Marano, Alessandra Piccinini.

ASSESSING FINANCIAL CONTAGION IN THE INTERBANK MARKET:
MAXIMUM ENTROPY VERSUS OBSERVED INTERBANK LENDING PATTERNS
Paolo Emilio Mistrulli*
Abstract
Interbank markets allow banks to cope with specific liquidity shocks. At the same time, they may be a channel allowing a bank default to spread to other banks. This paper analyzes how contagion propagates within the Italian interbank market using a unique data set including actual bilateral exposures. Since information on bilateral exposures was not available in most previous studies, they assumed that banks spread their lending as evenly as possible among all the other banks by maximizing the entropy of interbank linkages. Based on the data available on actual bilateral exposures for all Italian banks, the results obtained by assuming the maximum entropy are compared with those reflecting the observed structure of interbank claims. The comparison indicates that, in line with the thesis prevailing in the literature, the maximum entropy method tends to underestimate the extent of contagion. However, this does not hold in general. Under certain circumstances, depending on the structure of the interbank linkages, the recovery rates of interbank exposures and banks’ capitalization, the maximum entropy approach overestimates the scope for contagion.
Keywords: interbank market, financial contagion, systemic risk, maximum entropy. JEL classification: G21, G28.
Contents 1. Introduction ..........................................................................................................................32. Data and methodology .........................................................................................................6
2.1 Data ………………………………………………………………………….....……..62.2 The contagion mechanism ............................................................................................7
3. Is the Italian interbank market vulnerable to financial contagion? ....................................103.1 The benchmark analysis..............................................................................................103.2 The effect of bail-outs within conglomerates .............................................................13
4. Maximum entropy versus observed interbank lending patterns ........................................174.1 Interbank lending patterns and the theory of financial contagion...............................194.2 The Italian case ...........................................................................................................25
5. Conclusion..........................................................................................................................30References...............................................................................................................................31Appendix A.............................................................................................................................33Appendix B .............................................................................................................................34
* Bank of Italy, Rome, Italy. Email: [email protected]

3
1. Introduction1
Systemic risk has always played a prominent role in the economic policy debate. A
widely shared view is that the banking system is an important chain in the propagation of
shocks to the entire economy.2 Early theoretical works concerning systemic risk in the
banking sector have focused on depositor runs triggered by self-fulfilling expectations
(Diamond and Dybvig, 1983) or by signals regarding bank solvency (Chari and Jagannathan,
1988 and Jacklin and Bhattacharya, 1988). More recently, attention has been paid to
financial contagion in the interbank market (Rochet and Tirole, 1996). While the interbank
market may allow banks to cope with specific liquidity shocks (Bhattacharya and Gale,
1987), interbank relationships may represent a channel for contagion: the economic distress
of an insolvent bank may propagate to other banks through interbank linkages.3 Recent
theoretical works (Allen and Gale, 2000; Freixas, Parigi and Rochet, 2000) have also
highlighted that the propagation of shocks within the interbank market is dependent on the
exact pattern of banks’ financial linkages.
Many contributions have sought to measure the vulnerability of the interbank market
to financial contagion.4 However, these works suffer from two main data limitations. First,
detailed data on banks’ bilateral exposures are generally not available. In order to
circumvent this problem, two approaches have been adopted: a) the severity of financial
contagion in the interbank market has been measured by focusing on a specific segment of
1 I am grateful to Ugo Albertazzi, Franklin Allen, Guglielmo Barone, Marcello Bofondi, Francesco
Columba, Alessio D’Ignazio, Xavier Freixas, Eugenio Gaiotti, Leonardo Gambacorta, Andrea Generale, Giorgio Gobbi, Francesca Lotti, Christian Upper and Andreas Worms and two anonymous referees for helpful suggestions. I am greatly indebted to Paolo Angelini for having provided me with very useful comments at different stages of this work. I would also like to thank participants in the seminars at the Bank of Italy, at the Universitat Pompeu Fabra and at CSEF-University of Salerno, and participants in the workshop on “Systemic Risk in the Financial Sector” hosted by Collegium Budapest (Budapest, 2005) and in the 2006 European Meeting of the Econometric Society. The opinions expressed in this paper are mine and in no way involve the responsibility of the Bank of Italy.
2 De Bandt and Hartmann (2000) and Kaufman (1994) provide a detailed discussion on the definition of systemic risk.
3 A different channel for contagion through the interbank market could be related to signals or self-fulfilling expectations triggering interbank deposits withdrawals.
4 See Upper (2007) and Appendix A for details of the literature on financial contagion.

4
the market for which actual bilateral exposures were available; in particular, Furfine (2003)
has investigated contagion in the Federal Reserve’s large-value transfer system (Fedwire)
which, however, represents a small fraction of U.S. total interbank exposures (according to
Furfine himself, approximately 14 per cent); b) other contributions have taken into account
the whole interbank market. However, since detailed information on banks’ bilateral
exposures is not available, these works have had to assume a specific pattern for them. In
particular, it is possible to distinguish between two different cases: i) interbank bilateral
exposures are obtained on the basis of aggregated interbank assets and liabilities by
maximising the entropy5 of the matrix of bilateral claims (e.g. Upper and Worms, 2004) or
ii) when information about large bilateral exposures is available, the entropy maximisation
method is applied only to those elements of the matrix of bilateral exposures that are not
known (Blavarg and Nimander, 2002; Wells, 2004; Degryse and Nguyen, 2007; van
Lelyveld and Liedorp, 2006). The main limitation of this approach is that it assumes a
market structure which might be quite different from the actual one. Indeed, the
maximisation of the entropy rules out lending relationships in the interbank market6 since it
assumes that each bank lends to all the other banks in the market.
A second data limitation concerns the structure of the banking system. The existing
literature has typically overlooked the fact that banks are often affiliated with a
conglomerate, even if this may, quite obviously, affect the resilience of the banking system
to systemic shocks.
In this paper, financial contagion in the interbank market is investigated using a unique
data set including detailed information on each actual bilateral exposure for all the Italian
banks. Thus, the analysis deals with all kinds of interbank financial linkages, besides
derivatives and shares, for every Italian bank and for each bank-to-bank relationship.
According to the previous literature, the paper uses simulation techniques to measure the
severity of financial contagion.
5 See Appendix B for details. 6 Cocco et al. (2003) find evidence supporting the existence of lending relationships in the interbank market
for overnight funds.

5
The paper contributes to the literature in two main respects. Firstly, it provides a
measure of the vulnerability to financial contagion of the Italian interbank market,7 thus
enriching the evidence so far available for most of the industrialised countries. However, the
analysis differs from those made for other countries as it is based on actual bilateral
exposures instead of maximum entropy exposures. Furthermore, by taking into account the
affiliation of banks with a conglomerate, it provides evidence on the link between financial
conglomeration and banking system stability. The paper shows that even if the Italian
interbank market is conducive to financial contagion it hardly triggers a systemic crisis.
Banks conglomeration tends to improve the resilience of the banking system to shocks.
However, in some cases, since conglomeration induces a strong interdependency among
affiliated banks, the extent of contagion may be even wider if banks’ affiliation is taken into
account than when it is ignored.
Secondly, it shows that the measure of financial contagion depends on the pattern of
interbank linkages. To this end, the paper applies the maximum entropy method, it re-runs
the simulation exercises and then compares them with the results based on actual bilateral
exposures. The comparison indicates that, in line with the thesis prevailing in the literature,
the maximum entropy method leads to an undervaluation of the extent of contagion.
However, this does not hold in general. Under certain circumstances, depending on the
structure of the interbank linkages, the recovery rates of interbank exposures and banks’
capitalisation, the maximum entropy approach implies an overvaluation of the scope for
contagion.
These results have two consequences. On the empirical level, it indicates that in some
circumstances, depending on the structure of the interbank market, the maximum entropy
approach may not be very reliable in assessing the severity of financial contagion.
Furthermore, since it does not provide a lower bound to contagion vulnerability, it may not
be reliable either for assessing whether the interbank market is conducive to contagion or
not. On the theoretical level, following Allen and Gale’s (2000) taxonomy, the comparison
between maximum entropy and observed exposures may be interpreted as a comparison
7 The paper by Angelini et al. (1996) has also analysed the risk of contagion in the Italian interbank market,
although the work takes into account only the netting system segment.

6
between complete and incomplete markets. In this respect, the results obtained in this paper
show that complete markets are not always less conducive to contagion than other markets,
as Allen and Gale (2000) stated.
The remainder of the paper is organised as follows. The next section describes the
methodology and data. The third section deals with the vulnerability to financial contagion
of the Italian interbank market. Section 4 investigates how the maximum entropy method
affects the severity of financial contagion by comparing, for the Italian case, the results
obtained on the basis of the maximum entropy matrix of bilateral exposures with those
obtained using the observed matrix. The final section concludes and summarises the main
findings.
2. Data and methodology
2.1 Data
Data on gross bilateral interbank exposures are obtained from the Bank of Italy
supervisory reports database. Since January 1989 all Italian banks, including their foreign
branches, submit to the Bank Italy their end-of-month bilateral exposures to all other banks,
foreign intermediaries included. Data refer to all kinds of interbank assets except shares. The
database allows for a distinction between different claims (CDs, current accounts, repos,
other loans, subordinated and unsubordinated bonds) classified according to their maturity
(up to 18 months, over 18 months), currency of denomination and counterpart nationality
(Italy vs. rest of the world).
At the end of 2003, interbank exposures accounted for a substantial share of the total
assets of Italian banks. The total amount of loans to banks and of securities issued by banks
held by the Italian banking system was equal to 24 per cent of total assets at the end of 2003;
it was 37 per cent for the banks in the euro area as a whole. More importantly, from the
perspective of financial contagion, interbank exposures were over 3 times the total amount
of capital and reserves in Italy, 6 times that in the euro area. If one considers only the
domestic segment of the market, interbank assets were 18 per cent of total assets in Italy and
21 per cent in the euro area. The interbank asset-to-capital ratio was respectively 2.4 and 3.5
for the Italian banking system and the euro area banks.

7
2.2 The contagion mechanism
All banks raising funds in the interbank market are allowed to fail one at a time. The
losses suffered by banks lending to the failed bank are then computed. If the amount of the
losses is greater than lenders’ tier-1 capital (i.e. capital and reserves) then lenders default.
The simulation is then iterated by verifying if banks that fail after the first iteration make
other banks fail as well. At each iteration banks that failed in the previous one are dropped
from the set of banks which may be affected by contagion. The simulation continues until at
least one bank default occurs.
More formally, let B be the set of banks and xij denote the funds that bank Bj ∈
borrows from bank Bi ∈ , where BBjix ij ×∈∀≥ ),( 0 and Bi x ii ∈∀= 0 , by the
initial capital endowment of bank i , and by
0>ic
[ ]1,0∈α the rate of loss (i.e. the incidence of
losses due to contagion out of the interbank exposure). Finally, let Bz ∈ denote the first bank
that defaults because of some idiosyncratic shock, and define and as the set of
banks, respectively, defaulted and surviving at the n-th step of the contagion path initiated by
bank z , as follows:
BDnz ⊆ BS n
z ⊆
(1) 1 , 0 : 0 0 : ,1
,, ≥∀>∈=>≤∈= − ncBkSccBkD nzk
nz
nzk
nzk
nz
where , which is the capital of bank k at the n-th step of contagion initiated by bank z, is
equal to:
nzkc ,
(2) zknxccnzDj
kjn
zkn
zk ≠∀≥∀−= ∑−∈
− and 1 , 1
1,, α
The contagion path is then the following:

8
Failed banks Surviving banks
xccSk S D
xccSk S xccSk D
...
xccSk S xccSk D
xccSk S xccSk D
zBk S z D
Nz
nz
nz
zz
Djkj
Nzk
Nzk
Nz
Nz
Nz
Djkj
nzk
nzk
nz
nz
Djkj
nzk
nzk
nz
nz
Djkjzkzkzz
Djkjzkzkzz
kzkzkzzkzkzkzz
zz
⎪⎭
⎪⎬⎫
⎪⎩
⎪⎨⎧
>⎟⎟⎠
⎞⎜⎜⎝
⎛−=∈=∅=
⎪⎭
⎪⎬⎫
⎪⎩
⎪⎨⎧
>⎟⎟⎠
⎞⎜⎜⎝
⎛−=∈=
⎪⎭
⎪⎬⎫
⎪⎩
⎪⎨⎧
≤⎟⎟⎠
⎞⎜⎜⎝
⎛−=∈=
⎪⎭
⎪⎬⎫
⎪⎩
⎪⎨⎧
>⎟⎟⎠
⎞⎜⎜⎝
⎛−=∈=
⎪⎭
⎪⎬⎫
⎪⎩
⎪⎨⎧
≤⎟⎟⎠
⎞⎜⎜⎝
⎛−=∈=
>−=∈=≤−=∈=
∈==
∑
∑∑
∑∑
−
−−
∈
−−
∈
−−
∈
−−
∈∈
0:
...
0:0:
0:0:
0)(:0)(:
\
1
11
11
1,,
1
1,,
11,,
1
1,
2,
121,
2,
12
1,
011,
01
00
α
αα
αα
αα
and the process stops after N iterations when no default occurs.
Before commenting on some shortcomings of the contagion mechanism it is useful to
emphasise two characteristics of the process. First, default condition (1) refers to interbank
gross exposures instead of net ones. The main reason for this is that bilateral netting is not
feasible because when banks fail, their liabilities are pooled and satisfied according to
seniority. Moreover, this kind of procedure usually lasts many years. Second, simulations are
run on unconsolidated interbank bilateral exposures. An alternative contagion mechanism
could be based on consolidated exposures. However, consolidating interbank exposures
would amount to assuming that, in the case in which a bank affiliated with a group fails,
internal exposures (i.e., interbank exposures among banks affiliated to the same parent
company) are senior to the others. On the other hand, one can define an alternative contagion
mechanism such that banks affiliated to a group may be bailed out by their parent company if
the consolidated tier-1 capital is larger than the losses suffered from contagion (see Section
3.2 below).
The contagion mechanism described above suffers from some drawbacks. In particular:

9
i) loss rates are constant across banks and through different stages of financial
contagion propagation and they are also not dependent on loan contract
covenants;
ii) the analysis focuses on contagion only among banks operating in Italy;
iii) the contagion mechanism concentrates on a specific channel for contagion
ignoring any other source which could interact with the propagation of
contagion within the interbank market;8
iv) banks are not allowed to issue shares in order to compensate for the losses they
suffer from the failure of some interbank market counterpart;
v) creditor runs are ruled out.
As far as loss rates are concerned (i), bank failures are rarely observed and therefore it
is difficult to estimate a loss rate for interbank exposures.9 For this reason, this paper follows
the approach adopted by previous works (e.g. Furfine, 2003; Upper and Worms, 2004) of
measuring the risk of contagion at different loss rates between 0 and 1. It is also assumed that
the loss rate does not depend on the banks involved. While this assumption is not quite
realistic, it is not easy to endogenise loss rates. The risk could be that of introducing even
increasingly unrealistic parameters in simulations.
The analysis focuses on contagion among banks operating in Italy (ii) because
otherwise it would be not possible to analyze all “second-round” effects. Actually, as far as
external interbank exposures are concerned, interbank linkages among foreign banks are not
known. This implies that is not possible to verify whether, say, the failure of a foreign bank
(bank i) triggers indirectly the failure of a bank operating in Italy (bank k) by causing first the
failure of another foreign bank (bank j) that has borrowed money from the first (bank i).
8 For example, exposures from the payment and settlement system may provide alternative channels for
contagion. Furthermore, loans to non-banks may amplify the effect of a bank failure by causing liquidity shortages and the insolvency for some borrowers which in turn may make the banking system suffer other loan losses.
9 Some authors have tried to estimate the loss rates for the U.S. banking system. However, their estimates are very different: James (1991) has found a loss rate of 40 per cent while Kaufman’s (1994) estimate is 5 per cent.

10
The analysis of a more comprehensive contagion mechanism (iii) would certainly add
to the realism of the analysis. On the other hand, by making the contagion process more
complex it might be more difficult to isolate the contribution of each channel for contagion.
Some of the shortcomings mentioned above would be solved if more detailed
information were available (i-iii). On the other hand, others (iv-v) seem to be more difficult
to tackle with as they would require a theoretical foundation that, to the best of my
knowledge, is not yet available.
All the drawbacks of the analysis mentioned above may affect the measure of the
severity of contagion in a specific interbank market. However, they do not affect the
comparison between the results based on the maximum entropy matrix of bilateral exposures
and those based on actual bilateral exposures as they are obtained by the same contagion
mechanism.
3. Is the Italian interbank market vulnerable to financial contagion?
The aim of this section is to assess whether the Italian interbank market is vulnerable
to financial contagion. The analysis is divided into two parts. The first one (subsection 3.1),
following the literature on financial contagion in the interbank market, addresses the issue of
financial contagion by assuming that banks cannot react to a shock by, for example, raising
capital to compensate for the losses suffered from the failure of their interbank counterparts.
In the second part (subsection 3.2), parent banks are allowed to recapitalise their affiliates by
redistributing capital resources within the conglomerate.
3.1 The benchmark analysis
Table 1 reports simulation results referring to December 2003.10 Different measures of
financial contagion propagation have been computed i) the number of banks whose default
causes at least one bank failure by contagion (contagious banks), ii) the number of banks
that fail by contagion and their total assets as a percentage of the Italian banking system’s
10 It is worth noting that results are not affected by an end-of-year effect. Simulations for other months of
2003 (March, June and September) have produced similar results.

11
total assets (banks failing by contagion), and iii) the number and the total assets, as a
percentage of the Italian banking system’s total assets, of banks that never fail independently
of the bank failing by some idiosyncratic shock (contagion-proof banks).
Overall, the evidence indicates that financial contagion may occur in the Italian
banking system. This result does not hold in general but depends on the bank that fails at the
initial stage. In fact, Table 1 shows that, even for high loss rates, only a limited number of
banks are contagious: the number of contagious banks ranges from 16 to 67, depending on
the loss rate, out of 789 Italian banks operating at the end of 2003. It is also worth noting that
contagious banks are not necessarily large ones. Some small bank may be contagious,
particularly for high loss rates. On the other hand, even if the loss rate is equal to one, not all
large banks (22 at the end of 2003) are able to make other banks fail.
Since many banks are not contagious, the propagation of contagion is fairly limited on
average, both in terms of the number of banks failed and their share of the banking system’s
total assets.
Furthermore, as far as contagion-proof banks are concerned (i.e. banks which, for a
given loss rate and independently of the bank that initiates the contagion process, never fail)
the results indicate that a large part of the banking system is immune to contagion. Even in
the worst case (i.e. when the loss rate is equal to 1) banks immune to contagion represent a
considerable share of the banking system (529 out of 789 banks; about 60 per cent of the
banking system’s total assets).
All in all, these results suggest that, even if contagion may occur in the Italian
interbank market, there is little scope for financial contagion in Italy. However, one may be
interested in other characteristics of the distribution of contagion other than mean values.
Following previous works on financial contagion, the maximum impact of financial
contagion (worst scenario) has also been reported in Table 1. This is the result of the failure
of the bank that produces the maximum contagion impact. While such an event is unlikely it
makes sense to consider it in an analysis whose aim is to quantify risks and their
consequences. In this case, the number of banks failing by contagion ranges from 4 to 116
and is greater than 50 for a loss rate greater or equal to 0.7; the share of total assets of banks
failing by contagion ranges from 0.5 to 15.9 per cent and is greater than 10 per cent for
a loss rate greater than or equal to 0.7.

All banks Large banks (1) All banks Large banks
(1) All banks Large banks (1) All banks Large banks
(1)
0.1 0.466 0.203 0.004 0.000 0.036 4 1 0.029 0.001 0.219 98.6 755 21 25.2 16 50.2 3.467 3.467 0.013 0.007 0.149 4 2 0.056 0.006 0.314 91.9 743 18 41.5 28 120.3 7.422 7.339 0.028 0.018 0.326 7 3 0.107 0.010 0.606 84.9 721 17 49.2 35 140.4 7.870 7.339 0.037 0.019 0.363 12 3 0.159 0.011 0.890 80.1 694 16 54.3 39 160.5 7.906 7.339 0.054 0.031 0.485 21 3 0.243 0.017 1.435 77.5 674 15 58.9 45 170.6 7.906 7.339 0.072 0.039 0.544 28 3 0.341 0.022 2.025 73.8 655 14 60.1 51 170.7 8.280 7.339 0.092 0.052 0.645 53 4 0.486 0.038 3.286 72.0 623 13 60.2 52 170.8 15.207 11.136 0.115 0.068 0.917 79 6 0.621 0.044 4.784 64.5 589 11 60.5 55 170.9 15.637 11.136 0.138 0.078 1.029 98 6 0.823 0.050 6.190 59.7 552 10 62.2 57 181.0 15.878 11.136 0.154 0.087 1.086 116 6 0.983 0.054 7.314 59.4 529 10 63.5 67 18
(1) Large banks are defined as banks whose total assets are at least equal to 20 billion euro. (2) Banks which are never affected by contagion. (3) Banks which make at least one bank fail.
Number of banks Total assets (as a percentage
of banking system total
assets)Worst scenario Mean values
of which: large banks
(1)
Std.dev. (all banks)
Std.dev. (all banks)
of which: large banks
(1)
Worst scenario Mean values
Severity of financial contagion(December 2003 )
Total assets (as a percentage of
banking system total assets)
Number of banks
Number of banks
Total assets (as a percentage of banking system total assets)
Banks failing by contagion
Loss rate
Contagion-proof banks (2) Contagious banks (3)
Table 1
12

13
The effects of contagion are highly concentrated. Up to a loss rate equal to 0.7,
financial contagion affects mainly large banks. Only if loss rates exceed that threshold do
small banks account for a significant share of the overall extent of contagion. Large banks
generally play a substantial role in the contagion mechanism, not only as banks initiating the
process (i.e. contagious banks) but also as banks affected by contagion. Among large banks
(22 at the end of 2003), most of them are contagious for a loss rate greater than 0.1.
Large banks are relatively less important in the propagation of contagion: for a loss
rate lower than 0.9, most of them are immune to contagion. Only in the worst scenario do
they account for a large share of the impact of contagion when it is measured in terms of
total assets.
Overall these results suggest that for loss rates up to 0.7 the spreading of contagion is
very limited. For loss rates greater than 0.7, financial contagion becomes significant,
although it seems unable to trigger a systemic crisis.
3.2 The effect of bail-outs within conglomerates
The results obtained in Section 3.1 are based on the hypothesis that banks cannot react
to any shock by, for example, raising capital to compensate for the losses suffered from the
failure of their interbank counterparts. While this assumption may be quite suitable for
stand-alone banks, it seems less appropriate for banks affiliated with a conglomerate. Indeed,
it seems quite reasonable to assume that parent companies may recapitalise affiliated banks
that would otherwise fail by, at least, redistributing capital resources among subsidiaries. On
one hand, this would improve the resilience of the banking system to financial contagion
since contagion losses are shared among all banks belonging to a group. On the other, banks
that are not financially linked (directly or indirectly) to the bank that fails in the first step
may suffer from losses due to financial contagion if other affiliates are financially linked to
the bank which triggers the contagion process.
In this section we analyse how results change if we assume that banks can be bailed
out by other banks belonging to the same conglomerate. Simulations are still based on
unconsolidated interbank exposures and run in the same way as before except for assuming a

14
slightly different default condition. In particular, that condition now refers to the
consolidated capital as it is assumed that losses are now shared among banks affiliated with a
certain conglomerate. 11
Let denote the set of banks affiliated with conglomerate s and the capital of
conglomerate s. Let bank
sC sk
Bz ∈ default. The capital of conglomerate s at the n-th contagion
path initiated by bank z is equal to
(3) 1 , 1
1,, ≥∀−= ∑
−∈∈
− nxkknzs DjCi
ijn
zsn
zs α
and
(4) 1 , 0 0 : 1,, ≥∀>≤∈= − nkkCiD nzs
nzss
nz
It is worth highlighting some important differences with respect to previous
simulations: the default of bank z affects the solvency of bank sCi ∈ not only because of the
losses bank i faces in lending money to bank z , but also because of the losses all other banks
affiliated with conglomerate s suffer in lending to bank z. In fact, all the losses suffered by
the banks affiliated with a conglomerate s affect the consolidated capital . This bears out
the hypothesis that, at each stage of the contagion process, banks can be bailed out by other
banks affiliated with the same conglomerate if the consolidated capital is greater than the
overall amount of the losses.
sk
When conglomerates are considered another issue arises. As there may be close
interdependencies among banks affiliated with a conglomerate, apart from those related to
financial interlinkages, it could be that a shock that hits one bank will hit all banks of the
same conglomerate. Thus, in this section, the impact of financial contagion is computed
under two different hypotheses that i) the initial shock that makes banks fail at the first stage
is bank-specific (one bank fails), or that ii) it is conglomerate-specific (i.e. one conglomerate
as a whole fails).
11 For stand-alone banks previous conditions hold.

15
Table 2 shows the results of simulations obtained for bank-specific shocks. The
comparison with the results based on individual capital (Table 1) indicates that the effect of
contagion is on average smaller if bail-outs within conglomerates are allowed. This reflects
the fact that some relatively small banks can be bailed out by their parent company. Thus,
one might conclude that banking conglomerates may lower the impact of financial contagion.
However, this result does not hold in general. In some cases, the severity of contagion
may be even greater. The results for the worst scenario indicate that, under the hypothesis of
bail-outs within conglomerates, financial contagion, for loss rates ranging from 0.4 to 0.7, is
significantly more dangerous in terms of total assets affected than in the benchmark case.
Similarly, the total assets of contagion-proof banks account for a smaller share of the banking
system’s total assets if loss rates are above 0.3 than in the benchmark case. This means that
in the latter case, the impact of contagion tends to be more concentrated than in the former.
On the contrary, the maximum impact measured in terms of the number of banks failed
by contagion is almost always less than the impact computed when bail-outs are not allowed.
The same holds for contagious banks.
This evidence reflects the fact that conglomerate bail-outs have two opposing effects
on the severity of contagion: on one hand, they imply a strengthening of subsidiaries’ capital
position, on the other, they add another channel for contagion as banks in a conglomerate
suffer not only from the losses due to their interbank linkages but also from the losses due to
all the other conglomerate affiliates’ interbank exposures. The first effect is relatively greater
for small banks, which may be more easily bailed-out by the conglomerate they are affiliated
with. This explains why the number of failed banks tends to be lower, even in the worst
scenario than in the case in which bail-outs are not allowed. On the contrary, this effect is
limited in terms of the total assets affected by contagion as banks that may be bailed out are
typically small.
All in all, the severity of contagion when bail-outs are allowed may be even greater
compared with the benchmark case.

Table 2
All banks Large banks All banks Large banks All banks Large banks All banks Large banks
0.1 0.466 0.000 0.003 0.000 0.035 4 0 0.022 0.000 0.203 98.2 760 22 19.7 11 40.2 0.466 0.000 0.004 0.000 0.036 4 0 0.024 0.000 0.210 98.2 759 22 23.0 13 50.3 0.475 0.000 0.004 0.000 0.036 5 0 0.042 0.000 0.317 98.1 749 22 31.0 18 80.4 12.767 11.830 0.049 0.037 0.698 19 5 0.145 0.019 1.236 78.1 712 14 35.9 23 100.5 12.767 11.830 0.063 0.046 0.762 19 5 0.199 0.023 1.486 67.5 682 11 41.0 26 110.6 12.786 11.830 0.075 0.055 0.817 20 5 0.243 0.027 1.689 67.4 670 11 47.7 31 130.7 12.786 11.830 0.079 0.055 0.834 28 5 0.301 0.027 2.086 65.4 643 11 47.7 31 130.8 12.786 11.830 0.099 0.069 0.924 43 5 0.381 0.034 2.553 50.8 599 6 48.6 35 130.9 12.786 11.830 0.106 0.069 0.937 58 5 0.469 0.034 3.117 49.0 566 6 53.9 41 151.0 12.827 11.830 0.110 0.069 0.947 73 5 0.538 0.034 3.637 46.4 534 6 56.2 49 15
(1) Large banks are defined as banks whose total assets are at least equal to 20 billion euro. (2) Banks which are never affected by contagion. (3) Banks which make at least one bank fail.
Worst scenario
Conglomerates and severity of financial contagion: bank-specific shocks(December 2003 )
Total assets (as a percentage of banking system total assets) Number of banks
Banks failing by contagion Contagion-proof banks (2) Contagious banks (3)
Loss rate Total assets (as a percentage of
banking system total assets)
Number of Banksof which:
large banks (1)
of which: large banks
(1)
Mean values Worst scenario Mean values
Total assets (as a percentage
of banking system total
assets)Std.dev.
(all banks)Std.dev.
(all banks)
Number of banks
16

17
On the other hand, given that the number of banks involved in the contagion process,
both contagious and contagion-affected banks, is smaller it could be easier to manage a
systemic crisis in this case.
Apart from bail-outs, bank conglomerates may damage the resilience of the interbank
market to financial contagion as they also raise the interdependence among banks. Table 3
shows that, if at the first stage of simulations a conglomerate as a whole fails instead of a
single bank, the impact of contagion is greater.
4. Maximum entropy versus observed interbank lending patterns
This section compares the results obtained in the previous section with those that
would be obtained if the matrix of bilateral exposures were not known and, by following
previous contributions, the maximum entropy method (ME) were adopted.12 This
comparison is important in two respects. Firstly, it sheds some light on the reliability of the
ME approach for assessing whether the interbank market is vulnerable to financial
contagion. Secondly, as the ME matrix represents, according to Allen and Gale’s (2000)
taxonomy, a complete market, the comparison between the results obtained using the actual
matrix of bilateral exposures and those based on the ME matrix may provide some evidence
in support of the hypothesis that the pattern of interbank linkages affects the severity of
financial contagion.
Section 4.1, after briefly recalling the main results of Allen and Gale’s (2000) model,
shows, in contrast, that complete markets are not necessarily less conducive to contagion
than incomplete markets. To do this, some simple numerical examples are considered.
Section 4.2 applies the same approach to the Italian interbank market. The results support the
analysis of Section 4.1 indicating that in the Italian case the ME method may in certain
overrate the vulnerability to contagion.
12 See Appendix B for details.

All banks Large banks (1) All banks Large banks
(1) All banks Large banks (1) All banks Large banks
(1)
0.1 0.720 0.000 0.006 0.000 0.050 6 0 0.038 0.000 0.351 97.4 755 22 38.1 11 50.2 12.703 11.830 0.042 0.033 0.630 14 5 0.083 0.014 0.808 74.6 732 14 61.1 14 70.3 12.751 11.830 0.048 0.036 0.647 17 5 0.122 0.020 1.046 70.5 710 11 65.7 17 80.4 12.767 11.830 0.085 0.060 0.837 19 5 0.191 0.031 1.401 49.2 675 5 68.9 19 90.5 12.767 11.830 0.092 0.060 0.847 19 5 0.251 0.031 1.698 44.5 644 5 71.2 21 90.6 12.786 11.830 0.096 0.060 0.852 20 5 0.291 0.031 1.834 42.7 627 5 72.4 23 90.7 12.786 11.830 0.099 0.060 0.862 28 5 0.354 0.031 2.212 41.1 598 5 72.8 24 90.8 12.786 11.830 0.122 0.077 1.010 43 5 0.442 0.032 2.929 29.2 559 4 73.1 26 90.9 12.786 11.830 0.126 0.077 1.024 58 5 0.522 0.032 3.522 28.4 530 4 77.4 29 101.0 12.827 11.830 0.127 0.077 1.030 73 5 0.574 0.032 4.050 28.0 508 4 78.3 34 10
(1) Large banks are defined as banks whose total assets are at least equal to 20 billion euro. (2) Banks which are never affected by contagion. (3) Banks which make at least one bank fail. (4) Conglomerates including at least one large bank.
Number of conglomeratesof which:
large banks (1)
of which: large
conglomerates (4)
Total assets (as a percentage of
banking system total assets)Std.dev.
(all banks)
Worst scenario Mean valuesStd.dev.
(all banks)
Worst scenario Mean values
Conglomerates and the severity of financial contagion: conglomerate-specific shocks(December 2003 )
Total assets (as a percentage of banking system total assets) Number of banks
Banks Failing by Contagion Contagion-proof banks (2) Contagious Conglomerates (3)
Loss rateTotal assets
(as a percentage of banking system total
assets)
Number of banks
Table 3
18

19
4.1 Interbank lending patterns and the theory of financial contagion
Recent theoretical contributions (Allen and Gale, 2000; Freixas, Parigi and Rochet,
2000) have highlighted that the propagation of shocks within the interbank market is
dependent on the exact pattern of banks’ financial linkages. Allen and Gale (2000) identify
two key structural characteristics of the market which affect financial contagion: market
completeness and market interconnectedness. A market is complete if each bank lends to all
the others. On the other hand, a market is perfectly interconnected if each bank is financially
linked to all the others, regardless of the kind of linkage, which may be both direct (i.e. each
bank lends to all the others) and indirect (the link that a bank could indirectly establish with
another if a third one is linked to both of them).
Those authors point out that the more complete the market the less severe is the financial
contagion and the more interconnected the market the more severe is the contagion. Thus,
there is a trade-off in terms of the propagation of contagion between completeness and
interconnectedness. These two concepts are strictly linked. A complete market is a specific
case of a perfectly interconnected market where banks are financially linked to all the others
only by direct exposures. Otherwise, incomplete markets may be differently interconnected:
they may be both perfectly or partially interconnected depending on the pattern of financial
linkages. In general, markets that are incomplete and not perfectly interconnected may differ
both in terms of completeness and interconnectedness.
The comparison between ME and observed interbank patterns may be interpreted as the
comparison between complete and incomplete markets with the notable qualification that
Allen and Gale’s (2000) model does not allow for bank heterogeneity. On the contrary, the
ME method assumes that banks spread their lending as evenly as possible, consistently with
their aggregate interbank assets and liabilities which may, in turn, differ considerable among
banks.
Let us ignore for a while the issue of bank heterogeneity, which will be dealt with later.
According to Allen and Gale’s (2000) taxonomy, the comparison between actual and ME
bilateral exposures may lead to the following cases,
(a) the (actual) market is complete,
(b) the (actual) market is incomplete but perfectly interconnected, and
(c) the (actual) market is incomplete but not perfectly connected.

20
In the first case, the ME matrix of bilateral exposures and the observed ones coincide.
Thus, the measure of the impact of financial contagion is not affected by the ME hypothesis.
On the other hand, if the market is incomplete but perfectly interconnected (case b), ME
leads to an undervaluation of financial contagion. To show this consider Figure1, which
represents the ME matrix of bilateral exposures under the assumption that, for each bank,
total interbank liabilities and total interbank assets are equal.
This assumption is needed only to simplify the maximisation of the entropy. It does not
imply any loss of generality as contagion is based on gross exposures. Let us assume also
that bank capital is equal to k and that a bank fails if losses exceed its capital and reserves.
Thus, if bank A fails due to a specific shock13 it is easy to verify that there is no contagion
unless the loss rate is greater than 0.5 (i.e. losses are greater than k). In that case, all banks
fail by contagion (Table 4).
We now compare these results with those obtained for case b) (Figure 2).14 It is easy to
verify that all banks in the market fail if the market is incomplete and perfectly connected
unless the loss rate is lower than 0.2 (1/6 to be precise). This confirms that, if the actual
market is incomplete but perfectly connected, the maximum entropy method tends to
underrate the extent of contagion (in this specific case when the loss rate ranges from 0.2 to
0.5).
This is due to a typical effect of risk diversification. In fact, while complete markets
and incomplete but perfectly connected markets do not differ in terms of the number of banks
potentially affected by contagion (as a shock may propagate from each bank to all the others
in both cases), complete markets allow banks to better diversify credit risk than incomplete
ones, given that each bank lends directly to all the other banks instead of holding the
financial assets issued by a limited number of counterparts.
13 In the absence of bank heterogeneity the identity of the bank that fails due to some idiosyncratic shock is
not relevant. 14 This corresponds to the incomplete market structure depicted in Allen and Gale’s (2000) Figure 1.

21
Figure 1
A complete market (maximum entropy)
Bank A Bank B Bank C Bank D Total assets
Bank A 0 2k 2k 2k 6kBank B 2k 0 2k 2k 6kBank C 2k 2k 0 2k 6kBank D 2k 2k 2k 0 6k
Total liabilities 6k 6k 6k 6k 24k
Table 4
Financial contagion: complete versus incomplete markets (number of banks failing by contagion)
Complete markets
(fig.1)
Incomplete but perfectly connected
market (fig. 2)
Incomplete and
disconnected market (fig. 3)
Complete markets
(fig.4)
Incomplete and
disconnected market (fig. 4)
0.1 0 0 0 0 00.2 0 3 1 0 10.3 0 3 1 0 10.4 0 3 1 3 10.5 0 3 1 3 10.6 3 3 1 3 10.7 3 3 1 3 10.8 3 3 1 3 10.9 3 3 1 3 11.0 3 3 1 3 1
Symmetric case
Loss Rate
Asymmetric case

22
Figure 2
An incomplete but perfectly connected market
Bank A Bank B Bank C Bank D Total assetsBank A 0 6k 0 0 6kBank B 0 0 6k 0 6kBank C 0 0 0 6k 6kBank D 6k 0 0 0 6k
Total liabilities 6k 6k 6k 6k 24k
Consider now case c) as depicted in Figure3.15 In this case it is straightforward to
verify that the maximum entropy method does not affect the measure of contagion if loss
rates are lower than 0.2 (1/6); it underrates the scope for contagion if loss rates range from
0.2 to 0.5 and it overrates it for loss rates greater than 0.5.
The reason why, in spite of lower market concentration, complete markets may , ceteris
paribus, be even less resilient to financial contagion than incomplete ones is that, if the size
of the interbank market is sufficiently large with respect to bank capital, there could be
limited scope for risk diversification, especially for large loss rates, from spreading interbank
exposures over a great number of counterparts. It is easy to verify that if the total amount of
interbank assets held by each bank were less than 3k, complete markets would be totally
immune to contagion, thus representing, in line with Allen and Gale (2000), the most
resilient market structure. For larger interbank markets, the sole effect of diversification is
that market interconnectedness rises, favouring the propagation of contagion.
In general, for N homogenous banks the interbank assets-to-capital ratio has to be at
least equal to (N – 1) to make the failure of a bank propagate within the market. However,
actual interbank markets are not so large. On the other hand, according to the evidence
provided by those authors who have resorted to the maximum entropy method, even
complete markets are vulnerable to financial contagion. The reason for this result is that,
15 This corresponds to the disconnected incomplete market structure depicted in Allen and Gale’s (2000)
Figure 3. This market is made of two totally disconnected segments: to one of them belong bank A and B, to the other bank C and D.

23
although markets are assumed to be complete, the ME does not rule out bank heterogeneity
and, as shown below, the condition for contagion propagation then becomes less stringent.
Figure 3
An incomplete and disconnected market
Bank A Bank B Bank C Bank D Total assetsBank A 0 6k 0 0 6kBank B 6k 0 0 0 6kBank C 0 0 0 6k 6kBank D 0 0 6k 0 6k
Total liabilities 6k 6k 6k 6k 24k
To show how the resilience of the market may deteriorate when bank heterogeneity is
allowed, let us consider the interbank market depicted in Figure 4, which is equal to the one
represented in Figure 3 apart from the fact that banks differ in terms of interbank asset-to-
capital ratio. In this case, the identity of the bank that fails due to some idiosyncratic shock is
not irrelevant any more. The maximum impact of financial contagion is obtained when bank
A defaults (i.e. the bank that is better capitalised than the others). For a loss rate greater than
0.1 the failure of bank A makes only bank B fail by contagion according to the observed
matrix (panel a).
On the other hand, bank A makes all other banks fail unless the loss rate is lower than
0.3. Thus, the two matrices produce the same result up to a loss rate equal to 0.2, the
maximum entropy method underrates the severity of contagion for loss rates ranging from
0.1 to 0.3 and overrates the extent of contagion if the loss rate is greater than 0.3. This means
that, by allowing for some heterogeneity in banks’ capitalisation, the maximum impact of
financial contagion tends to be overstated for lower loss rates than in the case in which banks
are homogenous (loss rates greater than 0.5). It may be also verified that in this case, even if
each bank held an amount of interbank assets lower than 3k , complete markets would not be
immune to contagion as they were in the symmetric case (Figure 1).

24
Figure 4
Bank Heterogeneity
a) observed matrix of bilateral exposures
An incomplete and disconnected market
Bank A Bank B Bank C Bank D Total assetsBank A 0 6k 0 0 6kBank B 6k 0 0 0 6kBank C 0 0 0 6k 6kBank D 0 0 6k 0 6k
Total liabilities 6k 6k 6k 6k 24kCapital and reserves 2k 2/3k 2/3k 2/3k 4k
b) ME matrix of bilateral exposures
A complete market (maximum entropy)
Bank A Bank B Bank C Bank D Total assets
Bank A 0 2k 2k 2k 6kBank B 2k 0 2k 2k 6kBank C 2k 2k 0 2k 6kBank D 2k 2k 2k 0 6k
Total liabilities 6k 6k 6k 6k 24kCapital and reserves 2k 2/3k 2/3k 2/3k 4k
The main conclusion of this section is that, apart from the cases in which the actual
market is complete or is incomplete and perfectly connected, ME may involve, for high loss
rates, an overstatement of the severity of financial contagion. This may also happen more
easily when banks are heterogeneous.16
This possible effect seems to be quite realistic as there are at least three reasons why
actual interbank markets are, in general, incomplete and to some extent disconnected. First,
the existence of informational asymmetries or, in general, transaction costs may prevent
16 This result is in line with Iori, Jafarey and Padilla (2006).

25
banks from fully exploiting their capacity to diversify interbank counterparts. Second, for
banks that are affiliated with conglomerates the multiple money centre structure seems to be
suitable to exploit economies of scale in liquidity management. Finally, in many countries
banks differ in size considerably and therefore the assumption that the interbank market is
made of homogenous banks seems unrealistic.
4.2 The Italian case
Some characteristics of the Italian interbank market suggest that it is far from being a
complete market and that the adoption of the ME method may therefore significantly affect
the assessment of financial contagion. Indeed, the Italian interbank market fits quite well in
the multiple money centre structure described in Freixas, Parigi and Rochet (2000), in which
some banks trade with a bank (the money centre) while they do not trade with each other: at
the end of 2003, more than two thirds of interbank claims were traded among banks
belonging to the same group. As far as interconnectedness is concerned, banks were on
average financially linked, both directly and indirectly through other banks, to one half of
the total number of counterparts.17
The comparison of the severity of financial contagion in the Italian interbank market by
using, alternatively, the maximum entropy (ME) matrix and the observed matrix of bilateral
exposures (Figures 5-9) confirms that ME may provide a quite different measure of financial
contagion.
Figure 5 supports the hypothesis that complete markets are more resilient to contagion
than incomplete ones, at least in terms of contagious banks. In this case, one can argue that a
smaller number of banks have to be monitored in order to avoid the propagation of contagion
within the banking system if the market were complete.
Figures 6 and 7 indicate that the ME method leads, on average, to an undervaluation of
the severity of financial contagion, both in terms of the number of banks and of the total
assets affected by contagion, if the loss rate is not above 0.8 and 0.9, respectively. Similarly,
according to Figures 8 and 9, ME underrates the maximum impact of financial contagion,

26
measured by the maximum number of banks failed and the maximum share of the banking
system’s total assets affected by contagion, for loss rates not greater than 0.7.
Figure 5
Number of contagious banks(December 2003)
0
10
20
30
40
50
60
70
80
0.1 0.2 0.3 0.4 0.5 0.6 0.7 0.8 0.9 1.0
Loss rates
observed bilateral exposures ME bilateral exposures
To sum up, the evidence suggests that in most cases ME tends to underrate the impact of
financial contagion. On the contrary, for high loss rates ME may imply an overvaluation of
the severity of contagion.
A further complication is that the lowest loss rate at which ME overvaluates the severity
of financial contagion depends on the characteristics of the market. As shown in Section 4.1,
that critical value may also be quite low. From the previous discussion it may also be argued
that the lowest loss rate at which ME underrates the extent of contagion is negatively related
to the asymmetry among market participants in terms of the amount of bilateral exposures
and to the size and the disconnectedness of the interbank market. In other words, when the
interbank market is made up of a few big players raising funds from many relatively small
counterparts, interbank exposures account for a large share of banks’ capital and the market
17 The computation of a measure of interconnectedness for the Italian interbank market refers only to those
financial linkages such that contagion is at least possible (i.e. such that for a loss rate equal to 1, interbank exposures exceed bank capital).

27
Figure 6
Banks failing by contagionNumber of banks affected by contagion - mean values
(December 2003)
0.0
0.5
1.0
1.5
2.0
0.1 0.2 0.3 0.4 0.5 0.6 0.7 0.8 0.9 1.0
Loss rates
observed bilateral exposures ME bilateral exposures
Figure 7
Banks failing by contagionPercentage of banking system total assets affected by contagion - mean values
(December 2003)
0.00
0.05
0.10
0.15
0.20
0.1 0.2 0.3 0.4 0.5 0.6 0.7 0.8 0.9 1.0
Loss rates
observed bilateral exposures ME bilateral exposures

28
Figure 8 Banks failing by contagion
Number of banks affected by contagion - worst scenario(December 2003)
0
50
100
150
200
0.1 0.2 0.3 0.4 0.5 0.6 0.7 0.8 0.9 1.0
Loss rates
observed bilateral exposures ME bilateral exposures
Figure 9
Banks failing by contagionPercentage of banking system total assets affected by contagion - worst scenario
(December 2003)
0
10
20
30
40
50
0.1 0.2 0.3 0.4 0.5 0.6 0.7 0.8 0.9 1.0
Loss rates
observed bilateral exposures ME bilateral exposures

29
is highly segmented, ME may then be of little help in assessing the severity of financial
contagion as it would overstate the impact of financial contagion even for low loss rates. As a
consequence, in that situation the ME approach might not be very reliable even for assessing
whether a danger of financial contagion exists or not.
The comparison between the ME and actual measures of financial contagion has been
done by the Wilcoxon signed-rank test (Table 5). In particular, this test compares, for each
bank i and a given loss rate, the severity of contagion triggered by its default ( ), computed
on the base of the actual matrix of bilateral exposures, with the severity of contagion
triggered by the same bank i, calculated on the base of the ME matrix ( ). The null
hypothesis is that the median of the differences ( ) is zero. Table 5 reports the
results for both the distribution of the number of banks failing by contagion and the
distribution of the total assets affected by contagion. The results indicate that the ME method
tends to provide a measure of the severity of contagion that is statistically different from the
one obtained on the base of actual bilateral exposures.
iΩ
MEiΩ
MEii Ω−Ω
Table 5 A test for the equality of ME and observed
financial contagion distributions (1) (December 2003)
0.1 0.2 0.3 0.4 0.5 0.6 0.7 0.8 0.9 1.0
Wilcoxon signed-rank test 1.517 2.516 3.061 2.932 3.250 4.638 4.150 2.946 2.514 3.312p-value 0.1292 0.0119 0.0022 0.0034 0.0012 0.0000 0.0000 0.0032 0.0119 0.0009
Wilcoxon signed-rank test 2.535 3.462 3.735 3.850 4.193 5.530 5.237 4.692 3.945 4.366p-value 0.0112 0.0005 0.0002 0.0001 0.0000 0.0000 0.0000 0.0000 0.0000 0.0000
Wilcoxon signed-rank test 1.775 1.678 2.123 2.263 2.912 3.343 3.346 2.251 2.311 3.234p-value 0.0760 0.0934 0.0337 0.0236 0.0036 0.0008 0.0008 0.0244 0.0209 0.0012
Wilcoxon signed-rank test 2.856 2.170 2.740 3.244 3.664 4.284 4.635 4.280 4.176 4.788p-value 0.0043 0.0300 0.0061 0.0012 0.0002 0.0000 0.0000 0.0000 0.0000 0.0000
Contagious banks
Total assets affected by contagion
Number of banks affected by contagion
Loss rate
All banks
Contagious banks
All banks
(1) Distributions refers to a measure of the propagation of financial contagion in the interbank market computed for each bank failing by an idiosyncratic shock.

30
5. Conclusion
This paper has investigated whether interbank linkages may be conducive to financial
contagion. The contribution to the existing literature is twofold. Firstly, it enriches the
evidence so far available on financial contagion by providing the first comprehensive
analysis for the Italian interbank market. To this end, unlike previous contributions, which
are based on ME bilateral exposures, the paper is based on a unique data set of actual
bilateral exposures. It has also taken into account the effect of banking conglomerates in
terms of banking system stability. This aspect has been ignored by previous works.
Secondly, the paper compares the results obtained by using ME bilateral exposures with
those obtained on the base of actual bilateral exposures. This allows us to show how the ME
method widely used in the literature may affect the analysis of financial contagion.
The main result is that: the Italian interbank market is conducive to financial
contagion. However, even for high loss rates, the default of banks raising funds in the
interbank market hardly triggers a systemic crisis. Only in some extreme cases does the
severity of financial contagion seem considerable. Simulations also indicate that, by
allowing conglomerates to recapitalise their affiliates which otherwise would fail, the
resilience to financial contagion of the banking system tends to improve. However, in some
cases the fact that losses are shared among banks affiliated to a conglomerate, adding
another channel for contagion means that banking stability may even worsen.
The paper also indicates that the maximum entropy procedure, widely adopted in
previous contributions, may overvalue the severity of contagion. This contrasts with the
common view that complete markets are more resilient to financial contagion. In some
circumstances, depending on the size of the interbank market, the presence of large players,
and the loss rate, complete markets may be even more conducive to contagion than
incomplete ones. In that case, the benefits from diversifying the interbank exposures are
more than counterbalanced by the costs due the fact that each bank establishes a large
number of financial linkages, thus making a domino effect viable.

31
References
Allen F. and Gale D. (2000), “Financial Contagion”, Journal of Political Economy, 108, 1-
34.
Angelini P., Maresca G. and Russo D. (1996), “Systemic Risk in the Netting System”,
Journal of Banking and Finance, 20, 853-886.
Bech M. L., Madsen B. and Natorp L. (2002), “Systemic Risk in the Danish Interbank
Netting System”, Danmarks Nationalbank Working Papers, 8.
Bhattacharya S. and Gale D. (1987), “Preference shocks, liquidity and central bank policy. "
In New Approaches to Monetary Economics, edited by Barnett and Singleton,
Cambridge University Press, 1987.
Blavarg M. and Nimander P. (2002), “Interbank Exposures and Systemic Risk”, Sveriges
Riksbank, Economic Review, 2, 19-45.
Censor, Y. and Zenios, S.A. (1997), Parallel optimization, Oxford University Press.
Chari V.V. and Jagannathan R. (1988), “Banking Panics, Information, and Rational
Expectation Equilibrium”, Journal of Finance, 3, 749-760.
Cocco J.F, Gomes F.J and Martins N.C. (2003), “Lending Relationships in the Interbank
Market”, mimeo.
De Bandt O. and Hartmann P. (2000), “Systemic Risk: A Survey”, European Central Bank,
Working Paper Series 35 (November 2000).
Degryse H. and Nguyen G. (2007), “Interbank Exposures: An Empirical Examination of
Systemic Risk in the Belgian Banking System”, International Journal of Central
Banking, 3, 123-171
Diamond D.W. and Dybvig P. H. (1983), “Bank Runs, Deposit Insurance and Liquidity”,
Journal of Political Economy, 3, 401-419.
Elsinger H., Lehar A. and Summer M. (2006), “Risk Assessment for Banking Systems”,
Management Science, 52, 1301ì1314.
Freixas X., Parigi B. and Rochet J.C. (2000), “Systemic Risk, Interbank Relations and
Liquidity Provision by the Central Bank”, Journal of Money, Credit and Banking, 32,
611-638.
Furfine C. H. (2003), “Interbank Exposures: Quantifying the Risk of Contagion”, Journal of
Money, Credit and Banking, 35, 111-28.

32
Iori G., Jafarey S. and Padilla F.G. (2006), “Systemic Risk on the Interbank Market”,
Journal of Economic Behavior & Organization, 61, 525-542.
Jacklin C. J. and Bhattacharya S. (1988), “Distinguishing Panics and Information-Based
Bank Runs: Welfare and Policy Implications”, Journal of Political Economy, 3,568-
592.
James C. (1991), “The Loss Realized in Bank Failures”, Journal of Finance, 46, 1223-42.
Kaufman G.G. (1994), “Bank Contagion: A Review of the Theory and Evidence”, Journal of
Financial Services Research, 8, 123-50.
Rochet J.C. and Tirole J. (1996), “Interbank Lending and Systemic Risk”, Journal of Money
Credit and Banking, 28, 733-62.
Sheldon G. and Maurer M. (1998), “Interbank Lending and Systemic Risk: An Empirical
Analysis for Switzerland”, Swiss Journal of Economics and Statistics, 134, 685-704.
Upper C. (2007), “Using Counterfactual Simulations to Assess the Danger of Contagion in
Interbank Markets”, Bank for International Settlements, Working Paper, 234.
Upper C. and Worms A. (2004), “Estimating Bilateral Exposures in the German Interbank
Market: Is there a Danger of Contagion?”, European Economic Review, 8, 827-49
09/02.
van Lelyveld, I. and Liedorp F. (2006) “Interbank Contagion in the Dutch Banking Sector: A
Sensitivity Analysis”, International Journal of Central Banking, 2, 99-133
Wells S. (2004), “Financial Interlinkages in the United Kingdom’s Interbank Market and the
Risk of Contagion”, Bank of England, Working Paper , 230.
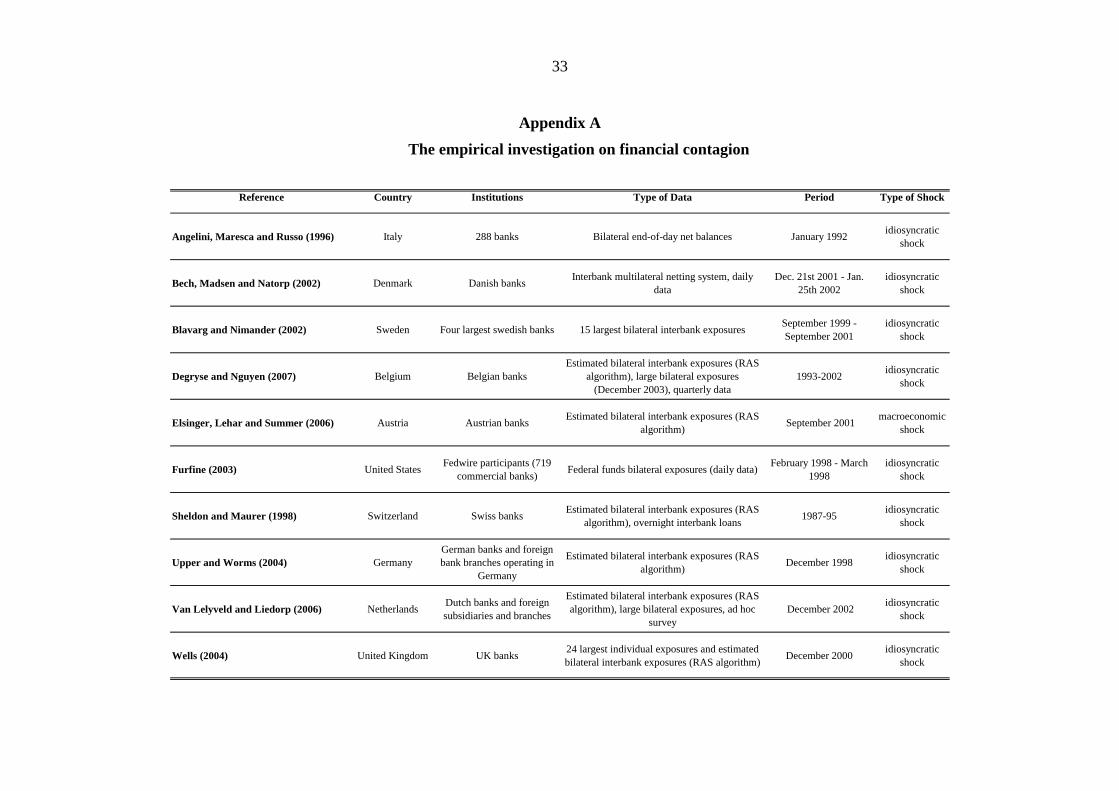
Reference Country Institutions Type of Data Period Type of Shock
Angelini, Maresca and Russo (1996) Italy 288 banks Bilateral end-of-day net balances January 1992 idiosyncratic shock
Bech, Madsen and Natorp (2002) Denmark Danish banks Interbank multilateral netting system, daily data
Dec. 21st 2001 - Jan. 25th 2002
idiosyncratic shock
Blavarg and Nimander (2002) Sweden Four largest swedish banks 15 largest bilateral interbank exposures September 1999 - September 2001
idiosyncratic shock
Degryse and Nguyen (2007) Belgium Belgian banksEstimated bilateral interbank exposures (RAS
algorithm), large bilateral exposures (December 2003), quarterly data
1993-2002 idiosyncratic shock
Elsinger, Lehar and Summer (2006) Austria Austrian banks Estimated bilateral interbank exposures (RAS algorithm) September 2001 macroeconomic
shock
Furfine (2003) United States Fedwire participants (719 commercial banks) Federal funds bilateral exposures (daily data) February 1998 - March
1998idiosyncratic
shock
Sheldon and Maurer (1998) Switzerland Swiss banks Estimated bilateral interbank exposures (RAS algorithm), overnight interbank loans 1987-95 idiosyncratic
shock
Upper and Worms (2004) GermanyGerman banks and foreign bank branches operating in
Germany
Estimated bilateral interbank exposures (RAS algorithm) December 1998 idiosyncratic
shock
Van Lelyveld and Liedorp (2006) Netherlands Dutch banks and foreign subsidiaries and branches
Estimated bilateral interbank exposures (RAS algorithm), large bilateral exposures, ad hoc
survey December 2002 idiosyncratic
shock
Wells (2004) United Kingdom UK banks 24 largest individual exposures and estimated bilateral interbank exposures (RAS algorithm) December 2000 idiosyncratic
shock
The empirical investigation on financial contagion
Appendix A
33

34
Appendix B
The maximum entropy methodology for obtaining interbank bilateral exposures
The interbank linkages may be represented by the following NN × matrix
⎥⎥⎥⎥⎥⎥
⎦
⎤
⎢⎢⎢⎢⎢⎢
⎣
⎡
=
NNNjN
iNiji
Nj
xxx
xxx
xxx
X
LL
MOMNM
L
MOMNM
LL
1
1
1111
...
where are, respectively, the total amount of money bank i lends to
other banks and bank j raises from other banks. In the absence of any assumption about the
distribution of bilateral exposures, the matrix X cannot be identified as unknowns
have to be estimated.
∑∑ == == Ni ijj
Nj iji xlxa 11 ,
NN 22 −
The common approach is to assume that banks maximise the dispersion of their
interbank exposures. Following an appropriate normalisation this implies that bilateral
exposures are given by a simple solution: . However, this solution would imply that
for banks that are both lender and borrower in the market they lend to themselves. In order
to rule out this outcome it is necessary to assume that .
ji laxij=*
jixij
=∀= ,0*
The problem is then to estimate bilateral exposures such that the matrix X obtained by
the maximisation becomes as close as possible to matrix *X . This is generally obtained by
minimising the cross-entropy between the two matrices:
jixjixlxax
ts
xx
ijijNj jij
Ni iij
Ni
Nj
ij
ijx ij
=∀=≠∀≥==
⎟⎟⎠
⎞⎜⎜⎝
⎛
∑∑
∑ ∑
==
= =
0ˆ 0ˆ ˆ ˆ
..
ˆlnmin
11
1 1 *ˆ
This problem has been solved numerically using the RAS algorithm.18
18 See Censor and Zenos (1997) for details.

(*) Requestsforcopiesshouldbesentto:Bancad’Italia–ServizioStudi–DivisioneBibliotecaepubblicazioni–ViaNazionale,91–00184Rome(fax00390647922059).TheyareavailableontheInternetwww.bancaditalia.it.
RECENTLYPUBLISHED“TEMI”(*)
N. 617 – A politicy-sensible core-inflation measure for the euro area, byStefanoSivieroandGiovanniVeronese(February2007).
N. 618 – Le opinioni degli italiani sull’evasione fiscale, by Luigi Cannari and GiovanniD'Alessio(February2007)
N. 619 – Memory for prices and the euro cash changeover: An analysis for cinema prices in Italy,byVincenzoCestari,PaoloDelGiovaneandCleliaRossi-Arnaud(February2007).
N. 620 – Intertemporal consumption choices, transaction costs and limited participation in financial markets: Reconciling data and theory,byOrazioP.AttanasioandMonicaPaiella(April2007).
N. 621 – Why demand uncertainty curbs investment: Evidence from a panel of Italian manufacturing firms, by Maria Elena Bontempi, Roberto Golinelli and GiuseppeParigi(April2007).
N. 622 – Employment, innovation and productivity: Evidence from Italian microdata, byBronwynH.Hall,FrancescaLottiandJacquesMairesse(April2007).
N. 623 – Measurement of income distribution in supranational entities: The case of the European Union,byAndreaBrandolini(April2007).
N. 624 – Un nuovo metodo per misurare la dotazione territoriale di infrastrutture di trasporto,byGiovannaMessina(April2007).
N. 625 – The forgone gains of incomplete portfolios, byMonicaPaiella(April2007).N. 626 – University drop-out: The case of Italy, by Federico Cingano and Piero Cipollone
(April2007).N. 627 – The sectoral distribution of money supply in the euro area, byGiuseppeFerrero,
AndreaNobiliandPatriziaPassiglia(April2007).N. 628 – Changes in transport and non-transport costs: Local vs global impacts in a spatial
network,byKristianBehrens,AndreaR.Lamorgese,GianmarcoI.P.OttavianoandTakatoshiTabuchi(April2007).
N. 629 – Monetary policy shocks in the euro area and global liquidity spillovers, by JoãoSousaandAndreaZaghini(June2007).
N. 630 – Endogenous growth and trade liberalization between asymmetric countries, byDanielaMarconi(June2007).
N. 631 – New Eurocoin: Tracking economic growth in real time,byFilippoAltissimo,RiccardoCristadoro,MarioForni,MarcoLippiandGiovanniVeronese(June2007).
N. 632 – Oil supply news in a VAR: Information from financial markets,byAlessioAnzuini,PatrizioPaganoandMassimilianoPisani(June2007).
N. 633 – The reliability of EMU fiscal indicators: Risks and safeguards,byFabrizioBalassone,DanieleFrancoandStefaniaZotteri(June2007).
N. 634 – Prezzi delle esportazioni, qualità dei prodotti e caratteristiche di impresa: un’analisi su un campione di imprese italiane,byMatteoBugamelli(June2007).
N. 635 – Openness to trade and industry cost dispersion: Evidence from a panel of Italian firms,byMassimoDelGatto,GianmarcoI.P.OttavianoandMarcelloPagnini(June2007).
N. 636 – The weighting process in the SHIW,byIvanFaiellaandRominaGambacorta(June2007).
N. 637 – Emerging markets spreads and global financial conditions, byAlessio Ciarlone,PaoloPiselliandGiorgioTrebeschi(June2007).
N. 638 – Comparative advantage patterns and domestic determinants in emerging countries: An analysis with a focus on technology, by Daniela Marconi and Valeria Rolli(September2007).
N. 639 – The generation gap: Relative earnings of young and old workers in Italy,byAlfonsoRosoliaandRobertoTorrini(September2007).
N. 640 – The financing of small innovative firms: The Italian case,bySilviaMagri(September2007).

"TEMI" LATER PUBLISHED ELSEWHERE
2004
P. ANGELINI and N. CETORELLI, Gli effetti delle modifiche normative sulla concorrenza nel mercato creditizio, in F. Panetta (eds.), Il sistema bancario negli anni novanta: gli effetti di una trasformazione, Bologna, il Mulino, TD No. 380 (October 2000).
P. CHIADES and L. GAMBACORTA, The Bernanke and Blinder model in an open economy: The Italian case, German Economic Review, Vol. 5, 1, pp. 1-34, TD No. 388 (December 2000).
M. BUGAMELLI and P. PAGANO, Barriers to investment in ICT, Applied Economics, Vol. 36 , 20, pp. 2275-2286, TD No. 420 (October 2001).
F. BUSETTI, Preliminary data and econometric forecasting: An application with the Bank of Italy quarterly model, CEPR Discussion Paper, 4382, TD No. 437 (December 2001).
A. BAFFIGI, R. GOLINELLI and G. PARIGI, Bridge models to forecast the euro area GDP, International Journal of Forecasting, Vol. 20, 3, pp. 447-460, TD No. 456 (December 2002).
D. AMEL, C. BARNES, F. PANETTA and C. SALLEO, Consolidation and efficiency in the financial sector: A review of the international evidence, Journal of Banking and Finance, Vol. 28, 10, pp. 2493-2519, TD No. 464 (December 2002).
M. PAIELLA, Heterogeneity in financial market participation: Appraising its implications for the C-CAPM, Review of Finance, Vol. 8, 3, pp. 445-480, TD No. 473 (June 2003).
F. CINGANO and F. SCHIVARDI, Identifying the sources of local productivity growth, Journal of the European Economic Association, Vol. 2, 4, pp. 720-742, TD No. 474 (June 2003).
E. BARUCCI, C. IMPENNA and R. RENÒ, Monetary integration, markets and regulation, Research in Banking and Finance, 4, pp. 319-360, TD No. 475 (June 2003).
G. ARDIZZI, Cost efficiency in the retail payment networks: first evidence from the Italian credit card system, Rivista di Politica Economica, Vol. 94, 3, pp. 51-82, TD No. 480 (June 2003).
E. BONACCORSI DI PATTI and G. DELL’ARICCIA, Bank competition and firm creation, Journal of Money Credit and Banking, Vol. 36, 2, pp. 225-251, TD No. 481 (June 2003).
R. GOLINELLI and G. PARIGI, Consumer sentiment and economic activity: a cross country comparison, Journal of Business Cycle Measurement and Analysis, Vol. 1, 2, pp. 147-170, TD No. 484 (September 2003).
L. GAMBACORTA and P. E. MISTRULLI, Does bank capital affect lending behavior?, Journal of Financial Intermediation, Vol. 13, 4, pp. 436-457, TD No. 486 (September 2003).
F. SPADAFORA, Il pilastro privato del sistema previdenziale: il caso del Regno Unito, Economia Pubblica, 34, 5, pp. 75-114, TD No. 503 (June 2004).
C. BENTIVOGLI and F. QUINTILIANI, Tecnologia e dinamica dei vantaggi comparati: un confronto fra quattro regioni italiane, in C. Conigliani (eds.), Tra sviluppo e stagnazione: l’economia dell’Emilia-Romagna, Bologna, Il Mulino, TD No. 522 (October 2004).
G. GOBBI and F. LOTTI, Entry decisions and adverse selection: An empirical analysis of local credit markets, Journal of Financial Services Research, Vol. 26, 3, pp. 225-244, TD No. 535 (December 2004).
E. GAIOTTI and F. LIPPI, Pricing behavior and the introduction of the euro: Evidence from a panel of restaurants, Giornale degli Economisti e Annali di Economia, 2004, Vol. 63, 3-4, pp. 491-526, TD
No. 541 (February 2005).
L. GAMBACORTA, How do banks set interest rates?, NBER Working Paper, 10295, TD No. 542 (February 2005).
A. CICCONE, F. CINGANO and P. CIPOLLONE, The private and social return to schooling in Italy, Giornale degli Economisti e Annali di Economia, Vol. 63, 3-4, pp. 413-444, TD No. 569 (January 2006).

2005
L. DEDOLA and F. LIPPI, The monetary transmission mechanism: Evidence from the industries of 5 OECD countries, European Economic Review, 2005, Vol. 49, 6, pp. 1543-1569, TD No. 389 (December 2000).
D. Jr. MARCHETTI and F. NUCCI, Price stickiness and the contractionary effects of technology shocks. European Economic Review, Vol. 49, 5, pp. 1137-1164, TD No. 392 (February 2001).
G. CORSETTI, M. PERICOLI and M. SBRACIA, Some contagion, some interdependence: More pitfalls in tests of financial contagion, Journal of International Money and Finance, Vol. 24, 8, pp. 1177-1199, TD No. 408 (June 2001).
GUISO L., L. PISTAFERRI and F. SCHIVARDI, Insurance within the firm. Journal of Political Economy, Vol. 113, 5, pp. 1054-1087, TD No. 414 (August 2001)
R. CRISTADORO, M. FORNI, L. REICHLIN and G. VERONESE, A core inflation indicator for the euro area, Journal of Money, Credit, and Banking, Vol. 37, 3, pp. 539-560, TD No. 435 (December 2001).
F. ALTISSIMO, E. GAIOTTI and A. LOCARNO, Is money informative? Evidence from a large model used for policy analysis, Economic & Financial Modelling, Vol. 22, 2, pp. 285-304, TD No. 445 (July 2002).
G. DE BLASIO and S. DI ADDARIO, Do workers benefit from industrial agglomeration? Journal of regional Science, Vol. 45, (4), pp. 797-827, TD No. 453 (October 2002).
G. DE BLASIO and S. DI ADDARIO, Salari, imprenditorialità e mobilità nei distretti industriali italiani, in L. F. Signorini, M. Omiccioli (eds.), Economie locali e competizione globale: il localismo industriale italiano di fronte a nuove sfide, Bologna, il Mulino, TD No. 453 (October 2002).
R. TORRINI, Cross-country differences in self-employment rates: The role of institutions, Labour Economics, Vol. 12, 5, pp. 661-683, TD No. 459 (December 2002).
A. CUKIERMAN and F. LIPPI, Endogenous monetary policy with unobserved potential output, Journal of Economic Dynamics and Control, Vol. 29, 11, pp. 1951-1983, TD No. 493 (June 2004).
M. OMICCIOLI, Il credito commerciale: problemi e teorie, in L. Cannari, S. Chiri e M. Omiccioli (eds.), Imprese o intermediari? Aspetti finanziari e commerciali del credito tra imprese in Italia, Bologna, Il Mulino, TD No. 494 (June 2004).
L. CANNARI, S. CHIRI and M. OMICCIOLI, Condizioni di pagamento e differenziazione della clientela, in L. Cannari, S. Chiri e M. Omiccioli (eds.), Imprese o intermediari? Aspetti finanziari e commerciali del credito tra imprese in Italia, Bologna, Il Mulino, TD No. 495 (June 2004).
P. FINALDI RUSSO and L. LEVA, Il debito commerciale in Italia: quanto contano le motivazioni finanziarie?, in L. Cannari, S. Chiri e M. Omiccioli (eds.), Imprese o intermediari? Aspetti finanziari e commerciali del credito tra imprese in Italia, Bologna, Il Mulino, TD No. 496 (June
2004).
A. CARMIGNANI, Funzionamento della giustizia civile e struttura finanziaria delle imprese: il ruolo del credito commerciale, in L. Cannari, S. Chiri e M. Omiccioli (eds.), Imprese o intermediari? Aspetti finanziari e commerciali del credito tra imprese in Italia, Bologna, Il Mulino, TD No. 497 (June
2004).
G. DE BLASIO, Credito commerciale e politica monetaria: una verifica basata sull’investimento in scorte, in L. Cannari, S. Chiri e M. Omiccioli (eds.), Imprese o intermediari? Aspetti finanziari e commerciali del credito tra imprese in Italia, Bologna, Il Mulino, TD No. 498 (June 2004).
G. DE BLASIO, Does trade credit substitute bank credit? Evidence from firm-level data. Economic notes, Vol. 34, 1, pp. 85-112, TD No. 498 (June 2004).
A. DI CESARE, Estimating expectations of shocks using option prices, The ICFAI Journal of Derivatives Markets, Vol. 2, 1, pp. 42-53, TD No. 506 (July 2004).
M. BENVENUTI and M. GALLO, Il ricorso al "factoring" da parte delle imprese italiane, in L. Cannari, S. Chiri e M. Omiccioli (eds.), Imprese o intermediari? Aspetti finanziari e commerciali del credito tra imprese in Italia, Bologna, Il Mulino, TD No. 518 (October 2004).
L. CASOLARO and L. GAMBACORTA, Redditività bancaria e ciclo economico, Bancaria, Vol. 61, 3, pp. 19-27, TD No. 519 (October 2004).
F. PANETTA, F. SCHIVARDI and M. SHUM, Do mergers improve information? Evidence from the loan market, CEPR Discussion Paper, 4961, TD No. 521 (October 2004).
P. DEL GIOVANE and R. SABBATINI, La divergenza tra inflazione rilevata e percepita in Italia, in P. Del Giovane, F. Lippi e R. Sabbatini (eds.), L'euro e l'inflazione: percezioni, fatti e analisi, Bologna, Il Mulino, TD No. 532 (December 2004).

R. TORRINI, Quota dei profitti e redditività del capitale in Italia: un tentativo di interpretazione, Politica economica, Vol. 21, 1, pp. 7-41, TD No. 551 (June 2005).
M. OMICCIOLI, Il credito commerciale come “collateral”, in L. Cannari, S. Chiri, M. Omiccioli (eds.), Imprese o intermediari? Aspetti finanziari e commerciali del credito tra imprese in Italia, Bologna, il Mulino, TD No. 553 (June 2005).
L. CASOLARO, L. GAMBACORTA and L. GUISO, Regulation, formal and informal enforcement and the development of the household loan market. Lessons from Italy, in Bertola G., Grant C. and Disney R. (eds.) The Economics of Consumer Credit: European Experience and Lessons from the US, Boston, MIT Press, TD No. 560 (September 2005).
S. DI ADDARIO and E. PATACCHINI, Lavorare in una grande città paga, ma poco, in Brucchi Luchino (ed.), Per un’analisi critica del mercato del lavoro, Bologna , Il Mulino, TD No. 570 (January 2006).
P. ANGELINI and F. LIPPI, Did inflation really soar after the euro changeover? Indirect evidence from ATM withdrawals, CEPR Discussion Paper, 4950, TD No. 581 (March 2006).
S. FEDERICO, Internazionalizzazione produttiva, distretti industriali e investimenti diretti all'estero, in L. F. Signorini, M. Omiccioli (eds.), Economie locali e competizione globale: il localismo industriale italiano di fronte a nuove sfide, Bologna, il Mulino, TD No. 592 (October 2002).
S. DI ADDARIO, Job search in thick markets: Evidence from Italy, Oxford Discussion Paper 235, Department of Economics Series, TD No. 605 (December 2006).
2006
F. BUSETTI, Tests of seasonal integration and cointegration in multivariate unobserved component models, Journal of Applied Econometrics, Vol. 21, 4, pp. 419-438, TD No. 476 (June 2003).
C. BIANCOTTI, A polarization of inequality? The distribution of national Gini coefficients 1970-1996, Journal of Economic Inequality, Vol. 4, 1, pp. 1-32, TD No. 487 (March 2004).
L. CANNARI and S. CHIRI, La bilancia dei pagamenti di parte corrente Nord-Sud (1998-2000), in L. Cannari, F. Panetta (a cura di), Il sistema finanziario e il Mezzogiorno: squilibri strutturali e divari finanziari, Bari, Cacucci, TD No. 490 (March 2004).
M. BOFONDI and G. GOBBI, Information barriers to entry into credit markets, Review of Finance, Vol. 10, 1, pp. 39-67, TD No. 509 (July 2004).
FUCHS W. and LIPPI F., Monetary union with voluntary participation, Review of Economic Studies, Vol. 73, pp. 437-457 TD No. 512 (July 2004).
GAIOTTI E. and A. SECCHI, Is there a cost channel of monetary transmission? An investigation into the pricing behaviour of 2000 firms, Journal of Money, Credit and Banking, Vol. 38, 8, pp. 2013-2038 TD No. 525 (December 2004).
A. BRANDOLINI, P. CIPOLLONE and E. VIVIANO, Does the ILO definition capture all unemployment?, Journal of the European Economic Association, Vol. 4, 1, pp. 153-179, TD No. 529 (December 2004).
A. BRANDOLINI, L. CANNARI, G. D’ALESSIO and I. FAIELLA, Household wealth distribution in Italy in the 1990s, in E. N. Wolff (ed.) International Perspectives on Household Wealth, Cheltenham, Edward Elgar, TD No. 530 (December 2004).
P. DEL GIOVANE and R. SABBATINI, Perceived and measured inflation after the launch of the Euro: Explaining the gap in Italy, Giornale degli economisti e annali di economia, Vol. 65, 2 , pp. 155-192, TD No. 532 (December 2004).
M. CARUSO, Monetary policy impulses, local output and the transmission mechanism, Giornale degli economisti e annali di economia, Vol. 65, 1, pp. 1-30, TD No. 537 (December 2004).
L. GUISO and M. PAIELLA, The role of risk aversion in predicting individual behavior, In P. A. Chiappori e C. Gollier (eds.) Competitive Failures in Insurance Markets: Theory and Policy Implications, Monaco, CESifo, TD No. 546 (February 2005).
G. M. TOMAT, Prices product differentiation and quality measurement: A comparison between hedonic and matched model methods, Research in Economics, Vol. 60, 1, pp. 54-68, TD No. 547 (February 2005).
F. LOTTI, E. SANTARELLI and M. VIVARELLI, Gibrat's law in a medium-technology industry: Empirical evidence for Italy, in E. Santarelli (ed.), Entrepreneurship, Growth, and Innovation: the Dynamics of Firms and Industries, New York, Springer, TD No. 555 (June 2005).
F. BUSETTI, S. FABIANI and A. HARVEY, Convergence of prices and rates of inflation, Oxford Bulletin of Economics and Statistics, Vol. 68, 1, pp. 863-878, TD No. 575 (February 2006).

M. CARUSO, Stock market fluctuations and money demand in Italy, 1913 - 2003, Economic Notes, Vol. 35, 1, pp. 1-47, TD No. 576 (February 2006).
S. IRANZO, F. SCHIVARDI and E. TOSETTI, Skill dispersion and productivity: An analysis with matched data, CEPR Discussion Paper, 5539, TD No. 577 (February 2006).
R. BRONZINI and G. DE BLASIO, Evaluating the impact of investment incentives: The case of Italy’s Law 488/92. Journal of Urban Economics, Vol. 60, 2, pp. 327-349, TD No. 582 (March 2006).
R. BRONZINI and G. DE BLASIO, Una valutazione degli incentivi pubblici agli investimenti, Rivista Italiana degli Economisti , Vol. 11, 3, pp. 331-362, TD No. 582 (March 2006).
A. DI CESARE, Do market-based indicators anticipate rating agencies? Evidence for international banks, Economic Notes, Vol. 35, pp. 121-150, TD No. 593 (May 2006).
L. DEDOLA and S. NERI, What does a technology shock do? A VAR analysis with model-based sign restrictions, Journal of Monetary Economics, Vol. 54, 2, pp. 512-549, TD No. 607 (December 2006).
R. GOLINELLI and S. MOMIGLIANO, Real-time determinants of fiscal policies in the euro area, Journal of Policy Modeling, Vol. 28, 9, pp. 943-964, TD No. 609 (December 2006).
P. ANGELINI, S. GERLACH, G. GRANDE, A. LEVY, F. PANETTA, R. PERLI,S. RAMASWAMY, M. SCATIGNA
and P. YESIN, The recent behaviour of financial market volatility, BIS Papers, 29, QEF No. 2 (August 2006).
2007
L. CASOLARO. and G. GOBBI, Information technology and productivity changes in the banking industry, Economic Notes, Vol. 36, 1, pp. 43-76, TD No. 489 (March 2004).
M. PAIELLA, Does wealth affect consumption? Evidence for Italy, Journal of Macroeconomics, Vol. 29, 1, pp. 189-205, TD No. 510 (July 2004).
F. LIPPI. and S. NERI, Information variables for monetary policy in a small structural model of the euro area, Journal of Monetary Economics, Vol. 54, 4, pp. 1256-1270, TD No. 511 (July 2004).
A. ANZUINI and A. LEVY, Monetary policy shocks in the new EU members: A VAR approach, Applied Economics, Vol. 39, 9, pp. 1147-1161, TD No. 514 (July 2004).
L. MONTEFORTE, Aggregation bias in macro models: Does it matter for the euro area?, Economic Modelling, 24, pp. 236-261, TD No. 534 (December 2004).
A. DALMAZZO and G. DE BLASIO, Production and consumption externalities of human capital: An empirical study for Italy, Journal of Population Economics, Vol. 20, 2, pp. 359-382, TD No. 554
(June 2005).
S. DI ADDARIO and E. PATACCHINI, Wages and the city. Evidence from Italy, Development Studies Working Papers 231, Centro Studi Luca d’Agliano, TD No. 570 (January 2006).
A. LOCARNO, Imperfect knowledge, adaptive learning and the bias against activist monetary policies, International Journal of Central Banking, v. 3, 3, pp. 47-85, TD No. 590 (May 2006).
F. LOTTI and J. MARCUCCI, Revisiting the empirical evidence on firms' money demand, Journal of Economics and Business, Vol. 59, 1, pp. 51-73, TD No. 595 (May 2006).
P. CIPOLLONE and A. ROSOLIA, Social interactions in high school: Lessons from an earthquake, American Economic Review, Vol. 97, 3, pp. 948-965, TD No. 596 (September 2006).
M. PAIELLA, The foregone gains of incomplete portfolios, Review of Financial Studies, Vol. 20, 5, pp. 1623-1646, TD No. 625 (April 2007).
FORTHCOMING
P. ANGELINI, Liquidity and announcement effects in the euro area, Giornale degli economisti e annali di economia, TD No. 451 (October 2002).
S. MAGRI, Italian households' debt: The participation to the debt market and the size of the loan, Empirical Economics, TD No. 454 (October 2002).
L. GUISO and M. PAIELLA,, Risk aversion, wealth and background risk, Journal of the European Economic Association, TD No. 483 (September 2003).
G. FERRERO, Monetary policy, learning and the speed of convergence, Journal of Economic Dynamics and Control, TD No. 499 (June 2004).

S. MOMIGLIANO, J. Henry and P. Hernández de Cos, The impact of government budget on prices: Evidence from macroeconometric models, Journal of Policy Modelling, TD No. 523 (October 2004).
D. Jr. MARCHETTI and F. Nucci, Pricing behavior and the response of hours to productivity shocks, Journal of Money Credit and Banking, TD No. 524 (December 2004).
R. BRONZINI, FDI Inflows, Agglomeration and host country firms’ size: Evidence from Italy, Regional Studies, TD No. 526 (December 2004).
L. GAMBACORTA, How do banks set interest rates?, European Economic Review, TD No. 542 (February 2005).
A. NOBILI, Assessing the predictive power of financial spreads in the euro area: does parameters instability matter?, Empirical Economics, Vol. 31, 4, pp. , TD No. 544 (February 2005).
P. ANGELINI and A. Generale, On the evolution of firm size distributions, American Economic Review, TD No. 549 (June 2005).
R. FELICI and M. PAGNINI,, Distance, bank heterogeneity and entry in local banking markets, The Journal of Industrial Economics, TD No. 557 (June 2005).
M. BUGAMELLI and R. TEDESCHI, Le strategie di prezzo delle imprese esportatrici italiane, Politica Economica, TD No. 563 (November 2005).
L. GAMBACORTA and S. IANNOTTI, Are there asymmetries in the response of bank interest rates to monetary shocks?, Applied Economics, TD No. 566 (November 2005).
S. DI ADDARIO and E. PATACCHINI, Wages and the city. Evidence from Italy, Labour Economics, TD No. 570 (January 2006).
M. BUGAMELLI and A. ROSOLIA, Produttività e concorrenza estera, Rivista di politica economica, TD No. 578 (February 2006).
P. ANGELINI and F. LIPPI, Did prices really soar after the euro cash changeover? Evidence from ATM withdrawals, International Journal of Central Banking, TD No. 581 (March 2006).
S. FEDERICO and G. A. MINERVA, Outward FDI and local employment growth in Italy, Review of World Economics, TD No. 613 (February 2007).
F. BUSETTI and A. HARVEY, Testing for trend, Econometric Theory TD No. 614 (February 2007).
B. ROFFIA and A. ZAGHINI, Excess money growth and inflation dynamics, International Finance, TD No. 629 (June 2007).
M. DEL GATTO, GIANMARCO I. P. OTTAVIANO and M. PAGNINI, Openness to trade and industry cost dispersion: Evidence from a panel of Italian firms, Journal of Regional Science, TD No. 635 (June 2007).