6.6. comparison with real studies 149 - the university of …€¦ · · 2007-02-076.5.3...
TRANSCRIPT
6.6. Comparison with real studies 149
Shallow thermochronometers record more of the spatial distribution of erosion than deep
thermochronometers. Both experience a variability in age within the central to pro-side region
of a factor of 2, and the ages are not steady in time. This suggests large uncertainties with the
use of thermochronometers in the derivation of erosion rates.
Many workers assume that thermochronometric ages can be used to describe erosion rates.
The modelling presented demonstrates that the mapping from thermochronometry to erosion
is not trivial, suggesting that erosion rates on the pro-side are likely to be underestimated by
shallow thermochronometers beyond the transition between reset to un-reset ages. The narrow
strip of old ages at the pro-retro transition describes the oblique nature of pro-side trajectories
rather than cumulative erosion. Thermochronometry only records erosion when trajectories are
vertical. The thermochronometric record is a product of a combination of wedge kinematics
and the closure zones.
6.5.3 Discussion of assumptions
The assumption that closure surfaces are parallel to topographic surfaces does not hold for deep
thermochronometers. The topographic influence decreases with depth and isotherms flatten in
real systems (Stuwe et al., 1994). Less material would therefore be reset as theith isotherm is
now generally deeper within the wedge, further accentuating the trend of smaller distributions
of ages for deeper thermochronometers.
The erosional algorithm applied is crude, however the majority of material eroded from
orogens is generally derived from the highest peaks. The 2D DEM approximates some spatially
averaged system rather than a topographic regime, so this assumption may not be too bad. The
regions of greatest error will probably be at the abrupt transition from erosion to no-erosion.
This would produce a wider range of very old values on the retro-side and broaden the band of
old values of the pro-side.
6.6 Comparison with real studies
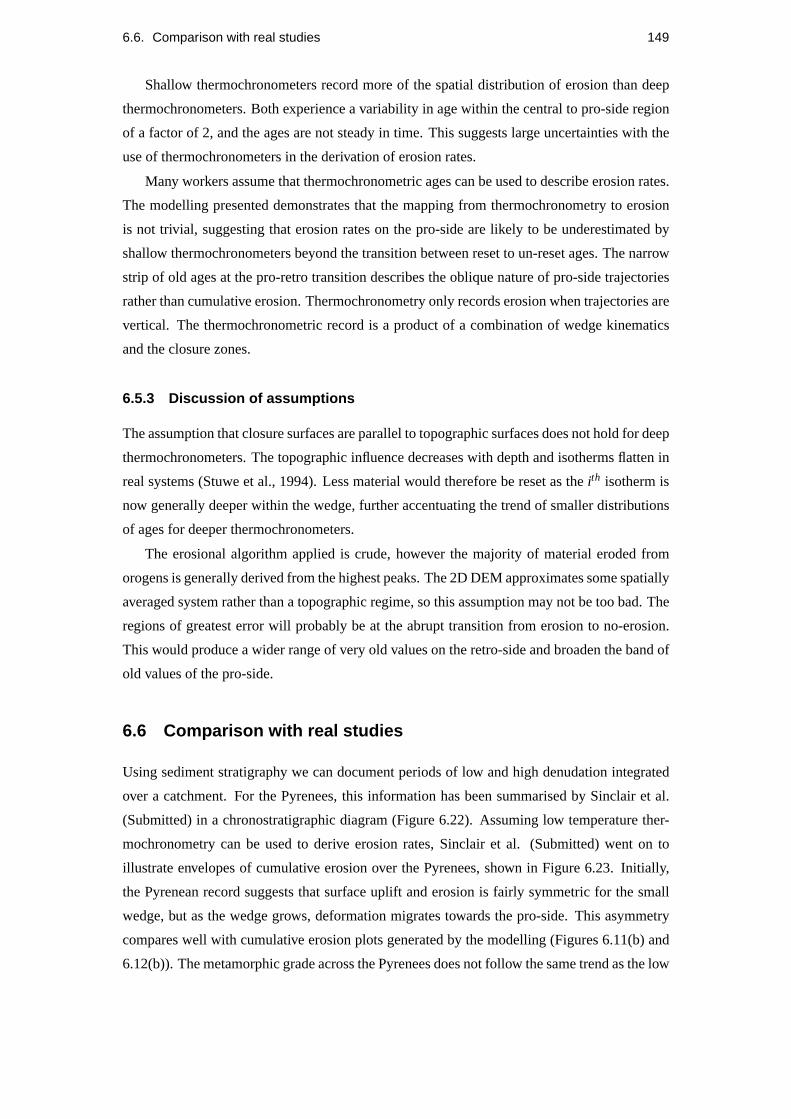
Using sediment stratigraphy we can document periods of low and high denudation integrated
over a catchment. For the Pyrenees, this information has been summarised by Sinclair et al.
(Submitted) in a chronostratigraphic diagram (Figure 6.22). Assuming low temperature ther-
mochronometry can be used to derive erosion rates, Sinclair et al. (Submitted) went on to
illustrate envelopes of cumulative erosion over the Pyrenees, shown in Figure 6.23. Initially,
the Pyrenean record suggests that surface uplift and erosion is fairly symmetric for the small
wedge, but as the wedge grows, deformation migrates towards the pro-side. This asymmetry
compares well with cumulative erosion plots generated by the modelling (Figures 6.11(b) and
6.12(b)). The metamorphic grade across the Pyrenees does not follow the same trend as the low
150 Chapter 6. Investigation into the response of the doubly vergent wedge to erosion
Figure 6.22: Chronostatigraphic evolution of the Pyrenees, including syntectonic sedimentary
flux information (Modified from Sinclair et al., Submitted)
temperature thermochronometry. The metamorphic grade is skewed to the retro-side which is
also consistent with the model predictions. However, this study shows that this technique of
deriving cumulative erosion from thermochronometry may under-estimate erosion rates on the
pro-side where trajectories may be oblique.
The Southern Alps, New Zealand, exhumes the highest grade metamorphics on the retro-
side of the orogen. However, in this case the youngest thermochronometric ages are also
skewed retro-ward. This is not inconsistent with our findings once asymmetric erosion is taken
into account. One would expect that increased denudation towards the retro-side would con-
tinue exhuming deep rocks, and push the envelope of erosion, and thus younger ages, retro-
ward.
Molnar (2003) presented a review of four papers which provided contradictory interpreta-
tion of the significance of the erosion - tectonic coupling in active mountain belts. All of the
studies used thermochronometry to estimate erosion rates. In Taiwan, Dadson et al. (2003)
showed that apatite fission track ages are not reset in the pro-wedge whilst the highest grade
is skewed to retro-side. However, the spatial distribution of erosion does not compare well
with the scheme employed in this study. In Taiwan, erosion is primarily controlled by supply
and that supply is controlled by earthquaking and slip on the steepest slopes, which tend to
be on the retro-side; not jointly governed by precipitation and relief. This would enhance the
exhumation of particularly deep material.
The Cascades, Washington State, were investigated by as part of the review by Reiners

6.6. Comparison with real studies 151
Figure 6.23: Structural reconstruction of the Pyrenees showing the corresponding sediment
fluxes and cumulative erosional envelopes. Sediment flux arrows are directly proportional the
sediment accumulation rates of 6.22. The erosive envelopes are implied from denudation rates
using low temperature thermochronometry.

152 Chapter 6. Investigation into the response of the doubly vergent wedge to erosion
et al. (2003). High exhumation rates, derived from low (U-Th)/He ages, lie within the pro-
wedge and coincide with the highest precipitation. As there are no obvious structures and
the orogen is assumed to have been emplaced isostatically due to the absence of any tectonic
process. They demonstrate a strong correlation between high erosion rates and the maxima in
modern day mean annual precipitation. However, the extrapolation of modern day precipitation
rates to the geological past has large errors. An alternative interpretation could be that the age
distribution is primarily a fossil record of the past kinematic history of the wedge prior to
its isostatic exhumation. The old ages on the pro-side are equivalent to the band of ages in the
modelling that described the oblique trajectories. The central portion of young ages indicate the
most active part of the wedge and the older ages towards the retro-side describe the relatively
inactive retro-wedge.
Whilst localised erosion can enhance a signal, this thesis lends support to the work of
Burbank et al. (2003), which suggests that precipitation is probably not the dominant control.
The natural kinematics of doubly vergent wedges tends to localise uplift for periods across a
large extent of the wedge with the most frequent events towards the tip of the pro-wedge tending
to less frequent, higher magnitude events further retro-ward. If the episodic kinematic model
presented here holds in real systems, it is not surprising that different studies come to different
conclusions about the degree of coupling between erosion and tectonics, depending upon which
part of the cycle the system is in. For the case of the Himalaya, paleomagnetic data make it clear
that a large amount of shortening has been accommodated across the entire Himalayan front
(Dewey et al., 1989), and that the total shortening on the plate scale is insensitive to orders of
magnitude variation in precipitation rates along the Himalayan front (Wobus et al., 2003). This
shortening has driven deformation across the Himalaya front. This prompts a consideration of
the ways in which spatially varying precipitation perturbs the way this system accommodates
shortening, in comparison to a case with uniform precipitation.
Submarine settings experience very low erosion rates compared with subarial systems. The
threshold erosion algorithm predicts that once a submarine wedge becomes subaerial, the axial
zone should broaden and the retro-side of the accretionary prism becomes relatively inactive. A
second, shallower retro-side accretionary prism should only be present for accretionary prisms
greater than some threshold size.
6.7 Conclusions
This chapter has demonstrated the relationships between erosion, exhumation and kinematics
of a simple erosional doubly vergent wedge system. It suggests that whilst metamorphic grade
and cumulative erosional flux can reach steady distributions, the time takeen for material to
travel from some specified depth to the surface is highly variable depending upon the state of

6.7. Conclusions 153
the wedge (i.e. whether the wedge is thickening internally or accreting frontally). This prompts
a review of current applications of thermochronometry in mountain belt systems. This might
help resolve some of the differences in interpretation revealed in recent studies (Molnar, 2003)
as to the significance of erosional - thermochronometric coupling in real data sets.
The erosional algorithm applied in the model is relatively crude, but it does provide a good
end member scenario when compared with the non-erosive case.


Chapter 7
Discussion
This thesis focuses on elucidating processes within doubly-vergent systems rather than simu-
lating specific real wedges. Much of what is discussed can be applied to real settings to aid
understanding of their evolution. Section 7.1 discusses issues pertaining to the development of
the DEM and how they relate to the the modelling results. Section 7.2 focuses on the use of
modelling to illuminate the evolution of real settings.
7.1 DEM model formulation
7.1.1 General structure of the DEM
In designing the DEM, compromises had to be made regarding the resolution of the model
to ensure a realistic run time was maintained. A run time of less than a week on a desktop
machine, running at 2.4GHz, was chosen as appropriate for the scope of this study. Future im-
plementations of the model on faster machines would use more particles to improve structural
resolution, and be generalised to 3D, incorporating along strike effects. Due to the discrete
calculation of the inter-particle force increments, the code would parallelise well, providing
that the 3D model can be divided into tessellating units with a low surface area to volume ratio,
each containing a large number of particles.
7.1.2 The DEM material
The strength of the material is a function of the packing structure, particle geometry and the
inter-particle force laws. The use of a regular packing arrangement, as proposed by Burbidge
(2000), introduces strain weakening into regions where the packing has been disturbed. How-
ever, using this technique the degree of strain weakening in a given packing cannot be pre-
scribed as it is an emergent phenomena. It is better to develop a parametrised strain weakening
term in the contact force algorithm.
155

156 Chapter 7. Discussion
There is potential to develop the singly-vergent critical wedge work further. The emergent
formation of the passive, shallower backstop with the clustered packing is interesting as it is a
feature observed in sandbox experiments (Lohrmann et al., 2003) and real accretionary wedges
(Kopp and Kukowski, 2003). Understanding why the single disc particle packing does not
form this feature may elucidate the processes involved in turning off activity in this backstop
region. The regular hexagonal packing did not form singly-vergent critical wedges, but this
does not mean that the processes it simulates are not found in nature. The Jura mountains in
the European Alps are a possible analogue for the behaviour exhibited by the singly-vergent
hexagonal packing experiments. In this setting, deformation is propagated a long distance from
the main orogen (the Alps) along laterally continuous, competent limestone beds, beneath a
Siliciclastic foreland sedimentary cover detached on weak Triassic evaporites. The resulting
structures form the thrust cored anticlines which comprise the Jura (Laubscher and Bernoulli,
1982).
A lower inter-element coefficient of friction would produce more realistic wedge taper an-
gles, but the values chosen for this study had to ensure that a reasonable amount of convergence
could be accommodated without deformation localising at the model boundaries. The angles
generated in this study are more consistent with those observed in sandbox models. The gen-
eralisation to 3D introduces two extra degrees of freedom, one translational and one rotational,
that will affect the material properties, making it easier for particles to pass at high densities.
7.1.3 Boundary conditions
The first order difference between the DEM constant velocity and traction force boundary con-
ditions are comparable with the differences observed in different sand box and computational
doubly-vergent wedge simulations. Identifying the key mechanism in producing this difference
(i.e. the nature of the basal discontinuity and basal friction) allows us to start discussing the rel-
ative merits of different boundary conditions as applied to real systems. This is important as it
sets up a framework in which we can compare previous work objectively.
The use of a traction force is an important development that facilitated the study of doubly-
vergent DEMs. Generally, other studies use particles, angular surfaces or normal motion of
a perpendicular boundary to force motion parallel to a boundary. The limitations of these
approaches in producing a velocity singularity at some point along a boundary have been made
clear in this thesis and Nayloret al. (In press).
The sensitivity of the model results (analogue, FEM and DEM) to the boundary conditions
employed demonstrates the need to use boundary conditions appropriate to the setting one
wishes to investigate. Hopefully, the fact that resulting deformation patterns are non-unique
will provide an opportunity to probe the geological reality in the future. As a first step to
achieving this, it is important to understand the reason behind differences in model results.
7.2. Further tectonic implications 157
7.1.4 Erosional algorithm
The erosional algorithm employed was crude, but provided insight into how the internal me-
chanics of a doubly-vergent system may be perturbed. This is one of the main areas where the
model should be developed. However, it is non-trivial as the gradual removal of mass (in units
less than the particle size) from the system is difficult.
The mapping of a real 2D erosional environment onto a 1D cross section raises difficult
conceptual issues about the averaging assumptions used in 1D models. For example, is the
topography in the 1D cross section best represented by the minimum, mean or maximum el-
evation of a swath through a real orogen? Given that the profiles are not concave, we can
rule out the minimum topography. The topography probably represents some mean elevation,
so a down stream catchment averaged erosion law is probably the most appropriate to use in
such scenarios. However, this may be the wrong approach to take as our ultimate aim is to
develop a full 3D coupled model. Starting work on this now and waiting for computational
power to catch up would make a significantly greater advance than improving a fundamentally
problematic 2D system.
7.2 Further tectonic implications
There are a number of issues where the modelling stimulates a discussion of our understanding
and interpretation of geological processes. The interaction of different elements of the system
have to work together and be consistent with the evidence available if a proposed model holds.
Some of these ideas are critically discussed below.
7.2.1 The S-point, underplating and isostacy
The term S-point was introduced to describe the velocity discontinuity on the lower bound-
ary of computational models (Willett et al., 1993). Conceptually, this relates to the transition
between the subducting and over riding plates. In order to understand the limitations of its
role within the FEM and DEM modelling, a consideration of real orogenic wedge systems is
required. In plan view, wedges form where collision between two distinct plates occurs. The
wedge grows as material from the plates, primarily the subducting plate, is incorporated. An
understanding of the vertical depth of the S-point is more complicated. One definition of the
depth of the S-point is the point below which all material is subducted, thus bisecting the in-
coming plate into two portions: the upper part is accreted into the wedge, while the lower part
is subducted. Following on from this model arises a definition ofunderplatingas an event
where material is incorporated into the wedge from a depth that would have previously been
subducted. Such an event could represent an irreversible drop in the lowest detachment, initi-
ating an increase in the flux of material into the wedge. This is a distinctly different process to

158 Chapter 7. Discussion
frontal accretionor internal thickening of material derived from above the lowest detachment,
which is termed herebasal accretion. The modelling presented in this thesis, as with much
of the FEM modelling, only incorporates the frontal accretion and internal thickening mecha-
nisms as they assume a constant thickness of incoming material. This may be appropriate for
submarine accretionary prisms that accrete a thin sedimentary cover (Bigi et al., 2003), but is
unlikely to characterize the entire history of large wedges. This assumption is also made in this
project as the interactions governing the change in regime are beyond its scope.
This has been recognised by Beaumont et al. (1999), who has developed an alternative FEM
coupled model in which the proportion of incoming material that is subducted and incorporated
varies. The variation in the depth of material accreted is likely to be a complicated function of
the size of the wedge, the structure of the incoming material and the nature of the subduction.
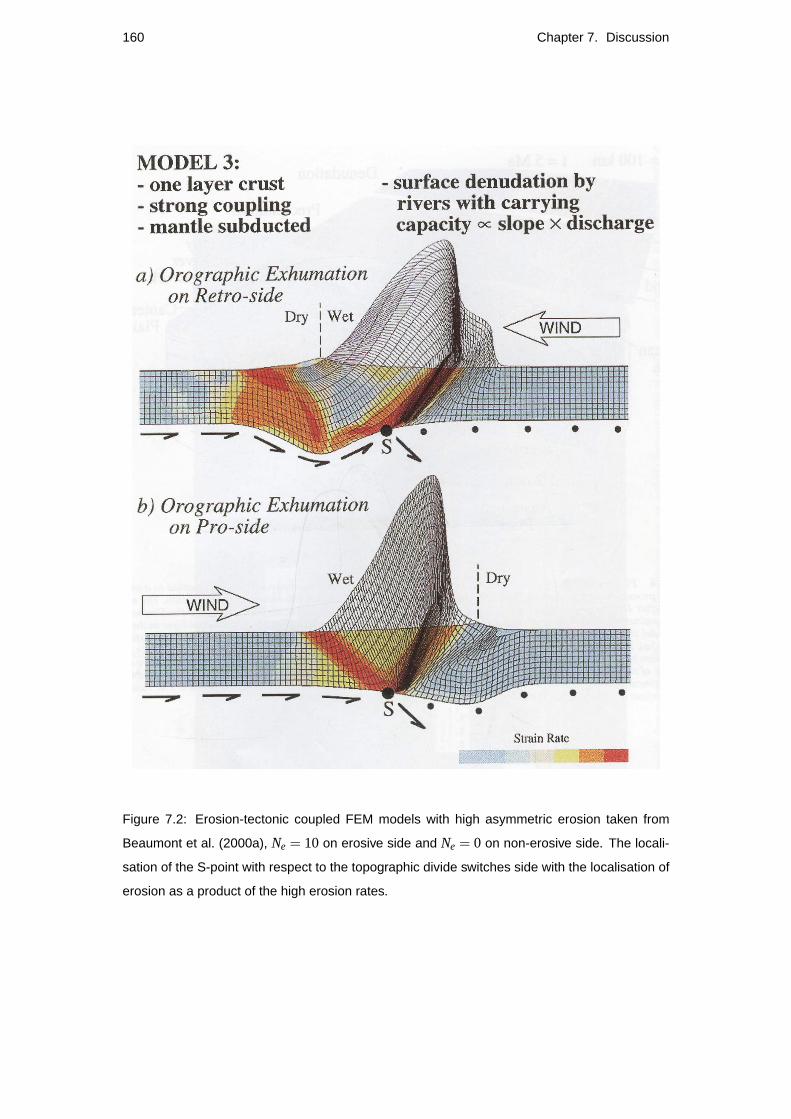
Such discussion prompts another look at the lateral position of the S-point and its relation of
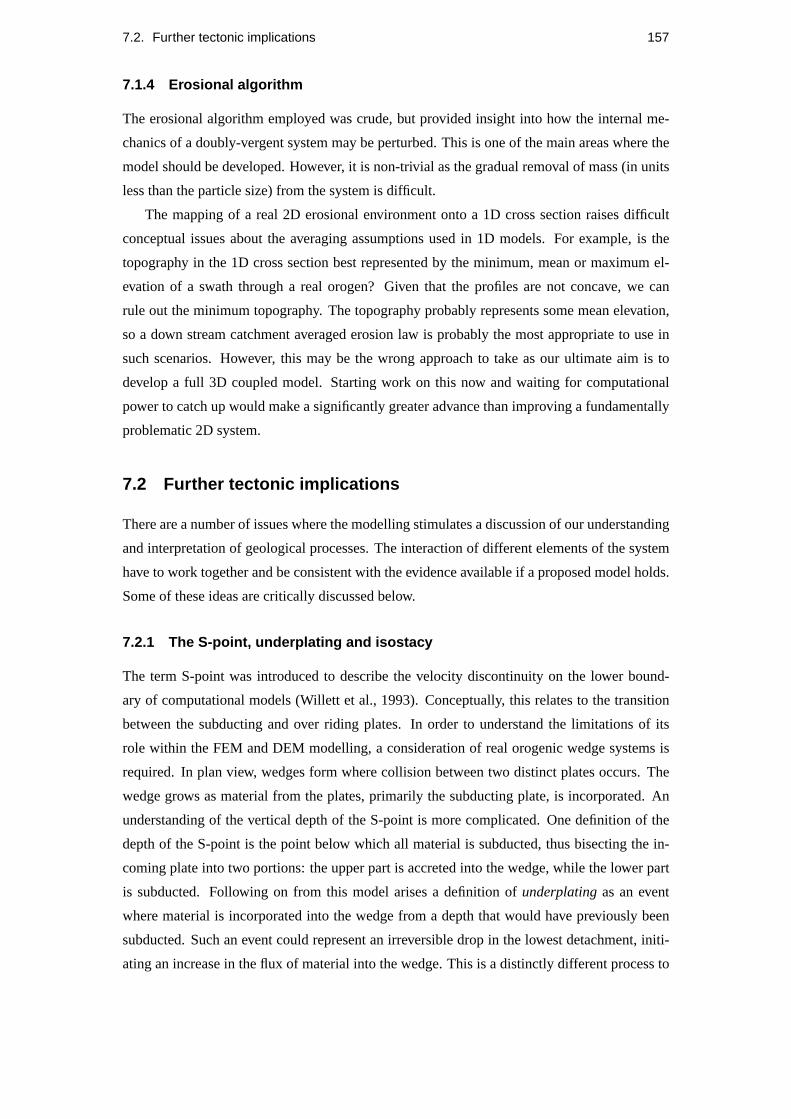
other features in the wedge. Figures 7.1 and 7.2 show how the evolution of the coupled tectonic-
erosion FEM models vary for different degrees of asymmetric erosional forcing. The erosion
number,Ne is defined to be the ratio of the rates of erosion and tectonic uplift. In the asymmetric
models presented here erosion is applied to only one side of the topographic divide. The amount
of material eroded is given by the projection of the Lagrangian mesh above the ground surface.
The ground surface is given by the bold line at the top of the Eulerian mesh. Consider the
localisation of the S-point, the topographic divide and the bottom of the isostatic root in these
figures. The topographic divide is always approximately above the isostatic root. However,
the position of the S-point varies significantly with the erosion number. For low values of the
erosion number (Ne = 2 in Figure 7.1) the S-point is always to the pro-side of the isostatic root.
However, for high values of retro-side erosion number (Ne = 10 in Figure 7.2(a)) the S-point
becomes localised to the retro-side of the isostatic root. This appears unphysical. In private
correspondence, Willett suggested that in mature systems, the S-point is not too problematic
because as the lower crust gets weak, it effectively detaches upper crustal deformation from
mantle motion, so that is does not matter whether the S-point is a perfect discontinuity or
whether the same convergence is distributed. However, an examination of Figures 7.1 and 7.2
shows that the regions of highest strain rate are approximately symmetrically distributed about
the S-point. FEM models with low values of erosion number may be valid, but if Figure 7.2(a)
is not physical, the transition between the physical and unphysical regimes needs to be defined.
7.2.2 Implications of varying the depth of incoming material via underplating
In certain settings, it should be possible to detect underplating as defined here. For example, the
first time an accretionary prism comprised of sediment cover incorporates underlying crustal
material using seismic, well data or gravity measurements.
The Simple Model (Section 5.2) assumed a constant thickness of accreted material in the
7.2. Further tectonic implications 159
Figure 7.1: Erosion-tectonic coupled FEM models with low asymmetric erosion (Ne = 2) taken
from Willett (1999). The orographic effect in these systems is such that there is no erosion on the
leeward side of the mountains. In the left hand figures, precipitation and erosion are focussed on
the orogenic wedge above the subducting plate (the pro-wedge). Note progressive focussing of
deformation into pro-wedge to the left and highest exhumation in the orogen interior. In the right
hand figures, precipitation and erosion are focussed on the orogenic wedge above the overriding
plate (the retro-wedge). In contrast to model above, deformation remains focussed on each
edge of orogen. Highest exhumation occurs at low elevation at the retro-wedge deformation
front. Top to bottom shows model results with increasing time. (Taken from Willett, 1999).
160 Chapter 7. Discussion
Figure 7.2: Erosion-tectonic coupled FEM models with high asymmetric erosion taken from
Beaumont et al. (2000a), Ne = 10 on erosive side and Ne = 0 on non-erosive side. The locali-
sation of the S-point with respect to the topographic divide switches side with the localisation of
erosion as a product of the high erosion rates.
7.2. Further tectonic implications 161
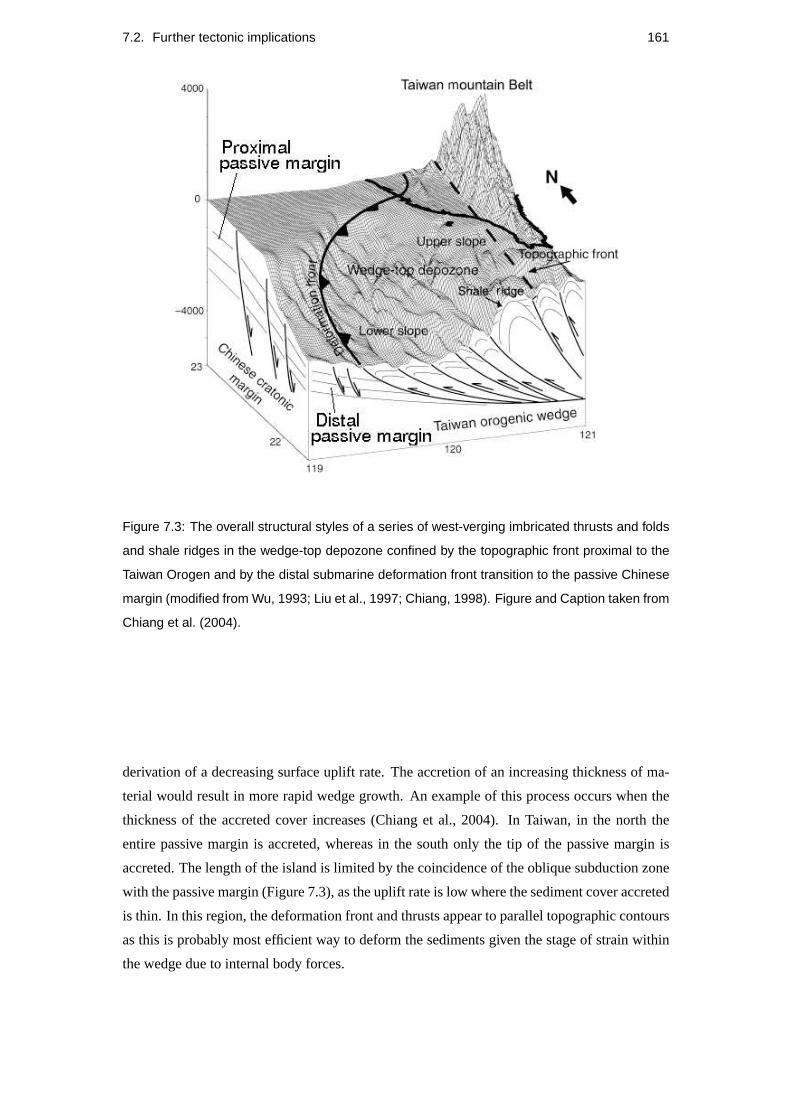
Figure 7.3: The overall structural styles of a series of west-verging imbricated thrusts and folds
and shale ridges in the wedge-top depozone confined by the topographic front proximal to the
Taiwan Orogen and by the distal submarine deformation front transition to the passive Chinese
margin (modified from Wu, 1993; Liu et al., 1997; Chiang, 1998). Figure and Caption taken from
Chiang et al. (2004).
derivation of a decreasing surface uplift rate. The accretion of an increasing thickness of ma-
terial would result in more rapid wedge growth. An example of this process occurs when the
thickness of the accreted cover increases (Chiang et al., 2004). In Taiwan, in the north the
entire passive margin is accreted, whereas in the south only the tip of the passive margin is
accreted. The length of the island is limited by the coincidence of the oblique subduction zone
with the passive margin (Figure 7.3), as the uplift rate is low where the sediment cover accreted
is thin. In this region, the deformation front and thrusts appear to parallel topographic contours
as this is probably most efficient way to deform the sediments given the stage of strain within
the wedge due to internal body forces.

162 Chapter 7. Discussion
7.2.2.1 At what rate would the thickness of accreted material thicken to sustain a con-
stant surface uplift rate?
Using the Simple Model, I briefly investigate how the accreted material must thicken to sustain
a constant surface uplift rate, illustrated in Figure 7.4.
Figure 7.4: Illustration of the Simple Model extended to incorporate a drop in the detachment
level, h, to sustain a constant surface uplift rate, u. dSis an increment of convergence that adds
an area dA of material into the cross-sectional area of the wedge. alphaand betaare constant
pro- and retro-taper angles.
A surface uplift rate that increases linearly with shortening can be expressed:
∂H∂S
= u (7.1)
when convergence commences,S= 0 andH = 0 therefore,
H = uS (7.2)
Using the incremental material added to the wedge for a depth of materialh(S),
∂A = ∂Sh(S) (7.3)
and the change in height by adding an amount of material∂A,
∂A = ∂H H
(tanα+ tanβtanα tanβ
)(7.4)
7.2. Further tectonic implications 163
∂H∂S
=∂H∂A
∂A∂S
u =h(S)H
(tanα tanβ
tanα+ tanβ
)
h(S) = uH
(tanα+ tanβtanα tanβ
)
= u2S
(tanα+ tanβtanα tanβ
)(7.5)
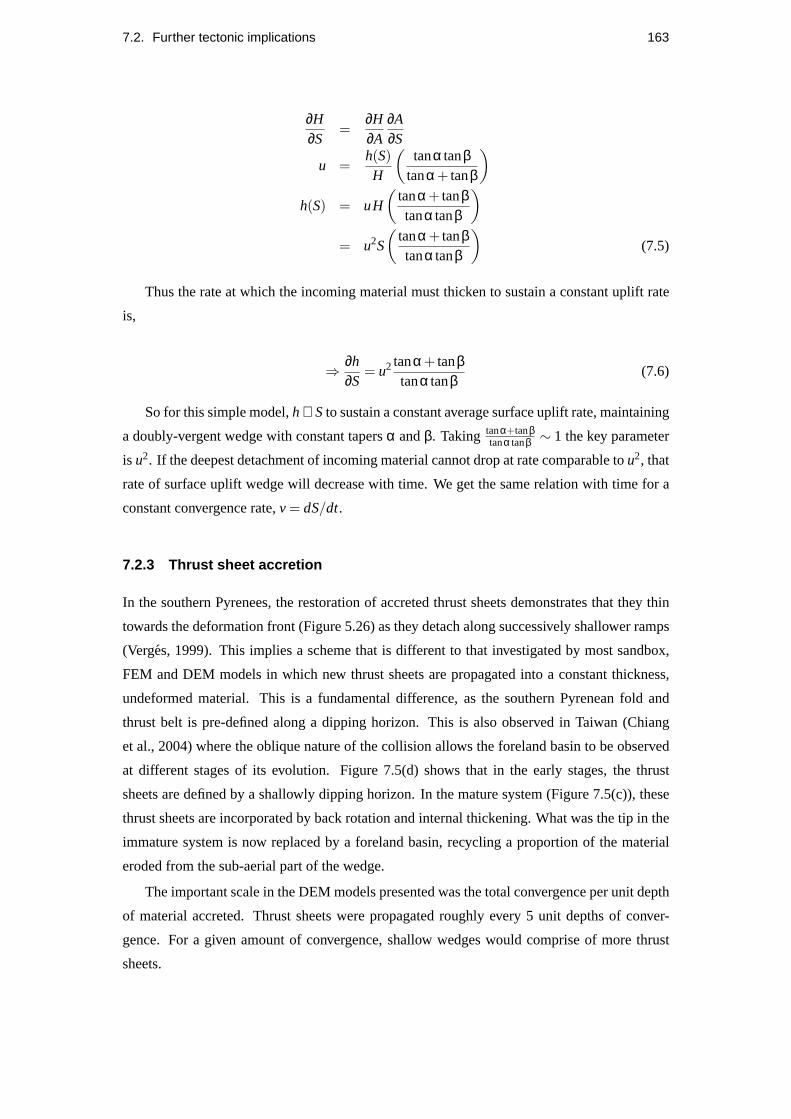
Thus the rate at which the incoming material must thicken to sustain a constant uplift rate
is,
⇒ ∂h∂S
= u2 tanα+ tanβtanα tanβ
(7.6)
So for this simple model,h∝ Sto sustain a constant average surface uplift rate, maintaining
a doubly-vergent wedge with constant tapersα andβ. Taking tanα+tanβtanα tanβ ∼ 1 the key parameter
is u2. If the deepest detachment of incoming material cannot drop at rate comparable tou2, that
rate of surface uplift wedge will decrease with time. We get the same relation with time for a
constant convergence rate,v = dS/dt.
7.2.3 Thrust sheet accretion
In the southern Pyrenees, the restoration of accreted thrust sheets demonstrates that they thin
towards the deformation front (Figure 5.26) as they detach along successively shallower ramps
(Verges, 1999). This implies a scheme that is different to that investigated by most sandbox,
FEM and DEM models in which new thrust sheets are propagated into a constant thickness,
undeformed material. This is a fundamental difference, as the southern Pyrenean fold and
thrust belt is pre-defined along a dipping horizon. This is also observed in Taiwan (Chiang
et al., 2004) where the oblique nature of the collision allows the foreland basin to be observed
at different stages of its evolution. Figure 7.5(d) shows that in the early stages, the thrust
sheets are defined by a shallowly dipping horizon. In the mature system (Figure 7.5(c)), these
thrust sheets are incorporated by back rotation and internal thickening. What was the tip in the
immature system is now replaced by a foreland basin, recycling a proportion of the material
eroded from the sub-aerial part of the wedge.
The important scale in the DEM models presented was the total convergence per unit depth
of material accreted. Thrust sheets were propagated roughly every 5 unit depths of conver-
gence. For a given amount of convergence, shallow wedges would comprise of more thrust
sheets.

164 Chapter 7. Discussion
Figure 7.5: The western Taiwan foreland basin can be divided into a mature basin in the north-
ern Taiwan and an immature one in the southern Taiwan. In terms of lithofacies, the mature
basin consists mainly of shallow marine and fluvial sediment and the immature one is dom-
inated by deep marine fine-grained sediment (left column). Using the foreland basin system
nomenclature of DeCelles & Giles (1996), the mature basin consists of distinguished features
from east to west: a wedge-top depozone, a dominant foredeep depozone and a forebulge. The
immature one is characterized by a dominant wedge-top depozone and an incipient foredeep
(right column). Figure and Caption taken from Chiang et al. (2004).

7.3. Summary 165
7.2.4 Catchment capture
Strong evidence for coupling between the topographic evolution and the internal kinematics
in the modelled data occurs for the traction force boundary condition with the lowest relative
retro-side friction, and is marked with a star in Figures 4.11 and 4.12. Figure 4.11(b) shows that
this event corresponds to a change in position of highest peak from the retro-side to the pro-side.
This process may be compared with catchment capture events in real systems such as has been
suggested for the Landsborough River in the Southern Alps, New Zealand (Tippett and Hovius,
2000). In moving the highest peak to the pro-side, we see a corresponding rapid steepening
of the pro-wedge and a shallowing of the retro-wedge in Figures 4.12(a) and (b) immediately
followed by a gradual correction back towards the mean taper angles. This demonstrates a
coupling between topography and internal kinematics resulting in localised deformation with
relatively slow rates of migration of the drainage divide away from the pro-side, related to the
incorporation of successive thrust sheets. In contrast, migration of the drainage divide towards
the pro-wedge occurs in relatively instantaneous events generated by localised uplift to the pro-
side of the drainage divide; once the shift in position has taken place, the maximum height of
the wedge starts to increase again, localised on the new drainage divide (Figure 4.11(a)).
7.3 Summary
This chapter provides insight into the further implications of the thesis, in a wider context. The
computational, material, boundary condition and erosional limitations of the current DEM are
acknowledged, prompting future work. It highlights problems in our conceptual understanding
of the S-point, boundary conditions and mechanisms of accretion in real subduction zones. The
effects of increasing the magnitude of the flux of material into the system are significant, so
the use of a constant depth of accreted material is problematic. The geometry of the material
comprising the pro-side fold-and-thrust belt in real systems is often pre-defined along shallowly
dipping detachments rather than a homogeneous, undeformed section. The internal wedge
kinematics have the potential to modify the drainage as the system evolves.

Chapter 8
Conclusions
The conclusions of thesis thesis are:
Advances in discrete element modelling of material phenomena.Regular packing struc-
tures introduce an extra length-scale into discrete element systems. This results in length-scale
dependent phenomena not observed using random packing structures. This is demonstrated by
the slump angle of repose experiments where the random material produced uniforms surface
taper, but regular hexagonal packed materials exhibit concave equilibrium profiles. The global
friction of the DEM material is an emergent property that is dependent on particle angularity,
packing structure and inter-particle interaction coefficients.
Understanding the mechanisms of wedges using a discrete element model approach.
Discrete element models using randomly packed materials successfully simulate much of the
behaviour observed in singly- and doubly-vergent wedges. In singly-vergent wedges, random
single disc materials produce uniform taper wedges. The random clustered disc material pro-
duces results most consistent with many sandbox analogue and real accretionary wedges due to
the emergence of a shallowly tapering, inactive region adjacent to the backstop boundary. How-
ever, the regular hexagonal packing does not produce critically tapered wedges. In this case,
long linear chains of adjoining particles allow strain to be transmitted for very long distances
away from the primary wedge.
In generalising singly-vergent simulations to doubly-vergent problems, the nature of the
lower boundary conditions had to be re-visited to introduce the velocity discontinuity at some
point along the base rather than at the vertical side boundary. Lower boundaries that consist
of particles present a problem as the frictional interaction of these boundary particles with
those particles overlying the boundary is emergent. Further, this emergent friction is greater
than the internal friction due to the reduced number of degrees of freedom in their motion. The
traction force presented is a significant development as it allows the Coulomb failure limit to be
specified. Discrete element simulations of doubly-vergent systems demonstrate how sandbox
analogues which show partitioning of deformation across a single retro-vergent structure rooted
167

168 Chapter 8. Conclusions
at the S-point versus those which exhibit Stage 3 retro-side accretion are the same problem but
with very high or low retro-side basal friction respectively. Further, the partitioning in the high
basal friction experiments also encompasses analogue experiments which intruded a shallowly
dipping, rigid indenter.
New insights into orogenesis.
1. Assuming a constant convergence rate,v, the accretion of thrust sheets of constant length,
l , into a wedge introduces a time-scale given by the time it takes to incorporate successive
thrust sheets into the wedge such thatt ∼ l/v.
2. The width of an orogen fluctuates around a background trend as thrust sheets are prop-
agated and incorporated. The propagation of a new thrust sheet is a rapid process as the
additional cross-sectional area above the undeformed surface is small, requiring only a
small amount of convergence. In contrast, the total incorporation of the new thrust sheet
requires a large amount of convergence, slightly less thanl , and thus takes longer. Thus,
it is predicted that a signal relating tot is seen in the evolution of real deformation fronts.
3. Further, as the deformation is episodic, one would expect to see a signal in erosive pulses
and thermochronometric records. If present, this should be measurable in real wedges as
t is comparable or greater than the structural, sedimentological and thermochronometric
resolution available in many systems.
4. In contrast to finite element modelling of erosive systems, DEM models predict signa-
tures of thrusting in thermochronometric ages and metamorphic grade.
5. The significance of the oblique nature of trajectories in accretionary systems is high-
lighted by the deepest exhumed material being skewed to the retro-side of the cumulative
erosion envelope.
6. Thermochronometers are most likely to underestimate erosion on the pro-side of orogens
where trajectories are most oblique. The greatest offset in ages across structures are
predicted to be in the retro-side of an orogen where deformation occurs infrequently, but
with a large magnitude.
Appendix A
Singly-vergent critical wedge
experiments
The Singly-vergent wedge results presented in this appendix extend those results presented in
Chapter 3. They were all run with identical boundary conditions, only the nature of the packing
structure and inter-disc coefficient of friction were varied. For each run, figures showing the
deformation of initially horizontal horizons and the localisation of large relative displacement
are shown. Where appropriate, the critical taper angle is displayed.
169
170 Appendix A. Singly-vergent critical wedge experiments
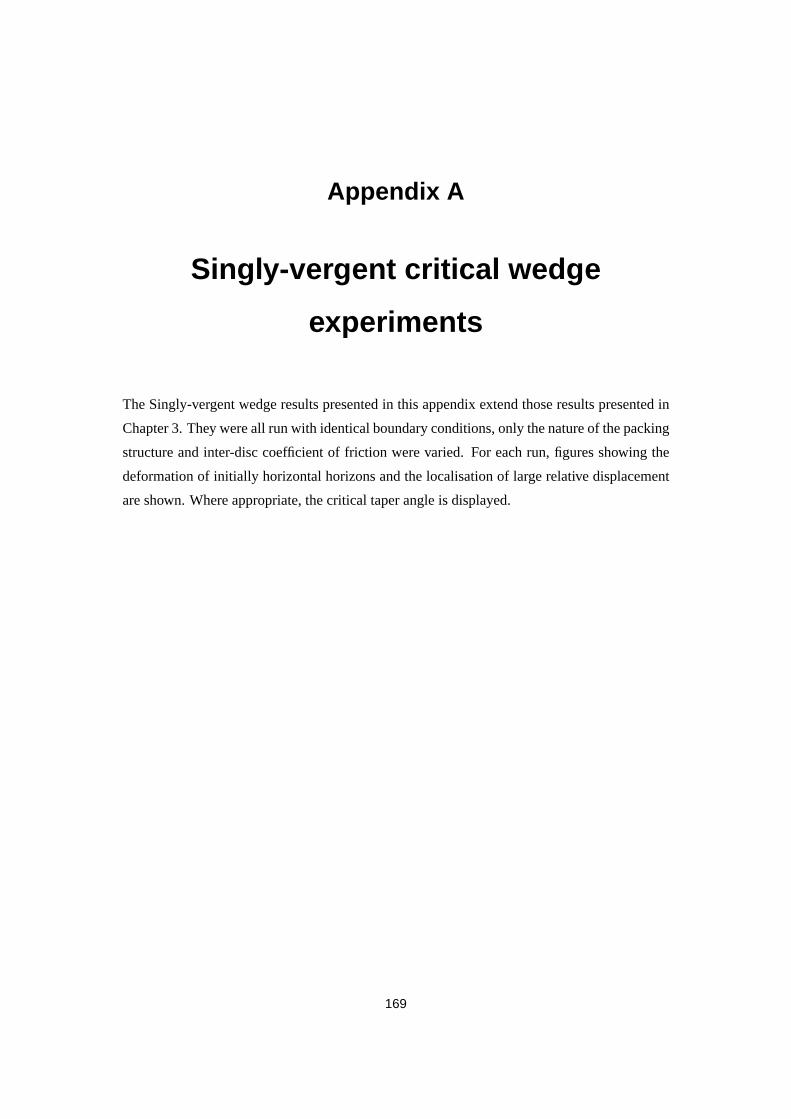
Figure A.1: Horizon deformation plot of Singly-vergent critical wedge boundary conditions ap-
plied to the regular hexagonal packing does not produce a critically tapered wedge due to the
geometric constraints placed on the system.
171
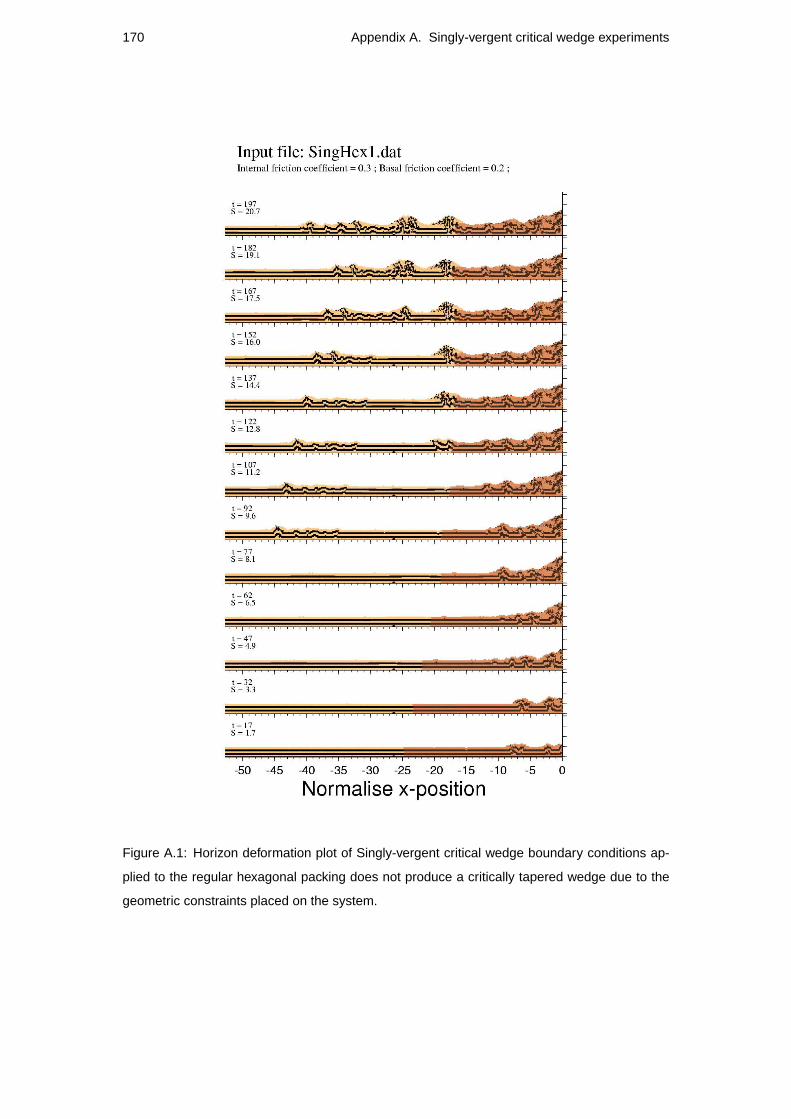
Figure A.2: Relative displacement plot of Singly-vergent critical wedge boundary conditions ap-
plied to the regular hexagonal packing does not produce a critically tapered wedge due to the
geometric constraints placed on the system. This is highlighted by the large relative displace-
ment chainsalong the horizontal and 60o planes.

172 Appendix A. Singly-vergent critical wedge experiments
Figure A.3: Singly-vergent horizon deformation plot for the random single disc particle structure
with µb = 0.1 and µe = 0.2.

173
Figure A.4: Singly-vergent horizon deformation plot for the random single disc particle structure
with µb = 0.1 and µe = 0.3.

174 Appendix A. Singly-vergent critical wedge experiments
Figure A.5: Singly-vergent horizon deformation plot for the random single disc particle structure
with µb = 0.2 and µe = 0.2.
175
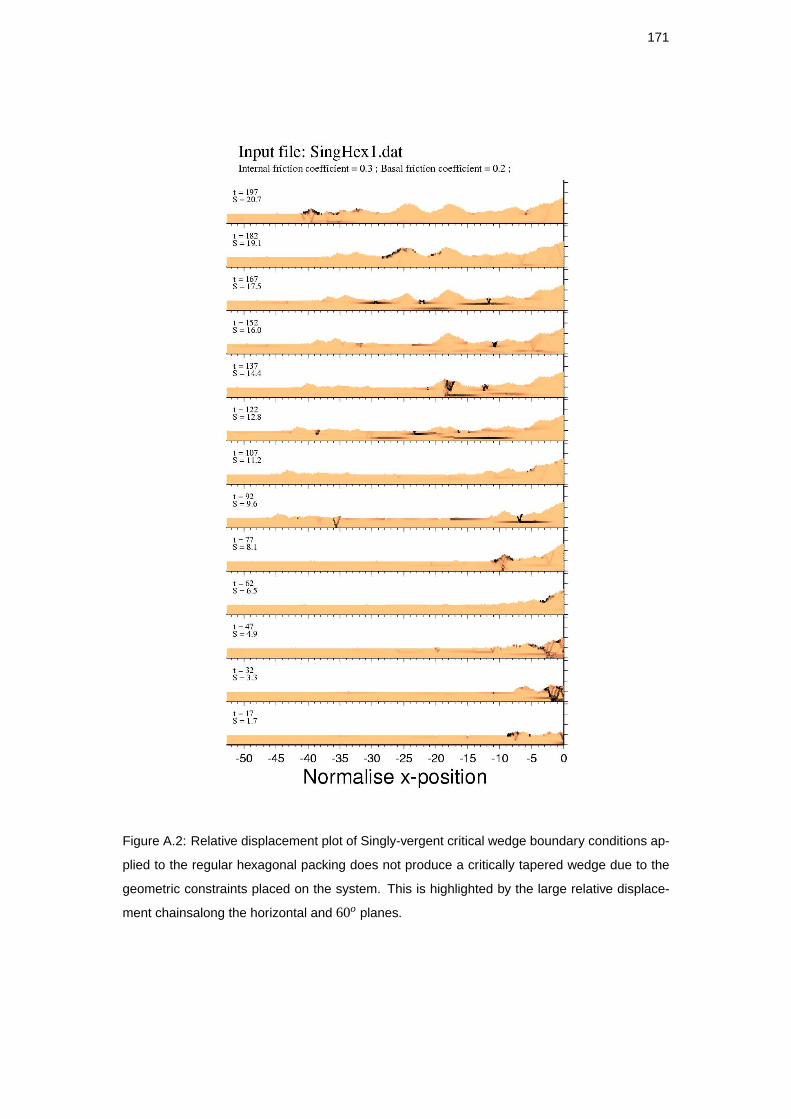
Figure A.6: Singly-vergent horizon deformation plot for the random single disc particle structure
with µb = 0.2 and µe = 0.3.

176 Appendix A. Singly-vergent critical wedge experiments
Figure A.7: Singly-vergent horizon deformation plot for the random single disc particle structure
with µb = 0.3 and µe = 0.2.

177
Figure A.8: Singly-vergent horizon deformation plot for the random single disc particle structure
with µb = 0.3 and µe = 0.3.
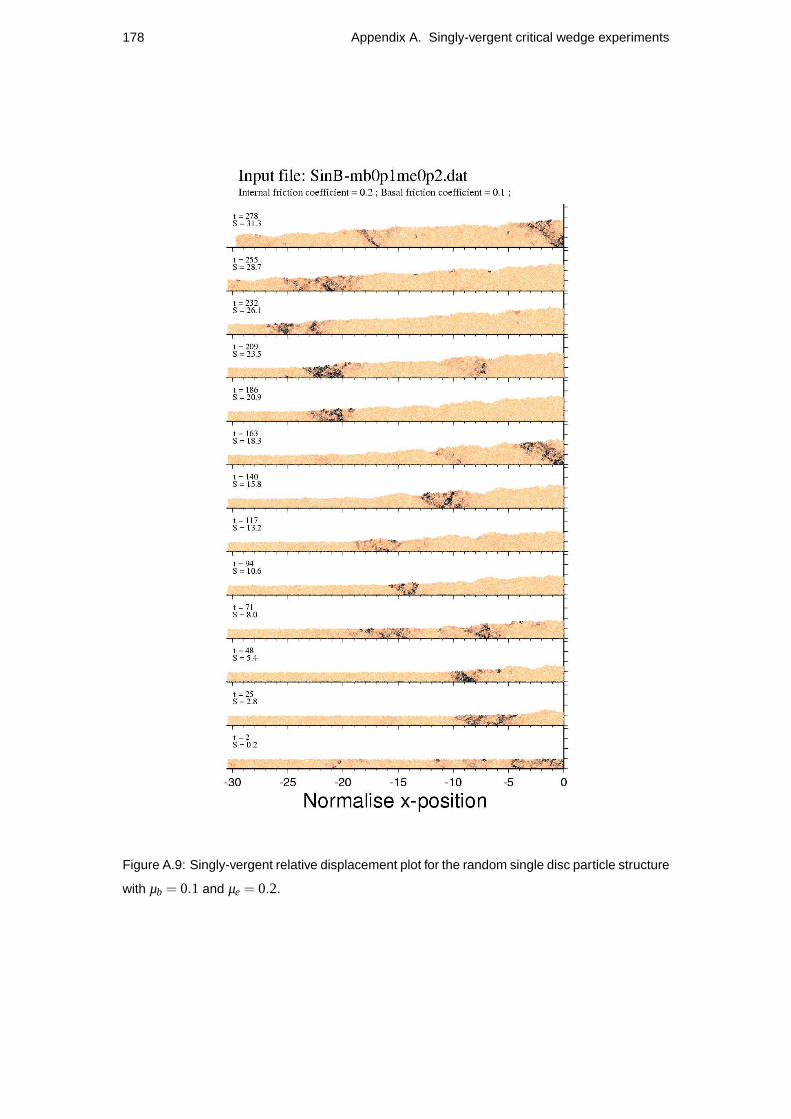
178 Appendix A. Singly-vergent critical wedge experiments
Figure A.9: Singly-vergent relative displacement plot for the random single disc particle structure
with µb = 0.1 and µe = 0.2.

179
Figure A.10: Singly-vergent relative displacement plot for the random single disc particle struc-
ture with µb = 0.1 and µe = 0.3.
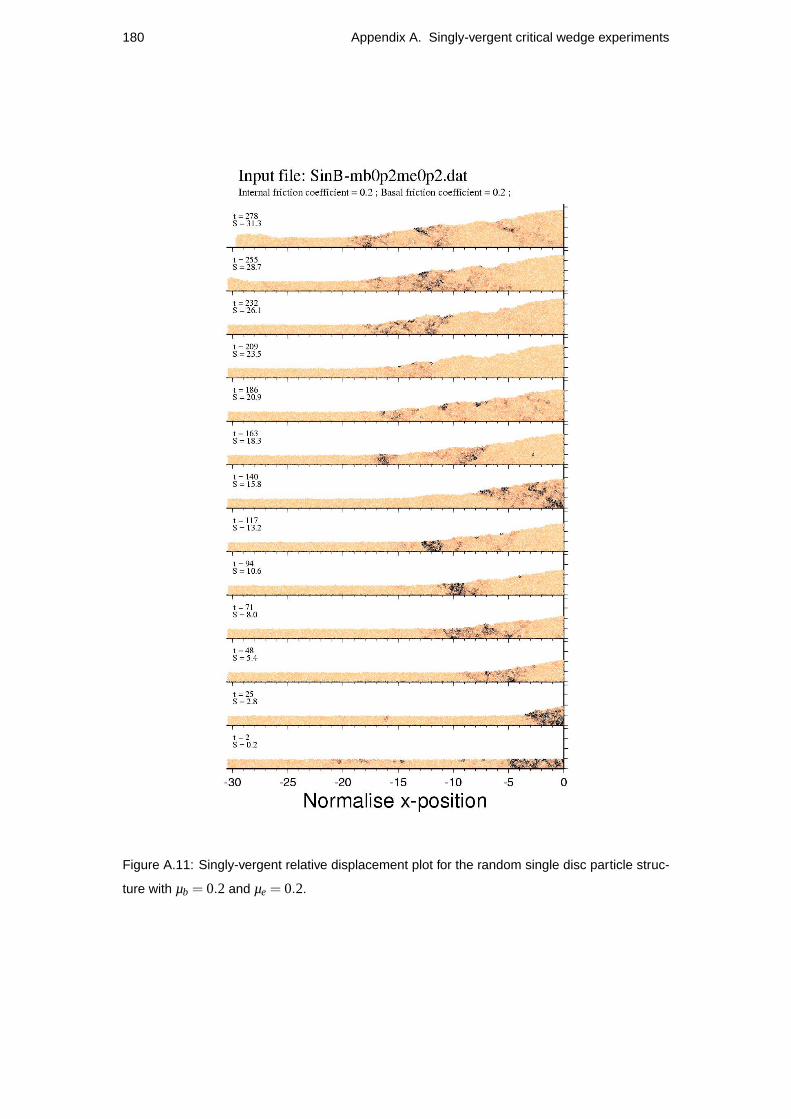
180 Appendix A. Singly-vergent critical wedge experiments
Figure A.11: Singly-vergent relative displacement plot for the random single disc particle struc-
ture with µb = 0.2 and µe = 0.2.
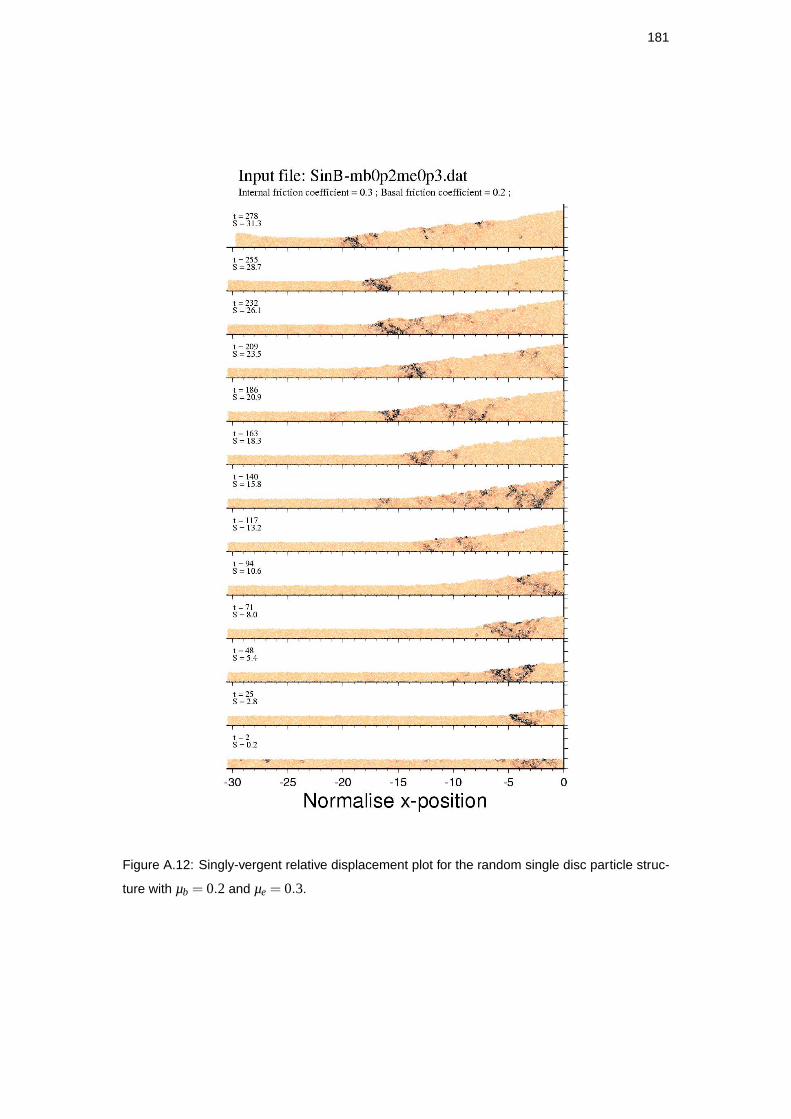
181
Figure A.12: Singly-vergent relative displacement plot for the random single disc particle struc-
ture with µb = 0.2 and µe = 0.3.
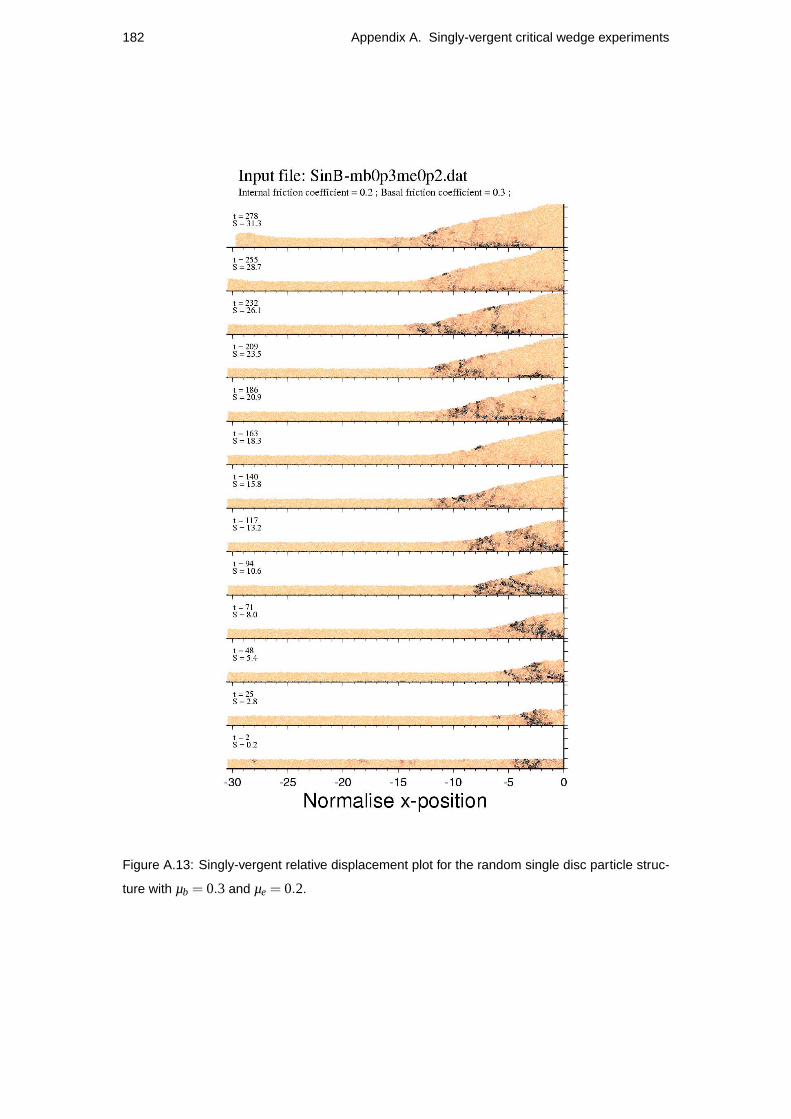
182 Appendix A. Singly-vergent critical wedge experiments
Figure A.13: Singly-vergent relative displacement plot for the random single disc particle struc-
ture with µb = 0.3 and µe = 0.2.
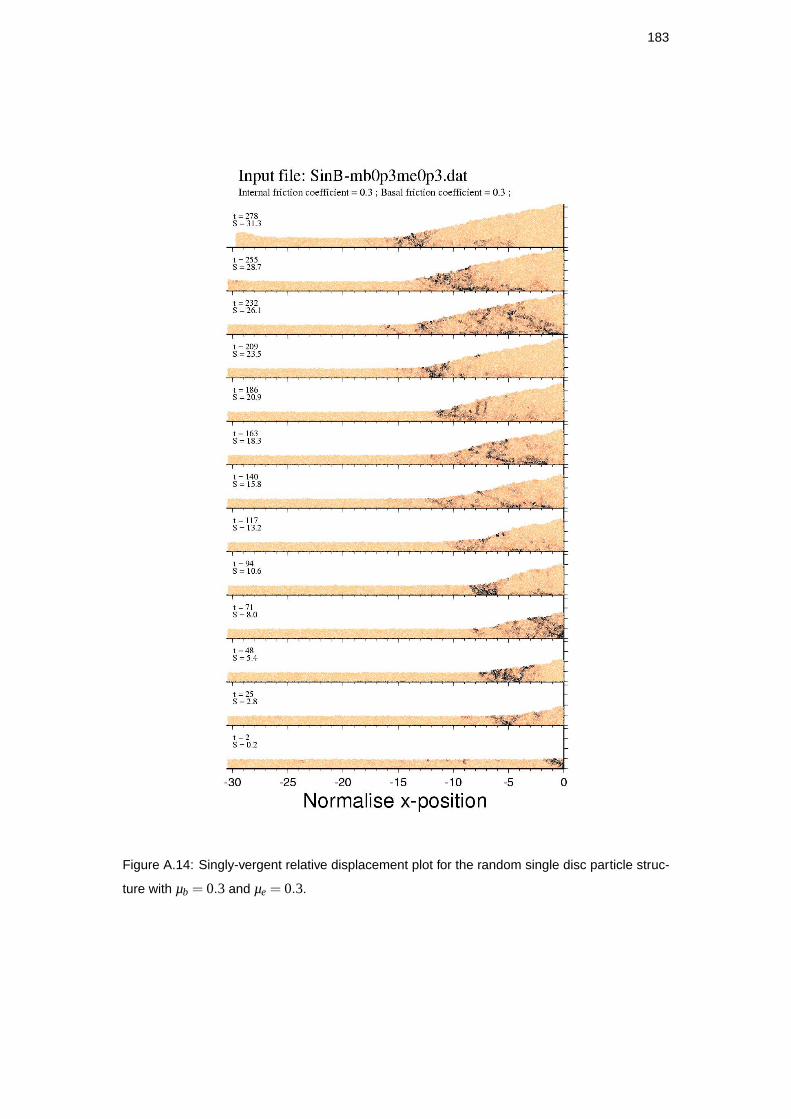
183
Figure A.14: Singly-vergent relative displacement plot for the random single disc particle struc-
ture with µb = 0.3 and µe = 0.3.

184 Appendix A. Singly-vergent critical wedge experiments
Figure A.15: Douby-vergent horizon deformation plot for the random single disc particle struc-
ture with µb = 0.1 and µe = 0.2.
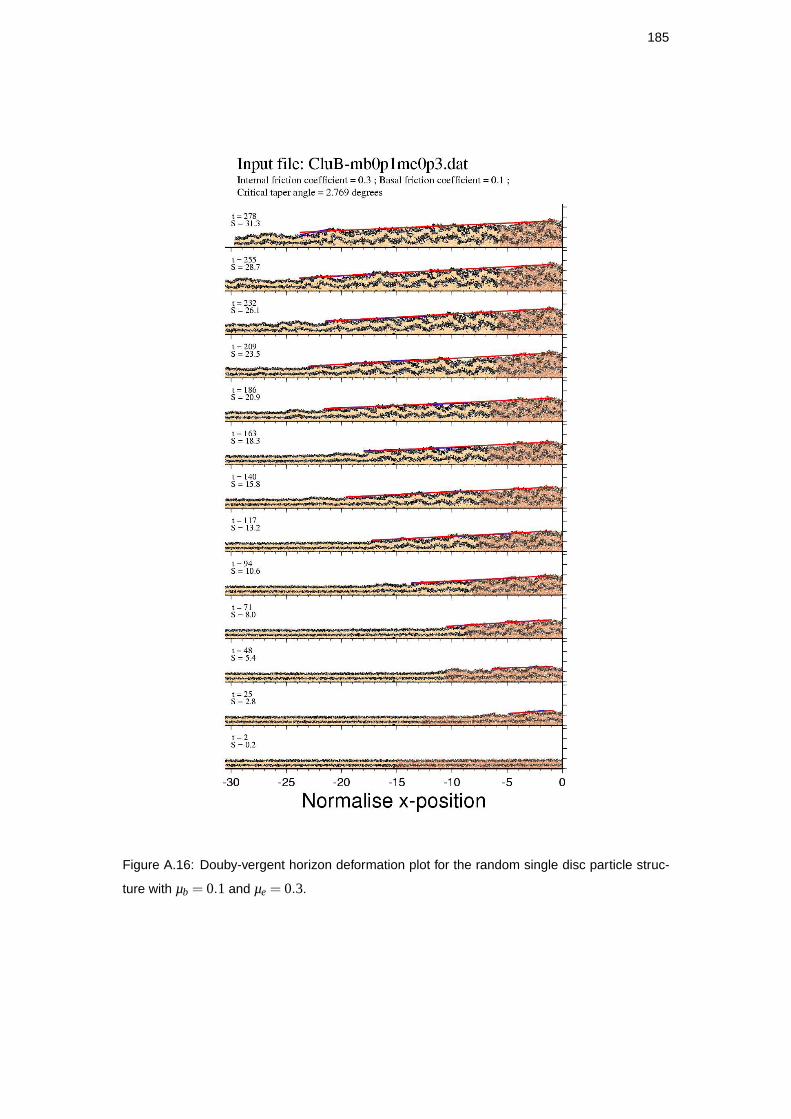
185
Figure A.16: Douby-vergent horizon deformation plot for the random single disc particle struc-
ture with µb = 0.1 and µe = 0.3.
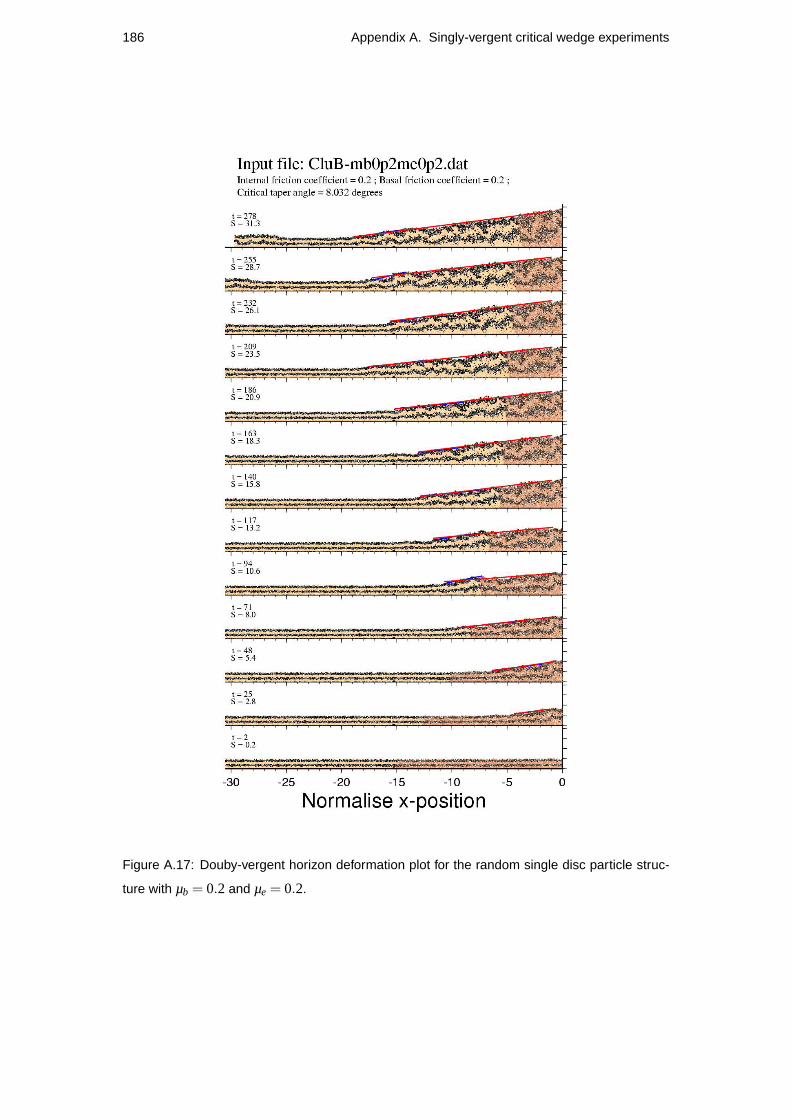
186 Appendix A. Singly-vergent critical wedge experiments
Figure A.17: Douby-vergent horizon deformation plot for the random single disc particle struc-
ture with µb = 0.2 and µe = 0.2.

187
Figure A.18: Douby-vergent horizon deformation plot for the random single disc particle struc-
ture with µb = 0.2 and µe = 0.3.
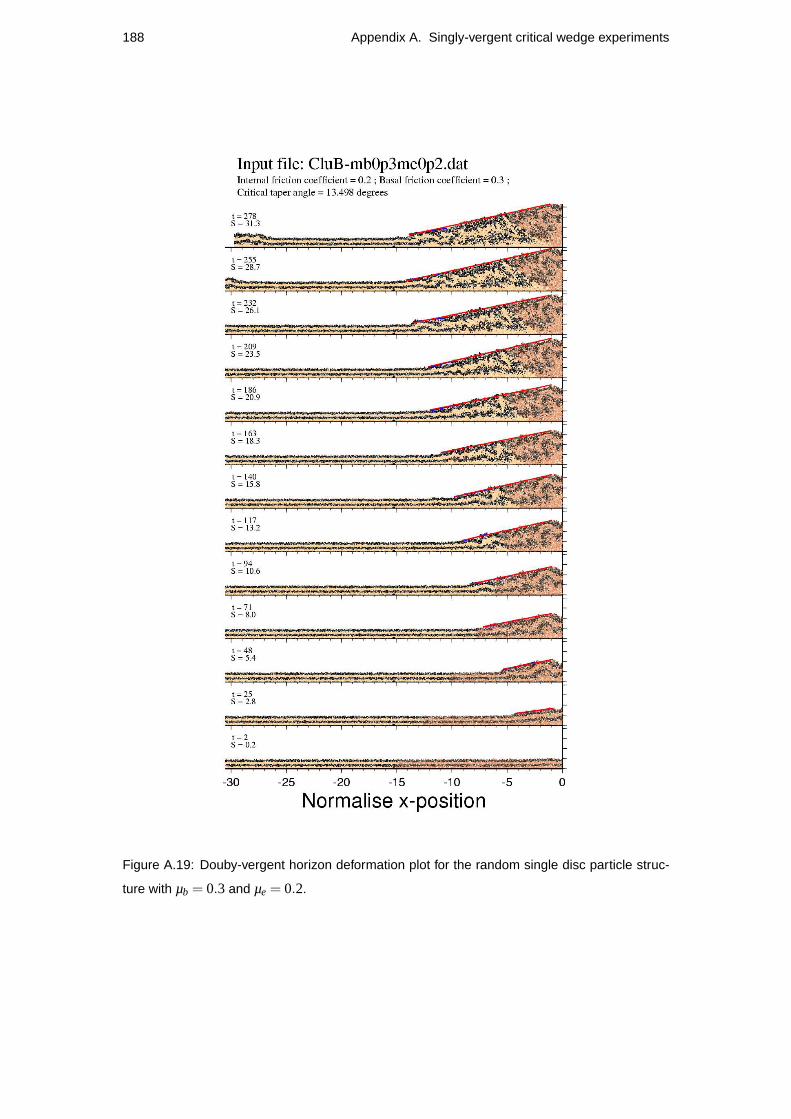
188 Appendix A. Singly-vergent critical wedge experiments
Figure A.19: Douby-vergent horizon deformation plot for the random single disc particle struc-
ture with µb = 0.3 and µe = 0.2.

189
Figure A.20: Douby-vergent horizon deformation plot for the random single disc particle struc-
ture with µb = 0.3 and µe = 0.3.

190 Appendix A. Singly-vergent critical wedge experiments
Figure A.21: Doubly-vergent relative displacement plot for the random single disc particle struc-
ture with µb = 0.1 and µe = 0.2.
191
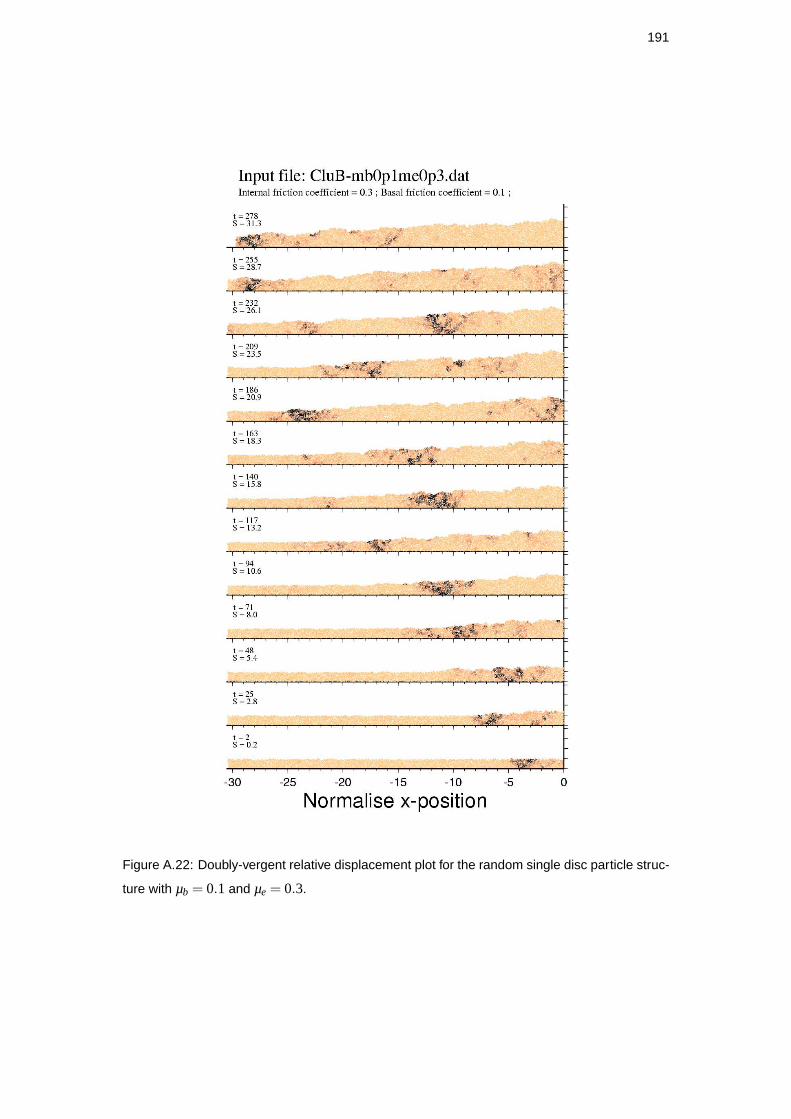
Figure A.22: Doubly-vergent relative displacement plot for the random single disc particle struc-
ture with µb = 0.1 and µe = 0.3.
192 Appendix A. Singly-vergent critical wedge experiments
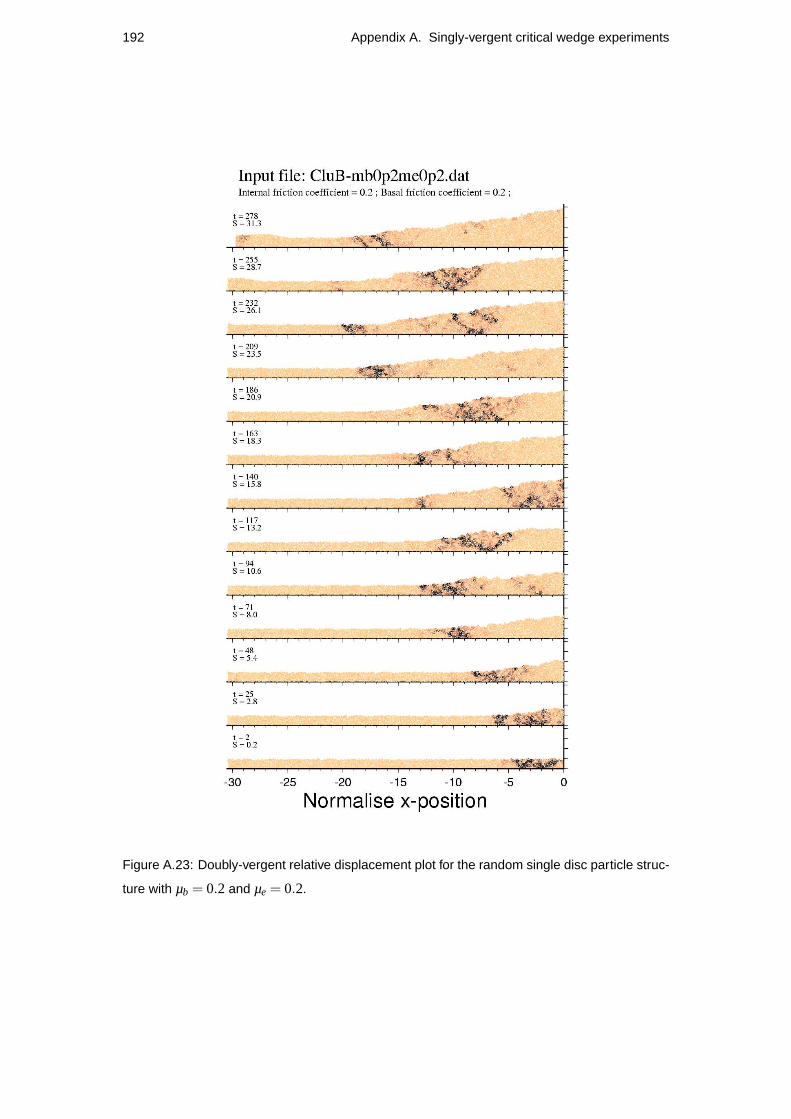
Figure A.23: Doubly-vergent relative displacement plot for the random single disc particle struc-
ture with µb = 0.2 and µe = 0.2.
193
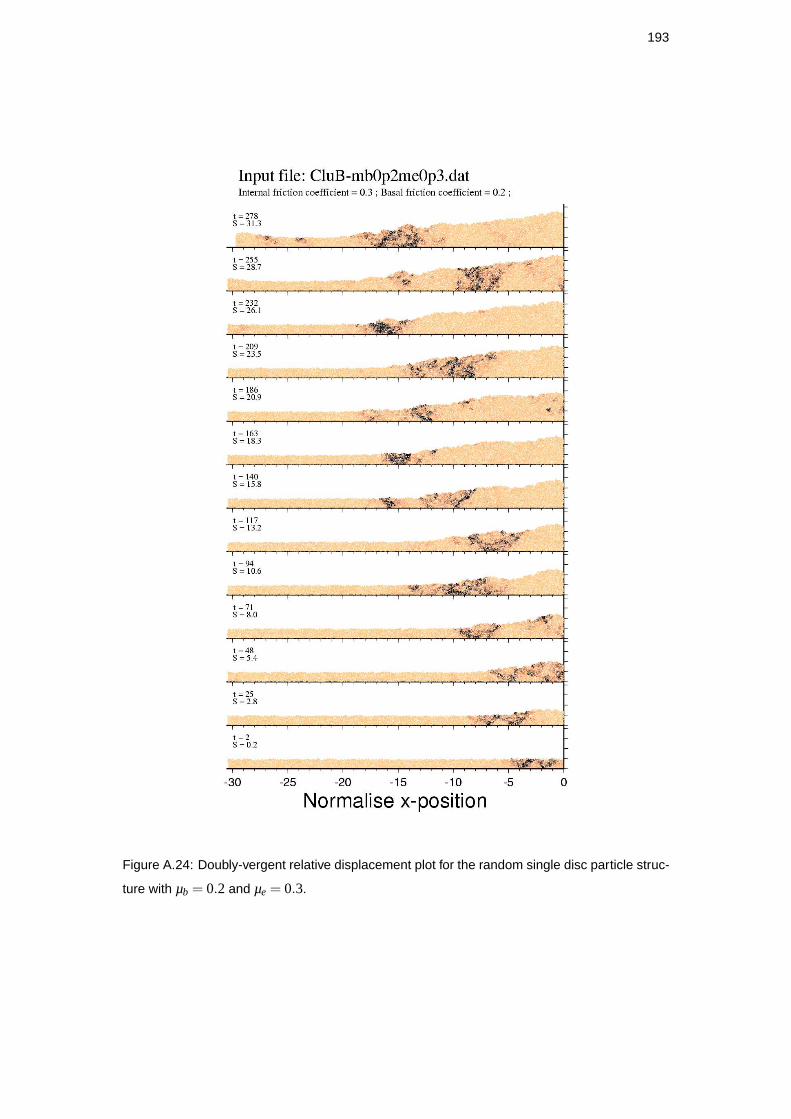
Figure A.24: Doubly-vergent relative displacement plot for the random single disc particle struc-
ture with µb = 0.2 and µe = 0.3.
194 Appendix A. Singly-vergent critical wedge experiments
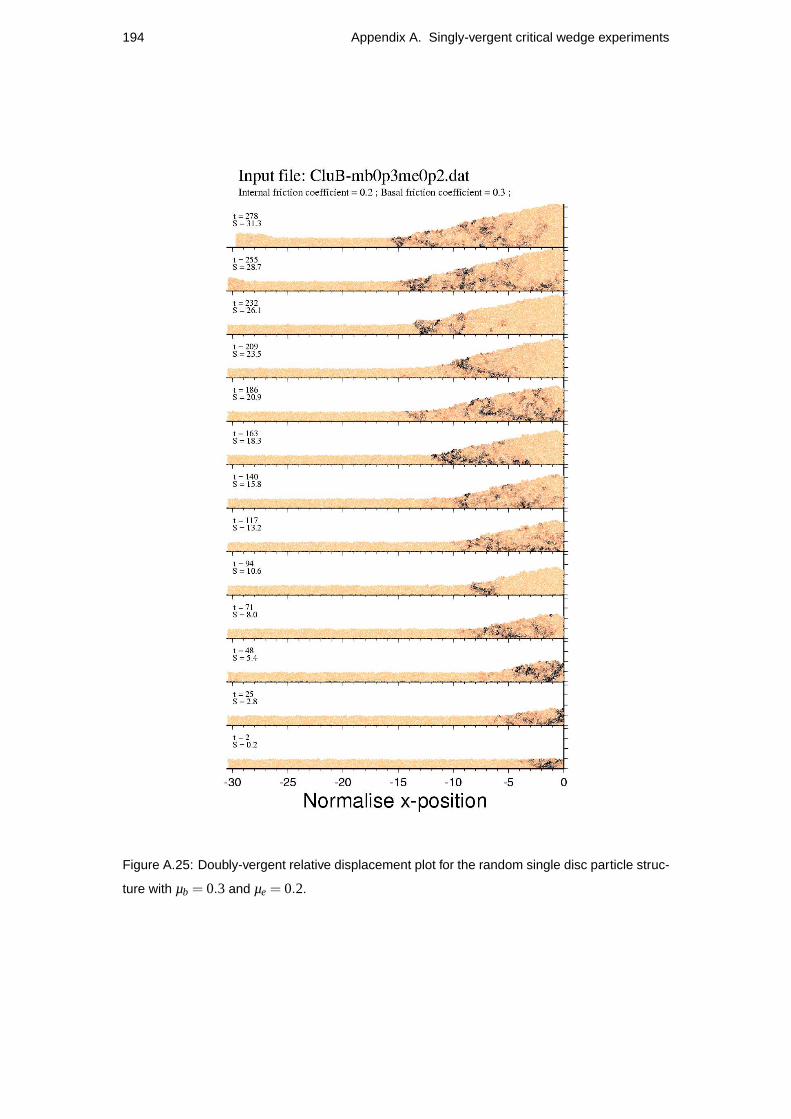
Figure A.25: Doubly-vergent relative displacement plot for the random single disc particle struc-
ture with µb = 0.3 and µe = 0.2.

195
Figure A.26: Doubly-vergent relative displacement plot for the random single disc particle struc-
ture with µb = 0.3 and µe = 0.3.

Bibliography
Allen, M. P. and Tildesley, D. J. (1987).Computer Simulation of Liquids. Oxford UniversityPress, Oxford, 2nd edition.
Batt, G. E., Brandon, M. T., Farley, K. A., and Roden-Tice, M. (2001). Tectonic synthesisof the Olympic Mountains segment of the Cascadia wedge, using two-dimensional thermaland kinematic modeling of thermochronometric ages.J. Geophys. Res., 106(B11):26,731–26,746.
Beamud, E., Garces, M., Cabrera, L., Munoz, J. A., and Almar, Y. (2003). A new Middle toLate Eocene continental chronostratigraphy from NE Spain.Earth and Planetary ScienceLetters, 216:501–514.
Beaumont, C., Ellis, S., Hamilton, J., and Fullsack, P. (1996). Mechanical model forsubduction-collision tectonics of Alpine-type compressional orogens.Geology, 24(8):675–678.
Beaumont, C., Ellis, S., and Pfiffner, A. (1999). Dynamics of sediment subduction-accretionat convergent margins.J. geophys. Res., 104(B8):17573–17601.
Beaumont, C., Kooi, H., and Willett, S. (2000a). Coupled tectonic-surface process modelswith applications to rifted margins and collisional orogens. In Summerfield, M. A., editor,Geomorphology and Global Tetconics, chapter 3, pages 29–55. Wiley.
Beaumont, C., Munoz, J. A., Hamilton, J., and Fullsack, P. (2000b). Factors controlling theAlpine evolution of the central Pyrenees inferred from a comparison of observations andgeodynamical models.J. Geophys. Res., 104(B7):8121–8145.
Bigi, S., Lenci, F., Doglioni, C., Moore, J. C., Carminati, E., and Scrocca, D. (2003).Decollement depth versus accretionary prism dimension in the Appenines and the Barba-dos.Tectonics, 22(2).
Boillot, G. and Capdevila, R. (1977). The Pyrenees, subduction and collision?Earth andPlanetary Science Letters, 35:243–255.
Bombolakis, E. G. (1994). Applicability of critical-wedge theories to foreland belts.Geology,22:535–538.
Brace, W. F. and Byerlee, J. D. (1966). Stick-slip as a mechanism for earthquakes.Science,153:990–992.
Burbank, D. W. and Anderson, R. S. (2001).Tectonic Geomorphology. Blackwell Science.
Burbank, D. W., Blythe, A. E., Putkonen, J., Pratt-Sitaula, B., Gabet, E., Oskin, M., Barros, A.,and Ojha, T. P. (2003). Decoupling of erosion and precipitation in the Himalayas.Nature,426:652–655.
197
198 Bibliography
Burbidge, D. R. (2000).The Complex Evolution of Accretionary Wedges and Thrust Belts:Results from Numerical Experiments Using the Distinct Element Method. PhD thesis, Aus-tralian National University.
Burbidge, D. R. and Braun, J. (2002). Numerical models of the evolution of accretionarywedges and fold-and-thrust belts using the distinct-element method.Geophys. J. Int.,148:542–561.
Byerlee, J. (1978). Friction of rocks.Pure and Applied Geophysics, 116:615–626.
Chapple, W. M. (1978). Mechanics of thin-skinned fold-and-thrust belts.Geol. Soc. Am. Bull.,89:330–345.
Chiang, C. S., Yu, H. S., and Chou, Y. W. (2004). Characteristics of the wedge top depozoneof the southern Taiwan foreland basin system.Basin Research, 16:65–78.
Choukroune, P. and Team, E. (1989). The ECORS Pyrenean deep seismic profile reflectiondata and the overall structure of an orogenic belt.Tectonics, 8:23–39.
Cundall, P. A. and Strack, O. D. L. (1979). A discrete numerical model for granular assemblies.Geotechnique, 29:47–65.
Dadson, S. J., Hovius, N., Chen, H., Dade, W. B., Hsieh, M. L., Willett, S. D., Hu, J. C., Horng,M. J., Chen, M. C., Stark, C. P., Lague, D., and Lin, J. C. (2003). Links between erosion,runoff variability and seismicity in the Taiwan orogen.Nature, 426:648–651.
Dahlen, F. A. (1984). Noncohesive critical Coulomb wedges: An exact solution.J. Geophys.Res., 89:10125–10133.
Dahlen, F. A., Suppe, J., and Davies, D. (1984). Mechanics of fold and thrust belts and accre-tionary wedges: Cohesive Coulomb theory.J. Geophys. Res., 88:10087–10101.
D’Anna, G., Mayor, P., Barrat, A., Loreto, V., and Nori, F. (2003). Observing Brownian motionin vibration-fluidized granular matter.Nature, 424:909–912.
Davis, D., Suppe, J., and Dahlen, F. A. (1983). Mechanics of fold and thrust belts and accre-tionary wedges.J. Geophys. Res., 88:1153–1172.
Deffontaines, B., Lee, J. C., Angelier, J., Carvalho, J., and Rudant, J. P. (1994). New ge-omorphic data on the active Taiwan orogen: A multisource approach.J. Geophys. Res.,99:20243–20266.
Deramond, J., Souquert, P., Wallez, M. J. F., and Specht, M. (1993). Relationships betweenthrust tectonics and sequence stratigraphy by surfaces in foredeeps : models and examplesfrom the Pyrenees. InV71, pages 193–219. Geological Society Special Publication.
Dewey, J. F. and Bird, J. M. (1970). Mountain belts and the new global tectonics.J. Geophys.Res., 75:2625–2647.
Dewey, J. F., Cande, S., and Pitman, W. C. (1989). Tectonic evolution of the India/Eurasiacollision zone.Eclogae Geol. Helv., 82(3):717–734.
Duran, J. (1997). Static and dynamic arching effect in granular materials. InPhysics of DryGranular Media, pages 197–216. NATO Advanced Study Unit, Kluwer Academic Publish-ers.
Bibliography 199
Dury, C. M. and Ristow, G. H. (1999). Competition of mixing and segregation in rotatingcylinders.Physics of Fluids, 11(6):1387–1394.
Finch, E., Hardy, S., and Gawthorpe, R. (2003). Discrete element modelling of contractionalfault-propogation folding above rigid basement fault block.J. Struc. Geo., 25:515–528.
Fischer, M. W. (1984). Thrust tectonics in the Northern Pyrenees.Journal of Structural Geol-ogy, 6:721–726.
Fullsack, P. (1995). An arbitrary Lagrangian-Eulerian formulation for creeping flows and itsapplication in tectonic models.Geophys. J. Int., 120:1–23.
Geng, J., Longhi, E., Behringer, R. P., and Howell, D. W. (2001). Memory in two-dimensinoalheap experiments.Physical Review E, 64(060301).
Heim, A. (1897).Untersuchungen uber den mechanisms de Gebirgsbildung im Anschluss andie geologische Monographie der Todi-Windgallen-gruppe. Schwabe Basel.
Helbing, D. (1997). Similarities between granular and traffic flow. InPhysics of Dry GranularMedia, pages 547–552. NATO Advanced Study Unit, Kluwer Academic Publishers.
Hickman, J. B., Wiltschko, D. V., Hung, J. H., Fang, P., and Bock, Y. (2002). Structure andevolution of the active fold-and-thrust belt of southwestern Taiwan from Global PositioningSystem analysis.Geological Society of America, Special Paper 385:75–92.
Howard, A. D., Dietrich, W. E., and Seidl, M. A. (1994). Modeling fluvial erosion on regionalto continental scales.J. Geophys. Res., 99(B7):13971–13986.
Huiqi, L., McClay, K., and Powel, D. (1992). Physical models of thrust wedges. In McClay,K., editor,Thrust Tectonics, pages 71–81. Chapman and Hall.
Jaeger, H. M., Nagel, S. R., and Behringer, R. P. (1996). Granular solids , liquids and gases.Reviews of Modern Physics, 68(4):1259–1273.
Jensen, P. R., Bosscher, P. J., Plesha, M. E., and Edil, T. B. (1999). DEM simulation of granularmedia-structure interface: effects of surface roughness and particle shape.InternationalJournal for Numerical and Analytical Methods in Geomechanics, 23:531–547.
Karner, G. D. and Watts, A. B. (1983). Gravity anomalies and flexure of the lithosphere atmountain ranges.J. Geophys. Res., 88(B12):10449–10477.
Koons, P. O. (1994). 3-Dimensional critical wedges - tectonics and topography in obliquecollisional orogens.Journal of Geophysical Research, 99(B6):12301–12315.
Kopp, H. and Kukowski, N. (2003). Backstop geometry and accretionary mechanics of theSunda margin.Tectonics, 22(6):1–16.
Koyi, H. (1995). Mode of internal deformation in sand wedges.J. Struc. Geo., 17(2):293–300.
Krantz, R. W. (1991). Measurements of friction coefficients and cohesion for faulting and faultreactivation in laboratory models using sand and sand mixtures.Tectonophysics, 188:203–207.
Lallemand, S. E., Schnurle, P., and Malavieille, J. (1994). Coulomb theory applied to ac-cretionary and nonaccretionary wedges: Possible causes for tectonic erosion and/or frontalaccretion.J. Geophys. Res., 99(B6):12033–12055.
200 Bibliography
Landry, J. W., Grest, G. S., Silbert, L. E., and Plimpton, S. J. (2003). Confined granularpackings: Structure, stress, and forces.Physical Review E, 67.
Lanier, J. and Jean, M. (2000). Experiments and numerical simulations with 2D disks assembly.Powder Technology, 109:206–221.
Laubscher, H. P. and Bernoulli, D. (1982). History and deformation in the alps. In Hsu, K. J.,editor,Mountain Building Processes, pages 169–180. Academic Press, London.
Lohrmann, J., Kukowski, N., Adam, J., and Oncken, O. (2003). The impact of analoguematerial properties on the geometry, kinematics and dynamics of convergent sand wedges.Journal of Structural Geology, 25:1691–1711.
Mackin, J. H. (1948). Concept of the graded river.Geol. Soc. Am. Bull., 101:1373–1388.
Mair, K., Frye, K. M., and Marone, C. (2001). Influence of grain characteristics on the frictionof granular shear zones.J. Geophys. Res.
Malavieille, J. (1984). Modelisation experimentale des chevauchements imbriques: applicationaux chaines de monta.Bull. Soc. geol. Fr., pages 129–138.
McClay, K. R. (1990). Deformation mechanics in analogue models of extensional fault sys-tems. In Knipe, R. J. and Rutter, E. H., editors,Deformation mechanisms, rheology andtectonics, pages 445–453. The Geological Society.
McKenzie, D. P. and Morgan, W. J. (1969). Evolution of triple junctions.Nature, 224:125–133.
Meigs, A. (1997). Sequential development of selected Pyrenean thrust faults.Journal ofStructural Geology, 19:481–502.
Meigs, A., Verges, J., and Burbank, D. W. (1996). Ten-million-year history of a thrust sheet.Geological Society of America Bulletin, 108:1608–1625.
Mellere, D. (1993). Thrust generated, back-fill stacking of allivial fan sequences, south-centralPyrenees, Spain (La Pobla de Segur Conglomerates). In Frostick, L. E. and Steel, R. J., edi-tors,Tectonic Controls and Signatures in Sedimentary Successions, pages 259–276. SpecialPublication of the International Association of Sedimentologists.
Molnar, P. (1984). Structure and tectonics of the Himalaya.Annual Review of Earth andPlanetary Sciences, 12:489–518.
Molnar, P. (1988). Continental tectonics in the aftermath of plate tectonics.Nature, 335:131–137.
Molnar, P. (2003). Nature, nurture and landscape.Nature, 426:612–614.
Molnar, P. and Chen, W. P. (1982). Seismicity and mountain building. In Hsu, K. G., editor,Mountain Building Processes, pages 41–57. Academic Press, London.
Montgomery, D. R., Balco, G., and Willett, S. D. (2001). Climate, tectonics, and the morphol-ogy of the andes.Geology, 27(7):579–582.
Morgan, J. K. and Boettcher, M. S. (1999). Numerical simulations of granular shear zonesusing the distinct element method: I. shear zone kinematics and micromechanics of local-ization. J. Geophys. Res., 104(B):2703–2719.
Bibliography 201
Morgan, J. K. (1999). Numerical simulations of granular shear zones using the distinct elementmethod: II. the effect of particle size distribution and interparticle friction on mechanicalbehavior.J. Geophys. Res., 104(B):2721–2732.
Munoz, J. A. (1992). Evolution of a continental collision belt: ECORS-Pyrenees crustal bal-anced cross-section. In McClay, K., editor,Thrust Tectonics, pages 235–246. Chapman andHall.
Munoz, J. A., Martınez, A., and Verges, J. (1986). Thrust sequences in the eastern SpanishPyrenees.Journal of Structural Geology, 8:399–405.
Mutti, E. and Sgavetti, M. (1987). Sequence stratigraphy of the Upper Cretaceous Aren strata inthe Orcau-Aren region, south-central Pyrenees, Spain: distinction between eustatically andtectonically controlled depositional sequences.Annali del l’Universita di Ferrara, 1:1–22.
Oger, L., Savage, S. B., Corriveau, D., and Sayed, M. (1998). Yield and deformation of anassembly of disks subjected to a devioric stress loading.Mechanics of Materials, 27:189–210.
Orman, J. V., Cochran, J. R., Weissel, J. K., and Jestin, F. (1995). Distribution of shorteningbetween the Indian and Australian plates in the central Indian Ocean.Earth and PlanetaryScience Letters, 133:35–46.
Paterson, M. S. (1978).Experimental Rock Deformation. Springer, New York.
Pazzaglia, F. J. and Brandon, M. T. (2001). A fluvial record of long-term steady-state upliftand erosion across the Cascadia forearc high, western Washington State.American Journalof Science, 301:385–431.
Persson, K. S. (2001). Effective indenters and the development of doubly vergent orogens:Insights from analogue sand models. InTectonic Modelling, chapter 14, pages 191–206.GSA.
Pfiffner, O. A., Lehner, P., Heitzmann, P., Muller, S., and Steck, A., editors (1997).DeepStructure of the Swiss Alps: Results of PNR 20. Birkhauser Verlag AG.
Platt, J. P. (1986). Dynamics of orogenic wedges and the uplift of high-pressure metamorphicrocks.Geol. Soc. Am. Bull., 97:1037–1053.
Pous, J., Munoz, J. A., Ledo, J. J., and Liesa, M. (1995). Partial melting of subducted continen-tal lower crust in the Pyrenees.Journal of the Geological Society of London, 150:1065–1094.
Reiners, P. W., Ehlers, T. A., Mitchell, S. G., and Montgomery, D. R. (2003). Coupled spa-tial variations in precipitation and long-term erosion rates across the Washington Cascades.Nature, 426:645–674.
Roest, W. R. and Srivastava, S. P. (1991). Kinematics of the plate boundaries between Eurasia,Iberia and Africa in the North Atlantic from late Cretaceous to the present.Geology, 19:613–616.
Roux, J. N. (2000). Geometric origin of mechanical properties of granular materials.PhysicalReview E, 61(6):6802–6836.
Rutter, E. H. (1972). The effects of strain-rate changes on the strength and ductility of Solen-hofen limestone at low temperatures and confining pressure.International Journal of RockMechanics and Mining Sciences, 9:183–189.

202 Bibliography
Schellart, W. P. (2000). Shear test results for cohesion and friction coefficients for differentgranular materials; scaling implications for their usage in analogue modelling.Tectono-physics, 324(1-2):1–16.
Seguret, M. (1972).Etude tectonique des nappes et series decollees de la partie centrale duversant sub des Pyrenees, volume Geologie Structurale. n. 2. Publications de l’Universitede Sciences et Technique de Languedoc, Montpellier.
Silbert, L. E., Grest, G. S., Plimpton, S. J., and Levine, D. (2002). Boundary effects andself-organisation in dense granular flows.Physics of Fluids, 14(8):2637–2646.
Sinclair, H. D. (1997). Tectonic-stratigraphic model for underfilled peripheral basins: AnAlpine perspective.Geological Society of America Bulletin, 109:324–346.
Sinclair, H. D., Gibson, M., Naylor, M., and Morris, R. G. (Submitted). Pyrenean orogenesisrevealed through flux measurement and modelling.American Journal of Science.
Staron, L., Vilotte, J. P., and Radjai, F. (2001). Friction and mobilization of contacts in granularnumerical avalanches.Powders and Grains.
Storti, F., Slavini, F., and McClay, K. (2000). Synchronous and velocity-partitioned thrustingand thrust polarity reversal in experimentally produced and doubly-vergent thrust wedges:Implications for natural orogens.Tectonics, 19(2):378–396.
Stuwe, K., White, L., and Brown, R. (1994). The influence of eroding topography on steady-state isotherms: Application to fission track analysis.Earth Planet. Sci. Lett., 124:63–74.
Terzaghi, K. (1943).Theoretical soil mechanics. Wiley, New York.
Ting, J. M., Khwaja, M., Meachum, L., and Rowell, J. (1993). An ellipse-based discreteelement model for granular materials.International Journal for Numerical and AnlayticalMethods in Geomechanics, 17:603–623.
Ting, J. M., Meachum, L. R., and Rowell, J. D. (1995). Effect of particle shape on the strengthand deformation mechanisms of ellipse shaped granular assemblages.Engng. Comput.,12:99–108.
Tippett, J. M. and Hovius, N. (2000). Geodynamic processes in the Southern Alps, NewZealand. In Summerfield, M. A., editor,Geomorphology and Global Tectonics, chapter 6,pages 109–134. John Wiley & Sons Ltd.
Toomey, A. and Bean, C. J. (2000). Numerical simulation of seismic waves using a discreteparticle scheme.Geophys. J. Int., 141:595–604.
Tsuji, Y., Kawaguchi, T., and Tanaka, T. (1992). Discrete particle simulation of two-dimensional fluidized bed.Powder Technology, 77:79–87.
Tucker, G. E. and Bras, R. L. (1998). Hill slope processes, drainage density, and landscapemorphology.Water Resour. Res., 34:2751–2764.
Tucker, G. E. and Slingerland, R. L. (1994). Erosional dynamics, flexural isostasy, and ling-lived escarpments: A numerical modelling study.J. Geophys. Res., 99(B6):12229–12244.
Tucker, G. E. and Slingerland, R. L. (1996). Predicting sediment flux from fold and thrustbelts.Basin Research, 8:329–349.
Bibliography 203
Tucker, G. E. and Slingerland, R. L. (1997). Drainage basin response to climate change.WaterResour. Res., 33:2031–2047.
Tucker, G. E. and Whipple, K. E. (2002). Topographic outcomes predicted by stream erosionmodels: Sensitivity analysis and intermodel comparison.J. Geophys. Res., 107(B9).
Umbanhowar, P. (2003). Shaken sand - a granular fluid?Nature, 424:886–887.
Verges, J. (1999). Estudi geologic del vessant sud del pirineu oriental i central evolucio cin-ematica en 3d. InCol-leccio Monografies tecniques, volume 7, page 194. Institute Carto-graphic de Catalunya, Barcelona.
Verges, J., Millan, H., Roca, E., Munoz, J. A., Marzo, M., Cires, J., Bezemer, T. D., Zoetemei-jer, R., and Cloetingh, S. (1995). Eastern Pyrenees and related foreland basins: pre-, syn- andpost-collisional crustal scale cross-sections.Marine and Petroleum Geology, 12:893–915.
Wang, W. H. and Davis, D. M. (1996). Sandbox model simulation of forearc evolution andnoncritical wedges.J. Geophys. Res., 101(B5):11329–11339.
Whipple, K. X. (2001). Fluvial landscape response time: How plausible is steady state denuda-tion? Am. J. Sci., 301:313–325.
Whipple, K. X. and Tucker, G. E. (1999). Dynamics of the stream-power river incision model:Implications for height limits of mountain ranges, landscape response timescales, and re-search needs.Journal of Geophysical Research - Solid Earth, 104(B8):17661–17674.
Willett, S., Beaumont, C., and Fullsack, P. (1993). Mechanical model for the tectonics ofdoubly vergent compressional orogens.Geology, 21:371–374.
Willett, S. D. (1992). Kinematic and dynamic growth and change of a Coulomb wedge. InMcClay, K., editor,Thrust Tectonics, pages 19–31. Chapman and Hall.
Willett, S. D. (1999). Orogeny and orography: The effects of erosion on the structure ofmountain belts.J. Geophys. Res., 104:28957–28981.
Willett, S. D. and Brandon, M. T. (2002). On steady states in mountain belts.GeologicalSociety of America, 30(2):175–178.
Wobus, C. W., Hodges, K. V., and Wipple, K. X. (2003). Has focused denudation sustainedactive thrusting at the Himalaya topographic front?Geology, 31(10):861–864.
Wolf, D. (1997). Friction in granular media. InPhysics of Dry Granular Media, pages 441–464. NATO Advanced Study Unit, Kluwer Academic Publishers.
Zhang, D. and Whiten, W. J. (2001). Step size control for efficient discrete element simulation.Minerals Engineering, 14(10):1341–1346.