662 k-12 education items 295-318lao.ca.gov/analysis/1978/10_k-12_1978.pdf · 662 / k-12 education...
TRANSCRIPT
662 / K-12 EDUCATION Items 295-318
EDUCATION 'Page
Summary of state education expenditures ................................................ 662 Department of Education.............................................................................. 665
Budget Bill items : ..................................... ; ................................................. 665 Summary of K-12 issues ............................................................................ q66 General overview ........................................................................ : ............... 667 Budget overview .......................................................................................... 670
Program I-Instruction .................................................................................. 672 A. Special Programs and Support Services .......................................... 673
1. Child development/preschool ...................................................... 674 2. Special education .............................................................................. 681 3. Bilingual-bicultural education ........................................................ 685 4. Compensatory education .............. ...................................... ............ 690
B. Elementary Education ..................................... : .................................... 697 1. School Improvement Program ...................................................... 697 2. Miller-Unruh Program .................................................................... 700
C. Secondary Education ............................................................................ 701 1. School Improvement Program ...................................................... 702 2. Vocational education ........................................................................ 703 3. Curriculum services ........................................................................ 709
D .. Adult Education .................................................................................... 711 Program II-Administrative Support Services (school finance) ........ 712 Program III-Department Management and Special Services............ 735
! Program IV-Library Services ..... , .............................. , ............................... 744 California Advisory Council on Vocational Education .......................... 746 Contribution to Teachers' Retirement ...................................................... 747 Commission for Teacher Preparation and Licensing ....... , .................... 749 Postsecondary Education ................................................................................ 755
SUMMARY OF STATE EXPENDITURES FOR EDUCATION
California's system of publia education is composed of elementary, secondary, and unified school districts, the community colleges, the Califorriia State University and Colleges, the University of California, the California Maritime Academy, and the state-operated schools for handicapped . children. Support for education is derived from a variety of sources, including the State School Fund, local property taxes, State General Fund/appropriations and federal aid.
In 1978-79, state General Fund expenditures for education will again account for the largest share of the budget dollar. The budget summary which follows indicates that in 1978-79, more than $5.6 billion will be spent by the state General Fund for all facets of education (excluding capital outlay). Such expenditures represent 42.2 percent of the proposed General Fund expenditures during the budget year and 36.6 percent of all expenditures, excluding bond funds.
These expenditures include $3.5 billion for K-12 education and $2,1. billion for higher education. Table 1 shows total General Fund expenditures for state administration and local assistance for both K-12 and higher edu~ation for the past fiscal year, estimated expenditures for the current
Items 295-318 • K-12 EDUCATION / 663
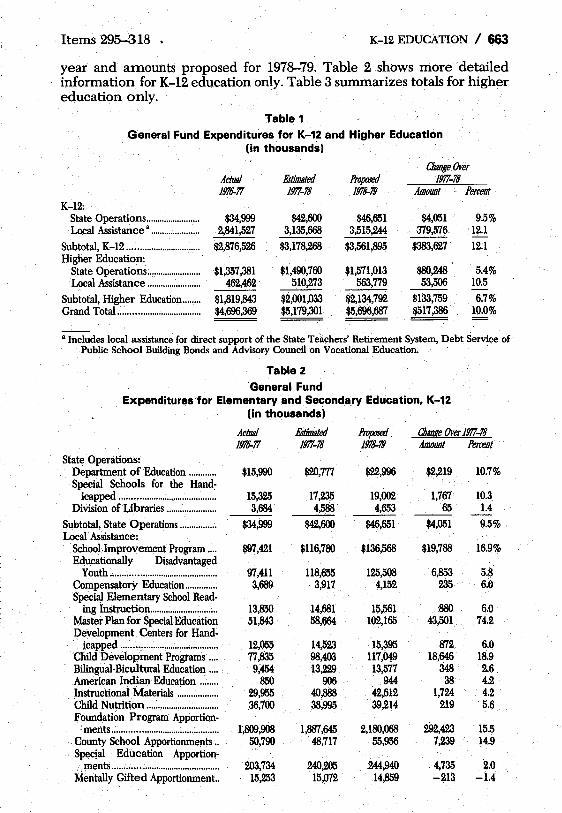
year and amounts proposed for 1978-79. Table 2 shows more detailed information for K-12 education only. Table 3 summarizes totals for higher education only. I
Table 1 General Fund Expenditures for K-12 and Higher Education
(in thousands)
CIJaoge Over Actual Ertimated Proposed 1!!l7-7S 1"6-77 1!!l7-7S 1"8-79 AmolDlt Percent
K-12: State Operations ........................ $34,999 $42,600 $46,651 $4,051 9.5% Local Assistance a •••••••••••••••••••••• 2,841,527 3,135,668 3,515,244 379,576 12.1
Subtotal, K-12 ................................ $2,876,526 $3,178,268 $3,561,895 $383,627 12.1 Higher Education:
State Operations ........................ $1,357,381 $1,490,760 $1,571,013 $80,248 5.4% Local Assistance ........................ 462,462 510,273 563,779 53,506 10.5
Subtotal, Higher Education ........ $1,819,843 $2,001,033 $2,134,792 $133,759 6.7% Grand Total.: .................................. $4,696,369 $5,179,301 $5,696,687 $517,386 10.0%
a Includes local assistance for direct support of the State Teiichers' Retirement System, Debt Service of Public School Building Bonds and. Advisory Council on Vocational Education. .
Table 2 'General Fund
Expenditures for Elementary and Secondary Education. K-12 (in thousands) .
Actual Ertimated Proposed ChaDEe Over 1!!l7-7S 1"6-77 1!!l7-7S 1"8-79 AmOlDlt Percent
State Operations: Department of Education ............ $15,990 $20,777 $22,996 $2,219 10.7% Special Schools for the Hand-
icapped ........................................... 15,325 17,235 19,002 1,7()1 10.3. Division ofI,.ibraries ...................... 3,684' 4,588 4,653 65 1.4
Subtotal, State Operations ................ $34,999 $42,600 $46,651 $4,051 9.5% . Local Assistance:
SchooUmprovement Program .... $97,421 $116,780 $136,568 $19,788 16.9% Eciucationally Disadvantaged
youth .............................................. 97,411 118,655 125,508 6,853 5.8 Compensatory Education .............. 3,689 3,917 4,152 235 6.0 Special Elementary School Read-
ing Instruction .............................. 13,850 14,681 15,561 880 6.0 Master Plan for Special Education 51,843 58,664 Development Centers for Hand-
102,165 43,501 .74.2
icapped ............................. , ............ 12,055 14,523 15,395 872 6.0 Child Development Programs .... 77,835 98,403 117,049 18,646 18.9 Bilingual~Bicultural Education .... 9,454 13,229 13,577 348 2.6 American Indian Education ........ 850 906 944 38 4.2 .Instructional Materials .................. 29,955 40,888 42,612 1,724 4.2 . Child Nutrition ................................ 36,700 38,995 39,214 219 5.6 Foundation' Program Apportion-. mertts .............................................. 1;809,908 1,887,645 2,180,068 292,423 15.5
County School Apportionments .. 50,790 48,717 55,956 7,239 14.9 Special Education Apportion-... ments .............................................. 203,734 240,205 244,940 4,735 ~.O Mentally Gifted Apportionment .. 15,253 15,072 14,859 -213 -1.4

664 / K-12 EDUCATION Items 295-318
EDUCATION-Continued
Vocational Education (RAVEC) 1,250 1,325 1,405 80 6.0 Regular Transportation Appor-
tionment ........................................ 52,450 60,000 68,000 8,000 13.3 State Teachers' Retirement Sys-
100,994 tern Apportionments .................. 133,143 157,801 24,658 18.5 . Driver Training Apportionment 21,015 22,000 22,900 900 4.1
Urban Impact Aid Program ........ 7,700 71,700 48,962 -22,738 -31.7 School Personnel Staff Develop-
ment .............................................. 1,019 1,019 Assistance to Public Libraries ...... 1,000 1,000 5,110 4,110 411.0 Other Local Assistance .................. 4,894 6,597 3,800 -2,797 -42.4 Adjustments ...................................... -28,304 -24,000 -24,000
Subtotal, Local Assistance ................ $2,671,747 $2,983,045 $3,393,565 $410,520 13.8% Subtotal, Department of Education $2,706,746 $3,025,645 $3,440,216 $414,571 13.7%, Other:
State Teachers' Retirement Sys-tem Direct Support .................... $144,300 $144,300 $144,300 $- -%
Debt Service of Public School Building Bonds .................... ; ....... 25,424 8,264 -22,705 -30,969 -275.0
Advisory Council on Vocational Education ...................................... 56 59 84 25 4.2
Subtotal, Other ............................... : .... $169,780 $152,623 $121,679 $-30,944 -20.3% Total K-12 (State Operations, Local
Assistance, Other) ...................... $2,876,526 $3,178,268 $3,561,895 $383,627 12.1 %
Table 3
General Fund Expenditures for Higher Education (in thousands)
Actual Estimated Proposed CiJanl.e Over 1977-18 1!J16-11 1977-18 1!J1f1-19 Amount Percent
State Operations: California Postsecondary Edu-
cation Commission ................ $1,321 $1,547 $1,643 $96 6.2% University of California ............ 683,742 737,523 782,197 44,674 6.1 Hastings College of Law .......... 3,647 4,130 4,375 245 5.9 California State University and
Colleges .................................... 604,833 672,524 698,096 25,572 3.8 California Maritime Academy 2,046 2,244 2,346 102 4.6 Student Aid Commission .......... 59,795 70,098 79,417 9,319 13.3 Community College Board of
Governors ................................ 1,997 2,694 2,939 245 ' 9.1 ---Subtotal, State;Operations ............ $1,357,381 $1,490,760 $1,571,013 $80,253 5.4% Local Assistance:
California Community Col-leges ............ ; ............................. $462,462 $510,273 $563,779 $53,506 10.5%
Subtotal, Local Assistance ............ ' $462,462 $510,273 $563,779 $53,506 10.5% Total, State Operations, and Lo-
cal Assistance .......................... $1,819,843 $2,001,033 $2,134,792 $133,759 6.7%

Items 295-318 K-12 EDUCATION / 665
DEPARTMENT OF EDUCATION
Items 295-318 from various funds Budget p. 792
Requested 1978-79 .......................................................................... $239,434,282 a
Estimated 1977-78 ............................................................................ 210,384,297 Actual 1976-77 ............................... : .................................................. 172,542,068
Requested -increase $29,049,985 (13.8 percent) Total recommended reduction .................................................... $498,737
1978-79 FUNDING BY ITEM AND SOURCE
"Budget Bill items represent only 7 percent of total state expenditures for K-12 education.

666 / K-12 EDlJCATION Items 29~18
DEPARTMENT OF EDUCATION-Continued
SUMMARY OF MAJOR ISSUES AND RECOMMENDATIONS PROGRAM 1-INSTRUCTION
1. Child Development. Withhold recommendation pendiIigDepartment of Education plan for proposed $11.2 million expansion of child care progtams.
2. Child Development. .Reduce Item 311b by $100,000. Recommended deletion of additional funds for evaluation of alternative child care programs.
3. Child Development. Recommend Department of Education annually report on number of additional children served as a result of replacing of federal Title XX funds with state funds.
4. Special Education. Recommend Department of Education report on need for special education research funds.
5. Bilingual Education. Recommend Department of Education and Commission for Teacher Preparation and Licensing report on availability and demand for bilingual teachers.
6. ESEA, Title IV-C. Recommend State Board of Education identify improvement of district and school management leadership as critical needs area. .
7. ESEA, Title I. Recommend Legislature direct the Department of Education to work toward amendments of ESEA, Title I to provide compatibility with current state law.
8. Migrant Education. Recommend Department of Education prepare report on funding of migrant education.
9. Demonstration Programs. Recommend Department of Education disseminate information on Demonstration Pro~ grams to selected districts.
10. Professional Development and Program Improvement Centers. Recommend centers be expanded to secondary schools.
11. School Improvement Program (K-6). Recoinmend De- . partment of Finance justify rationale for not providing $6.9 million in inflation funds for the School Improvement Program (SIP).
12. Miller-Unruh. Recommend Department of Education submit plan for allocating unused Miller-Unruh appropriations.
13. Miller-Unruh. Recommend Education Code modification to allow credentialed reading specialists to qualify as Miller-Unruh teachers. .
14. School Improvement Program (7-12). .Recommend Department of Education submit plan for allocation of secondary School Improvement funds.
15. Vocational Education. Recommend Department of Edu-
Analysis page
677
678
679
684
687
689
691
692
695
696
698
700
701
702
704

Items 295-318 K-12 EDUCATION I 667
cation submit workplan on current vocational education staff.
16. Vocational Education. Reduce Item 295 by $120,000. Hec- 707 ommend deletion of two consultant positions. (See Community College (Item 339) recommendations for companion recommendation.)
PROGRAM II-ADMINISTRATIVE SUPPORT SERVICES 17. Urban Impact Aid. Recommend Department of Educa- . 721
tion submit report on Urban Impact Aid. 18. Textbooks. Recommend $9.8 million surplus in Instruc- 723
tional Materials Fund be used to replace obsolete textbooks.
19: Textbooks. Recommend Department of Education im- 724 plement price review system for textbook purchases.
20. Textbooks. Recommend· budget language to shorten 724 length of textbook adoption cycle.
2L Nutrition. Recommend Depaitment of Education assign ,729 responsibility for nutrition education and training to Bu~ reau of Child Nutrition Services.
22. Nutrition. Recommend Nutrition Component of the 729 Health Instruction Framework be amended to include a . content area goal related to food waste.
23. Nutrition. Recommend Department of Education submit 730 report on unmet need for food service equipment.
PROGRAM III-DEPARTMENT MANAGEMENT AND SPECIAL SERVICES
24. Legal Office. Recommend Departments of Finance and 736 Education provide information on private legal counsel for
, Serrano defense. 25. Evaluation Staff. Reduce Item 295 by $233,737. Recom- 737
mend reduction in Department of Education evaluation' staff due to recommended elimination of internal evalua-tion.
26. Statewide Testing. Recomm~nd Department of Educa- 738 tion submit report on selected testing program procedures.
27. Office. of Dissemination. Recommend Department of 739 Education disseminate information on Office of Criminal Justice Planning projects aimed at reducing school crime and violence. .
28: Management. Recommend Department of Education 742 submit report on department's new fiscal management sys-tem.
29. Management. Recommend' Department of Education 742 submit report on Data Acquisition ang C6ntrotproject.
PROGRAM IV-LIBRARY 30. Library. lJeduce Item 303 by $45,000. Recowmend dele~ "46
tion of funding for statewide library conference. (AIsq reduce federal funds for this itemby $25,000.)

&68 / K-12 EDUCATION Items 295-318
DEPARTMENT OF EDUCATION-Continued
GENERAL PROGRAM STATEMENT
General Fund expenditures for K-12 education are estimated to total $3.5 billion in 1978-79 or about 26.4 percent of the state's General Fund expenditures. There are approximately 4.3 million students enrolled in public elementary and secondary schools in the state which places California first among the states with about 1 million more students thim second place New York. An additional 780 thousand adults attend classes in the high schools. California's 1,044 school districts employ about 377,000 people or approximately 3.8 percent of the work force of the state. Of that total, 207,000 are teachers.
, Enrollment
School districts are classified as unified, elementary or high. school. About 67 percent of the students attend classes in the 260 unified districts. (There are 669 elementary districts and 115 high school districts.) District enrollment size ranges from less than 100 to over 650,000 students in Los Angeles. The second largest district is San Diego with approximately 125,000 students.
Total enrollment in California is declining slightly as is enrollment in the United States as a whole. Table 1 compares average daily attendance figures at the elementary, high school and adult levels for the period 1976-77 through 1978-79.
Table 1
K-12 Second Period ADA Comparsion for Selected Years (in thousands)
Percent Change Level Elementary ................................................. . High School ................................................. . Adult ............................................................ ..
1976-77 3,033.2 1,476.9
226.0
\ 4,736.1
1977-78 2,958.6 1,489.3
255.2
4,703.2
1978-79 Over 1977-78 2,888.7 -1.2% 1,486.9 ~0.2
291.8 +14.3 4,667.5 "'-0.8%
Current projections through 1982-83 show high school attenaapce decreasing throughout the period, elementary ADA starting to increase in 1981-82, and adult attendance increasing by over 14 percent per year duringthe entire period. The net effect will be decreasing ADA in 1~79-80 and 1980-81 and slight overall increases in 1981-82 and 1982-83.
The Costs
The average statellocal/federal expenditure per pupil in 1975-"76 was $1,335 which placed California 24th among the states. Average current expense in the United States for that year was $1,388. California,'s state share of this expense was 42.1 percent with local districts contribuffng 51.8 percent and the fedet:al government contributing 6.1 percent. California's state share was slightly less than the national average state share of 43.7 percent. Table 2 compares the relative shares of General Fund income for . local school districts from federal, state and local sources for the period 1971-72 through 1975-"76. .

Items 295-318 K-12 EDUCATION /669
Table 2 Percentage Share of General Fund Income
from Federal. State and Local Sources to Local School Districts' 1971-72 through 1975-76
Source Federal ................................................. . State ............................... ; ....................... . Local ....................................................... .
1~~~ 1~~n 1~~U
7.2% 34.6 58.2
6.9% 33.2 59.9
5.9% 43.4 50.7
1~4-75
6.5% 42.4 51.1
1975-76 6.1%
42.1 51.8
a Sources: State Controller's Annual Report of Financial Transactions Concerning School Districts of California for selected years. Figures exclude community college income for all years, include combined federal and state money under federal heading and county income under local heading. State share figures also include local assistance for Instructional Materials and the state's direct contribution for the State Teachers' Retirement System.
Table 3 lists the major federal education aid programs and shows actual expenditures under each for the past fiscal year and estimated expenditures for the current and budget years, The Child Nutrition Act is the largest program, and in absolute dollar terms, it is expected to increase the most in 1978-79. On a percentage basis, aid for handicapped children will increase the most in 1978-79.
Table 3 Federal Support to California Schools
A .. Programs Included in the Govemor~s Budget: Elementary and Secondary Educa
tion Act: Title I: Compensatory Education Low Income Families ..................... . Migratory Worker Families .......... .. All Other Title I ............................... .
Title IV-B ............................................ .. Title IV-C ............................................. .
Education of the Handicapped Act .. Child Nutrition Act. ............................. . Adult Basic Education ........................ .. Voc~tiOilal' Education Act .................. .. All Others ; ............................................. ..
Subtotal ............................................... . B. Programs Not Included in the Gover-
nor's Budget: . Elementary and Secondary Educa
tion Act: Title VII (Bilingual Education)
(Direct Support) ............................ .. Economic Opportunity Act"":"Follow
Through (Direct Support) ........ .. Public Law 81-874 (Impact Aid) .... .. Subi~tal ............ : .. _ ..................................... .
GRAND TOTAL ....................................... . , .; ~\
Actual Estimated Proposed 1~8-79 Change 1~6-77 1977-78 1~8-79 Amount Percent
$137.8 $159.4 $159.7 $.3 -% 27.0 34.4 34.4 5.5 8.2 9.0 .8 +9.8
15.6 15.2 16.0 .8 +5.3 15.9 18.2 18.3 .1 .1 22.6 30.9 54.6 23.7 76.7
195.7 241.5 267.8 26.3 +10.9 5.7 7.1 7.4 .3 +4.2
53.7 51.0 51.2 .2 +0.4 9.2 17.3 9.0 -8.3 -48.0
-- -- --$488.7 $583.2 $627.4 $+44.2 +7.6%
$24.7 $24.4 $24.4
5.9 6.1 6.1 126.3 130.0 130.0 -- -- --
$156.9 $160.5 $160.5
$645.6. $743.7 $767.9 $+44.2 +5.9%
670 / K-12 EDUCATION Items 295-318
DEPARTMENT OF EDUCATION-Continued
Student Achievement
The California Assessment Program tests student skills in reading anhe 2nd and 3rd grades and in reading, writing, mathematics, and spelling at grades 6 and 12. Results of the testing program in i976-77 were mixed.
Reading achievement in grades 2 and 3 registered a moderate increase as compared to the previous year. This continued a trend of steady improvement at these grade~ which has occurred since statewide testing began in 1966 and which parallels a pattern found nationwide.
Achievement in grade 6 varied during 1976-77. Scores improved in written expression and mathematics, declined slightly in reading, and remained constant in spelling. At grade 12, scores decreased in all areas, continuing the decline which has occurred over the past several years.
1975-79, Budget Overview
The budget of the State Department of Education is composed of both state operations and local assistance items. The state operation items provide support for state level administration of the public school system, the State Library and the state special schools. The local assistance items provide support for programs such as school improvement and disadvantaged youth. Approximately 93 percent of K-12 1978-79 state General Fund expenditures will be appropriated by statute rather than the annual Budget Act. These funds provide total or partial support for the (1) Foun-
, dation program, (2) School Improvement Program, (3) Disadvantaged Youth program, (4) special education, and (5) the State Teachers Retirement System among others. Budget Bill items this year comprise only $239.4 million.
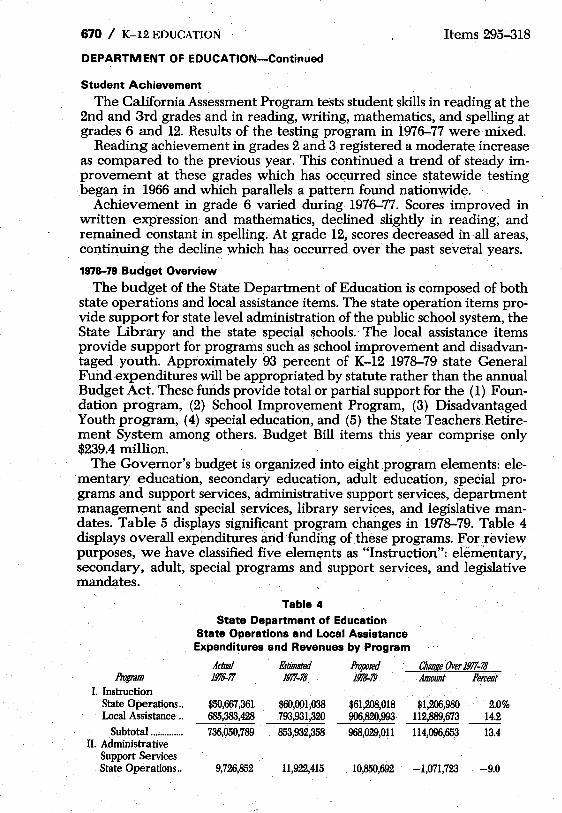
The Governor's budget is organized into eight program elements: elementary education, secondary education, adult education, special programs and support services, administrative support services, department management and special services, library services, and legislative mandates. Table 5 displays significant program changes in 1978-79. Table 4 displays overall expenditures and funding of these programs. :for review purposes, we have classified five elements as "Instruction": elememtary, secondary, adult, special programs and support services, and legislative mandates.
Table 4 State Department of Education
State Operations and Local Assistance Expenditures and Revenues by Program
Actual Ertimated Proposed Cbaoge Over 1977-78 Program 1N5-77 1977-78, 1NB-79 Amount Percent
I. Instruction State Operations .. Local Assistance ..
Subtotal ............. . II. Administrative
Support Services State Operations ..
$50,667,361 685,383,428
736,050,789
9,726,852
$60,001,038 793,931,320 853,932,358
11,922,415
$61,208,018 $1,206,980 2.0% 906,820,993 112,889,673 14.2 968,029,011 114,096,653 13.4
10,850,692 -1,071,723 -9.0
Items 295--318 K-12 EDUCATION /611
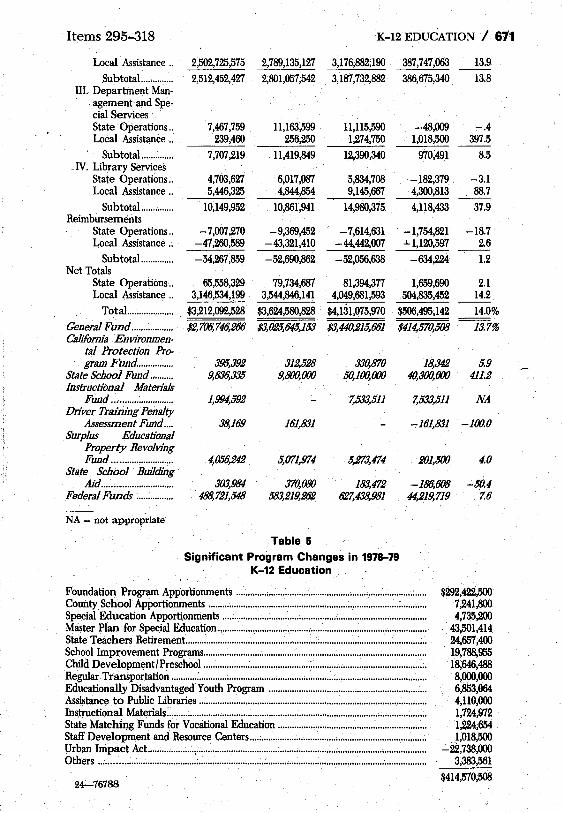
Local Assistance .. 2,502,725,575 2,789,135,127 3,176,882,190 387,747,063 13.9
Subtotal .............. 2,512,452,427 2,801,057;542 3,187,732,882 388,675,340 13.8 III. Department Man-
agement and Spe-cial Services State Operations .. 7,467,759 11,163,599 11,115,590 -48,009 -.4 Local Assistance .. 239,460 256,250 1,274,750 1,018,500 397.5
Subtotal .............. 7,707,219 11,419,849 12,390,340 970,491 8.5 _IV. Library Services
State Operations .. 4,703,627 6,017,087 5,834,708 -182,379 -3.1 Local Assistance .. 5,446,325 4,844,854 9,145,667 4,300,813 88.7 --
Subtotal .............. 10,149,952 10,861,941 14,980,375. 4,118,433 37.9 Reimbursements
State Operations .. -7,007,270 -9,369,452 -7,614,631 . -1,754,821 -18.7 Local Assistance .. -47,260,589 -43,321,410 - 44,442,007 +1,120,597 2.6
Subtotal .............. -54,267,859 -52,690,862 -52,056,638 -634,224 1.2 Net Totals
State Operations .. 65,558,329 79,734,687 81,394,377 1,659,690 2.1 Local Assistance .. 3,146,534,199 3,544,846,141 4,049,681,593 504,835,452 14.2
Total .................... $3,212,092,528 $3,624,580,828 $4,131,075,970 $506,495,142 14.0%
General Fund .................. $2,706,748,268 $3,025,&15,153 $3,440,215,661 $414,570,508 13.7% California Environmen-
tal Protection Pro-gram Fund ............... 395,392 312,528 330,870 18,342 5.9
State School Fund .......... 9,838,335 9,800,000 5O,1(}(),000 4O,3(}(),000 411.2 Instructional Materials
Fund.: ........................ 1,994,592 7,533,511 7,533,511 NA Driver Training Penalty
Assessment Fund .... 38,169 161,831 -161,831 -100.0 Surplus Educational
Property Revolving Fund .......................... 4,056,242 5,071,974 5,273,474 201,500 4.0
State School Building Aid ....... _ ...................... 303,984 370,080 183,472 -186,608 ~$O.4
Federal Funds ................ 488,721,548 583,219,262 627,438,981 44,219,719 7.6
NA = not appropriate
Table 5 Significant Program Changes in 1978-79
K-12 Education .
Foundation Program Apportionments ............. ; ............................................ ; ................. : .... . County School Apportionments ................................. , .......................................................... .. Special Education Apportionments ............................ ~ .... ; .................................................... .. Master Plan for Special Education ............................. , .......................................................... .. State Teachers Retirement ...................................................................................................... .. School Improvement Programs ......................................... : .................................................... .. Child Development/Preschool ............................................ :.; ............................................... .. Regular Transportation ........... : ................................................................................................. .
$292,422,500 7,241,800 4,735,200
43,501,414 24,657,400 19,788,955 18,646,488 8,000,000
Educationally Disadvantaged Youth Program .................................................................. .. Assistance to Public Libraries ................................................................................................. . Instructional Materials .............................................................................................................. .. State MatchiI).g Funds for Vocational Education .............................................................. .. Staff Development and Resource Centers .......................................................................... .. Urban Impact Act.. .................. , .................................................................................................. . Others ............................................................................... ; .......................................................... ..
24-76788
6,853,064 4,110,000 1,724,972 1,224;654 1,018,500
-22,738,000 3,383,561
$414,570,508

672 / K-12 EDUCATION Items 295-318
DEPARTMENT OF EDUCATION-Continued
The 1978-79 Budget reflects a major expansion in General Fund support for K-12 education amounting to $414.6 million (13.7 percent) over the 1977-78 base of $3.02 billion. However, it must be noted that this increase was primarily pre-determined by the passage of Chapter 894, Statutes of 1977 (AB 65). Consequently, the amount of fiscal changes we recommend will· not appear commensurate with the magnitude of increased funds. Most of our analysis concerns the implementation of AB 65. It is estimated that increased cost to the state due to this act will total $4,649 million over the net five years. AB 65 not only made basic school finance changes but also increased foundation levels and provided additional money for existing or new categorical programs. More discussion of AB 65 occurs under Program II.
PROGRAM I
INSTRUCTION
The instruction program consists of four elements: (a) special programs and support services (b) elementary education (c) secondary education and (d) adult education. Table 6 displays expenditures for each of the elements.
Table 6 Instruction Program Expenditures and Funding
Actual Estimated Proposed CiJange Over 1977-78 Element 1976-77 1977-78 1976-79 Amount Percent
A. Special Programs and Sup· port Services:
1. Child Development/Pre· school .................................. '.. .. $104,460,865 $119,773,894 $137,498,124 $17,724,230 14.8%
2. Special Education ................ 107,187,917 129,693,309 197,427,608 67,734,299 52.2 3. Bilingual·Bicultural ............ 16,353,657 24,435,431 18,324,590 -6,110,841 -25.0 4. Information/Program Dis·
semination '..'..'...'..'..'...'.. .. '..'..'..'.. .. 5. Legislative Mandates'..'..'..'..'.. 38,723 70,595 318,690 248,095 351.4
Subtotal '..'...'.. .. '..'...'..'..'...'..'..'...'..'..'..'..'.. $228,041,162 $273,973,2~9 $353,569,012 $79,595,783 29.1% B. Elementary Education:'
1. Elementary School Im· provement Program '..'..'..'.. .. $98,516,453 $116,646,571 $129,476,919 $12,830,348 11.0%
2. Consolidated Categoricals 258,136,595 294,401,348 303,233,846 8,832,498 3.0 3. General Activities'...'..'.. .. '...'..'.. 1,426,391 1,493,555 1,555,506 61,951 4.1 4. Compensatory Education'.. - 30,114,277 40,048,194 40,718,462 670,268 1:7
Subtotal '..: ...... '...'...'...'..'..'..'..'.. .......... $388,193,716 $452,589,668 $474,984,733 $22,395,065 4:9% C. Secondary Education:
1. General Secondary Educa· tiOJ;l Activities '..'..'..'..'.. .... '..'.. .. '.. $3,256,297 $3,517,475 $3,724,263 $206,788 .5.9%
2. Consolidated Categoricals 38,224,109 41,960,050 43,599,200 1,639,150 3.9 3. School Improvement Pro·
gram'..'..'..'.. ......... '.. ............. '...'.. ... 1,614,500 9,240,737 7,626,237 472.4 4. Vocational Education '..'.. .... 66,457,833 65,339,581 67,841,680 2,502,099 3.8 5. Traffic Safety ................ '.. ...... 322,404 558,126 535,644 -22,482 -4.0 6. Curriculum' Services '..'.. ...... 4,193,099 5,364,734 5,094,722 -270,012 -5.0
Subtotal '..'..'.. .......... '...'.. .. '..'..'.. .. '.. ..... $112,453,742 $118,354,466 $130,036,246 $11,681,780 9.9%

Items 295-318 K-12 EDUCATION / 673
D. Adult Education: 1. Adult Education Instruc-
tion .......................................... $6,237,170 $7,667,'lJ37 $8,035,545 $368,258 "4.8% 2. Postsecondary Education
(School Approvals) ............ 1,124,999 1,347,708 1,403,475 55,767 4.1
Subtotal ...................................... $7,362,169 $9,014,995 $9,439,020 $424,025 4.7% TOTALS .......................................... $736,050,789 $853,932,358 $968,029,011 $114,096,653 13.4% State Operations .......................... 50,667,361 60,001,038 61,208,018 1,206,980 2.0 Local Assistance ............................ 685,383,428 793,931,320 906,820,993 112,889,673 14.2
General Fund ............................ 399,078,812 471,443,090 566,908,741 95,465,651 20.3 Federal funds ............................ 284,121,899 331,569,613 350,425,332 18,855,719 5.7 Reimbursements ...................... 52,466,578 50,619,655 50,376,938 -242,717 -.5 California Environmental
Protection Program Fund .. 395,392 312,528 330,870 18,342 5.9
A. SPECIAL PROGRAMS AND SUPPORT SERVICES
This element is responsible for (1) child development, (2) special education, (3) support services and bilingual-bicultural education, and (4) information/program dissemination. The latter element is discussed under this eh~ment in the Governor's Budget, however, funding is shown with the Department Management and Special Services (Program III). Elementary and secondary general activities, consolidated categorical programs, and compensatory education are divided throughout the Governor's Budget. To facilitate legislative review, they are discussed .under the one topic heading of compensatory education in this element (page 690).
Table 7 summarizes funding by component and by source.
Table 7 Special Programs and Support Services
" Actual Ertimated Proposed ~e Over lf1l7-78 Component 1976-77 1977-78 1978-79 Amount Percent
1. Child Development/Pre-school ........................................ .. $104,460,865 $119,773,894 $137,498,124 b $17,724,230 14.8%
2. SpeCial Education .................. .. 107,187,917 129,693,309 197,427;608 67,734,299 52.2 3. Bilingual-Bicultural .............. .. 16,353,657 24,435,431 18,324,590 -6,110,841 -25.0 4. Information/Program Dis-
semination a ............................ ..
5. Legislative Mandates ............. . 38,723 70,595 '.318,690 248,095 351.4
Total ....................................... . $2'lJ3,041,162 $273,973,229 $353,569,012' $79,595,783 29.1% State Operations:
General Fund ........................... . $19,587,361 $22,957,058 $25,023,419 $2,066,361 9.0% Federal funds ........................... . 5,878,575 8,094,827 9,122,606 . 1,027,779 12.7. Reimbursements ..................... . 3,704,607 4,492,143 . 3,750,334 -741,809 -16.5
lAical Assistance: General Fund ........................... . 130,231,601 159,521,439 221,381,222 61,859,783 38.8 Federal funds .......................... .. 31,717,885 46,907,314 62,302,482 15,395,168 32.8 Reimbursements .................... .. 36,921,133 32,000,448 31,988,949 -11,499 .::....4%
a Totals shown with Program III. b Does not include $14,131,321 administered in the elementary education program.
1. CHILD DEVELOPMENT/PRESCHOOL
Child development programs administered by the Department of Education include both child care services and the state preschool program. Expenditures and funding are shown in Table 8 on page 674.

674 / K-12 EDUCATION Items 295-318
DEPARTMENT OF EDUCATION-Continued
Table 8
Child Development/Preschool Expenditures and Funding
Actual Estimated Proposed 1978-79 Change Activity 197~77 1977-78 1978-79 Amount Percent
A. Child Care Services: State Operations ...... $2,437,599 $2,843,671 $2;772,688 a $-70,983 -2.5% Local Assistance ........ 90,955,654 104,994,216 122,087,923 17,093,707 16.3
Subtotal ...................... $93,393,253 $107,837,887 $124,860,611 $17,022,724 ll;i.B% B. Preschool Education:
State Operations ...... $475,794 $729,566 $754,267 $24,701 ~.4% Local Assistance ........ 23,145,805 24,542,044 26,014,567 1,472,523 .6.0
Subt9tal ...................... $23,621,599 $25,271,610 $26,768,834 b $1,497,224 5.9% Combined Totals:
State Operations ...... $2,913,393 $3,573,237 $3,526,955 $-46,282 -1.3% Local Assistance ........ 114,101,459 129,536,260 148,102,490 IB,566,230 14.3
Total ............................ $117,014,852 $133,109,497 $151,629,445 b $IB,519,948 13.9% General Fund .................. $78,632,855 $99,629, 773 $118,161,515 $18,531,742 18.6% Federal Funds ................ 457,000 457,000 457,000 Reiinbursements ............ 37,924,997 33,022,724 33,010,930 0 -11,794 .1
a Includes $400,653 for alternative child care; does not include $74,634 budgeted for two auditor positions in Program III. .
b Both $14,131,321 of the preschool program budget administered by the elementary education program manager and $12,637,513 by the Office of Child Development are shown in this table in order to reflect total program size. .
o $32,470,943 in Federal reimbursements and. $540,037 in State reimbursements.
A. Child Care Services
Administration
The Child Development Act requires the Department of Education to (1) formulate and promote a child development program in all California communities where.the need exists; (2) adopt rules, regulations and standards for accreditation of neighborhood family day care homes administered by the department; (3) establish rules for program eligibility and priority of services; (4) establish fee schedules; (5) prescribe minimum educational standards; (6) give priority to children of lower income families who qualify under federal Title XX regulations and other low-income aIid disadvantaged families; (7) generate the maximum federal reimbursement for federally eligible children.
Major program goals are (a) to enhance the educational performance of participant children, (b) to assist families in becoming self-sufficient by enabling parents to work or receive employment training, and (c) to provide families with a full range of child development services ill the areas of education, supervision, health, nutrition, social services, parent participation, and parent education.
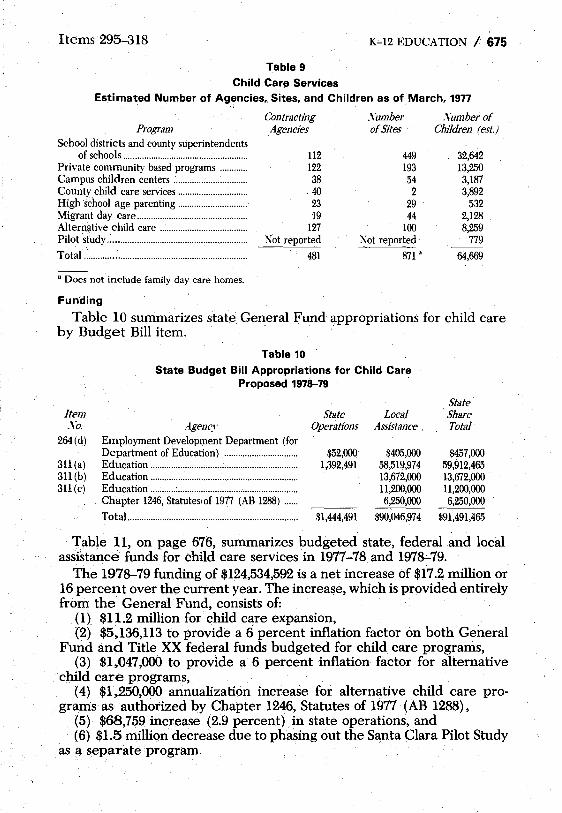
Table 9, on page 679, summarizes the scope of department child. care services based on data for March, 1977. The table indicates that more than 481 agencies were serving an estimated 65,000 children.
Items 295-318 K-12 EDUCATION / 675
Table 9
Child Care Services Estimated Number of Agencies. Sites. and Children as of March. 1977
Program School districts and county superintendents
of schools .................................................... .. Private community based programs .......... .. Campus children centers .............................. .. County child care services ............................ .. Highschool age parenting ............................ .. Migrant day care .............................................. .. Alternative child care .................................... .. Pilot study ........................................................... .
Total .................................................................... ..
• Does not include family day care homes.
Funding
Contracti'ng Agencies
112 122 38
.40 23 19
127 Xot reported
481
.\'umber of Sites
449 193 54 2
29 . 44
100 Not reported
871 •
Xumberof Children (est.)
32,642 13,250 3,187 3,892
532 2,128 8,259
779
64,669
Table 10 summarizes state. General Fund appropriations for child care by Budget Bill item. .
Item .\0.
264 (d)
311(a) 311 (b) 311 (c)
Table 10
State Budget Bill Appropriations for Child Care Proposed 1978-79
State Agenc:v Operations
Employment Development Department (for Department of Education) ................................ $52,000 Education ................................................................ 1,392,491 Education ............................................................... . Education ........... : ................................................... . Chapter 1246, Statuteslof 1977 (AB 1288) .... ..
Local Assistance ,
8405,000 58,519,974 13,672,000 11,200,000 6,250,000
State Share Total
$457,000 59,912,465 13,672,000 11,200,000 6,250,000
Total.......................................................................... $1,444,491 $90,046,974 $91,491,465
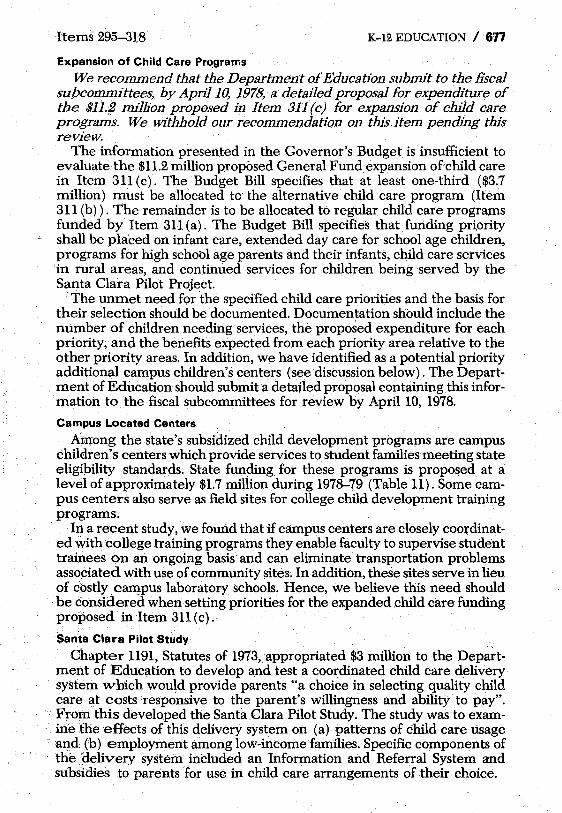
Table 11, on page 676, summarizes budgeted state, federal and local assistance funds for child care services in 1977-78 and 1978-:-79.
The 1978--79 funding of $124,534,592 is a net increase of $17.2 million or 16 percent over the current year. The increase, which is provided entirely from the General Fund, consists of:
(1) $11.2 million for child care expansion, . (2) $5,136,113 to provide a 6 percent inflation factor on both General
Fund and Title XX federal funds budgeted for child care programs, (3) $1,047,000 to provide a 6 percent inflation factor for alternative
child care programs, (4) $1,250,000 annualization increase for alternative child care pro
grams as authorized by Chapter 1246, Statutes of 1977 (AS 1288), (5)$68,759 increase (2.9 percent) in state operations, and (6) $1.5 million decrease due to phasing out the Santa Clara Pilot Study
as a separate program.
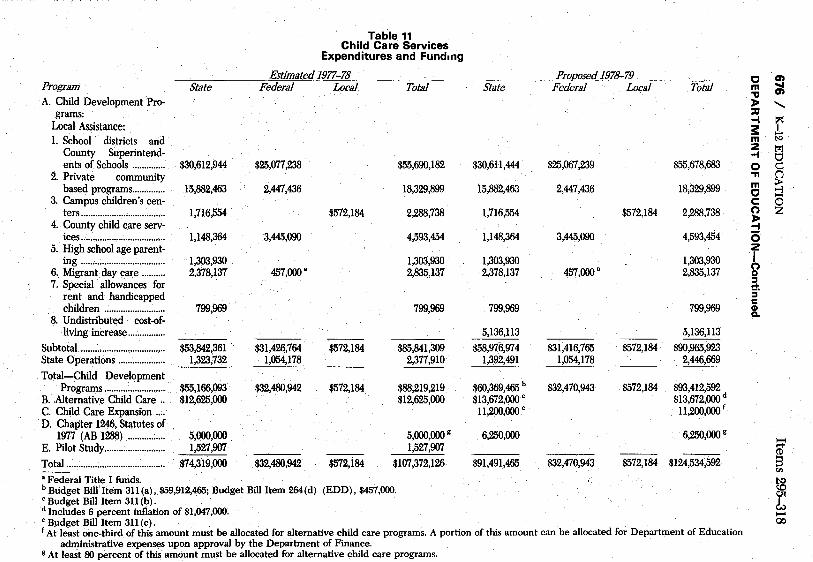
Table 11 Child Care Services
Expenditures and Fundlllg
Estimated 1977-78 Pro12osed 1978-79 C en Program State Federal Local Total State Federal Local Total m ....
~ en A. Child Development Pro- ):0 ......
grams: ;:g
Local Assistance: -I ~ s: -1. School districts arid m t<>
County Superintend- Z t>l -f CI
ents of Schools ........ : ..... $30,612,944 $'l15,CY17,238 $55,690,182 $30,611,444 $'l15,067,239 $55,678,683 0 c:: 2. Private community ." n
based programs .............. 15,882,463 2,447,436 18,329,899 15,882,463 2,447,436 18,329,899 m > C -I
3. Campus children's cen- -C 0 ters .................................... 1,716,554 $572,184 2,288,738 1,716,554 $572,184 2,288,738 (") Z
4 .. County child care serv-):0 -f
ices .................................... 1,148,364 3,445,090 4,593,454 1,148,364 3,44{l,090 4,593,454 (5 5. High school age parent- Z
ing ..................................... 1,303,930 1,303,930 1,303,930 1,303,930 I (")
6. Migrant day care .......... 2,378,137 457,000' 2,835,137 2,378,137 457,000' 2,835,137 0 7. Special allowances for :I ..
rent and handicapped :j' c
children .......................... 799,969 799,969 799,969 799,969 CD
8. Undistribut~d cost-of-a.
living increase ................ 5,136,113 5,136,113
Subtotal .................................... $53,842,361 $31,426,764 $572,184 $85,841,309 $58,976,974 $31,416,765 $572,184 $90,965,923 State Operations .................... 1,323,732 1,054,178 2,377,910 1,392,491 1,054,178 2,446,669
Total-Child Development Programs .......................... $55,166,093 $32,480,942 $572,184 $88,219,219 $60,369,465 b $32,470,943 $572,184 $93,412,592
B .. Alternative Child Care .. $12,6'l15,000 $12,6'l15,000 $13,672,000 c $13,672,000 d
C. Child Care Expansion .... 11,200,000 " 11,200,000 f D. Chapter 1246, Statutes of
1977 (AB 1288) ................ 5,000,000 5,000,ooog 6,250,000 6,'l150,ooog -E. Pilot Study ... , ...................... 1,527,907 1,527,907 ,.,. CD
Total .......................................... $74,319,000 $32,480,942 $572,i84 $107,372,126 $91,491,465 $32,470,943 $572,184 $124,534,592 S til
• Federal Title I funds. t.Q bBudget Bill Item 3ll(a), $59,912,465; Budget Bill Item 264(d) (EDD), $457,000. CO
C Budget Bill Item 311 (b) . l: d Includes 6 percent inflation of $1,047,000: ~
"Budget Bill Item 3ll(c). 00 f At least one-third of this amount must be allocated for alternative child care programs. A portion of this amount can be allocated for Department of Education
administrative expenses upon approval by the Department of Finance. g At leaSt 80 percent of this amount must be allocated for alternative child care programs.
. Items 295-318 K-12 EDUCATION / 677
Expansion of Child Care Pro.9rams
We recommend that the Department of EducaUon submit to the fiscal supcommittees, by April 10, 1978, a detailed proposal for expenditure of the $1i.2 million proposed in Item 311 (c) for expansion of child care programs. We withhold our recommendaUon on this item pending this review.
The information presented in the Governor's Budget is insufficient to evaluate the $11.2 million proposed General Fund expansion of child care in Item 311(c). The Budget Bill specifies that at least one-third ($3.7 million) must be allocated to the alternative child care program (Item 311 (b)). The remainder is to be allocated to regular child care progra;rns funded by Item 311 (a). The Budget Bill specifies that funding pdority shall be placed on infant care, extended day care for school age children, programs for high schot>l age parents and their infants, child care services . in rural areas, and continued services for children being served by the Santa Clara Pilot Project. '
The unmet need for the specified child care priorities and the basis for their selection should be documented. Documentation should include the number of children needing services, the proposed expenditure for each priority, and the benefits expected from each priority area relative to the other priority areas. In addition, we have identified as a potential priority additional campus children's centers (see discussion below). The Depart-
. ment of Education should submit a detailed proposal containing this information to the fiscal subcommittees for review by April 10, 1978.
Campus Located Centers
Atrrong the state's subsidized child development programs are campus children's centers which provide services to student families meeting state eligibility standards. State funding for these programs is proposed at a level of approximately $1.7 million during 1978-79 (Table 11). Some campus centers also serve as field sites for college child development training programs.
In a recent study, we found thatif campus centers are closely coordinated with college training programs they enable faculty to supervise student trainees on an ongoing basis and can eliminate transportation problems associated with use of community ~ites. In addition, these sites serve in lieu of qostly campus laboratory schools. Hence, we believe this need should be considered when setting priorities for the expanded child care funding proposed in Item 311 (c) .
Santa Clara Pilot Study
Chapter 1191, Statutes of 1973, appropriated $3 million to the Department of Education to develop and test a coordinated child care delivery system which would provide parents "a choice in selecting quality child car~ at costs responsive to the parent's willingness and ability to pay". From this developed the Santa Clara Pilot Study. The study was to examine the effects of this delivery system on (a) patterns of child care usage and (b) employment among low-income families. Specific components of the delivery system inCluded an Information and Referral System and subsidies to parents for use in child care arrangements of their choice.
678 / K-12 EDUCATION Items 295-318
DEPARTMENT OF EDUCATION-Continued
The pilot study was also to describe the existing supply of and demand for'child care services and the characteristics of child care users. In addition, it was to identify the management and accountability requirements of the experimental delivery system and the procedures necessary for implementing it statewide. The final report on the study was to be submitted to the Legislature on July 1, 1977. However, it had not been received as of early February 1978.
Independent Evaluation of Alternative Child Care Programs ...
We recommend deletion of an additional $100,000 proposed in Item 311 (b) for evaluation of the alternative child care programs authorized by Chapter 344, Statutes of 1976. ..
Chapter 344, Statutes of 1976, requires an independent evaluation to assess the effectiveness and efficiency of th~ various alternative child care programs. It is to assist the Legislature in (a) determining whether the cost of subsidized care can be reduced while the quality of services is maintained and (b) identifying replicable features of the alternative programs which warrant inclusion within California's overall subsidized child care system. The evaluation is to include a comparison of the various alternative child care programs authorized by Chapter-344, and a comparison of these programs with others administered by the department.
Chapter 344 appropriated $100,000 in 1976-77 for this evaluation. The Budget Act of 1977 appropriated an additional $100,000 for this purpose: The Governor's Budget proposes still another $100,000 in 1978-79.
The Department of Education awarded the contract for the independ- . ent evaluation to AbtAssociates, Inc. in an amount not to exceed $198,629. / The final report is due to the Legislature by January 1, 1979. Because the contract can be funded from previous appropriations, we recommend the deletion of the extra $100,000 in the 1978-79 budget bill.
Status of Evaluation
The contract was based on the legislative requirement that the Department of Education provide the basic statistical, cost and evaluative data needed for the study. However, in its first evaluation report, the, independent contractor, Abt Associates, Inc. reported that the department's data are not sufficient to accomplish the study purposes. In view of this,
. the department should inform the fiscal subcommittees of how it plans to fulfill the statutory mandate for the independent evaluation. The departmentshould indicate (a) why data are inadequate for the specified purposes, (b) what additional resources, if any, would be required to meet fully the specifications of. Chapter 344, and (c) the time necessary to complete the evaluation tasks.
Migrant Day Care
The Governor's Budget proposes $2,378,137 from the General Fund to the Department of Education for operation of ~igrant day care centers; federal funding brings the total to $2,835,137. Included is $457,000 transferred from the Employment pevelopment Department (EDD) budget for the operation of day care centers at state-operated housing communi-
Items 295-318 K-12 EDUCATION I 679
ties for migrant families. An additional $43,000 remains within the EDD budget for facilities rehabilitation of the child care centers at these communities.
The Department of Education has the principal operational responsibility for migrant day care centers. EDD's responsibility is to supervise upkeep and maintenance of state-operated housing communities including the child care centers.
A number of recent reviews have indicated a need for substantial rehabilitation of these child care centers in order to correct problems potentially dangerous to the safety of children. Among needed improvements are installation of window and door screens, upgrading of plumbing fixtures and electrical wiring, and repairs of ceilings and floors. The preseJ)t funding of $43,000 for such improvements is inadequate.
IriOur analysis of the EDD budget (Item 264 (d) ), we have recommended that EDD submit to the JOint Legislative Budget Committee by March 31,1978, a report on the physical condition of migrant day care centers and the improvements needed to ensure the adequacy of these facilities. A jointhearing on this report may be beneficial.
Annual Report on Publicly Subsidized Child Care
We recommend that the Department of Education include in its 1977-78 (and subsequent) annual reports on subsidized child care, data on the number of additional children who have been served as a result of federal Title XX funds being replaced with state funds.
The Department of Education is required to submit an annual report on subsidized child care to the Legislature which includes (a) statistical information concerning the characteristics of individuals served and the types and costs of subsidized child care programs it administers and (b) evaluative data describing the quality of these programs. A report is also required from the Department of Benefit Payments which is to contain comparable statistical data on child care provided directly through the welfare system.
In 197~77 the Legislature substituted state General Funds for fe,deral Title XX funds allocated to child care through a shifting of Social Service dollars. ComInonly referred to as the "buy-out", this funding substitution was intended to serve more children by enabling child care programs to operate under less restrictive adult/ child ratios than those specified by the Federal Interagency Day Care Requirements (FIDCR). However, ithas not yet been determined whether the new state ratios under the "buyout" have had any effect on numbers of children served. The department originally estimated that although' the "buy-out" was only partial, over 8,000 additional children could potentially be accommodated under the less restrictive state ratios. We believe the department should determine the extent to which these projections have been realized and include information on this topic in its 1977-78 and subsequent annual reports.
B. State Presc~ool Program
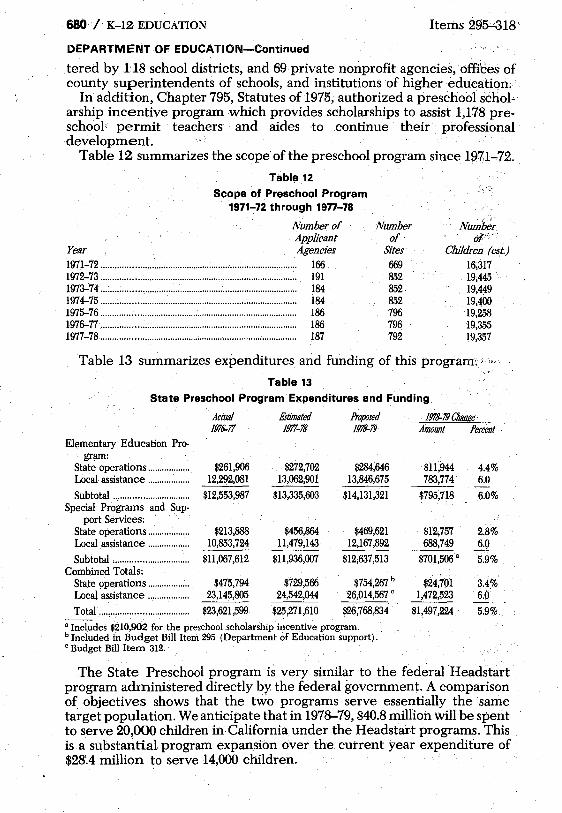
The purposes of the preschool program are to enhance the development ofthe child and involve parents in the educ,ational process as much as possible. More than 19,000 children are enrolled in programs-adminis-
680 / K-12 EDUCATION Items 29&-318
DEPARTMENT OF EDUCATION-Continued
. tered by 118 school districts, and 69 private nonprofit agencies,' offices of county superintendents of schools, and institutions of highereducatiQn.
In addition, Chapter 795, Statutes of 1975, authorized a preschool scholarship incentive program which provides scholarships to assist 1,178 prec
school: permit teachers and aides to continue their professional development.
Table 12 summarizes the scope of the preschool program since 19'71-72.
Table 12
Scope of Preschool Program 1971-72 through 1977-78
Number of Applicant
Year Agencies 1971-72 .................................................................................... 166 1972-73 .................................................................................... 191 197:J.,.:7<t .................................................................................... 184 1974-"l5 .................................................................................... 184 1975-76 .................................................................................... 186 197&-77 .................................................................................... 186 1977-78 ................................................. :.................................. 187
Number of
Sites 669 852 852 852 796 796 792
Numb~r 01":"
Childre;] (est) 16,317 19,445 19,449 19,-WO 19,258 19,355 19,357
Table 13 summarizes expenditures and funding of this program;·,
Table 13
State Preschool Program Expenditures and Funding
Actual Estimated Proposed 1!J1M9 Change . ]975-77 1977-78 1~79 Amount Percent
Elementary Education Pro-gram:
State operations .................. $261,906 $272,702 $284,646 $11,944 4.4% Local assistance .................. 12,292,081 13,062,90i 13,846,675 783,774 6.0 Subtotal ................................ $12,553,987 $13,335,603 $14,131,321 $795,718 6.0%
Special Programs and Sup-port Services:
State operations .................. $213,888 $456,864 $469,621 $12,757 2.8% Local assistance .................. 10,853,724 11,479,143 12,167,892 688,749 6.0
Subtotal ................................ $11,067,612 $11,936,007 $12,637,513 $701,506 a 5.9% Combined Totals:
State operations .................. $475,794 $729,566 $754,267 b $24,701 3.4% Local assistance .................. 23,145,805 24,542,044 26,014,567 c 1,472,523 6.0
Total ....................................... $23,621,599 $25,271,610 $26,768,834 $1,497,224 5.9% a Includes $210,902 for. the preschool scholarship incentive program. b Included in Budget Bill Item 295 (Department of Education support). C Budget Bill Item 312.
The State Preschool program is very similar to the federal Headstart program administered directly by the federal government. A comparison . of objectives shows that the two programs serve essentially the same target population. We anticipate that in 1978-79, $40.8 million will be spent to serve 20,000 children in California under the Headstart programs. This isa substantiaL program expansion over the current year expenditure of $28~4 million to serve 14,000 children.

Items 295-318 K-12 EDUCATION / 681
Auditor General Report
As directed by the 1977-78 Conference Committee Supplementary Report, the Auditor General, has submitted a report dated February 1, 1978 on funding, administration and controls of the State Preschool Program. Based on a preliminary review of the report, we believe there are signicant findings and recommendations concerning SDE management of the preschool program which should be reviewed by the fiscal subcommittees.
2. SPECIAL EDUCATION
The special education component includes (1) the Master Plan for Special Education, (2) educational improvement for the handicapped, (3) research and development, (4) special schools, (5) clearinghouse depository for han.dicapped students, and (6) other special education programs.
These activities provide serVices to students who are blind, deaf, orthopedically handicapped, multi-handicapped, educable and trainable mentally retarded, and educationally handicapped. Federal funds (Education of All Handicapped Children Act, PL 94-142) provide for (a) program improvement projects sponsored by local educational agencies, (b) deaf-blind services provided by private agencies,. (c) staff development programs, (d) demonstration child service centers, and (e) pilot projects for the identifi.cation of exceptional children.
Enrollment
In 1976-77, approximately 340,000 handicapped students received services in special education programs throughout the state. Table 14 indicates that· speech impairment and specific learning disabilities comprise 61.4 percent of the students served.
Table 14 Unduplicated Count of Pupils Served by Special Education
. (February 1. 1977)
Unduplicated Count Major Handicapping Disability Ages 3-5 Ages 6-21 Total Mentally Retarded .............................................. 1,596 38,223 39,819 Hard of Hearing .................................................. 256 2,733 2,989 Deaf ........................................................................ 356 2,897 3,253 Speech Impaired.................................................. 16,704 113,137 129,841 Visually Handicapped ........................................ 362 2,793 3,155 Emotionally Disturbed ...................................... 147 21,809 21,956 Orthopedically Impaired .................................. 1,500 Other Health Impaired ................................. :.... 933
26,531 28,031 30,665 31,598
Specific Learning Disabled .............................. 1,045 77,426 78,471
Total a ................... ;.................................................. 22,899 316,214 339,113
a Totals do not include approximately 1,700 children in state special schools. Source: DepartInent of Education.
Percent 11.7%
.9 1.0
38.3 .9
6;5 8.3 9.3
23,1 100.0%

682 I K-12 EDUCATION
DEPARTMENT OF EDUCATION-Continued Funding
Items 295-318
Table 15 displays state and federal funding for special education (e~eluding ESEA Title I, ESEA Title IV-C and Vocational Education Act funds which will be approximately $9.1 million in 1978--79).
Table 15'
Total State and Federal Support for Special Education
Actual Estimated Proposed Change Over 1977-78 1976-77 1977-78 1978-79 Amount Percent
Special Education Programs "'''''' $107,187,917 $129,693,309 $197,427,608 $67,734,299 52:2%
Apportionments "" 203,733,901 240,204,600 244,939,800 4,735,200 2.0
Total """"""'''''''' $310,921,818 $369,897,909' $442,367,408 $72,469,499 19.6%
Special Education Programs
Table 16 displays expenditures and funding for the special education components which are administered by the State Department of Educa-tion. This table indicates that in 1978--79 there will be a 52.2 percent increase ($67.7 million) in special education funding, primarily in the Master Plan and federal support activities. '
Table 16 State and Federal Expenditures and Funding for
Special Education
Actunl Estimated Proposed Change Over 1977-78 Component 1976-77 1977-78 1978-79 Amount Percent
1. Master Plan State Operations $300,587 $528,829 $536,026 $7,197 1.4% Local Assistance 51,843,250 58,663,850 102,165,264 43,501,414 74.2
2. Education Im-provement for Hanicapped State Operations 3,979,663 5,049,353 5,819,525 770,172 15.3 Local Assistance 18,614,298 26,228,583 47,627,666 21,399,083 81.6
3. Research and Development State Operations 341,579 374,470 400,000 25,530 6.8
4. Special Schools State Operations 18,583,415 21,343,342 22,441,647 a 1,098,305 5.2
5. Clearinghouse ' Depository State Operations 291,997 302,279 312,930 10,651 3.5
6. Other Special Education Pro-grams State Operations 1,093,128 1,426,203 1,465,946 39,743 2.8 Local Assistance 12,140,000 15,776,400 16,658,604 b 882,204 c 5.6
Totals .""""",,"",, ..... $107,187,917 $129,693,309 $197,427,608 $67,734,299 52.2%
State Operations: General Fund .... $17,292,295 $19,818,958 $21,700,808 $1,881,850 9.5% Federal funds ...... 4,597,331 5,735,651 6,546,9JJ 811,262 14.1 Reimbursemen~s 2,700,74.1 3,469,867 2,728,353 -741,514 -21.4 --
Subtotal .................... $24,590,:169 $29,024,476 $30,976,074 $1,951,598 6.7

-Items 295-318 Local Assistance:
General Fund ... . Federal funds ..... .
Subtotal ................... .
$63,983,250 18,614,298
$82,597,548
$73,367,250 27,301,583
$100,668,833
a Budget Item 302 plus ESEA Title I funds.
$117, 750,868 48,7{){},666
$166,451,534
K-12 EDUCATION / 683
$44,383,618 21,399,083
$65,782,701
60.5 43.9
65.3
b This item includes a General fund appropriation for Development Centers for the Handicapped (Item 308) and Sheltered Workshop programs (Item 307).
C This amount represents inflation adjustments: (1) The Development Center Program received a 6 percent inflation adjustment of $871,404 in
1978-79, for a total general fund funding level bf $15,394,804; -(2) The Sheltered Workshop Program received a 6 percent inflation adjustment of $10,800, for a
total General Fund funding level of $190,800. .
Apportionments
Table 17 displays General Fund apportionments to school districts for special education.
Table 17 General Fund Apportionments to Special Education
ActUal Estimated Proposed- Change Over 1977-78 Category 1976-77 1977-78 1978-79 Amount Percent
1. Sedgwick Act .. : ... ; .. : .... $6,176,01l $19,000,000 $12,000,000 $-7,000,000 36.8% 2. SpeCial Transporta-
tion: ........... · .................... 14,531,770 . 16,120,000 17,095,000 975,000 6.0 3. Physically Hand-
icapped ........ : ............... 94,686,554 108,286,700 113,183,800 4,897,100 4.5 4. Mentally Retarded .... 21,953,948 23,647,600 25,074,400 1,426,800 6.0 5. . Educationally Hand-
icapped ........................ 66,385,618 73,150,300 77,586,600 4,436,300 6.0
Total ..................................... $203,733,901 $240,204,600 $244,939,800 $4,735,200 2.0%
The table indicates .that General Fund app~rtionment funding will increase by 2 percent or $4.7 million in 1978-79. However, it should be noted that special education instructiqnal programs (physically handicapped, mentally retarded and educationally handicapped) will receive a 6 percent inflation adjustment in 1978-79. Sedgwick Act program funding for private schools will decline in 1978-79 because 1977-78 funding includes a one-time-only double payment for both prior year (1976-77) and current year (1977-78). Beginning in 1978-79, reimbursement payments will be made on a current year basis only. A. Ma'ster Plan for Special Education
Chapter 1532, Statutes of 1974, authorized the establishment of the MasterPlan for Special Education 0MPSE) program. This chapter provided for pilot testing of the MPSE in up to ten districts and counties (called Responsible Local Agencies) in fiscal years 1975-76, 1976-77, and 1977-78.
Chapter 1247, Statutes of 1977, (AB 1250) authorized the continuation of the existing 10 Responsible Loca,l Agencies (RLAs) and· for the statewide expansion of the MPSE. Master Plan funding, which was provided in Chapter 894, Statutes of 1977, (AB 65) will increase by '$43.5 million in 1978-79 to a total level of$102.2 million (table 16). This new funding will allow a 70 percent increase above the current total pupil enrollment of approxim.ately 50,000. Chapter 894 also provided for (a) a 6 percenUnflation adjustment to both Master Plan and Standard Special Education pro~ grams in 1978-19, (b) a MPSE funding level of $160 million in 1919-8Q and (c) an independent evaluation of special education programs. The evalua- .

684 / K-12 EDUCATION Items 295-318 DEPARTMENT OF EDUCATION-Continued
tion is funded at $1 million over a five-year period (1977-78 through 1981-82). B.Research and Development Possible General Fund Savings
We recommend that the Department of Education present justification to the fiscal subcommittees during the budgetary hearing on the need for a $400,000 General Fund appropriation for Special Education research when $500,{)()() in federal funds for the same purpose is also avaHableand remains unallocated
Chapter 1247, Statutes of 1977, (AB 1250) continued research efforts in special education and appropriated $400,000 from the General Fund to the Department of Education for that purpose. In addition to this General Fund appropriation, $500,000 per year in federal PL 94-142 funds are available for 1977-78 and 197~79.
These federal funds have not been allocated by the department. We question whether the General Fund appropriation is needed, given the availability of federal funds. Therefore, we recommend that the Department of Education report to the fiscal committees on the need for $900,000 in special education research in the budget year. It appears that the General Fund appropriation can be reduced by the amount of available federal funds while still continuing the existing level of research in special education provided for in Chapter 1247.
C. Special Schools
The State of California operates six special schools to provide services to handicapped minors-(deaf, blind, neurologically handicapped, and multihandicapped) who live in school districts that do not offer adequate special education services. '
Table 18 summarizes the enrollment of handicapped pupils and the cost per full 'time equivalent (FTE) in the special schools as presented in the Governor's Budget. .
Table 18 EnrOllment of Handicapped Children and Cost per FTE' in
Special Schools of California, 1976-77 to 1978-79
AetuaJ 1976-77 Estimated 1977-78 Estimated 1978-79
Enrollment -School for the Blind ................ 125 Diagnostic School for Ne\lro
logically Handicapped-North b ................................ 37
Diagnostic School for Neurologically Handicapped-Central b ............. :........... ..... 37
Cost Cost Cost Per FTE EnroUment Per fTE EnroUment Per fTE $15,900 125 '$18,198 125 $19,082
32,886 41 34,545 41 35,972
28,785 41 31,294 41 Diagnostic School for Neuro
logically Handicapped-South b .................................. 37 33,104 41 35,515 41 36,799
Schaolfor the Deaf-Berkeley e 360 11,511 429 10,623 ,483 11,&50 School for the Deaf-Riverside 560 10,155 560 11,156, 580 11,259 a Does not include federal projects. FTE:full time eqttivalent. b The three diagnostic schools (combined) provide educational assessments for approximately 500 pupils
during the school year. e Does not include pupils enrolled in the federal multihandicapped project..

Items 295-:318 K-12 EDUCATION / 685
Chapter 1247, amended existing law concerning the operation of the special schools. It generally broadened the scope <;>f activities of the special schools and made their operation consistent with federal PL. 94-142.
Chapter 1249, Statutes of 1977, (SB 871) authorizes the six special schools to provide an annual average transportation allowance of $389 per pupil beginning on January 1, 1978. This transportation allowance will provide state support to handicapped pupils in the residential program of the special schools to enable them to go home on weekends and holidays. The Governor's Budget includes a $260,000 General Fund appropriation to pay for these costs.
Professional and Support Service Augmentations
The Governor's Budget proposes (a) $60,000 for state workman's compensation insurance for special school personnel and (b) $237,131 for 16.5 professional and staff positions for the six special schools, for a· total of $297,131. Based on our review of these augmentation requests,. we find that they are needed in order to fund actual costs and to comply with federal PL 94-142 and Chapter 1247 requirements. .
3. BILINGUAL-BICULTURAL EDUCATION AND SUPPORT SERVICES
The Bilingual-Bicultural Education and Support Services component provides administrative and consultant services to implement -and improve (1) Bilingual Education programs; (2) American Indian Education programs, including the (a) American Indian Ct;lnters and (b) the Native American Indian Education Programs; (3) ESEA, Title IV -B, libraries and learning resources; (4) . ESEA, Title IV-C, education innovation and support programs; and (5) ESEA, Title IV-C, planning and federal coordinatiOIi.
A. Bilingual Education
Chapter 978, Statutes of 1976, requires that each limited or- non-English speaking pupil in kindergarten through grade 12 receive "instruction in a language understandable to the pupil which builds upon the pupil's primary language and teaches the pupil English". The act outlines a range of instructional program options (transitional bilingual instruction, partial bilingual instruction, full bilingual instruction, and bilingual-bicultural instruction) that generally emphasize basic skills instruction in both the pupil's primary language and English.
Changes Made in 1977
Chapter 894, Statutes of 1977, (AB 65) made several IIlajor changes to Chapter 918. The act: (a) consolidates the Bilingual Education Acts of 1972 and 1976; (b) requires that all schools withK-6 enrollments receiving other state and federal categorical funds which are allocated on the ba!;is of the educational needs Of limited or non-English speaking pupils conform to the programmatic provisions of Chapter 978; (c) requires a threeyear independent evaluation of bilingual education programs and makes a $;300,000 appropriation for that purpose; and (d) as we discuss on page 693, consolidates the EDY and bilingual program funding beginning in 1979--80.

{
686 / 'K-12 EDUCATION
DEPARTMENT OF EDUCATION-Continued
Enrollment and Funding
Items 295-318
, The Department of Education estimates that approximately 290,000 limited and Ilon-English speaking students attend California schools. In 1976-77 the special language needs of approximately 147,000 limited or
, non-English speaking pupils were served by a variety of state and federal programs. Of this amount, approximately 28,200 or 19 percent were served by state bilingual programs. The department advises that a Chapter 978 count of LES/NES pupils will be issued in April 1978.
The budgeted expenditures for the state bilingual program are reflected in Table 19.
Table 19 State Bilingual Program
Actual Estimated Proposed CiJlIl1%e over 1977-78 ' Component 1976-77 1977-77 1!J76-19 Amount Percent
State Operations: Elementary .................... $83,967 $99,788 $104,381 $4,593 4.6% Secondary ...................... 51,865 55,355 58,055 2,700 4.9 Special Programs .......... 199,100 383,107 362,694 -20,413 -5.3 Management and Spe-
cial Services .............. 54,681 60,507 62,406 1,899 3.4 Subtotal .............................. $389,613 $598,757 $587,536 $-11,221 -1.8%, Local Assistance:
Elementary .................... $6,837,438 $10,248,199 $10,863,090 $614,891 6.0% Secondary ...................... 1,302,370 1,380,609 1,463,446 82,837 6.0 Subtotai .......................... $8,139,808 $11,628,808 $12,326,536 $697,728 6.0%
Total ................ ; ................... $8,529,421 $12,227,565 $12,914,072 $686,507 5.6%
Bilingual Scholastic Achievement Test
In 1975-76, the Legislature appropriated $300,000 (Item 322.1) to provide for the development, standardization and implementation of a bilingual scholastic achievement test in the Spanish language. The deadline for the final report originally was June 30, 1976 and was subsequently extended to June 12, 1977. As of February 1978, this report has not been com~ pleted. '
Supply of Bilingual Teachers
We recoIIlnlend that the Department of Education and the Commission for Teacher Preparation and Licensing submit a report on the a) availability and b) demand for bilingual teachers in school districts in California' to the Joint Legislative Budget Committee by November 1, 1978.
Under Chapter 978, Statutes of 1976, all teachers providing instruction in a bilingual program must be bilingual-cross cultural. A bilingual-crosscultural teacher musthave the following qualifications: (1) hold a valid, regular California teaching credential and (2) hold either a bilingua,l~ crosscultural certificate of proficiency or other credential in bilingual education authorized by the Commission for Teacher Preparation and Licensing, ora bilingual-crosscultural specialist credential, (3) be fluent in the
Items 295-318 K-12 EDUCATION / 687
primary language and familiar with the cultural heritage of the limitedEnglish speaking pupils in the bilingual classes he or she conducts, and (4) have a professional working knowledge of the methodologies which must be employed to .educate those pupils effectively.
Chapter 978 further specifies a waiver process by which districts may employ teachers through September 1, 1979 who do not meet the above requirements. We. are concerned that many school districts may not be· able to comply with this section of Chapter 978 because of district reporte<:i shortages of bilingual teachers. Currently, there is little data on the extent of districts demands for bilingual teachers in relation to their potential supply.
As of January 1978; 162 school districts have requested that the State Board of Education grant 2071 waivers for bilingual teachers. This indicates that districts may have a problem complying with Chapter 978 re-quirements on teacher qualifications. '.
We recommend that this be. assessed by the Department of Education and the Commission on Teacher Preparation and Licensing.
B. Bilingual Teacher Corps
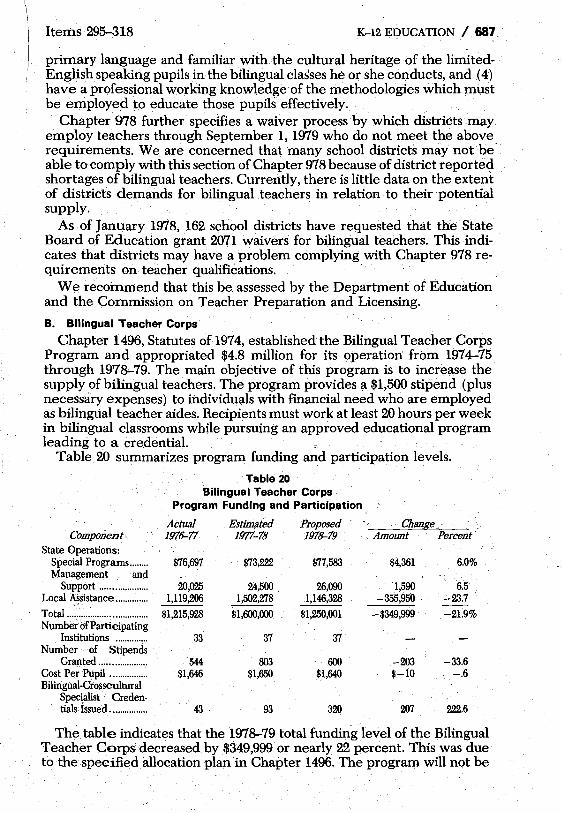
Chapter 1496, Statutes ofl974, established the Bilingual Teacher Corps Program and appropriated $4.8 million for its operation from 1974-75 through 1978-79. The main objective of this program is to increase the supply of bilingual teachers. The program provides a $1,500 stipend (plus necessary expenses) to individuals with financial need who are employed as bilingual teacher aides. Recipients must work at least 20 hours per week in bilingual classrooms while pursuing an approved educational program leading to a credential. ,
Table 20 summarizes program funding and participation levels .
Component, State Operations:
Special Programs ....... . Management and
Support ................... . Local ASsistance ............ ..
Total .... :: ........................... . Numbet of Participating
Institutions ............ .. Number of Stipends
Granted .................. .. Cost Per Pupil .............. .. BilingUal·Ci'osscu\tural
SpecialiSt Creden· tials issued .............. ..
. Table 20 Bilingual Teacher Corps
Program Funding and Participation ..
Actual Estimated Proposed Change 197~77 1977-78 1978-79 . AmoUnt Percent
$76,697 $73,222 $77,583 $4,361 6.0%
20,025 24,500 26,090 1,590 6.5 1,119,206 1,502,278 1,146,328 -355,950 . -23.7
$1,215,928 $1,600,000 $1,250,001 -$349,999 -21.9%
33 37 37
544 803 600 .-203 -33.6 $1,646 $1,650 $1,640 $-10 -.6
43· 93 320 207 222.6
The table indicates that the 1978-79 total funding level of the Bilingual Teacher Corps decreased by $349,999 or nearly 22 percent. This was due to the speCified allocation plan in Chapter 1496. The program will not be

688 / K-'12 EDUCATION Items 295-318
DEPARTMENT OF EDUCATION-Continued
fundediill979-80 tmiess legislative authority is provided for such funding. The studyon the availability ofbiJingual teachers, recommended above,
would aid the Legislature in assessing the need for extension of the Bilingual Teacher Corps program in 1979-80.
C. Indian Education Centers
Chapter 1425, Statutes of 1974, authorized the establishment of up to 10 Indian Education Centers to provide comprehensive programs to K-12
,pupils as well as adults. Services include tutorial programs in readihg and mathematics, academic counseling, and cultural activities directed toward reducing the dropout rate of American Indian students and incr~asing their academic achievement and self-image. These centers are di,rectly administered by Boards of Directors rather than school districts. :
Table 21 summarizes state operations and local assistance expenditures for. this program.
Table 21 Expenditures for Indian Education Centers
Components State Operations:
Special Programs ........................... . Management and Support .......... ..
Local Assistance ................................. .
Total ...................................................... ..
Actual Estimated Proposed 1976-77 1977-78 1978-79
$44,233 17,577
600,000
$661,810
$63,138 23,921
636,000
$723,059
$66,871 25,435
674,160
$766,466
D. Native American Indian Education Program
Change Amount Percent
$3,733 5.9% 1,514 6.3
38,160 6.0
$43,407 6.0%
Chapter 903, Statutes of 1977, (AB 1544) continued the school district administered Indian Early Childhood Education programs under the new title of the Native American Indian Education Program projects. These projects supplement educational services, with a basic skills emphasis, to Indian pupils in grades kindergarten through four. The principal differences between the Native American Indian Education Programs and the Indian Education Centers is in (a) the scope of activities, (b) the age group served, aild (c) the administration of the program.
Table 22 summarizes state operations and local assistance expenditures for the program.
Table 22 Native American Indian Education Program
Actual Estimated 1976-77 1977-78
State Operations .............................................................. I $25,000 Local Assistanc.e .............................................................. $249,999 270,000
Totals .............. ................................................................ $249,999 $295,000
Proposed 1978-79
$25,000 270,000
$295,000
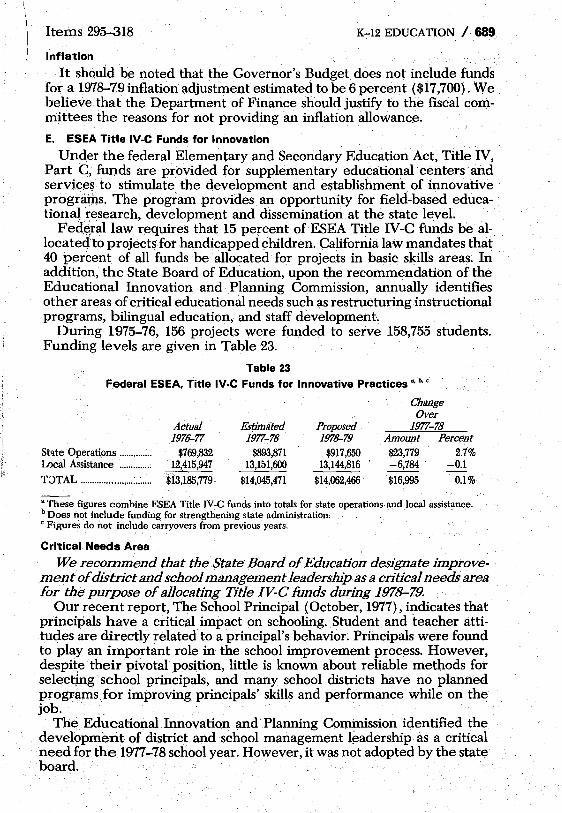
Items 295-318 K-:-12 EDUCATION /.689.
Inflation
It shouid be noted that the Governor's Budget does not include funds for a 1978:-79 inflationadjustment estimated to be 6 percent ($17,700). We believe that the Department of Finance should justify to the fiscal committees the reasons for not providing an inflation allowance.
E. ESEA Title IV-C Funds for Innovation
Under the federal Elementary and Secondary Education Act, Title IV, Part C, funds are provided for supplementary educational centers' and service~ to stimulate the development and establishment of innovative programs. The program provides. an opportunity for field~based educational research, development and dissemination at the state level.
Fed.erallaw requires that 15 percent of ESEA Title IV-C funds be allocated'to projects for handicapped children. California law mandates that 40 percent of all funds be allocated for projects in basic skills areas. In addition, the State Board of Education, upon the recommendation of the Educational Innovation and Planning Commission, annually identifies other areas of critical educational needs such as restructuring instructional programs, bilingual education, and staff development.
During 1975-76, 156 projects were funded to serve 158,755 students. Funding levels are given in Table 23.
Table 23
Federal ESEA. Title IV-C Funds for Innovative Practices" b. c
Change Over
1977-78 Actual 1976-77
Estimated 1977-78
$893,871 13,101,600
Proposed 197~79 Amount Percent
St.'lte Operations ............. . Local Assistance ............ ..
T:)TAL ...................... : ...... .
$769,832 12,415,947
$13,185,779 . $14,045,471
$917,650 13,144,816
$14,062,466
$23,779 2.7% -6,784 -0.1
$16,995 0.1%
a These figures combine ESEA Title IV -C funds into totals for state operations and local assistance. b Does not include funding for strengthening state administration. . C Figures do not include carryovers from previous years.
Critical Needs Area
We recommend that the State Board of Education designate improvement of district and school management leadership as a critical needs area for the purpose of allocating Title IV-C funds during 1978-79.
Our recent report, The School Principal (October, 1977), indicates that principals have a critical impact on schooling. Student and teacher attitudes are directly related to a principal's behavior. Principals were found to play an important role in the school improvement process. However, despite their pivotal position, little is known about reliable methods for selectjng school principals, and many school districts have no planned programs for improving principals' skills and performance while on the job.
ThE( Educational. Innovation and' Planning Commission identified the development of district and school management leadership as a critical need for the 1977-78 school year. However, it was not adopted by the state board. .

690 / K-12 . EDUCATION Items 295-:-318
DEPARTMENT OF EDUCATION-Continued
We believe that because of the important role played by principals in operating schools and implementing school improvement programs, several projects to develop programs designed to improve the selection. and training of school management personnel should be funded. Accordingly, we recommend that the Legislature direct the State Board to designate this as a critical needs area.
4. COMPENSATORY EDUCATION
,For it condolidated review, we discuss most of the department's el~mentary and secondary general activities, consolidated categoricals and .compensatory education programs here under the one topic of compensatory education. We include in this discussion the following components: (1) ESEA, Title I, economically deprived pupils; (2) ESEA, Title I, migrant pupils; (3) Educationally Disadvantaged Youth (EDY) program; and (4) special state compensatory education projects, including (a) the Demonstration Programs in Reading and Mathematics, (b) New Careers Programs, and (c) Professional Development and Program Improvement Centers. State administration of these programs is divided between the elementary and secondary age span elements.
Table 24 summarizes expenditures and funding sources for compensatory education.
Table 24
Compensatory Education Expenditures and Funding Sources
Actual Estimated Proposed Change Components 1976-77 1977-78 1978-79 Amount Percent
State Operations: ESEA, Title I .............. $2,342,052 $2,623,574 $2,730,588 $107,014 4.1% ESEA, Title I (Mi-
grant) ........................ 924,684 988,384 1,028,320 39,936 4.0 Educationally
Disadvantaged youth ......................... 870,296 997,532 1,037,879 40,347 4.0
State Compensatory Education Pro-grams ........................ 427,174 486,378 495,519 9,141 1.9
Subtotal ........................ $4,564,206 $5,095,868 $5,292,306 $196,438 3.9% Local Assistance:
ESEA, Title I .............. $140,934,258 $164,981,041 $165,959,677 $978,636 0.6.% ESEA, Title I (Mi·
grant) ........................ 25,663,259~ 33,042,167" 33,002,961" -39,206 ,-0.1 Educationally
Disadvantaged Youth .... ; ..... ; ............. 105,110,758 118,654,936· 125,508,000 6,853,064 5.8
State Compensatory Education Pro-grams ........................ 3,688,631 3,917,000 4,152,020 235,020 6.0
Subtotal ... : .................... $275,396,906 $320,595,144 $328,622,658 $8,027,514 2.5'% Total ........................ ; ......... $279,961,112 $325,691,012 $333,914,964 $8,223,952 2.5% General Funds ................ $110,096,859 $124,055,846 $131,193,418 $7,137,572 5.8% Federal Funds ................ 169,864,253 201,635,166 202, 721,546 1,086,380 0.5
a These figures do not include $457,000 for Migrant Child Care services that was transferred to child care.

Iteins295-318 K-12 EDUCATION / 691
These funds are generally used to provide supplemental instruction and support services to educationally disadvantaged pupils. The principal instructional services are reading, language arts, and mathematics. Parent involvement; staff development, and health services are the principal support services. The majority of program expenditures are for instructional aides and materials.
A. ESEA, Title I
The federal Elementary and Secondary Education Act (ESEA, Title I) proviq.es special supplemental instructional services to disadvantaged students who (1) atteJ?d school in low income areas, (2) are handicapped and receive special educational services from the State Special Schools or Department of Health, or (3) are neglected and/or delinquent and receiv~' educational services from the California Youth Authority or Department of Corrections. As shown in the introductory table, local assistance funding for ESEA, Title I will be $165.9 million in 1978-79, a 0.6 percent increase Over 1977~78.
The Department of Education estimates that approximately 515,400 pupils (12 percent of total enrollment) were served by 1,973 schools in 887 school districts with ESEA, ,Title I funds in the 197&-77 school year. ,
New State Law Conflicts with ESEA, Title I
We recommend that the Legislature support the State Department of Education in its efforts to seek amendments to federal ESEA, Title I requirements to provide compatibility with current state law.
Under Chapter 894 (AB 65), a ,new formula was developed for the allocation of federal and state funds to school districts in 1979-80, referred to as the Economic Impact Aid (EIA) formula (see page 693). When this fQrmula becomes effective, California's entitlement process will be in conflict with current federal law. This conflict occurs because the EIA formula requires that the existing level of federal funds in school districts be considered prior to the allocation of new state "Categorical funds, whereas ESEA, Title I specifically prohibits such consideration.
AB 65 states' that: "The Superintendent of Public Instruction shall calculate available resources for each district by summing funding entitlements allowed each district from the following sources: (a) Base impact aid, Le., a district's existing level of funds, (b) Part A of Title I of the Elementary and Secondary Education Act,
and. (c) Section 540301, (which details the procedure for allocating supple
mental funds to districts which have an Economic Impact Aid factor of greater than 1.25.)"
Whereas, ESEA, Title I states that: "No payments shall be made under this title for any fiscal year to a state which has taken into consideration payments under this Title in determining the eligibility of any local educational agency in that state for state aid; or thatamount of aid, with respect to the free public education of children during that year or the preceding fiscal year."

692 /'K-12 EDUCATION. Items 295-318
DEPARTMENT OF EDUCATION-Continued
We believe that California's new Economic Impact Aid formula is an appropriate allocation system for state and federal categorical funds for economically disadvantaged pupils. Thus, we believe that ESEA, Title I law should be modified to permit California to allocate federal funds to economically disadvantaged youth under the EIA formula. Congress will be amending Title I during 1978. The Departmentof Education has been working toward this modification. A legislative directive would aid the SDE in securing needed changes.
B. Migrant Education-ESEA. Title I
The. purpose of this program is to provide appropriate supplemental instructional and health and welfare services for migrant pupils. Under the "California Master Plan for Migrant Education" of 1974, the state is the . prime contractor to' the federal government for the migrant education program operated with ESE~, Title I funds. The state has seven regional offices which are responsible for program administration.
ESEA, Title Ilocal assistance expenditures for migrant education will total $33 million in 1978-79. Enrollment and per pupil costs for the period 1976-77 through 1978-79 are shown in Table 25. Approximately 269 school districts will offer programs in 1978-79 at an estimated per pupil cost of $624. .
Table 25 ESEA. Title I Enrollment and Participant Cost for Migrant Education
Estimated Number of Pupils a ................. .
Estimated Cost Per Pupil ......................... . Estimated Number of Districts ............... . Estimated Number of Schools ................. .
1976-77 41,934
$597 230
1,060
1977-78 46,127
$583 258
1,088
1978-79 52,740
$624 269
1,102
Changeover 1977-78
Amount Percent 6,613 14.3%
$41 7.0 11 4.3 14 1.3
a The number of pupils expressed are those receiving total migrant education services. It is estimated that some 100,000 children receive partial service such as MSRTS (Migrant Student Record Transfer System), from. the California State Migrant Education Program.
Unexplained Yariation in Service Costs
We recommend that the Department of Education (a) analyze the causes of the variation in migrant education service costs to determine whether such variations are justified and (b) make recommendations for a more equit'able distribution of migrant education funds if appropriate to the Joint Legislative Budget Committee by October 1, 1978. -
Table 26' on page 693 presents a summary cjf the dollars spent· per average enrollment as shown in the department's 1975-76 Migrant EducationEvaluation report.
These data show that the state program permits .considerable variation among regions in per pupil eXpenditures in instructional support, staff training, health care and ~ommunity liaison. It seems unlikely that these differences in cost could be attributed solely to either bookkeeping procedures or regional differences in the cost of providing comparable services.

Items' 295-318 K-12 EDUCATION./ 693;:
Table 26
Cost of Services Per Full Time Equivalent. 191s-:,76 . . (six regions)
Region InstrucHon High...................................................... $354 Median.................................................. 199 Low ...................................................... · 129
Support $151
59 31
Staff Hea)th Training . Care
$60 $57 4 20 2 2
Community Liaison
$3~ 6
0.57'
These expenditure differences may mean that some regions are openlting inadequately funded programs while other regions are. operating. exces~ivelyexpensive programs. If this is true, the department should take corrective action. . .
We.,.therefore, recommend that the Dep~rtment of Education condhct a special study to- analyze the causes of these variations in migrant education. service costs and make recommendations .as appropriate.
:.",", '. "
C. State Educationally Disadvantaged Youth (EDY)/Economic Impact Aid (EIA)
Chapter 1406, Statutes of 1972, created the EDY program to provide for state funding to local school districts based on their concentrations of pupils from.low income families, pupils experiencing language programs and pupil transciency. Program services are similar to those provided by ESEA, Title Iprograms. Nearly all school districts that have EDY program funding (97 percent) also have ESEA, Title I program funding.
As mentioned, Chapter 894, Statutes of 1977 (AB65) (a) revises and consolidates the funding of EDYand Bilingual Education prOgrams'beginning in the 1979-80 fiscal year into the Economic Impact Aid (EIA) program, (b) iricreases the number of districts served, (c) provides more flexi.qility for districts to allocate funds (districts will no longer have to allocatf~ fundspn the critical mass policy (see page 694)' which required that per pupil expenditure must be within a range of $3501:0$550), (d). provides an inflation adjustment of $6.8 million in 1978-79 and an augmentation of $53.2 million in 1979-80; and (e) provides for notifying districts of their projected entitlements during the prior fiscal year tbimprove district planning efforts. . .
In its last year (1978-79), the EDY local assistance funding will be $125./? million, an increase of $6.8 million or 5.8perc£mt over 1977-78. The De.paftment of Education reports that 457 school districts used EDY funds to proir'ide supplemental education services to approximately 432,000 pupils in 1'97&-77.
New Racial and Ethnic Survey
A1.3 65' makes a General Fund appropriation of $75,000 for th.epurpose ofc()uducting;a racial and ethnic survey.in the 1.977-7.8 fiscal year. This survey will be used to update the EDY formula in 197a.:.79. The department advises that the study should be completed by April, 197~.
C~hidlil Mass Policy Questioned
In 1976-:77, the Legislature appropriated $100,000 to conduct a study of whether the state's previous policy for allocating compensatory education fundsisenipirically justified. Resource ManagementCorporatioIi: (RMC) .

694 / K-12 EDUCATION Items 29&-318
DEPARTMENT OF EDUCATION-Continued
completed a study of this issue in November 1977, and concluded: "The research described found no consistent, positive relationship
between the level or composition of educational resources and student achievement scores in reading and mathematics. The implications that can be drawn from this finding must necessarily be tempered by the data limitations. The strength and consistency of the null finding, however • should have a bearing on tIre irriportant policy question of whether the critical mass policy should be contiilUed. The answer to this policy question depends upon the probability of the existence of acritical mass in compensatory education and upon the various payoffs and costs involved in accepting or rejecting the critical mass policy. 'The analysis undertaken in this project and in other research reviewed leads to the conclusion that the probability of the existence of a critical mass is very low. Basically, no research has been able to identify a critical mass. Even. the possibility that there are positive returns, in terms of achievement scores, to any level of investment in compensatory educa-tion is doubtful. . .
The cost of continuing the critical mass policy is the exclusion of some students from compensatory program~. The cost of rejecting a critical mass policy, when indeed there is a critical mass, is. the loss in achievement gain due to spreading the compensatory funds over a larger pqpulation. This and other research has shown, however, that these losses, as measured by school average achievement scores, are likely to be negligible. If compensatory education is not productive in increasing test scores, it does not matter whether it is received or how much is·received. The status of a school's achievement test. scores seems to, be invariant to whether or not. the critical mass policy is contin~ed.
There are other indieators of program success than achievement scores. Student self-image, cultural awareness, health, and attitude toward learning are other goals of the compensatory program. The policymaker might want to determine whether the concentration of funds will lead to larger gains in these measures. Neither this study nor any study reviewed can shed much light on the relationship between any of these measures and the concentration of funding." . As mentioned, ARBs eliminated the statewide -critical mass require
ment and transferred responsibility for determining the appropriiite range of compensatory resources devoted to each pupil from the state to local school districts. This legislative change is consistent with the results obtained in the. RMC study, The State Board of Education will develop rules and regulations that allow for district flexibility in setting a compen-satory education expenditure level by the 1979~O school year. ,;
D. Special State Compensatory Education
Expenditures for special state compensatory education programs, wh~ch are in addition to EDY, are shown in Table 27 on page 695. .
.1. Demonstration Programs in Reading and Math
Chapter 1596, Statutes of 1969, authorized the establishment of demonstration programs to provide cost-effective intensive instruction in read-

Items 295,318 K-12 EDUCATION /695
Table 27 State Compensatory Education Program Funding
Actual Estimated Proposed Change Element 1976-77 1977-78 1978-79 Amount Percent
L Demonstration Pro-grams in Reading and
. Math ..... , .......... ; ............... .. 2. New Careers ................. . 3. Professional Develop
ment and Program Im-provement Centers ..... .
Totiil .................................. .
$3,096,451 a
370,354 a
649,000
$4,115,805
" Includes state operations funds,
$3,314,376 a
402,002",
689,000
$4,405,378
$3,512,689 " 404,510"
730,340 $4,647,539 .
$198,313 2,508
41,340
$242,161
6% .6
6
5.5%
ing'~nd math for low-achieving students ingrades 7, 8 or 9. This act was amended by Chapter 507, Statutes of 1977 (AB 1594) to continue the prognims until September 1, 1981. Becaus~ demonstration programs with the lowest level of cost-effectiveness are terminated each year, the continuing projects generally represent exemplary reading and math instruc-tional practices. . . According to the 1975-76 Evaluation Report, 5,976 students participated in continuing demonstration projects and 3,815 students participated in P3:rtial replication projects, for a total of 9,791 students. Thirty-one projects wer'e implemented in 20 school districts throughout California with ap~ proximately $3 million. The average per pupil cost of these projects is approximately $311.
Disl$emination of Information
We recommend that the State Department of Education disseminate inforinah'on on demonstration projects to districts withjzmior high schools that are implementing new School Improvement and Economic Impact Aid programs.
We further recommend that the department include information in the 1977-78 evaluation of the demonstration prograIils on (1) the extent to which school districts have actually adopted an instructional program similar to the demonstration program projects, . (2) obstacles confronting school districts in implementing demonstration programs in reading and/ ormf!,th, and (3) recommendations for dealing with the identified obstacles.
During the three fiscal years (1975-76 to 1977-78) the demonstration project school districts have been disserp.inating information to other
. school districts about their successful practices, but these efforts have been limited in scope. We believe that wider dissemination.of informati()n on the most successful demonstration projects in reading and math is necessary, especia.lly to schools that are initiating program improvement or compensatory. education pr()gr~s at the junior highschooll'evel. This could occur if the seconqary Field Services Unit expanded it~efforts to encourage districts to use new School Improvement and Economic Impact Aid funds to establish reading and math programs similar to those

'··696 / K-I2 EDUCATION Items 29,5;.;.318
, DEPARTMENT OF EDUCATION-Continued
operated by the most successful demonstration projects. , Thedepaitment can improve its·effort to identify obstacles to replica
tion oPsuccessful cost-effective demonstration programs. Without an understanding of the factors that make the replication of derrionstration programs in reading and / or math difficult (such as lack of materials, funds,
, etc.), efforts' to increase program adoption may be severely curtailed. Consequently, it is iinportant for the department to identify obstacles that school districts or schools frequently confront in implementing the demonstration programs and make recommendations to overcome those. ob-stacles. '
2. New Careers Program
. Chapter 1453, Statutes of 1969, established the New Careers in Education Program to (1) recruit and train persons who have completed at least
. 60 units of college work in a community college or a four-year institution of higher education for teaching in low-income elementary schools, and (2) provide a means by which capable persons oflow-income background may enter the teaching profession. The program incorporates academic study with on-the-job training in districts that do not have an adequate supply of teachers specially trained to deal with the educational needs of liinited- or non-English-speaking pupils or low-income pupils. Participatingfull-tirne college students receive a Fellowship Expense Grant of $75 per week plus a $15 per week Fellowship Expense Grant Supplement for each legal dependent. Average participant cost is $6,770 in 1977-78:
Inflation
The Governor's Budget does not include funds for 1978-79 inflation adjustment estimated to be 6 percent ($24,120). We believe the Department of Finance should justify to the fiscal committees the teasons for not providing an inflation allowance for this program.
3. Professional Deve'lopment and Program Improvement Ce~ters ' .. , We feco;mnend. that legislation be enacted to pe~mit theProfessional
De'velopment and Program Improvement Centers to be expanded to secondary schools. . .' . . ,',
The Professional Development and Program Improvement Centers (PDPICs) were established by Chapter 141, Statutes of 1968, "to offer comprehensive in-service training programs to strengthen the instructional techniques of classroom teachers in kindergarten and grades 1 through 6, inclusive". Centers are housed at elementary schools having Early Childhood Education (now School Improvement Programs), ESEA Title I, Mmer~Unruh,or Educationally Disadvantaged Youth Programs.
Under this prograJIl, $689,000 is being allocated to 13 local projects serving 103 elementary school districts in the 1977.,...78 schooty~ar.LQcal assistance funding forJ978--79 is budgeted at $730,340. This focus.on;elementary schools is restrictive. The number of secondary ESEA Title I, EDY, and School Improvement programs will be expanding and in ne,ed of similar training programs. Therefore, we recommend that the current program restrictions be removed.

Items 295-318 K-12 EDUCATION /697
B. ELEMENTARY EDUCATION
As displayed in Table 28, Elementary Education includes elementary school improvement, consolidated categorical programs, general activities and compensatory education. For a consolidated review, thelatter three components, with the exception of Miller-Unruh R~ading, were discussed in the Special Programs and Support Services element under the one heading of Compensatory Education (page 690). The Miller-Unruh Read-ing component is discussed in this section (page 7(0). '
Table, 28 Elementary Education Program Expenditures and Funding
Actual Eftimated Proposed CiJaoge Over 1977-78 Component 1976-iI 1977-78 1978-79 Amount Percent
1. Elementary School 1m· . provementProgram .... $98,516,453 $116,646,571 $129,476,919 $12,830,348 11.0%
2. Consolidated Categori-cals ............................ ; ..... 258,136,595 294,401,348 303,233,846 8,832,498 3.0
3; General Activities ........ 1,426,391 1,493,555 1,555,506 61,951 4.1 4. Compensatory Educa-
tion .................................. 30,114,277 40,048,194 40,718,462 670,268 1.7
Total ................................ $388,193,716 $452,589,668 $474,984,733 $22,395,065 4.9% State Operations:
General Fund ................ $2,807,504 $3,170,936 $3,746,487 $575,551 18.2% Federal funds ................ 3,261,499 3,515,399 3,641,944 12(M45 ,3.6 Reimbursements ............ 1,166 126,545 . 3.6
Local Assistance: General Fund ................ ~796,932 258,692,069 .279,362,608 20,670,539 8.0 ' Federal funds ................ 158,326,615 187,211,264 188,233,694 1,022,430 .5
1, K-6 SCHOOL IMPROVEMENT PROGRAM (SIP)
,. ,The School Improvement Program (SIP); authorized by Chapter 894, Statutes of 1977, revised and expanded the Early Childhood Education
, (ECE) program authorized by Chapter 1147, Statutes of 1972. '. The School Improvement Program is aimed at restructuring~ducation
in grades K-6 and 7-12 whereas the Early Childhood Education program served only grades K-3. SIP for grades 7-12 is discussed later with SeGondary Education (page 702).
Table 29 summarizes funding for ECE and K-6 SIP.
Table 29 K-6School Improvement Program Participati"n and Funding,
Actual Estimated Proposed 1978-79 Change Item 1976-77 1977-78 1978-79 Amount, Percent
Expenditures: State Operations .......... $1,095,131 $1,321,571 $1,832,919 $511,348 38.7% LoCal Assistance ............ 97,421,322 115,325,000 a 127,644,000 $12,319,000 19·7
Number of districts .......... 829 831 831 Number of schools ............ 2,457 2,798 2,990 192 " 6.9 Pupils served .................... 657,005 755,000 807,405 52,405 6.9 Percent of:
K-J Emrollmeiit ............ 55% 60% N/A K-6 enrollment ............ 31% 35% 39% 4 11.4
, -a Consists of $103,297,000 authorized by the 1m-78 Budget Act and $12,028,000 authorized by Chapter
894, Statutes of 1m. b Authorized by Chapter 894, Statutes of 1m.
698 / K~12 EDUCA TlON Items 295-318
DEPARTMENT OF EDUCATION-Continued
The primary reason for the 38.7 percent increase in state operations is to fund six additional bIlingual education consultants plus two clerical positions and related consultant services and operating expenses to meet the additional bilingual administrative workload connected with Chapter 978, Statutes of 1976 and Chapter 894; Statutes of 1977 (AB 65).
Inflation Allowance
. We recommend that the Departmel1t of Finance justify the rationale for not providing $6.9 million in inflation funds for the K-6 School Improve-ment Program (SIP). '
The Governor's Budget indicates that the $12.3 million funding increase in 1978-79 "is for the expansion of the program into new schools". However, the Budget does not provide an inflation allowance for the K,6 SIP local ~sistance program in 1978-79.' A 6 percent inflation factor would be $6,919,500. The Governor's Budget lacks a rationale for not providing an inflation adjustment. Action on this program is inconsistent with the rest of the budget which generally provides a 6 percent inflation allowance on the 1977-78 base for categorically funded programs. We believe the Department of Finance should justify to the fiscal subcommittees the reasons for not providing an inflation allowance for the K-6 SIP program in 1978-79.
It should be noted that if an inflation factor is applied, it should also be provided to the per pupil allowances specified by AB 65. This legislation initiates an allowance for planning grants to schools with approved planning applications of $30 per ADA. AB 65 continues the basic program allowance of $148 per K-3 pupil; a supplementary allowance of $74 pet K-3 pupil with a demonstrated educational need is continued for 1977-78 and 1978-79 and is then eliminated. AB 65 initiates a program allowance of $90 per pupil in grades 4 through 6.
K-& School Improvement Program Modifications of ECE
Several aspects ofK-651P reprE;lsent modifications ofECE including (a) procedures for award of expansion funds, (b) explicit statutory requirements aimed at ensuring recognition of diversity in program implementation, and (c) comprehensive specifications for local program evaluation.
Expansion funds under K-651P are to be awarded principally on the basis of (a) reviews of program quality based on a procedure which is a revision of the ECE Monitor and Review (MAR) process and (b) student cognitive and affective growth. Objective procedures for measuremerit in these areas need to be established and a method determined for weighting them in awarding expansion funds.
Up tolO percent of new SIP funds are designated by AB 65 for apI'>ropriation on some other basis as determined by the State Board of Edllcation. These funds might possibly be reserved, for example, as incentive grants to enable schools or teachers to experiment in particular areas or as allowances to schools to implement improvement programs which. do not follow the complete SIP guidelines. . .

Items 295-318 K-12 EDUCATION / 699
AB 65 specifically mandates recognition by the department of" diversity in school improvement objectives and implementation strategies". The program review process which is to replace the current MAR must provide for such diversity and "in no case shall . . . be used to impose or prohibit a particular instructional program". Such flexibility should for example, enable schools to (a) vary their emphases on different program objectives, (b) adopt a range of staffing patterns under the program (such as teacher aides, teacher specialists and reduced class size) or (c) "respond adequately to the different ways individual pupils learn" using a variety of instructional methods (such as alternative approaches to individualization) .
Under the program, local evaluations are directed toward a comprehensive assessment and an ongoing modification of the school environment. They are to include attention to such general areas as satisfaction among teachers, pupils, parents, and administrators with school services and decisionmaking processes as well as to such more specific areas as student achievement.
Each of these areas is a significant component of SIP which will require careful implementation to ensure conformance with new statutory provisions.
Ongoing and Future Evaluations
Alongitudinal evaluation of the effects of ECE on fourth and fifth grade academic performance of students, and classroom and school processes is being conducted during the current· school year by UCLA. The study is to include a comparison with Miller-Unruh schools. It is to be submitted to the Legislature by November 30, 1978.
AB65 requires an independent evaluation of SIP programs between 1977-78 and 1981-:82. In addition, the department is required to submit an annual evaluation report on the program to the Legislature. Elsewhere in this analysis, we have recommended that the department fulfill its annual evaluation requirement through use of the independent evaluation rather than by conducting an internal study of SIP. .
2. MILLER-UNRUH READING PROGRAM
The Miller-Unruh reading program was established in 1965 in an effort to upgrad~ the reading achievement of California's primary grade children .. The program provides . state funds principally to enable school districtsto e:mploy reading specialists in grades K-3.
Chapter 976, Statutes of 1976, authorized school distriqts the option of assigning Miller-Unruh reading teachers to grades 4-6 in lieu of grades K-3 in schools receiving both Miller-Unruh and ECE funds.
Table 30 on page 700 shows Miller-Unruh program participation and funding since 1975-76; .
The proposed program funding for 1978-79 is the same as the current year"with the addition of a 6 percent inflation factor of $880,838.
Allocation Plan Needed
We recommend that the Department of Education submit to the fiscal

700 / K-12 EDUCATION
DEPARTMENT OF EDUCATION-Continued
Table 30
Items 295-318
Miller-Unruh Reading Program Participation and Funding Since 197>76
Actual Actual Estimated Proposed Activity 1975-76 1976-77 1977-78 1978-79
Appropriation (General Fund) $13,849,625 $13,849,625 $14,680,625 $15,561,463 a
Number of districts .................... 238 203 188 188 Number of teachers .................. 1,442 1,234 1,150 1,150 Estimated statewide average
elementary teachers sal-ary b ........................................ $13,817 $14,927 $15,520 $16,4510
Percent of average teacher's salary funded by program 70% 75%d 75%d 75%d
Estimated number of children served .... , ............................... 154,000 135,660
• Budget Bill Item .306. bBased on statewide average of prior year. o Assumes 6 percent statewide average elementary salary increase. d State subsidy is not to exceed 75 percent of statewide average teacher's salary. e Not available.' ,
subcommittees by April 10, 1978 a plan for allocating the unused portion of Miller-Unruh appropriations in excess of the 75 percent limitation.
In 1976-77 the Legislature placed a cap on the state subsidy for a MillerUnruh teacher specifying that it is to be no greater than 75 percent of the statewide average elementary teachers' salary. The reason was to permit excess Miller-Unruh funds to be allocated to fund additional Miller-Unruh teachers_ The 1978-79 Governor's Budget proposes continuation of the 75 percent limitation.
The Department of Education advises that $200,000-$250,QQOQfthe 1976-77 Miller-Unruh appropriation was not allocated to Miller~Unruh teachers although the amount was in excess of the 75 percent limitation. We estim.ate that $1.3 million of the 1977-78 Miller-Unruh appropriation and $1.4 millioJ;l of the proposed 1978-79 Miller-Unruh appropriation may not be allocated because of the 75 percent limitation unless .the D,~;partment of Education develops a plan to distribute unused funds to .Jlew Miller-Unruh teachers. A report on this matter is needed during the budget hearings. If the excess $i.4 million is not to be allocated for. additional Miller-Unruh teachers, the appropriation could be reduced by that amount.
Teacher Eligibility ., .. ' ,,'.,
We recommend that the Education Code be amended to enable teachers credentialled as reading specialists under the Ryan Act to qualify as Miller-UnruiJ teachers. "1'''
Education Code Sections 54120-54125 enacted in 1965, specify ,c;r:j~eria under which teachers may qualify as Miller-Unruh reading specialists. The Code requirements' are quite restrictive, limiting eligibility tp experienced teachers (a) nominated by the district who have passed an examination administered by the Commission for Teacher Preparation and Licensing or (b) recommended by a district specialist teacher selection comznittee and meeting certain designated requirements.

IteIlls 295-318 K-12 EDUCATION /701
However since 1965, new credentialling requirements for reading specialists have been established under the Ryan Act; many specialists have been credentialled under t,hese new provisions and do not hold the specificMiller-Unruh certificate. Some school districts have applied to use Miller-Unruh funds to support such teachers. The Department of Education indicated that it is attempting through administrative waivers to provide Miller-Unruh support for teachers having the specialist credential in reading issued under the Ryan Act if they also have the necessary teaching experience. However, in order to clarify this issue, we believe the Education Code should be amended to provide statutory recognition of the Ryan credential as adequate qualification in lieu of the special Miller~Unruh examination.
C. SECONDARY EDUCATION
The Secondary Education age span element is respon~ible for management of (1) general secondary education programs, (2) consolidated categorical aid, (3) 7-12 School Improvement Program, (4) vocational education (5) traffic safety, and (6) curriculum services. G~neral secondary education and consolidated categoricals were discussed previously in the Special Programs and Support Services element under the heading of . Compensatory Education (page 690).
Table 31 shows funding by component and source.
Table 31 Secondary Education Expenditures and Funding
Actual Estimated Proposed . Change Over 1977-78 Component 1976-77 1977-78· 1978-79 ~ount Percent
1. General Secondary $3,517,475 Ediication Activities .. $3,256,297 $3,724,263 $206,788 5.9%
2. Consolidated Catego· ricals .............................. 38,224,109 41,960,050 43,599,200 1,639,150 3.9
3. School Improvement . Program .............. ,.,., ... 1,614,500 9,240,737 7,626$37 472.4
4. VocafionalEducation 66,457,833 65,339,581 67,841,680 2,5!l2,099 3.8 5. Traffic Safety .............. 322,404 558,126 535,644 -22,482 c -4.0 6. Curriculum Services .. 4,193,099 5,364,734 5,094,722 -270,012 -5.0
Total, '.:., ................ , ..... $112,453,742 $118,354,466 $130,036,246 $11,681,780 9.9% State OjJerations:
General Fund .............. $3,388,383 $3,994,542 $5,638,739 $1,642,197 4.1% Califomia Environ-
mental Protection Program Fimd ........ 11,892 12,528 ~2,870 342 2.7
Federal funds .............. 8;786,522 9,079,499 6,185,663 ~2,893,836
. Rtt~iEbursements ........ 1,230,160 2,316,£79 1,658,758 -657,521· ,-28.4. Local Assistance:
General Fund .............. 18;941,402 22,698,565 31,345,950 8;647,385 38.1 Califomia Environ-. mental '. Protection
f!ogram Fund ........ 383,5{}() 300,000 318,000 18;000 6.0 Federal 'funds .............. 69,491,328 68,632,091 72,425,208 3,793,117 5.5 Reimbursements ........ 10,212,555 11,320,962 12,453,058 1,132,096. 10.0
702 / K-12 EDUCATION Items 29~18
DEPARTMENT OF EDUCATION-Continued
1. SCHOOL IMPROVEMENT PROGRAM (SIP) IN GRADES 7-12
The aim of this program is the restructuring of education. Local school site councils composed of school personnel, students, parents or other community members will direct the restructuring at their individual schools. The K-6 portion of this program was discussed under Program I, Elementary Education (page 697). .
AB 65 provides $1,455,000 in 1977-18 and $8,924,000 in 1978-79in local assistance for secondary schools program development and operation. Funding to districts is based on (a) $30per ADA for planning, and (b) $90 per 7-8 grade ADA and $65 per 9-12 grade ADA for program operation. The Department of Education has budgeted $159,000 in 1977-78 and $316,-000 in 1978-79 for state administ:-ation of the program. The department estimates that 46 high schools in 45 school districts with a total enrollment of 54,000 ADA will be involved in program planning in 1977-78. These high schools will start program operations in January 1979. An additional 150 high schools will be involved in planning starting on July 1, 1978, with their program operation due to start in September 1979.
Allocation Plan Needed
We recommend that the Department of Education present to thefiscal subcommittees during the budget hearings its plan for expenditure of secondary School Improvement funds for 1977-78 and 1978-79.
Initial department implementation of the secondary school improvement program was not begun until October 1977, due to the late adoption of AB 65. It was the intention of the department to provide for a year of planning and development at the school site prior to the first year of program operation. Due to the timing, the initial year ofp~anrting will be January 1978 through December 1979 rather than September 1977 through August 1978. Because of this six morith time lag, the department may not be able to effectively obligate the entire amount of local assistance funds for this program reflected in the Governor's Budget for 1978-79. We, therefore, recommend that the department submit its plan for allocation of funds for the Secondary School Improvement Program to the fiscal committees fgr review during the budget hearings.
Program Evaluation ,
AB65 also made provision for an independent evaluation of the School ImproveIllent Program over a five year period. Funding for the entire evaluation was provided at a level of $1 million. The department is in the process of contracting for this independent evaluation.
2. VOCATIONAL EDUCATION
The Vocational Education Unit in the Department of Education assists local education agencies in providing vocational training and guidance to approximately 1 million students in the state. Support for vocational education is derived from (1) the regular foundation program allowance generated by ADA in vocational education classes ($545 million) and (2) supplemental funds from the federal government to be used for special
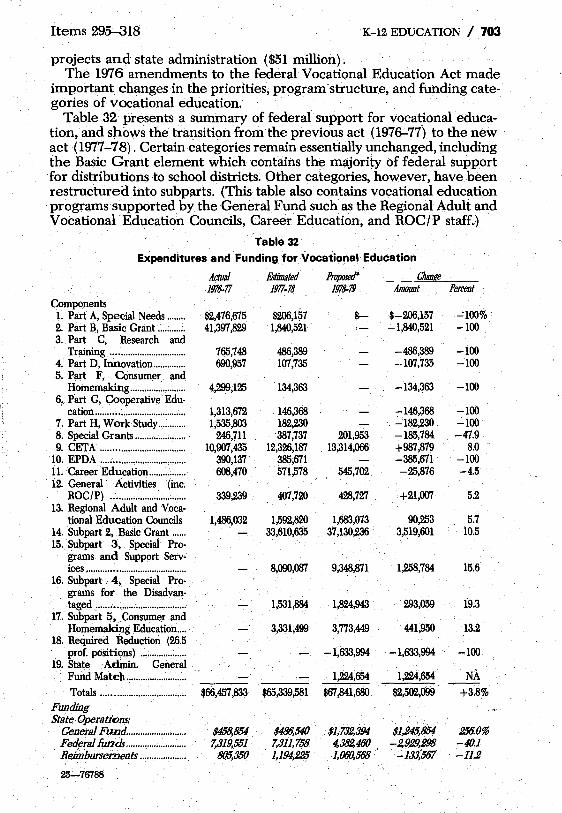
Items 29~18 K-12 EDUCATION / 703
projects and state administration ($51 million). The 1976 amendments to the federal Vocational Education Act made
important changes in the priorities, program-structure, and funding cate-gories of vocational education. .
Table 32 presents a summary of federal support for vocational education, and shows the transition from the previous act (1976-77) to the new act (1977-78). Certain categories remain essentially unchanged, including the Basic Grant element which contains. the majority of federal support for distributions to school districts. Other categories, however, have been restructured. into subparts. (This table also contains vocational education programs supported by the General Fund such as the Regional Adult and Vocational Education CoUncils, Career Education, and ROG/P staff.)
Table 32 Expenditures and Funding for Vocational Education
Actual Estimated Proposed" CiJan!! 1976-77 1!J77-78 1978-79 Amount Percent
Components 1. Part A, Special Needs ........ $2,476,675 $206,157 $- $-206,157 "':100% 2. Part B, Basic Grant .: .......... 41,397,829 1,840,521 -1,840,521 -100 3. Part C, Research and
Training· ................................ 765,748 486,389 -486,389 -100 4. Part D, Innovation .............. 690,957 107,735 -107,735 -100 5. Part F, Consumer and
Homemaking ............. : .......... 4,299,125 134,363 -134,363 -100 6, Part G, Cooperative Edu-
cation ........ -.............................. 1,313,672 146,368 -:-146,368 -100 7. Part H, Work Study ............ 1,535,803 182,230 -182,230 -100 8. Special Grants ...................... - 246,711 387,737 201,953 -185,784 -47.9 9. CETA .................................... 10,907,435 12,326,187 13,314,066 +987,879 8.0
10. EPDA ............................ , ....... 390,137 385,671 -385,671 -100 n. Career Education ................ 608,470 571,578 545,702 -25,876 -4.5 12. General Activities (inc.
ROC/P) ................................ 339,239 407,720 428,727 +21,007 5.2 13. Regional Adult and Voca-
tional Education Councils 1,486,032 1,592,820 1,683,073 90,253 5.7 14. Subpart 2,. Basic Grant ...... 33,610,635 37,130,236 3,519,601 10.5 15. Subpart 3, Special Pro-
grams and Support Serv' ices .......................................... 8,090,087 9,348,871 1,258,784 15.6
16. Subpart 4, Special Pro· grams for the Disadvan-taged ................................ , .... : .. 1,:;:31,884 1,824,943 293,059 19.3
17. Subpart 1$, Consumer and Homemaking Education .... 3,331,499 3,773,449 441,950 13.2
18. Required Reduction (26.5 prof. positions) .................... ..,.1,633,994 -1,633,994 -100
19. State Admin. General Fund Match .......................... 1,224,654 1,224,654 NA
Totals ..... _ ......................... , .... $66,457,833 $65,339,581 $67,841,680 $2,502,099 +3.8% Funding State· Operations:
General Fund .......................... $458,854 $486,540 $1,732,394 $1,245,854 256.0% Federal funds .......................... 7,319,551 7,311,758 4,382,460 -2,929,298 -40.1 Reimbursel71ents .................... 8()5,350 1,194,£25 1,060,568 . -13!,567 . -11.2
25-76788
, !
704 / K~12 EDUCATION
DEPARTMENT OF EDUCATION-Continued
Local Assistance: General Fund. ........................ . Federal funds ......................... . Reimbursements ................... .
1,250,000 46,401,523 10,232,555
1,325,000 43,701,096 11,320,962
1,404,500 46,808,700 12,453,058
Items 295-318
79,500 3,107,604 1,132,096
6.0 7.1
18.0
• Does not include approximately $545 million in regular school apportionments for vocational education. NA= Not appropriate. '.
A. Voc@tional Administrative Staff Work plan
We recommend that the Department of Education submit to the Joint Legislative Budget Committee by April 3, 1978, a work plan for the current vocational education staff which indicates (1) the number ofprofessional positions assigned to planning, accountability, communication, resource management, curriculum services, professional development and research, and (2) the portion of each function which can be identified as administrative or ancillary service. .
The federal amendments of 1976 require all states to share the expense of state-level administration in the amount of 20 percent in 1977-78,40 percent in 1978-79, and 50 percent in the years thereafter. California secured a waiver in 1977-78, but must provide its 40 percentshare in the budget year ($1,224,654).
Vocational Education Staff
Last year our office requested the department to submit a management plan for the entire vocational education unit. This plan was to include a detailed work plan which assigned professional positions to certain functions, such as planning, accountability, and curriculum services. After: submission, we compared workload presented in this document with the workload of other consultants in the department, and concluded that the vocational education staff was excessive~ In a supplemental analysis presented during the 1977-78 budget hearings, we recommended that state staff be reduced from 115 to 61.7 professional positions over a three-year period.
To . prevent lay-offs, the Legislature eliminated only six professional positions at the beginning of the 1977-78 budget year, b,ut required an additional reduction of 26.5 professional positions as of June 30, 1978.
The Department's Budget Request for 1978-79
The department's response to the legislative action has been to deny the validity of the management pl~ it had submitted to the fiscal committees in 1977. The department states that the plan had been prepared too hastily to be used as a basis for staff cuts. Since then, a 52,page 1978-79 budget document has been submitted which requests continuance of the 26.5 positions plus 18.1 more professionals to meet new federal responsibilities. This request does not appear in the 1978-79 Governor's Budget.
Poor Justi'fication
This budget request attempts to summarize the current responsibilities of the vocation3.l education staff. Unfortunately, it is not an adequate replacement for the management plan now disavowed by the department. It lacks the quantification of workload contained in the original

Items 295-318 K-12 EDUCATION / 705
plan, listing only the general responsibilities of each bureau, and assigning each a total staff. No effort is made to relate personnel-years to certain functions, such as accountability or curriculum services. In fact, it appears that the number of staff assigned to each bureau may have beeIl arbitrarily or historically determined, rather than determined on the basis of new planning or evaluation responsibilities. For example, staffing in the Agricultural Education bureau requires each consultant to be responsible for 35.5 school sites. However, an Industrial Arts consultant would be responsible for 280 school sites, and a Home Economics consultant for 104 sites. This wide variation in workload ratios cannot be explained by new responsibilities which should apply equally to each bureau, and calls into question the reliability of the entire document. -
As a result this budget request can not be used as a basis for making either staff additions or deletions.
State Share of Administration
The budget request document also is of no assistance in determining the amount the state must contribute toward its 40 percent share of administrative costs.
The Federal Act (Section IlIa) and the regulations make a general distinction between "administrative" and "ancillary" services, and require that. only expenditures for administrative services be shared by the state. Unfortunately, only the original management plan clearly separates administrative and ancillary services. Thus, there exists a great deal of confusion as to exactly what expenditures must be shared by the state.
The Governor's Budget, recognizing this difficulty, provides a 40 percentshare of all state-level expenditures for vocational education (except-
I - ing contract services). This share amounts to $1,224,654 (it has been reduced by (1) $456,527 to reflect funds the state already provides through the RAVEC and-ROC/P programs, and (2) 25 percent to reflect a federal fiscal year beginning in October).
While we recognize the confusion, we believe that administrative and ancillary costs can be sufficiently identified to justify a reduction in the state's share. As an example, using the management plan of last year, our analysis indicates that this share would be $350,440 in 1978-79 after adjustment for current state contributions and the federal fiscal year.
These potential savings clearly justify the preparation ofa revised work plan similar to the one developed last year. A new plan could also be used to determine whetl1er or not an additional final budget cut of 20.8 professionalpositions should be made in the 1979-80 fiscal year.
To be of use in the current budget hearings, the new document should be developed and presented to the fiscal committees by April 3, 1978.
B. Regional Adult and Vocational Education Councils (RAVECs)
Chapter 1269, Statutes of 1975, replaced 12 existing area vocational planning committees' and adult continuing education coordinating councils with a statewide network of 72 consolidated regional adult and vocational education councils (RAVECs). Council boundaries are based on commu-nity' college district boundaries. _ ,
The principal responsibility of the councils is the development of re-
706 / K-12 EDUCATION Items 295-318
DEPARTMENT OF EDUCATION-Continued
gionalplanning and the review of certain adult and vocational education . courses and programs offered in each region in order to eliminate those courses which represent an unnecessary duplication of effort. Courses under the jurisdiction of the councils include:
(1) adult basic education, iIicluding adult hjgh school diploma' programs, vocational and occupational training, adult continuing and personal development education, and adult programs in grades 13 and 14,
(2) all courses operated by regional occupational centers or programs (ROP/Cs),
(3) community service classes, and (4) those community college courses being changed from noncredit to
credit status. .' This list indicates that the councils have control over most adult educa
tionprograms but only a portion of the vocational. education cour~es offered by high schools a.nd community colleges. Courses which are part of the regular high school program and all credit classes in community colleges are not subject to council review.
RAVECs Activities
The councils spent the first year of implementation (1976-77) in organizational activities such as hiring staff, budget preparation, and preliminary meetings. They also began the delineation of function and articulation agreements required by the law. The delineation of function agreement specifies which agency is responsible for each program of adult education. Articulation agreements relate the various course offerings of one. program to more advanced programs to insure compatibility and transfer capability. These docllments were to be completed byJune 30, 1977 and most councils have complied.
During the first half of the 1977-78 school year, the councils prepared a partial or total inventory of all adult courses in their regions, and began the development of the one-year plan. In addition, most councils began to review new course offerings for unnecessary di1plication. In some cases, certain proposed courses have been withdrawn due to council action.
Data Collection and Annual Report
As a result of our recommendatioI'lin the 1977-78 Analysis, the Legislaturedirected the Departrilent of Education to collect performance data on the <;!ouncils and submit an annual report. While the final report h~s not been completed, the departrilent has received activity data from all RAVECs, including the number of courses which are under each RA VEe jurisdiction~ the number which receive an indepth review, the number found to be duplicative and eliminated as a result of council action, 'the number transferred to another agency; and the number which continue to receive state apportionments in spite of being judged unnecessarily duplicative. ,. .' .
It was expected that these data would permit the Legislature to assess the activity and value of RAVECs operation. However, the department
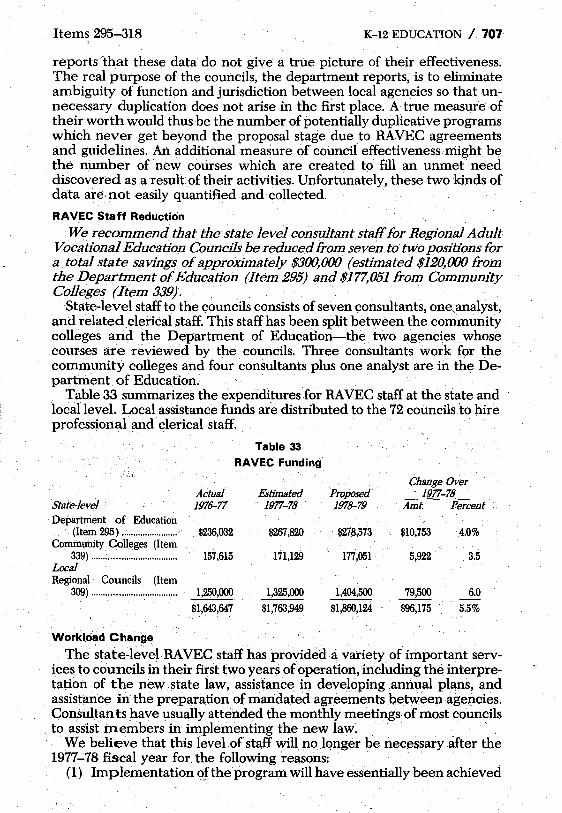
ltems29~18 K-12 EDUCATION / 707
reports 'that these data do not give a true picture of their effectiveness. The real purpose of the councils, the department reports, is to eliminate ambiguity of function and jurisdiction between local agencies so that unnecessary duplica.tion does not arise in the first place. A true measure of their worth would thus be the number of potentially duplicative programs which never get beyond the proposal stage due to RA VEC agreements and guidelines. An additional measure of council effectiveness might be the number of new courses which are created to fill an unmet need discovered as a result of their activities. Unfortunately, these two kinds of data are not easily quantified and collected.
RAVEC Staff Reduction
We recommend that the state level consultant staff for Regional Adult Vocational Education Councils be reduced from seven to two posih'ons for a total state savings of approximately $300,000 (estimated $120,000 from the Department of Educa.tion (Item 295) and $177,051 from Community Colleges (Item 339).
Sta.te-Ievel staff to the <;!ouncils consists of seven consultants, one, analyst, and related clerical staff. This staff has been split between the community colleges and the Department of Education-the two agencies .. whose courses are reviewed by the councils. Three consultants work for the community colleges and four consultants plus one analyst are in the Department of Education.
Table 33 summarizes the expenditures for RA VEC staff at the state and loc:illevel. Local assistance funds are distributed to the 72 councils to hire professional and· clerical staff.
Table 33
RAVEC Funding
Change Over Actual . Estimated Proposed 1977-78
State-level 1976-77 1977-78 1978-79 Amt. Percent Department of Education
(Item 295) ....................... ; $236,032 $267,820 $278,573 $10,753 4.0% Commuility Colleges (Item
339) .................................... 157,615 171,129 177,051 5,922 3.5 Local Regional Councils (Item
309) .................................... 1,250,000 1,325,000 1,404,500 79,500 6.0
$1,643,647 $1,763,949 $1,860,124 $96,175 5.5%
Workload Change
The state-Ie~el RA VEC staff has provided a variety of important services to councils in their first two years of operation, including the interpretation of the new state law, assistance in developing annual pl~ns, and assistance in the preparation of manda.ted agreements between agencies. Consultan ts have usually attended the monthly meetings of most councils to assist members in implementing the new law. .. '
We believe that this level of staff will no IQnger be necessary after the 1977-78 fiscal year for the following reasons:
(1) Implementation o.f the program will have essentially been achieved

708 IK-12 EDUCATION Items 295-318
DEPARTM ENT OF EDUCATION-Continued
by the end of 1977-78. Councils have already met most of the statutory deadlines required by state law, including the delineation of function and articulation agreements, and the iIlitial one-year plan. The major responsibility now facing councils is the ongoing review and approval of specific courses.
(2) The current state RA VEC staff of seven consultants appears to .be excessive when compared to other programs. This current staffing level means that each consultant is responsible for only 10 councils. This workload may be compared to a vocational education consultant who is responsible for an average of 150 school sites each year, or a consultant from the Bureau of School Approvals who is responsible for 180 private schools each year. While these local agencies are different, the duties performed by the consultants are similar: leadership, guidance, evaluation and compliance review.
(3) The state provides $1.4 million in General Fund support to the councils for the hiring of local staff. The duties now facing the councils are essentially local in scope, including the inventory of all courses in the RA VEG region, the review of new course offerings, and the development of regional plans. Emphasis should be placed on the hiring of adequate local staff rather than the maintenance of a large state staff.
For these reasons, we recommend that the current staff of seven consultants be reduced to two consultants in the 1978-79 year. Two consultants plus the analyst position would permit council members and staff to retain adequate liaison With state government. Each consultant would be responsible for 35 councils. Given a work year of approximately 220 days, this means that each consultant could devote a maxim~ of 6-7 work days to each council, In most cases, it is doubtful if a council would need this amount of assistance from the state. Consultants would. thus be free to concentrate on specific problem areas. We believe this would be a more efficient use of manpower than the current practice of consultants attendingall council meetings whether the agenda warrants. state assistance or not. The analyst position would be retained to review council budgets, summarize activity data in an annual report, and perform administrative activities. .. .
Split Staff Unnecessary
In addition, there appears to be little advantage in maintaining a staff split between two agencies. Every consultant deals with both community college and adult education programs regardless of where he is housed. To avoid the coordination problems encountered with a split staff, we recommend that the reduced RAVEC staff be housed in the Department of Education and report to the Interagency Management Team. Therefore, the staff reduction proposed above could be best accomplished by eliminating the three pr()fessional positions .(plus clerical staff) now ·in the Community Colleges (Item 339) and reducing from four to two consultant positions (plus clerical staff) in the Department of Education (Item 295) , for savings- of $177,051 and $120,000, respectively. .

Items 295-318 K-12 EDUCA nON / 709
3. CURRICULUM SERVICES
The Curriculum Services Unit provides administrative and technical· consulta tion to school districts and other appropriate agencies in: (1) state"mandated curriculum activities,(2) health education, inCluding drug and alcohol abuse and nutrition programs, (3) public personnel services, (4) mentally gifted minors, (5) continuous learning, and (6) other curriculum activities, inCluding conservation education and instruc-tional television. ' .
Expenditures and revenues for these program areas . are presented in Table 34. .
Table 34 Expenditures and Revenues for Curriculum Services
Actual Estimated Proposed Change Component 1976-77 1977-78 1978-79 Amount Percent
State' Operations: l. Sf~te·Mandated Cur-
ricUlum Activities .......... $640,488 $653,040 $730,024 $76,984 11.8% 2. Health Education .......... 1,183,472 1,799,788 1,386,506 -413,282 -23.0 3, Pupil Personnel Serv-
ices (includes Career GUidance Centers) ........ 207,519 406,675 409,979 3,304 B
4. Mentally Gifted and Talented .......................... 270,183 272,748 284,942 12,194 4.5
5 .. Disaster Preparedness .. 37,895 a
6. O!her, CurricUlum Ac-tivities .............................. 390,528 464,393 476,980 12,587 2.7
7. Curriculum Frame-works and Instructional
.. ' ·Materials ..... ;.: ... : .............. 343,404 396,726 416,927 20,201 5,} LoaalAssistance: l.:q~pilPersonnel Serv-
ices (includes Career .' Gilidance Centers) ........ 250,000 250,000 2.·Other CurricUlum ,Ac-
tivities .............................. 1,119,610 1,121,364 1,139,364 18,060 b 1.6
Total ...................................... $4,193,099 $5,364,734 $5,094,722 $-270,012 ~5.0%
State Operations: General Fund .................. $2,£90,194 $2,590,614 $2,793,587 $202,973 7.8% California Environmen-
tal Protecbon .Pro-gram.Fund ................... 11,892 12,528 12,870 342 2.7
Federal funds .................. 484,128 596,010 597,094 1,084 .2 Reimbursements ............ 287,275 794,218 301,807 -492,384 62.0
Local Assistance: .. ' General Fimd .................. 736,110 1,071,364 1,071,364
Califori1ia Environmen-tal Protecbon Pro-
'gram Fund ................... 383,500 300,000 318,00(J 18,000 6.0
a This program was discontinued when federal funds terminated. . .' ' b'PUs funding level represents an inflation adjustment of 6 percent to the local assistance portion ($300;-, .. (00)'. l)f conservation education. .
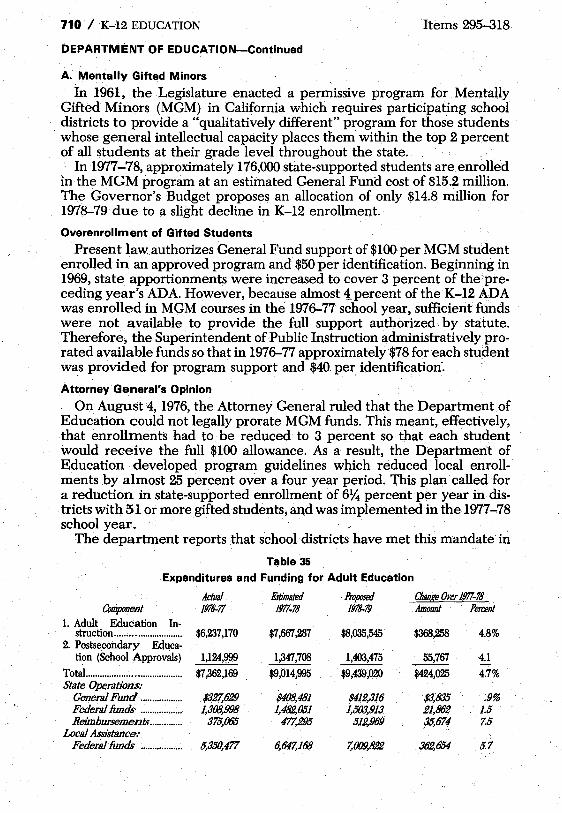
710 / K-12 EDUCATION Items 295-318
DEPARTMENT OF EDUCATION-Continued
A. Mentally GiftE!d Minors ,
In 1961, the Legislature enacted a permissive program for Mentally Gifted Minors (MGM) in California which requires participating school districts to provide a "qualitatively different" program for those students whose general intellectual capacity places them within the top 2 percent of all students at their grade level throughout the state.
In 1977-78, approximately 176,000 state-supported students are enrolled in the MGM program at an estimated General Fund cost of $15.2 million. The Governor's Budget proposes an allocation of only $14.8 million for 1978-79 due to a slight decline in K-12 enrollment.
Overenrollment of Gifted Students
Preseht law authorizes General Fund support of $100 per MGM student enrolled in an approved program and $50 per identification. Beginning in 1969, state apportionments were increased to cover 3 percent of the preceding year's ADA. However, because almost ipercent of theK-12 ADA was enrolled in MGM courses in the 1976-77 school year, sufficient funds were not available to provide the full support authorized by statute. Therefore,. the Superintendent of Public Instruction administratively prorated available funds so that in 1976-77 approximately $78 for each student was provided for program support and $40. per identification-.
Attorney General's Opinion
On August 4, 1976, the Attorney General ruled that the Department of Education could not legally prorate MGM funds. This meant, effectively, that enrollments had to be reduced to 3 percent so that each student would receive the full $100 allowance. As a result, the Department of Education . developed program guidelines which reduced local enrollments by almost 25 percent over a four year period. This plan called for a reduction in state-supported enrollment of 6y'& percent per year in dis~ tricts with 51 or more gifted students, an,d was implemented in the 1977-78 school year_ .
The department reports that school districts have met this mandate in
Table 35 Expenditures and Funding for Adult Education
Actual Ertimated Proposed Ch8/JEe Over 1!!l7-78 ConipooeiJl 1976-77 1!!l7_78 1978-79 Amount Percent
1. Adult Education In-struction ............................ $6,237,170 $7,667;1137 $8,035,545 $368,258 4.8%
2. Postsecondary Educa-tion (School Approvals) 1,124,~ 1,347,708 1,403,475 55,767 4.1
Total ........................................ $7,362,169 $9,014,995 $9,439,020 $424,025 4.7% State Operations:
General Fund .................. $327,629 $408,481 1412,.116 $3,835 .9% Federal funds .................. 1,308,99~ 1,482,051 1,503,913 21,862 1.5 Reimbursements .............. 375,065 477,295 512,969 ,35,671 7.5
Local Assistance: Federal funds .................. 5,350,477 6,647,168 7,009,822 362,654 5.7

" . Items 295-318 K-12EDUCATION / 711
a variety of ways. Some districts eliminated the gifted program at certain grade levels, usually kindergarten or 12th grade. Other districts continued the program at the present enrollment level by contributing local funds or offering the program for only one semester.
D. ADULT EDUCATION
The· adult edupation element is responsible for management of adult programs operated by school districts and for approval of schools for veteran's training.
Table 35 on page 710 shows funding by component and· source.
1. POSTSECONDARY EDUCATION (SCHOOL APPROVALS)
Responsibilities
The Bureau of School Approvals reviews educational programs and courses offered by 2,200 private postsecondary schools in the state. The bureau operates under the following state and federal mandates:
(1) State-Division 10 (Education Code) which requires the bureau to monitor and review all postsecondary institutions in the state not accredited by a recognized agency. There is also a small state component which requires the bureau to review General Education Development (GED) centers.
(2) Federal-Title 38 (U.S. Code) which, under an annual contract, re- . quires the bureau to approve all schools enrolling veterans who receive educational benefits. .
Table 36 summarizes expenditures by the bureau. Support for the Division 10 (and GED) review mandate come from fees charged to clients. Support for the Title 38 review mandate is received from the federal Veteran's Administration. Therefore, the bureau is theoretically self-supporting. However, client fees and federal funds do not leave sufficient reserves to pay the Department of Education's 29 percent overhead charge for administration. Thus, the bureau actually operates at a deficit of approximately $117,006 per year as shown in the Ge~eral Fund element presented in the table.
Table 36 Expenditures for the. Bureau of School Approvals
Actual Estima.ted Proposed Change Activity 1976-77 1977-78 1978-79 Amount Percent
1. Division 10 (State) ...... $346,507 $417,327 $436,503 $19;176 4.6% 2. Title 38 (Federal) ........ 756,192 875,280 890,506 , 15,226 1.7 3. CED Testing .................. 22,300 55,101 76,466 21,365 38.8
Total ...................................... $1,124,999 $1,347,708 $1,403,475. $55,767 4.1% Funding:
$51,606 General Fund ................ $117,(}(){} $116,(}(){} $-1,(}(){} -.8% Federal funds .................. 704,586 758,280 774,506 16,226 2.1 Reimbursements ............ 368,807 472,428 512,969 40,541 8.6
Follow-up of Legisladve Directive
In the 1977-78 budget hearings, the Legislature adopted directives which required the bureau to:
(1) Downgra:de eight field representative positions (as vacated) to four

71Z / K-12 EDUCATION Items 295-318
DEPARTMENT OF EDUCATION-Continued
educational assistants and four'staff service analysts. (2) Submit a revised workplan of the bureau which de-emphasizes
annual visits and provides for selective in-depth reviews. (3) Increase fees collected under Division 10 by an amount equal to the
increase of the Consumer Price Index in order to establish two staff services analyst positions. .
These recommendations are being complied with. The bureau cnief reports that special visitation forms have been prepared to structure the review process, and that every effort is being made to amend federal regulations requiring routine visits to all schools. This should allow field representatives more time for in-depth reviews. In addition, Chapter 1202, Statutes of 1977, (AB 911) enacts consumer protection provisions which will require more intensive review of private school operations. '
PROGRAM II ADIlliINISTRATIVE SUPPORT SERVICES
Program II consists of three elements: (a) apportionment and distributon of aid, (b) administrative services to local education, and (c) consolidated application and resources. management. Table 37 on page 713 shows the funding H:lVels for each element.
A. APPORTIONMENT AND DISTRIBUTION OF Alq
1. ADMINISTRATION AND APPORTIONMENT OF STATE AID
A. Public School Funding
The system of public school apportionments is controlled by constitutional and statutory provisions. The Constitution guarantees each of the 1,044 school districts a minimum state support of $120 per ADA (averltge daily attendance). This is referred to as "basic aid". Additional statutory state support is provided to approximately 81 percent of the state ADA in the form of "equalization aid". To receive equalization aid, a district must be unable to raise sufficient local revenue to meet a given level of expend iture determined annually by the state. This dollar level is referred to as the "foundation program."
In addition, the state's system of providing aid to school districts includes a local revenue control mechanism designed to limit the future growth in school expenditures and related property tax rates, based upon revenues received in the 1972-73 fiscal year. Because of inflation, the limits on revenues and expenditures are adjusted upward each year. However, poor districts are allowed to increase their "revenue limits" by a larger amount than are more wealthy districts so that within a period of years expenditures per ADA in all districts will be nearly equal. This control feature, enacted in 1972, was a 'response to both the Serrano issue and demands for property tax relief. Revenue limits may be exceeded with 10Gai funds but only if specifically authorized in a district erection. These increases to the revenue limits are known as "voter overrides".

Iterns 295-318 K-12EDUCA TION / 713
Table 37 Administrative Support Services
Disbursement of Funds
Actual Estimated Proposed 197~79 Change Program Element 1976-77 1977-78 197~79 Amount Percent A. Apportionment and Distribution of Aid
i. Administration and Apportionment of State Aid
State Operations ................................ $1,276,545 $1,368,966 $186,462 $-1,182,504 -86.4% State OperationS-:-SWCAP Collec-tions ...................................................... (908,OOI) (1,191,471) (283,470) (3l.2) Subtotal ................................................ (1,276,545) (2,276,967) (1,377,933) (-899,034) (-39.5) Local Assistance ................................ 2,239,749,633 . 2,398,020,648 2,772,842,828 374,822,180 15.6
2. Urban Impact Aid Local Assistance .................................... 71,700,000 48,962;000 -22,738,000 -3l.7
3. Textbook Management and Distribu-tion
State Operations ................................ 751,280 978,383 1,009,438 31,055 3.2 Local Assistance .. " ............................ 31,778,900 40,267,719 49,506,891 9;239,172 22.9
4. Surplus Property State Operations .................................... 4,084,553 5,110,489 5,313,297 202,808 4.0
5. Food and ~utrition State Operations ................................ 1,806,030 2,073,789 2,197,061 123,272 5.9 Local Assistance ................................ 231,197,042 279,146,760 305,570,471 26,423,711 9.5 Subtotal, ............................................... $2,510,643,983 $2,798,686,754 $3,185,568,448 $386,921,695 13.8%
B. Administrative Services to Local Educa-tion 1. School Facilities Planning .................... 8581,397 $799,657 $508,981 $-290,676 -36.4% 2. Field Management ................................ 1,227,047 1,529,024 1,550,565 21,541 .4
Subtotal ...................................................... $1,808,444 $2,328,681 82,059,546 $-269,135 -1l.6% .," C. Consolidated Application and Resources
Management """""'''''''''''''''''''''''''''''''''''''' $62,107 $84,888 $22,781 36.7%
Totai· ....... , .................................... ; ............ ; ........... 82,512,452,427 $2,801,057,542 $3,187,732,882 $386,675,340 13.8% Funding .4. Apportionment and Distribution of.4id
General Fund .'''''''''''''''''''''''''''''''''''''''' 82,298,747,110 $2,541,516,4fJ,J $2,855,051,372 $313,534,969 12.3% General Fund (loan recOlC'ries) ........ -178,333 ~248,333 -185,000 63,333 25.5 State School Fund """""""'''''''''''''''''' 9,816,335 . 9,8fKJ,OOO 5O,1fXJ,OOO 4fJ,3OO,OOO 4ll.2
. Surplus Educational Proper~J' Re-IviJing Fund .......................................... 4,056,242 5,071,974 5,273,474 201,500 4.0 Instructional Jlaterials Fund .............. Dril'er TrainingPen;d~J' Assessment
1,994,592 7,533,511 7,533,511 1fKJ.0
Fund ...... _ ....................................... : .......... 38,169 161,811 -161,811 -1fKJ.0 Federallimds ...... , ................................... 195,925,354 242,278,864 267,727,768 25,#8,fJ()4 10.5 Reimbursements ..................................... 224,514 86,015 87,323 1,308 1.5
Totals ................ ; ........................ ; ...................... $2,510,{]43,983 $2, 798,(J(J6, 754 $3,185,588,448 $386,921,694 . 13.8% B. Administratr'J'e Senices to Local Educa-
tion Geneial Fund ................................... : .... $830,373 $927,734 $949,968 $22,234 2.4% School Building Aid Fund ................ :. 303,984 370,080 183,472 -18fi,(j(}8 -50.4 Federal fnnds ............................ , ............. 379,394 471,723 4/12,471 -9,252 -2.0 ReimburYemen/s .................................... 294,693 559,1# 4fi3,635 -95,509 -17.1
Totals ............ ; __ ................................................. 81,808,4# $2,328,681 $2,059,546 -$269,135 -11.6% C ConsolidatedApplication and Resources
Jlanagement General Fund ........................................ $62,107 $84,888 $22,781 36.7%

\
714 / K-12 EDUCATION Items 295-318
DEPARTMENT OF EDUCATION-Continued
B. AB 65 (Chapter 894, Statutes of 1977) Financing Changes
AB 65 contained the following major provisions affecting public school funding;
1. Foundation Program and Revenue Limit Changes-Increased the foundation program by 11 percent in 1977-78,9 percent in 1978-79, and 9 percent in 1979-80.
2. Constant State Share of the Foundation Program (Termination of Slippage ) -The state's share of the foundation program for equalization aid districts will be maintained at the level in 1977-78 (34.5 percent).
3. Guaranteed Yield Program (GYP)-GYP is a property tax relief program for equalization aid districts that equalizes those expenditures above the foundation program level. .
4. Power Equalized Mechanism for Voted Tax Overrides-This mechanism will equalize the tax rates for all voted overrides passed aftet: July 1,1977.
5. School District Equalization Tax-This tax equalizes for basic aid districts a portion-reaching a maximum of 20 percent in 1980-81-of those expenditures above the foundation program level.
6. Minimum Tax-All districts are required to levy a minimum tax rate of $1.00 for elementary school districts, $.80 for high school districts, and $1.80 for unified school districts.
7. Declining Enrollment Adjustment to the Revenue Limit-Districts with declining ADA will be able to make an additional adjustment to their revenue limit. ,
8. State Teachers Retirement System (STRS)-Starting in 1979-80, the existing state aid support system will be replaced (subjectto future legislation) with a system based on a modified guaranteed yield program:
9. Reducing the Basic Aid Grant by$5-:--The basic aid grant was reduced from $125 per ADA to $120 per ADA.
10. Urban Impact Aid-19 large urban districts will receive $64 million in 1977-78, $41 million in 1978-79, and $44 million in 1979-80 for general non categorical aid. . ,
Table 38 on page 715 provides a five-year cost projection of both the school finance, categorical aid and property tax features of the bill.
The total five-year cost exceeds earlier estimates by $330 million. There are two reasons for this. First, the assessed value forecast has been revised. While fluctuations in the assessed valuations will minimize impact on state apportionments because of the slippage mechanism in AB 65, it does have an impact on prior law, and therefore, the cost of AB 65. Second, use of the 1976--77 second principal apportionment data in the school finance model has changed the projected distribution of equalization aid and basic aid districts. (The cost of maintaining the state's share of the 1977-78 foundation program for equalization aid districts varies depending upon the distribution of equalization aid and basic aid districts.) This accounts for most of the cost increase.
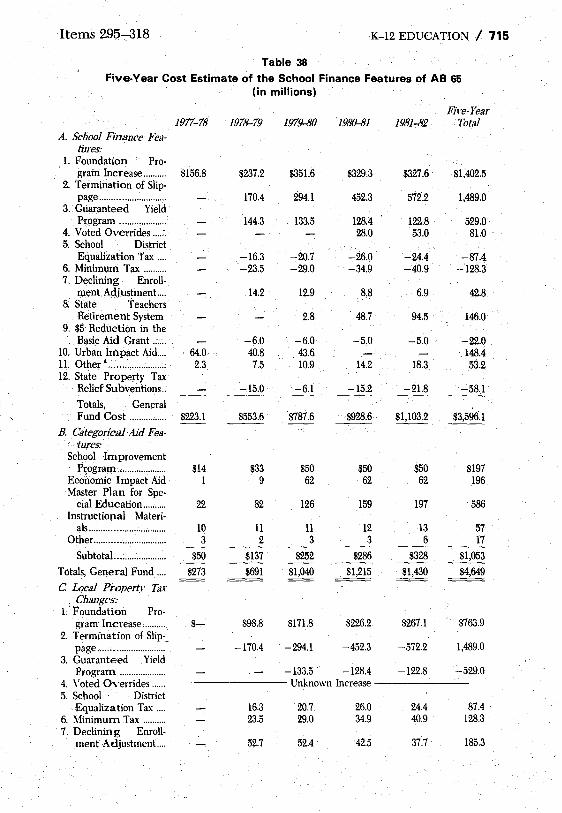
Items 295~18 K-12 EDUCATION I 715
Table 38 Five;Year Cost Estimate of the School Finance Features of AS 65
(in millions)
Five-Year 1977-78 1978-79 1979-80 1980-81 1981~2 Total
A. School Finance Fea-tures:
1. Foundation Pro-gram Increase .......... $156.8 $237.2 $351.6 $329.3 $327.6 $1,402.5
2. Termination of Slip-page ............................ 170.4 294.1 452.3 572.2 1,489.0
3. Guaranteed Yield Program .................... 144.3 133.5 128.4 122.8 529.0
4. Voted Overrides ... ::. 28.0 53.0 81.0 5. School District
Equalization Tax .... -16.3 -20.7 -26.0 -24.4 -87.4 6. Minimum Tax .......... -23.5 -29.0 -34.9 -40.9 -128.3 7. Declining Enroll-
Il,lent Adjustment.. .. 14.2 12.9 8.8 6.9 42.8 8: State Teachers
Retirement System 2.8 . 48.7 94.5 146.0 9. $5 Reduction in the
Basic Aid Grant .... ;. -6.0 -6.0 -5.0 -5.0 -22.0 10. Urban Impact Aid .... 64.0 40.8 43.6 . 148.4 11. Other· ....................... ; 2.3 7.5 10.9 14.2 18.3 53.2 12. State Property Tax
Relief Subventions .. -15.0 -6.1 -15.2 -21.8 -58.1
Totals, General Fund Cost ........ : ....... $223.1 $553.6 $787.6 $928.6 81,103.2 $3,596.1
B. Categorical Aid Fea-tures:
School Improvement P~ogram .................... 814 $33 850 $50 850 $197
Economic Impact Aid 1 9 62 62 62 196 Master Plan for Spe-
cial Education .......... 22 82 126 159 197 586 Instructional Materi-
als ................................ 10 11 11 12 13 57 Other .............................. 3 2 3 3 6 17 ---
Subtotal. ..................... $50 $137 8252 8286 8328 $1,053
Totals, General Fund .... 8273 $691 81,040 81,215 $1,430 84,649
C. Local Proper~1' Tax Changes:
1. Foundation Pro-gram Increase .......... S- 898.8 8171.8 8226.2 8267.1 8763.9
2. Termination of Slip-.. page ............................ -170.4 -294.1 -452.3 -572.2 1,489.0
3. Guaranteed Yield Program .................... -133.5 -128.4 -122.8 -529.0
4. Voted Oyerrides ...... Unknown Increase 5. School District
Equalization Tax .... 16.3 20.7 26.0 24.4 87.4 6. ~1inimum Tax .......... 23.5 29.0 34.9 40.9 128.3 7. Declining Enroll-
ment Adjustment.. .. 52.7 52.4 42.5 37.7 185.3
716 / K-12 EDUCATION Items 295-318
DEPARTMENT OF EDUCATION-Continued five-Year
1977-78 1978-79 1979-80 1980-81 1981-82 Total 8. State Teachers
Retirement System .. 96.3 123.0 143.6 362.9 9. $5 Reduction in the
Basic Aid Grant ........ 6.0 6.0 5.0 5.0 22.0 10. Other a ...................... 1.8 4.6 6.5 8.6 21.5 ll. State Property Tax
Relief Subventions 15.0 6.1 15.2 21.8 58.1
Totals, Local Prop-erty Tax Change .... -$100.6 -$40.7 -$101.4 -$145.9 -$388.6
U Includes Adult Foundation Program Changes, Necessary Small High School, and County Superintendents.
Table 39 on page 717 shows the 1981-82 fiscal impact in selected districts of the school finance features contained in AB 65. C. 1978-79 Apportionments .
. In 1978-.79, state apportionments for K-12 are expected to increase by $376million (15.7 percent) over the 1977-78 level. This increase is primarily a result of (1) a foundation program increase of 9 percent, (2) a reduction in the elementary computational tax rates from $2.23 to $2.12, and a reduction in the high school computational tax rates from $1.64 to $1.52 in order to maintain the 1977-78 state's share of the foundation program for equalization aid districts, and (3) the first time implementation of the Guaranteed Yield Program.
Table 40 presents a breakdown and comparison of total K-12 apportionments from 1976-77 through 1978-79.
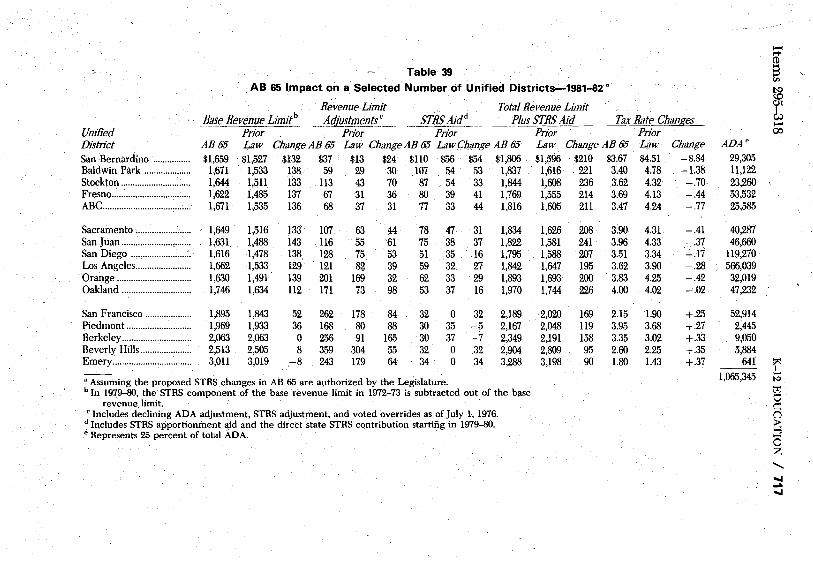
-..... CD Table 39 S
'" AB 65 Impact on a Selected Number of Unified Districts-1981..:a2 a KI (.0
Revenue Limit Total Revenue Limit ~ .Bil.5_eJJevenue Limitb ... Jltlj'!!.5tm~tt.._ __ $LRS AJ!ld ___ Plus STRS Aid Tax Rate Changes _ I-'
Unjfied Pnor Prior Pnor Prior Prior 00
District AB65 LawChangeAB 65 Law ChangeAB 65 LawCiJange AB 65 Law Change AB 65 Law Change ADA"
San Bernardino ................ $1,659 $1,527 $132 $37 $13 $24 $110$56 $54 $1,806 $1,596 $210 $3.67 $4.51 -$.84 29,305 Baldwin Park .................... 1,671 1,533 138 59 29 30 107 54 53 1,837 1,616 221 3.40 4.78 -1.38 11,122 Stockton .............................. 1,644 1,511 133 113 43 70 87 54 33 1,844 1,608 236 3.62 4.32 -.70 23,260 Fresno .................................. 1,622 1,485 137 67 31 36 80 39 41 1,769 1,555 214 3.69 4.13 -.44 53,532 ABC .............................. ~ ....... 1,671 1,535 136 68 37 31 77 33 44 1,816 1,605 211 3.47 4.24 -.77 25,585
Sacramento c ••••••••••••••••••••••• 1,649 1,516 133 107 63 44 78 47 31 1,834 1,626 208 3.90 4.31 -.41 40,287 Sanjuan .............................. 1,631 1,488 143 116 55 61 75 38 37 1,822 1,581 241 3.96 4.33 -.37 46,660 San Diego .......................... 1,616 1,478 138 128 75 53 51 35 16 1,795 1,588 207 3.51 3.34 +.17 119,270 Los Angeles ........................ 1,662 1,533 129 121 82 39 59 32 27 1,842 1,647 195 3.62 3.90 -.28 566,039 Orange ................................ 1,630 1,491 139 201 169 32 62 33 29 1,893 1,693 200 ·3.83 4.25 -.42 32,019 Oakland .............................. 1,746 1,634 112 171 73 98 53 37 16 1,970 1,744 226 4.00 4.02 -.02 47,232
San Francisco .................... 1,895 1,843 52 262 178 84 32 ° 32 2,189 2,020 169 2.15 1.90 +.25 52,914 Piedmont ............................ 1,969 1,933 36 168 80 88 30 35 -5 2,167 2,048 119 3.95 3.68 +.27 2,445 Berkeley ............................ :. 2,063 2,063 ° 256 91 165 30 37 -7 2,349 2,191 158 3.35 3.02 +.33 9,050 Beverly Hills ...................... 2,513 2,505 8 359 304 55 32 ° 32 2,904 2,809 95 2.60 2.25 +.35 5,884 Emery ................... , .............. 3,011 3,019 .-8 243 179 64 34 ° 34 3,288 3,198 90 1.80 1.43 +.37 641 ~
1,065,345 -a Assuming the proposed STRS changes in AB 65 are authorized by the Legislature. 10
bIn 1979-80, theSTRS component of the base revenue limit in 1972-73 is subtracted out of the base t'"l 0 revenue limit. ·C
C Includes declining ADA adjustment, STRS adjustment, and voted overrides as of July 1, 1976. n d Includes STRS apportionment aid and the direct state STRS contribution starting in 1979-80. ~ c Represents 25 percent" of total ADA. 0
Z ....... .... ... ....

718 I K-12 EDUCATION
DEPARTMENT OF EDUCATION-Continued
Table 40 K-12 Apportionment Estimates
1976-77 through 1978-79
Actual Estimated Elementary: 1976-77 1977-78
Basic Aid 1 ........................................................ , .... . $378,514,725 $369,552,900 Equalization Aid ................................................. . 833,031,296 891,102,500 Guaranteed Yield Program ............................. .
Subtotal ......................................................... . $1,211,546,021 $1,260,655,400 High School:
9-12 Basic Aid 1 ................................................... . $181,681,500 $184,658,000 9-12 Equalization Aid .. , ..................................... . 337,866,813 349,750,800
·9-12 Guaranteed Yield Pgm ............................ .
Subtotal ............................................................. . $519,548,313 $534,4Qi!,600 High School Adults:
Adult Basic Aid 1 ................................................. . $28,056,750 $31,516,800 Adult Equalization Aid ..................................... . 60,593,382 70,864,500
Subtotal ............................................................. . $88,650,132 $102,381,300 County School Service Fund:
Elementary Foundation Pgm .......................... . $13,660,436 $15,812,300 High School Foundation Pgm. . ...................... . 17,305,360 12,033,400
Subtotal ......................... : ................................... . $30,965,796 $27,845,700 TOTALS, FOUNDATION PROGRAM ................. . $1,850,710,262 $1,925,291,000
County School Service Fund: Direct Purpose ................................................... . $3,509,235 $3,992,300 Other Purpose ..................................................... . 16,314,904 17,176,400
Subtotal ............................................................. . $19,824,139 $20,868,700 Special Education
Sedgwick Act ....................................................... . $6,176,011 $19,000,000 Physically Handicapped 2 ..•••...•••.•...•••....•••....•••• 94,686,554 108,286,700 Mentally Retarded .. ~ .......................................... . 21,953;948 23,647,600
Special Transportation .............. : .................... . 14,531,770 16,120,000 Educationally Handicapped ............................. . 66,385,618 73,150,300 Mentally Gifted ................................................... . 15,253,272 15,072,400 Master Plan-Spec. Education ....................... . 51,843,250 58,663,850 Fund Transfer to Master Plan
Program .................................................... ; ........ . - 51 ,843,250 ...,.58,663,850
Subtotal ............................................................. . $218,987,173 $255,277,000 Regular Transportation ......................................... , 52,450,359 60,000,000 Adults in Correctional Fac .................................. . 619,805 - 800,000 County Cooperative Publications ....................... . 14,318 Hi,ooo Advance in Funds-E.C. 17325 ........................... . 55,000 Adjustments ............................................................. . -28,303,759 -24,000,000
TOTALS, PER EDUCATION CODE 41301 ....... . $2,114,357,297 $2,238,252,700 Special Apportionments and Programs:
State Teachers' Retirement System: Elementary ........................................................... . $29,947,198 $24,710,000 High School .................................. , ...................... . i5,370,543 13,833,900 SB 1641!76-Supplemental Increase ............... . 55,676,851 94,599,400
Subtotal, STRS ................................................. . $100,994,592 $133,143,300 3
Driver Training ........................................................... . 21,014,736 22,000,000
Items 295-318
Projected 1978-79
$346,408,200 1,028,186,000
126,521,800
$1,501,116,000
$176,843,000 413,573,100
17,349,500 $607,765,600
$34,572,400 86,713,800
$121,286,200
$19,161,000 14,845,000
$34,006,000 $2,264,173,800
$3,907,200 18,043,000
$21,950,200
$12,000,000 1 i3,183,800 25,074,400 17,095,000 77,586,600 14,859,500
102,165,264
-102,165,264
$259,799,300 68,000,000 1,000,000
18,000
- 24,000,000
$2,590,941,300
$19,229,600 12,825,500
125,745,600
$157,800,700 3 -
22,900,000

Items 295-318 K-12 EDUCATION / 719
Chapter 323/76, County ROP/C Hold Harmless 3,523,172 3,300,000 389,000
996,828 389,000_ Chapter 1249/77, Spec. Schs. Transp ................... ..
Subtotal, Special Apportionments ............ ,... $125,532,500 $158,832,300
$2,397,085,000
, $182,086;528 ,
$2,773,027,828 GRAND TOTAL, K-12 .............................................. $2,239,889,797
I Basic Aid in 1978-79 is $120 pursuant to Chapter 894, Statutes of 1977 (AB 65). 2 Autistic programs classified as physically handicapped starting January 1, 1978, pursuant to Chapter 1251, .
Statutes of 1977 (SB 1050). . 3 The apportionment estimates are based on the school·finance model. The model's methodology for .
estimating the STRS apportionments needs to be improved. The model's UiT6-77 estimate is $14 million higher than the actual figure of $100,994,592. Consequently, the STRS budget estimates for 1977-78 and 1978-79 are probably too high.
Potential Savings
It should be noted that the 1977-78 and 1978-79 apportionments include an additional $27 and $29 million respectively for "estimating errors", These estimating errors represent approximately 2 percent of the total K-12 apportionments. We support the concept of retaining a cushion because of the complexities of obtaining accurate. apportionment estimates, However, we believe this amount for "estimating errors" should be· identified in a separate line item.
Estimating errors can occur in either direction. Consequently, if the actual K-12 apportionments are 2 percent below the estimate, and if thy budget contains the 2 percent cushion for estimating errors, there would be a state savings of $54 million for 1977-78 and $58 million for 1978-79.
Average Daily Attendance (ADA) . . \
Table 41 shows a breakdown in total ADA that these apportionments support.
Table 41.
Second Principal Apportionment Average Daily ,Attendance in California Public Schools
Elementary . Kindergarten ........................................................ ..
Regular Classes .................................................... .. Summer School .................................................... .. County School Service Fund .............. , .............. . Total Elementary ............... , ....... , ....... , ................. .
High School Regular Classes .......... , ............. :; ........................... . Summer School ....................................... : ............. . County School Service Fund ............. , .............. ..
Total High School ...... ; ............... , .. , .. , .................... .
Subtotal K-12 ............................... : ........................ .. Adults ........................................................................... . Special Education .
Physically Handicapped .................................... .. MentaIly.Retarded ............................................... . Educationally Handicapped:............................... . Mentally Gifted (FTE basis) ............................ .. , .
D. School Finance Issues
Actual 1976-77
304,417 2,596,860
117,033 14,897
3,033,207
1,388,288 . 76,372
12,258
1,476,~18
4,510,125
225,992
59,518 31,445 47,243
184,000
Estimated 1977-78
275,554 2,547,979
119,166 15,936
2,958,635
.1,394,798 81,537
. 12,996
1,489,331 . 4,447,966
255,233
63,940 32,000 49;240
174,000
1978-79 Projected Percentage 1978-79.. Change
268,163 -2.7% 2,482,836 " - 2.6
121,068 1.6 16,724 4.9
2,888,791
1,388,415 84,798
.' 13,733 1,486,946 4,375,737
291,773
.63,110 32,000 49,270
161,000
"
-2.4
-0.5 4.0 .
. 5.6 -0.2
-1.11 14.3
-1.3
0.1 -7.5
The primary issues related to school finanCing in 1978-79 are (1) .the trailer bill for AB 65, .(2) the Serrano plaintiff writ of IIlandate, (3) the ..
720 /" K-12 EDUCATION Items 295-318
DEPARTMENT OF'EDUCATION-Continued
EgualizationProject of the Department of Education, and (4) documentation of the School Finance Model.
1. The Trailer Bill for AB 65
AB 65 contained technical problems dealing primarily with (1) the calculation of the 1977-78 state share of the foundation program for equaliza'tion districts and (2) the calculation of the 1977--78 and 1978-79 district .base revenue limits. A trailer bill is presently being prepared to resolve these problems.
2. Th~ Serrano Plaintiffs Petition for a Writ of Mandate
In December 1977, the Serrano plaintiffs filed a petition for writ of mandate with the California State Supreme Court. They contended that the current school financing system, as modified by Chapter 894, Statutes of 1977, ' (AB 65) remains unconstitutional because it fails to bring the school financing system into compliance with the judgment in Serrano II They contended that the system remains unconstitutional because it retains the following features of the prior system:
"a. It permits high wealth school districts to enact permissive overrides, which enable those districts to raise more revenue than loW' wealth' districts; with much less tax effort.
b. It includes in the calculation of the revenue limits for high wealth districts unused voter overrides, which permits those districts to retain their wealth-related spending advantages.
c. It provides for a basic aid grant of $120 per pupil to high wealth school districts, thereby preserving wealth-related spending 'disparities aIIlong districts.
d. It allows high wealth school districts to reach the foundation program mInimum expenditure per pupil with much less tax effort than required for low wealth school districts."
The Supreme Court turned down the petition in mid-January 1978. The plaintiffs now plan to file a petition with the Superior Court of Los Ange-les. ' 3. The S~hool Finance Equalization Project
The Department of Education received a $1 million federal grant in 1976 for the development of a legislative proposal for a new school finance equalization system. During the period of the grant, September 1976 through June 1978, the department proposed to use the grant to (1) establish project advisory committees, (2) develop data systems and (3) disseminate information on school financing issues. Approximately twothirds of the grant was tobe used for data systems development.
The data systems would include an integrated system of simuiation models that would have permitted previews of the impact of a ~ide variety of factors affecting equalization of school finance. A key element of the data systems development was a more comprehensive school fi-nance model. '
This system was to be developed by July 1977. As of October 1977, very little progress had been made. 'In'fact, the Department of Education in December1977 had to start developing their own separate school finance
Items 295-318 K-12 EDUCATION / 721
model in order to analyze the fiscal effects of AB 65. This second model will probably be incorporated into the school finance JIlodel of the Equalization Project. However, as of February 1978, it is evident that the project's goal of having an integrated system of simulation models will not be reached. It is even questionable if the school finance model will be completed by the project's termination date of June, 1978.
4. The. Documentation of the School Finance Model
Last year's supplemental language included a recommendation that the Department of Education prepare a document designed for the lay person, describing the data base and output from the school finance model. This documentation is extremely important. School district personnel and others interested in school finance need to know how the numbers from the school' finance model were generated, the underlying assumptions, and.how they could have input into the process if they felt that the assumptions concerning their districts were in error. As of February 1978, this documentation was not finished.
2. URBAN IMPACT AND GENERAL AID
The Legislature provided additional aid to certain districts through Chapter 323, Statutes of 1976 (SB 1641) and Chapter 894, Statutes of 1977 (AB 65). This aid, like categorical aid, is outside the district revenue limit. However, unlike' categorical aid, these funds are not targeted for any specific programs and may be spent for any purpose. The funding formula is based on indicators of district size and student population but does not take district current expenditure levels nor tax effort into consideration -for eligibility.
Two separate sections of the Education Code prescribe funding mechanisms:
(1) Over 250 districts received general aid funds totaling $7.7 million in 1976-77 through the provisions of Chapter 323. These districts, will receive a total of $7.7 million in 1977-78, $8.1 million in 1978-79 and $8.6 million in 1979-80 and thereafter.
(2) Through.the provisions of AB 65, nineteen districts, (14 of which receive general aid from the Chapter 323 program), will receive urban impact aidamountingto $64 million in 1977-78; $40.8 million in 1978-79 and $43.6 milliop in 1979-80. These allocations will cease after the 1979-80 school year.
Funds provided to each of the 19 urban districts under both programs are presented on the following page in Table 42. '
In'1977-78 general aid funding levels per child (ADA) range from $16 in San Jose to $129 in Compton. The average level for all 19 districts is $54 per ADA in 1977-78 and $37 per ADA in 1978-79. These levels can be compared to the 1977-78 foundation program increases averaging $121 per ADA.
,'·,i
Program Information Needed
We recommend that the Department of Educah'on prepare a report on . the. continued need for urban impact aid The department should submit a progress report to theJoint Legis]ah've Budget Committee by December 1, 1978, and the final report by October 1, 1979.
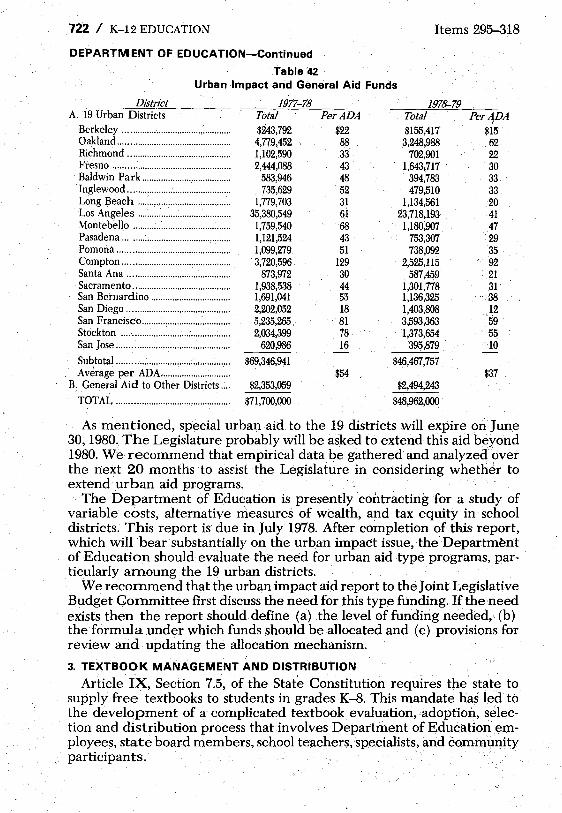
722 / K-12 EDUCATION
DEPARTMENT OF EDUCATION-Continued
Table 42
Items 295-318
Urban Impact and General Aid Funds
District A: ~ i9Urban Districts
Berkeley ............................................. . Oakland ............................................... . Richmond ........................................... . Fresno ................................................. . Baldwin Park ..................................... . Inglewood ........................................... . Long Beach ...................................... .. Los Angeles ......... : ............................. . Montebello ......................................... . Pasadena ............................................. . Pomona ............................................... . Compton ............................................. . Santa Ana ........................................... . Sacramento ......................................... . San Bernardino ................................. . San Diego ........................................... . San Francisco ..................................... . Stockton ............................................. . San Jose ............................................... .
Subtotal ........•...................................... , Average per ADA ............................. .
B. General Aid to Other Districts ... .
TOTAL ...... ; ........................................ .
1977-78 Total $243,792 4,779,452 1,102,590 2,444,088
583,946 735,629
1,779,703 35,380,549 1,759,540 1,121,524 1,099;279 3,720,596
873,972 1,938,538 1,691,041 2,202,052 5,235,265 . 2;034,399
620,986
$69,346,941
$2,353,059
$71,700,000
Per ADA $22 88 33 43 48 52 31 6i 68 43 51
129 30 44 55 18 81 78 16
$54
.1978-79 Total $155,417 3,248,988
702,901 1,643,717
394,783 479,510
1,134,561 23,718,193 1,180,907
753,307 738,092
2,525,115 587,459
1,301,778 1,136,325 1,403,808 3,593,363 1,373,654
395,879
$46,467,757
$2,494,243
$48,962,0<Xi
Per ADA f
$15 62 22 30 33 33
.20 41 47 29 35 92
. 21 31 .38 12 59 55 10
$37
As mentioned, special urban aid to the 19 districts will expire on June 30, 1980. The Legislature probably will be asked to extend this aid beyond 1980. We recommend that empirical data be gathered and analyzed" over the next 20 months to assist the Legislature in considering whether to extend' urban aid programs.
The Department of Education is presently contracting for a study of variable costs, alternative measures of wealth, and tax equity in school districts. This report is due in July 1978. After completion of this report, which will bear substantially on the urban impact issue, the Departm~nt of Education should evaluate the need for urban aid type programs, particularly amoung the 19 urban districts.
We recommend that the urban impact aid report to the Joint Legislative Budget Committee first discuss the need for this type funding. If the need exists then the report should define (a) the level offundirig needed, (b) the formula under which funds should be allocated and (c) provisions for review and· upda.ting the allocation mechanism.
3. TEXTBOOK MANAGEMENT AND DISTRIBUTION
Article IX, Section 7.5, of the State Constitution requires the stat~ to supply free textbooks to students in grades K-8. This mandate has ied to the development of a complicated textbook evaluation, adoption, selection and distribution process that involves Department of Education employees, state board members, school teachers, specialists, and comml,lnity participants.
Items 295~18 K-12 EDUCATION / 723
Until 1973, the textbook program waS supported by an annual General Fund appropriation. Chapters 929 and 1233, Statutes of 1972, made major revisions in the program by establishing an Instructional Materials Fund financed. from the General Fund. The amount allocated to the fund each year is $7 times the average daily attendance (ADA) in both public and private schools for the preceding school year. This formula is ~djusted annually for inflation and was expected to reach $9.54 per ADA in 1977-78, and result in total costs of approximately $32 million. However, Chapter 894, Statutes of 1977 (AB 65) raised the rate to $12.88 per ADA for an additional state cost of approximately $10 million ($42 million total).
Each year school districts are permitted to draw an amount based on their K-8 enrollment from the Instructional Materials Fund for the purchase of textbooks and other instructional materials. Textbooks are printed and distributed by the State Printing Plant if the demand for a particular title is great enough. Otherwise, textbooks and special instructional materials are ordered .directly from the publisher.
A. Surplus
We recommend that the current $9.8 million surplusin the Instructional Materials Fund be transferred to the Department of Education for the replacement of obsolete textbooks.
When the method of financing the state textbook program was revised in 1973, there was approximately $9.8 million worth of textbooks in the warehouse of the State Printing Office that had been printed under the old act. These textbooks had already been paid for from General Fund budget appropriations, and the sale of them thus created a surplus of $9.8 million in the Instructional Materials Fund.
The Legislature has three alternatives in disposing of this surplus: (11· return the funds to the General Fund, (2) permit the funds to be distributed to school districts under the
existing formula, or (3) utilize the funds to remedy a specific problem in the textbook
program.
Replacement of Outdated Textbooks ,
Each of these alternatives has merit. However, we believe the surplus should be used to correct a long-standing problem in the program, namely the continued use of outdated textbooks by school districts. The Department of Education reports that the use of these outdated textbooks is of concern in areas which have experienced recent revisions in content or methodology, such as Mathematics, Social Sciences, and Reading. While the $9.8 m.illion surplus would not be sufficient to update all textbooks, it could be· used to replace those that are most outdated. '
If this .alternative is adopted, the Department of Education would be directed to establish priorities for funding based on subject areas' and publication dates of textbooks in use. Other funding alternatives could be considered. For example, a formula could be developed which would require a percentage match of each state dollar based on the wealth of the participating district. This would substantially stretch the impact of the surplus funds.
724 / K-12 EDUCATION Items 295-318
DEPARTMENT OFEDUCATION....:.Continued
In order to distribute funds on this basis, we recommend that language be added to the Budget Bill which would create a special account within the Instructional Materials Fund from which the department may make this special disbursement.
B. Textbook Prices
We recommend that the Department of Education be directed to implement a price review system for textbook purchases to insure that California receives the lowest textbook prices.
Secti()n 60061 of the Education Code requires a textbook publisher to chatgeCalifornia the lowest price at which the textbook is sold anywhere in the United States. This section also stipulates that the publisher must automatically reduce the price if reductions are made anywhere else in the nation.
This law has been interpreted by the Department of Education to mean that the price of any textbook offered in the state must be the lowest price offered anywhere in the United States pursuant to contracts entered into in that year. Textbook publishers are thus not held to prices negotiated with other states in previous years and still in effect.
A recent study by the Office of the Auditor General (Report 285.2) found that the Department of Education has made little effort to monitor publisher compliance with Section 60061. The report compared the prkes paid by the Department of Education on 285 state-adopted textbooks with prices. paid for the same titles by Arkansas, Florida, Indiana, and Texas. This comparison revealed that the department paid approximately 7 per-cent rnore for textbooks than the other states. .
I)iscussion with the Department of Education' and the Auditor General staff indicates that price comparisons between states are difficult and time-consuming to prepare. There exists no universally recognized contract ,date which can be used as a basis for price comparison. States may utilize the adoption date, the bid date, the date of contract signing, or the projected delivery date. In addjtion, quoted prices mayor may not include transportation costs and sales tax. Therefore, substantiation of overcharging by publishers would be difficult to prove for prosecution purposes.
However, the Department of Education could easily begin to monitor textbook prices now so that overcharging does not occur in the future. The department CQuid request that publishers submit with their bid a list of other states which have received similar textbooks in the same period. These states could then be contacted on a randoln basis to insure compliance to the textbook law. An informal system of this nature could be impiemellted and operated by existing departmental staff.
C. :Textbook Adoption Cycle
We recommend that Budget Bill language be added to permit the Department of Education to extend temporarily the textbook adoption cycle so that the process may be streamlined and shortened .
. The textbook adoption cycle involves the following steps:. (1) Evaluation by committees of textbooks and other instructional
materials for content and legal compliance;

Items ,2f)5-31B K-12 EDUCATION / 72~·
(2) Submission of materials to the Curriculum and Supplemental Materials Commission for final review;
(3) Public hearing on all materials by the State Board of Education and final qdoption;
(4) Display of materials in centers throughout the state; (5) Ordering of materials by school districts through the Department
of Education; (6) Delivery of materials to school districts for use. Section 60200 of the Education Code, and subsequent legal interpreta
tion, makes it clear that the adoption process is to occur every two years. Under current practice, materials are adopted by the board in June and delivered to school districts 1 ~ years later in September. The Department of Education would like to move the adoption date to September and shorten the entire cycle by 4:-6 months so that materials reach the schools less thim one year after adoption by the Board.This would require a special legislative waiver of the two-year limit on the adoption process. We recommend that language be added to the Budget Bill to permit this extension.
4. FOOD. AND NUTRITION SERVICES
A. General Data
The Department of Education supervises the National School Lunch and Breakfast Program and administers the payment of federal and state funds to school districts and other eligible agencies through its Bureau of Child Nutrition Services. The purpose of these programs is to assist schools in providing nutritious meals to pupils, with. emphasis on free or reduced price meals to children from low-income families. Assistance is' also pro-
, vided ,for child care food and summer food programs. The department is involved in establishing food delivery systems in schools without .food services, helping existing programs improve food delivery systems, and ensuring that food service programs meet established nutritional require-ments. .
The Bureau of Child Nutrition Services als9 administers the StateChil~ Nutrition Program authorized by Chapter )487, Statutes Of 1974, and Chapter 1277, Statutes of 1975. Chapter 1487 provides a basic state reimbursementfor each nutritionally adequate meal served by any school district, county superintendent of schools,certain child developm~nt programs and private or parochial schools. Chapter 1277 provides an I:!-ddition~ al state subsidy for meals served to needy pupils and mandates that by July 1, 1977, all K-,J2 school districts and county superintendents of schools are to provide during each school day, one nutritionally adequate free or reduced price meal for each needy student.
Table 43 summarizes the program and indicates that there is about a 5 percent projected growth in participation in the school lunch prognffi in 1978-,.79, and a 19 percent growth in participation in the school breakfast prog,r'am.

726 / K-i2 EDUCATION
DEPARTMENT OF EDUCATION-Continued
Table 43
Items 295-318
Participation in Meals Programs in California Schools
Actual Estimated Proje{!ted 1978-79 Change 1976-77 1977-78 1978-79 Amount Percent
GENERAL STATISTICS No. of Public School Districts .... 1,045 1,044 1,044 No. of Schools:
Public .......................................... 7,045 7,045 7,045 Private ........................................ 2,814 2,814 2,814 Total ; ........................................... 9,859 9,859 9,859
Enrollment (K-12): Public .......................................... 4,235,525 4,155,685 4,070,949 -84,736 -2% Private ........................................ 433,782 430,000 429,500 -500 Total ....................................... ; .... 4,669,307 4,585,685 4,500,449 -85,236 -2
NATIONAL SCHOOL LUNCH PROGRAM PARTICIPA· TION
No. of Sponsors .............................. 1,014 1,271 1,291 20 2 No. of Schools:
Public .......................................... 6,644 7,045 7,045 Private ........................................ 223 263 273 10 4 Residential Institutioris ............ 188 208 218 10 5 Total .. : ......................................... 7,055 7,516 7,536 20 3
Enrollment of Participant Schools .................................... 3,916,409 4,148,075 4,348,075 200,000 5
Average Daily Participation: Paid .............................................. 670,622 775,972 809,760 33,788 4 Reduced Price .......................... 85,952 99,451 103,781 4,330 4 Free .............................................. 829,015 959,461 1,001,237 41,776 4 Total ............................................ 1,585,589 1,834,884 1,914,778 79,894 4
SCHOOL BREAKFAST PRO· GRAM PARTICIPATION
No. of Sponsors ....... ; ...................... 396 466 576 110 24 No. of Schools:
Public .......................................... 1,773 1,913 2,213 300 16 Private ........................................ 71 86 94 8 9 Residential Institutions' .......... 160 180 185 5 3
Total ......................... : ................... 2,004 2,179 2,492 313 14 Enrollment of Participant
Schools .................................... 1,116,271 1,345,185 1,597,857 252,672· 19 Average Daily Participation:
Paid .............................................. 32,217 38,182 45,353 7,171 19 Reduced Price .......................... 12,251 14,518 17,241 2,723 19 Free .............................................. 238,341 282,520 335,592 53,072 19
Total ............................................ 282,809 335,220 398,186 62,966 19
a Became eligible July 1, 1976.
On the following page Table 44 summarizes expenditures and funding of these p:rograms as shown in the Governor's Budget.
The table indicates substantial growth iri federal subsidies for the school breakfast program, the child care food program, and the summer food program. There is relatively moderate growth in subsidies for the school lunch program, in contrast to the rapid growth of this program in previous years.

Items 295-318 K-12 EDUCATION /727
Table 44
Food Services Programs Expenditures .and Funding
Actual Estimated Projected Change 1976-77 1977.;..78 1978-79 Amount Percent
Federal Funds: State. Operations-
Child Nutrition Act ............................ $1,201,827 $1,361,999 $1,408,889 $46,890 3.4%
Local Assistance: School Lunch:
General Assistance 38,225,000 46,379,795 49,594,435 3,214,640 6.9 Special Assistance'
to Needy Chil-dren .................. 99,215,767 119,855,803 131,562,065 11,706,262 9.8
School Breakfast.. ...... 20,885,000 25,947,233 31,943,254 5,996,021 23.1 Special Milk ................ 11,825,000 13,123,025 14,626,257 1,503,232 11.5 Child Care Food Pro-
gram .................... 6,845,847 9,416,097 11,680,317 2,264,220 24.0 Summer Food Pro-
gram .................... 13,233,437 19,125,000 22,950,000 3,825,000 20.0 Food Service Equip-
ment Assistance 3,683,417 4,000,000 4,000,000 Cash for Commodi-
ties ........................ 583,574 2,305,142 -2,305,142 '-100.0
Subtotal ...................... $194,497,042 $240,152,095 $266,356,328 $26,204,233 10.9%
Total-Federal Funds ...... $195,698,869 $241,514,094 $267,765,217 $26,251,123 10.9%
State Funds: State Operations:
Food and Nutrition Services .............. $470,502 $587,590 $659,859 . $72,269 12.3%
Child Nutrition Pro-gram:
Projects .................... 661,223 664,873 665,823 a 950 Administration ...... 141,608 159,430 165,762 a 6,332 4.0
. Subtotal .................. $1,273,333 $1,411,893 $1,491,444 $79,551 5.6% Local Assistance:
Basic Subsidy ........ $23,900,000 $29,171,714 $29,793;371 . $621,657 2.1% Needy Subsidy ....... 12,800,000 b 9,822,951 b 9,420,772 -402,179 -4.1
Subtotal .................. $36,700,000 $38,994,665 ::;$39,214,143 c $219,478 1.0%
Total-5tate Funds .......... $37,973,333 $40,406,558 $40;705,587 $299,029 1.0%
Combined Totals: State Operations .... : ..... $2,475,160 $2,773,892 $2,900,333 d $126,441 . 4.6% Local Assistance ............ 231,197,042 279,146,760 ·305,570,471 26,423,711 9.5
TOTAL ................................ $233,672,202 $281,920,652 $308,470,804 $26,550,152 9.4%
a Combined totai-$831,585, Budget Bill Item 297. . b Department of Education revised needy subsidy estimate for 1976-77 is $7,071,000. The revised 1977-78
needy suhsidy is a little under $9 million. C Budget Bill Item 316.. .. dlncludes $665,823 in Program I and $37,449 in Program III.
Included in state operations for 1978-79 is a state General Fund allowanee'of$50,OOO to fund a portion of the study required by Chapter 1003,
. Statutes of 1977 (SB 654). This statute requires the Department of Education. to review the relationships between nutrition and student achievementbehavior . and. health, and. to coordinate its review with the State Department of Health.
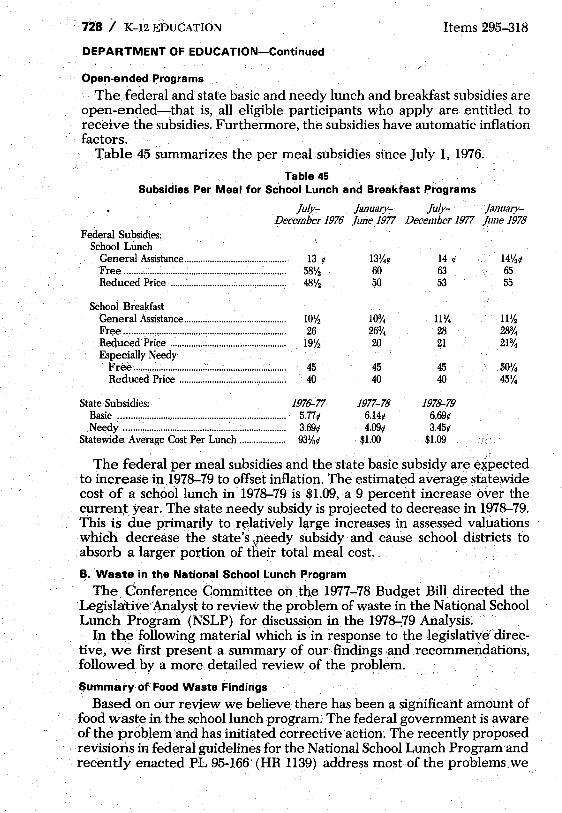
· 728 / K-12 EDUCATION Items 295-318
DEPARTMENT OF EDUCATION-Continued
Open-ended Programs
The federal and state basic and needy lunch and breakfast subsidies are open-ended-that is, all eligible participants who apply are entitled to receive the subsidies. Furthermore, the subsidies have automatic inflation factors.
Table 45 summarizes the per meal subsidies since July 1, 1976.
Table 45 Subsidies Per Meal for School Lun.ch and Breakfast Programs
July~ January- July- January-December 1976 June 1977 December 1977 June 1978
Federal Subsidies: School Lunch
General Assistance ............................................ 13 ¢
Free...................................................................... 58~ Reduced Price· .................................................. 48'/.
School Breakfast
13'I.¢ 60 50
General Assistance............................................ 10~ 100/.. Fr~e....................................................................... 26 260/.. Reduced Price .................................................. 19~ 20 Especially Needy
Free ............................... ~~................................. 45 45 Reduced Price .............................................. 40 40
State Subsidies: 1976-77 Basic ...................... ,.................................................. 5.77 ¢ Needy .. ,...................................................................3.69¢
Statewide Average Cost Per Lunch ..... .............. 93'/:.¢
1977-78 6.l~¢ 4.09¢
$1.00
14 ¢
63 53
llY. 28 21
45 40
1978-79 6,69¢ 3.45¢
$1.09 i'·'
14~¢ 65 55
ll~ 280/.. 210/..
50Y.. 45Y..
The federal per meal subsidies and the state basic subsidy are eipected to increase in 1978-79 to offset inflation. The estimated averag~st~tewide cost of a sch60llunch in 1978-79 is $1.09, a 9 percent increase over the current year. The state needy subsidy is projected to decrease in 1978-79. This is due primarily to relatively large increases in assessed valuations which decrease the state's peedy subsidy and cause school districts to absorb a larger portion of their total meal cost. "
B. Waste in the National School Lunch Program
The. Conference Committee on the 1977-78 Budget Bill directed the Legislative'Analyst to review the problem of waste in the NationalSchool Lunch Program (NSLP) for discussion in. the 197~79 Analysis.
In the following material which is in response to the legislative'directive, we first present a summary of our- findings and recommendations, followed. by a more detailed review of the problem.
Summary of Food Waste Findings
Based on our review we believe there has been a significant amount of food waste inthe school lunch program. The federal government is aware of the problem and has initiated corrective 'action. The recently proposed revisions in federal guidelines for the National School Lunch Program and recently enacted PL 95-166' (HR 1139) address most of the problems we

Items 295-318 K-12 EDUCATION / 729
encountered in our field review. We also find the State Department of Education is concerned about
food waste. The Bureau of Child Nutrition Services provides assistance to school districts to improve food preparation; serving and consumption. Last year the bureau added 22'h positions to its staff through increased federal funds authorized for administration. PL 95-166 (HR 1139) has authorized increased administrative funds which will permit the bureau to add-an additional 20 to 25 positions to its staff. We believe that with this added staff the bureau can improve its services to school districts including a more in-depth attention to the problem of food waste.
Summary of Recommendations
1. Department Mariagement .
We recommend that the Department of Education assign responsibility for the management and coordination of nutrition education and training of school distn"ct pupils and food service personnel to the Bureau of Child Nutrition Services. , . , . .
Chapter 1277, Statutes of 1975, (SB 120) authorized a 'state nutrition education and training program stating that:
" . . . projects may include, but need not be limited to, innovative ways to coordinate the school meal service program with the nutrition education program; development of community resources for purposes of nutrition education; instructional programs for teachers, parents, food service employees; and training and utilization of paraprofessionals to assist the instructional staff."
-Thirty projects are operating in 1977-78. These programs are administered within the Department of Education's School Health Program Unit of the Office of Curriculum Services with an assigned staff of one professional consultant and one-third clerical position. This small staff has successfully developed pilot nutrition' education programs with many excellent features.
One of the problems related to food waste is that there is little or no coordination between this staff and the department's Buteau of Child Nutrition Services which has responsibility for overall managem~nt of the school food services programs. There are 12 child-nutrition consultants within the Bureau of Child Nutrition Services. We b~lieve, the activities of these two groups should be coordinated. This is particularly tJ::u~ in view of the anticipated expansion of nutrition education and trainjng through the new federal program authorized by PL95-166 (HR, 113~) c;liscussed above. . .
2. Nutrition Framework and Guidelines
We recommend that the Nutrition Corflponentof the Health Instruction Framework for California Public Schools be amended, to include a content area goal related to food waste .
. We further recommend that curn"culum guidelines for thfJ nutrition education and training program authorized by Chapter 1277, Statlltes of 1975, (SB 120) be expanded to require training of both pupils and food preparation personnel in prevention of food waste in the School Lunch program.

730 / K-12 EDUCATION Items 295~18
DEPARTMENT OF EDUCATION-Continued
The Health Instruction Framework for California Public Schools was adopted by the State Board dfEducationon March 11, 1977. It includes a nutrition component which has the following content area goals:
"Studen ts will: 1. Develop an undershinding that eating patterns are dependent upon
interrelationships among physical, social, psychological, economic and cultural factors.
2. Consider alternatives in meeting nutritional needs and decide various ways to achieve good nutrition within this eating pattern.
3. Develop eating patterns which contribute to wellness." There is no specific recognition of the problem of food waste in the
Health Instruction framework. We believe a content area goal should be added to "develop eating patterns which minimIze food waste."
In addition, current curriculum guidelines for the Chapter 1277, Statutesof 1977 (SB 120) program have minimal reference to food waste. We believe the practical aspects of food waste should be given more emphasis in this curriculum with instruction correlated with food preparation and serving.
3. Unmet Need for Food Service Equipment
We recommend that the Department of Education submit to the legislative fiscal subcommittees by April 10, 1978, a report outlining the unmet need for food service equipment in schools which lack adequate prepara-tion and serving equipment. .. .
The USDA provides "food service equipment assistance" funds on a 75 percent federal/25 percent local matching basis to enable schools t<? acquire food preparation and serving equipment which they lack. The State Department of Education advises that it currently has received applications for funding from school districts . aggregating nearly $7 million. However, the department estimates that federal equipment assistance funds for 1977-78 will amount to only $4 million.
This apparent funding deficiency may be preventing some schools from developing adequate food preparation and serVing capability.
The Departmen:tof Education should provide the legislative fiscal subcommittees with an analysis which projects the unmet need for such equipment over the next several yeats. Thy analysis should compare the unmet need with district capabilities and efforts through local resources to adequately ~quip their schools. The report should indicate the extent to which the lack of such equipment may be inhibiting the preparation and serving of palatable meals to students and thereby causing food waste.
General Discussion-Reasons for Waste
Food waste occurs both (a) through the preparation of excess food which is not consumed and (b) through plate waste. Reasons for waste in the preparation of food include uncertainty as to the number of meals which will be requested, inadequate training of food preparation personnel, and inadequate food preparation facilities and .equipment. School

Items 295-318 K-12 EDUCATION / 731
lunches are offered to all K-12 pupils, some of whom pay a fixed price for the meal while others qualify for a free or reduced price meal. The food preparation staff must estimate in advance the number 'of meals which. will be consumed and they sometimes fail in this task.
Reasons for plate waste included in a Georgetown University School of Medicine report, "Studies in School Lunch Waste", June 1976, were:
Food 1. Unfamiliarity of food offered for consumptiorl. 2. Choice, price and preparation. 3. Foods returned due to health status of individual children. 4. Poor education and nutritional ignorance. 5. Portion sizes too large or too small. 6. Differences in nutritional requirements. Logistics
1. Unnecessary waiting in line. 2. Eating period too short. 3. Generally unpleasant atmosphere. 4. Lunchroom too noisy. . 5. Children feel the food is being shoved at them simply to get them
out of the way. 6. Lunch area remains dirty throughout the day. 7. No specific eating area. 8. Seating arrangement provides no choice. . 9. Problems of class preference and peer group pressures.
16. Denial of lunch as social experience.
Field Revievv .
We have discussed the problem of food waste with federal and state personnel involved with administration of the program and with school district food service directors. We have also observed food preparation, serving and consumption in several elementary, junior high and high schools.
A. Problems. . Some school district food service directors indicated that the USDA surplus commodities program sJ;lOuld be improved. They complained about the (1) short lead time to review av~ilable inventories of surplus commodities, (2) type of surplus commodities made available (prunes, cranberry sauce, peanut oil, etc.) and (3) form in which some commodities are provided which necessitates additional processing by the school districts (whole frozen turkeys, certain types of flmir,'etc.).
So,me directors complained about the lack of adequate food preparation and serving equipment to offer nutritious foods in a palatable form.
Several believe that school districts should receive more encourage,ment and guidance to establish higher educational standards for food service preparation personnel through the development of i.nstructional coufsesat community colleges.
Most directors indicated there should be more flexibility in the Type A lunch requirement which specifies that certain minimum quantities and nu.tritional values must be met. They believe varying quantities should be
, allowed for different age level pupils.

732 / K-12 EDUCATION Items 295--318
DEPARTMENT OF EDUCATION-Continued
B. . Potential Improvements. Plate waste appeared to be less prevalent in the high schools than in the elementary grades. This is attributed to the wider variety of meal offerings in high schools including hamburger / milkshake type meals.
Where the student has a choice of what to eat, he or she is more likely to consume all of the meal. One school district we visited recognized this problem by offering two optional entrees to all elementary grade level pupils. Another school district we visited is doing the same thing at selected schools on a pilot basis.
All school district directors we interviewed believe that a coordinated nutrition education program for· both school pupils and food service preparation personnel would be of benefit in improving the nutrition of school pupils and in eliminating food waste. Some directors are concerned that there is a lack of coordination between the activities of the State Department of Education nutripon education staff which is. within the School Health Program Unit of the Office of Curriculum Services and the food services management staff in the Bureau of Child Nutrition Services in providing information and guidance to school districts concerning consumption of nutritious foods.
Federal Actions Concerning Food Waste
A. GAO Investigation. A Comptroller General (GAO) report to the Congress dated July 26,1977, "The National School Lunch Program-Is It Working?" found several problems with the program which have a direct relationship to food waste. First, the report criticizes the USDA requirement that a Type A specification lunch must be served which is composed of:
"One-half pint of fluid milk. Two onces (edible portion) oflean meat, poultry, or fish; an equivalent quantity of an alternate such as cheese, cooked dry beans or peas or peanut butter, or an equivalent combination of any of these. A three-fourths cup serving of two or more vegetables or fruits (full strength fruit or vegetable juices may be counted as part of this require-ment). J
One slice of whole grain or enriched bread, or an acceptable equiva-lent." Ii .
The <1A:dreport found that the Type A lunch is often presented in a form which! discourages student participation and contributes to food waste.
By modifying the specification to require only that a school lunch provide at least one-.third of a participant's recommended dietary allowance (RDA), food preparation personnel could provide a much wider variety of lunch styles. The report suggested that an alternative meal s.tandard which would provide more flexibility in the content and in portion sizes for different aged children might improve the program's nutritional impact, increase student participation and decrease food waste.
Second, the report questions the effectiveness of the USDA's commod-
Items 295-318 ~-12 EDUCATION / 733
ity distribution program. "Current legislation mandates a guaranteed level of commodity assistance which, except in special circumstances, is provided in the form of foods acquired under USDA price stabilization and surplus removal actions. In essence, a sizeable share of NSLP foods are provided without regard to the menu planner's desir~s. Many school food service directors believe that USDA's commodity distributions provide high quality foods at substantial cost savings which, by keeping meal prices low, encourage higher levels of student participation. There are, however, many complaints that administrative problems in the timing and quantity of commodity deliveries interfere with menu planning and student acceptance of the NSLPlunch."
B Recent Modifications. As a result of the GAO report and USDA agreement on a need to improve the National School Lunch Program, the Food and Nutrition Service, USDA, has proposed modifications to the school lunch program (Federal Register 9/9/77) which would (1) amend the Type A meal pattern to specify minimum quantities for various age groups, (2) provide for student involvement in planning menus and in improving the food service environment, and (3) investigate the adoption of a nutrition standard approach to menu planning rather than fixed quantities of specified types of foods.
The revised regulations are to be field tested with a final review in May, 1978. California has been selected to participate in· these field tests.
As already noted, Public Law95-166 (HR 1139) modified the National School Lunch Program. The IIlostsignificant revisions which should have an effect on food waste· are:
1. Nutrition Education and Training Program-the act establishes a nutrition education and training program based on the finding that: "(a) the proper nutrition of the Nation's children is a matter of
highest I>riority; .. . (b) the lack of understanding of the principles of good nutrition and
their relationship to health can contribute to a child's rejection of highly nutritious foods and consequent plate wastEdn school food service operations;
(c) many school food service personnel have not had adequate training in food service management skills and principles, and many teachers and school food service operators have not had. adequate training in the fundamentals of nutrition or how to convey this information so as to motivate children to· pracftice sound eating habits;
(d) parents exert a significant influence on children in the development of nutritional habits and lack of nutritional knowledge on thepart of parents can have detrimental effects on children's nutritional development; and. . . . .
: (e) there is a need to create opportunities for children to learn about the importance of the principles of good Ilutrition in their daily
··lives and how these principles are applied in' the school cafete-. . " . na.
:The program is funded in the federal fiscal year beginning October 1,

734 / K-12 EDUCATION Items 295-318
DEPARTMENT OF EDUCATION-Continued
1977 at 50 cents for each child enrolled in school or in institutions within the state. California's grant is estimated to be $2.2 million. Up to 15 percent of this grant can be used for state administration of the program provided the state provides equal (50 percent) matching funds.
2. Commodity Distribution Program-the act establishes procedures which will: "(a) ensure that the views of local school districts and private non
profit schools with respect to the type of commodity assistance needed in schools are fully and accurately reflected in reports to the Secretary by the state with respect to state commodity preferences and that such views are considered by the Secretary in the purchase and distribution of commodities and by the state in the allocation of such commodities among schools with-in the states; .
(b) solidt the views of states with respect to the acceptability of commodities;
(c) ensure that the timing of commodity deliveries to states is consistent with state school year calendars and that such deliveries occur with sufficient advance notice;
(d) provide for systematic review of the costs and benefits ofproviding commodities of the kind and quantity that are suitable to the needs of local school districts and private nonprofit schools; and
(e) make available technical assistance on the use of commodities available under this Act and the Child Nutrition Act of 1966."
The act also permits schools to "refuse to accept delivery of not more than 20 percent of the total value of agricultural commodities and other foods tendered to it in any school year; and if a school so refuses, that school may receive, in lieu of the refused commodities, other commodities to the extent that other commodities are available to the st~~e during t4at year."
3. Acceptance of Offered Foods~the act exten.d~ to students in junior high schools and middle schools the authorization already granted to senior high school students to r~fuse foods they do not intend to consume. Any such refusal is not to effect the full charge to the student or the amount of federal subsidy for the meal.
4. Sale of Competitive Foods-the act limits the sale of competitive foods during the lunch period to those approved by the Secretary of Agriculture.
State Review of Food Waste
The Department of Finance issued a report "A Review of Food Waste and Information Exchange in the School Lunch Program" in March 1977. The report found that "While the waste oHood in any amount is. not to be viewed lightly, it does not appear to be. beyond reasonable limits considering the djfficulty of predicting the number of meals each kitchen must serve each day."
The report also .~oncluded that "the existing information exchange sys-
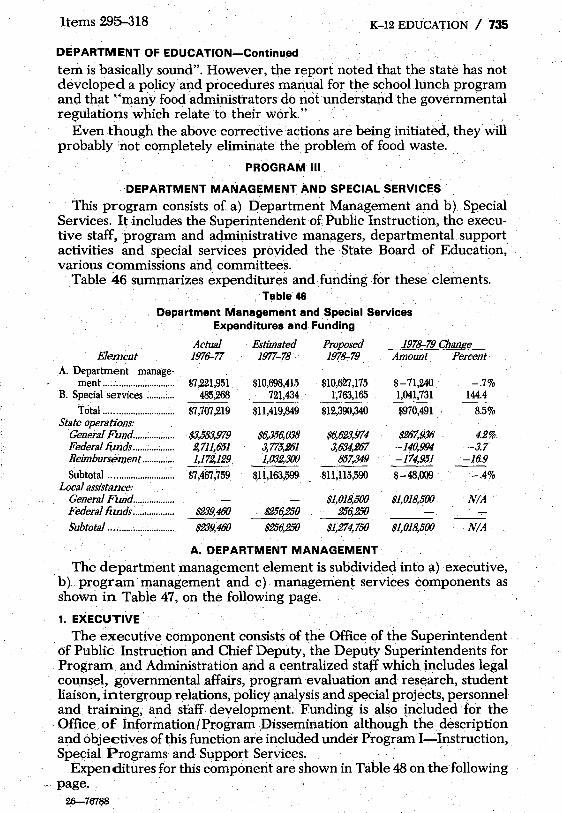
Items 295-318 K-12 EDUCATION / 735
DEPARTMENT OF EDUCATION-Continued
te~ is basically sound". However, the report noted that the state has not developed .a policy and procedures manual for the school lunch program and that ··many food administrators do not understand the governmental regulations which relate to their work."
Even though the above corrective actions are being initiated, theywiil probably not . completely eliminate the problem of food waste.
PROGRAM III
DEPARTMENT MANAGEMENT AND SPECIAL SERVICES
This program consists of a) Department Management and b) Special Services. Itincludes the Superintendent of Public Instruction, the executive staff, program and administrative managers, departmental support activities and special services provided the State Board of Education, various commissions and committees. .
Table 46 summarizes expenditures and funding for these elements. Table 46
Department Management and Special Services Expenditures and Funding
Actual Estimated Proposed 1978-,.79 Change Element 1976-77 1977-78 1978-,.79 Amount Percent
A. Department manage-ment ............................. . $7,221,951 $10,698,415 $10,627,175 $-71,240 -.7%
B. Special services ........ ; .. . 485,268 721,434 1,763,165 1,041,731 144.4 Total ............................. . $7,707,219 $11,419,849 $12,390,340 $970,491 ' 8.5%
State operations: General Fund ............... : .. $3,583,979 $6,356,038 $6,623,974 $267,936 4.2% Federal Funds ................. . 2,711,651 3,775,261 3,634,267 -140,994 -3.7 Reimbursement ............. . 1,172,129 1,032,3(}() 857,349 -174,951 -16.9
Subtotal ........................... . $7,467,759 $11,163,599 $11,115,590 $"":48,009 -.4% Local assistance:
General Fund ................. . $1,018,5(}() $1,018,500 N/A Federal Funds ....... ; ......... . $239,160 $256,250 256,250
Subtotal ........................... . $239,460 $256,250 $1,274,750 $1,018,5(}() N/A
A. DEPARTMENT MANAGEMENT
The department management element is subdivided into a) executive, b). program management and c) management services components as shown in Table 47, on the following page. .
1. EXECUTIVE·
The executive component consists of the Office of the Superintendent of Public Instruction and Chief Deputy, the Deputy Superintendents for Program and Administration and a centralized staff which includes legal counsel, governmental affairs, program evaluation and research, student liaison, intergroup relations, policy analysis and special projects, personnel and training, and staff development. Funding is also included for the Office~ of Information/Program Dissemination although the description and objectives of this function are included under Program I-Instruction, Special Programs and Support Services. .
Expenditures for this component are shown in Table 48 on the following page.
26-76788
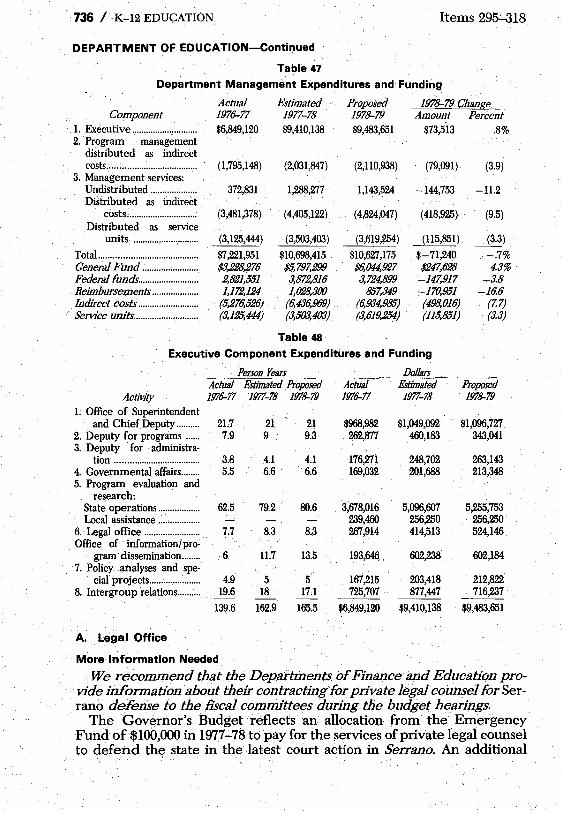
736 / K-12 EDUCATION
DEPARTMENT OF EDUCATION-Continued
Table 47
Items 295~18
Department Management Expenditures and Funding
Actual Estimated Proposed 1978-79 Change Component 1976-77 1977-78 1978-79 Amount Percent
1. Executive ............................ $6,849,120 $9,410,138 $9,483,651 $73,513 .8% 2. Program management
distributed as indirect costs ...................................... (1,795,148) (2,031,847) (2,110,938) (79,091) (3.9)
3. Management services: Undistributed .................... 372,831 1,288,277 1,143,524 -144,753 -11.2 Distributed as indirect
costs: ............................. (3,481,378) (4,405,122) (4,824,047) (418,925) (9.5) Distributed as service
units ............................ (3,125,444) (3,503,403) (3,619,254) (115,851) ~) Total .......................................... $7,221,951 $10,698,415 $10,627,175 $-71,240 -.7% General Fund ........................ $3,228,276 $5,797,299 $6,044,927 $247,628 4.3% Federal funds .......................... 2,821,551 3,872,816 3,724,899 -147,917 -3.8 Reimbursements .................... 1,172,124 1,028,3{}(} 857,349 -170,951 -16.6 Indirect costs .......................... . (5,276,526) (6,436,969) (6,934,985) (498,016) (7.7) Service units ............................ (3,125,444) (3,503,403) (3,619,254) (115,851) (3.3)
Table 48
Executive Component Expenditures and Funding
Person Years Dollars Actual Estimated Proposed Actual Estimated Proposed
Activity 1976-77 1977-78 1978-79 1976-77 1977-78 1978-79 L Office of Superintendent
and Chief Deputy .......... 21.7 21 21 $968,982 $1,049,092 $1,096,727 2. Deputy for programs ...... 7.9 9 9.3 262,877 460,183 343,041 3. Deputy for administra-
tion .................................... .3.8 4.1 4.1 176,271 248,702 263,143 4. Governmental affairs ........ 5.5 6.6 6.6 169,032 201,688 213,348 5. Program evaluation and
research: State operations .................. 62.5 79.2 80.6 3,678,016 5,096,607 5,255,753 Local assistance .................. 239,460 256,250 256,250
6. Legal office ........................ 7.7 8.3 8.3 267,914 414,513 524,146 Office of information! pro-
gram' dissemination ........ 6 11.7 13.5 193,646 . 602,238 602,184 7. Policy .analyses and spe-
cial projects ...................... 4.9 5 5 167,215 203,418 212,822 8. Intergroup relations .......... 19.6 18 17.1 725,707 .. 877,447 716,237
-139.6 162.9 165.5 $6,849,120 $9,410,138 $9,483,651
A. Legal Office
More Information Needed
We recommend that the Departments of Finance and Education provide inFormation about their contracting for private legal counsel for Serrano deFense to the fiscal committees during the budget hearings.
The Governor's Budget reflects an allocation from the Emergency Fund of $100,000 in 1977-78 to pay for the services of private legal counsel to defend the state in the latest court action in Serrano. An additional

Items 295-318 K-12 EDUCATION / 737
$200,000 is in the budget for this purpose in 1978-79. A contract was awarded in January 1978, with a local Sacramento law firm. This firm will represent the state in initial defense proceedings. [A discussion of the specifics of the latest changes sought by the plaintiffs is, presented in Program II, Administrative and Support Services (page 720) .]
The Governor's Budget is' not specific on why and how private legal counsel was sought for the case at this time. The Attorney General's Office was involved in the defense proceedings in prior court actions in Serrano. We understand that the Attorney General's Office is still involved in the issue of attorney fee payments for Serrano. We believe that the Departments of Finance and Education should provide the fiscal committees with the following information during the budget hearings: (a) why was private contracting necessary, (b) how many contracts will.be made, (c) how was the award made, and (d) what justification was there for' expenditures from the Emergency Fund for this purpose?
B. Office of Program Evaluation and Research
The Office of Program Evaluation and Research (OPER) is the Department of Education's centralized evaluation unit. Responsibilities of the office include (a) program evaluafion, (b) the Statewide Testing program,. (c) other evaluation activities related to such areas as student proficiency testing and improvement of local education agency evaluation capability and (d) the department's management information center. Funding of the office is summarized in Table 49.
Table 49 Funding of Office of Program Evaluation and Research
Actual Estimated Proposed Change 1976-77 1977-78 1971J..79 Amount Percent
State Operations ..................$3,678,016 $5,096,607 $5,255,753 '$159,146 3.1 % Local Assistance .................. 239,460 256,250 256,250
TOTAL .............................. $3,917,476 $5,352,857 $5,512,003 $159,146 3.0%'
'This includes reimbursable expenditures for the .management information system of approximately $485,000 and for the California High School Proficiency Examination of approximately' $510,000.
Independent Evaluations ,
Ghapter 894, Statutes of 1977, (AB65) appropriated additional funds to the department to contract for independent evaluations. During the budget year, these funds are $250,000 for the School Improvement Program and $250,000 for the Master Plan for Special Education. This brings the total proposed evaluation budget fOf,1978-79 to slightly over $6 million.
Budget Reduction
We recommend that (a) the Department of Education discontinue internal evaluations of the School Improvement Program and the Master Plan for Special Education and (b) the department's evaluation budget be reduced by $233, 737 (Item 295) to eliminate the additional funds budgeted for internal evaluations of these two programs.
Chapters 894 and 1247, Statutes of 1977, require the department to (a)
738 / K-12 EDUCATION Items 295-318
DEPARTMENT OF EDUCATION-Continued
report annually on the effectiveness of the School Improvement Program (SIP) and the Master Plan for Special Education and (b) contract for independent evaluations of these programs. Neither act mandates that the department conduct an internal evaluation of these programs. The statu- . tory requirement for an annual department report could be fulfilled using the independent contractor's evaluation.
This procedure has a number of advantages. It could eliminate problems related to (a) the testing and reporting demands on local educational agencies associated with duplicative evaluations, and (b) the timeliness of evaluation reports.
We believe that it would be difficult for the department to conduct internal evaluations and, at the same time, to manage independent evaluations effectively. Management tasks include (a) issuing Requests for Proposals (RFP) and selecting contractors for the studies, (b) monitoring evaluation activities to ensure their responsiveness to policy concerns and to the informational needs of program managers within the department, (c) assisting independent evaluators in establishing working relationships with schools and districts and in collecting data in ways which are neither burdensome to schools nor interfere with local priorities, and (d) reviewing and commenting on all evaluation reports in a timely manner.
In view of the large appropriations (a total of $1 million each over a five-year period) for these two independent evaluations, we believe the department's evaluation priority for SIP and the Master Plan should be to ensure the effective management and utilization of them.
The department performed ECE (now K-6 SIP) arid Master Plan evaluations in 1976-77 for approximately $230,000. The Governor's Budget for 1977-78 and 197~79 carries forward $231,989 to support those activities and also provides for an additional (a) $233,737 for expansion of the activities and (b) an additional $74,963 to monitor new independent evaluations (a total of $540,689). We believe that expansion of evaluation activities for these two programs should not be funded. We, therefore, recommend that this item be reduced for a General Fund savings of $233,737.
This allows for (a) the monitoring and (b) the same level of evaluation activity as occurred in 1977-78. The resources originally associated with the ECE and Master Plan evaluations would continue to be available to enable the department (a) to assist local schools and districts in fulfilling their evaluations responsibilities under SIP, (b) .to establish program evaluation guidelines and (c) to assist in the performance of evaluation activities related to program expansion funding.
The Statewide Testing Program
We recoll1mend that by September 1, 1978, the Department of Education report to the Joint Legislative Budget Committee concerning alternative Statewide Testing Program procedures for (a) dealing with non-English-speaking students, (b) providing results to schools which diEferentiatebetween continuously enrolled and transient students and (c) reporting statewide rankings to schools and districts. . .,
The Statewide Testing Program is the primary method for monitoring the overall effectiveness of California's elementary and secondary educa-

Items 295-318 K~12 EDUCATION / 139
tional system. It presently tests readiIlg achievement of students in grades 2 and 3 and reading, language and mathematics achievement in grades 6 and 12. Total state and federal funding for the program is proposed at a level of over $1.2 million during 1978-79.
Three aspects of the testing program warrant review. First, all students in the state, }Vith the exception of certain handicapped pupils, are required by statute to be included in the statewide testing program. However, the statewide tests are in English and are not appropriate instruments for non-English-speaking pupils. The department has attempted to deal with this problem by giving non-English"speaking students a "chance" score of25 percent on the tests. This procedure can lead to a lowering of indiVidual schools' scores simply as a result of an increase in the number of these students.
Second, the testing program is not designed to provide separate scores for students who have been enrolled in a school continuously and for "transient" students who have entered recently. The consequence is that iUs generally not possible for schools and districts to determine the extent to which changes in performance 'are attributable to the instructional program versus changes in the student body.
Third, the current method of reporting statewide rankings to schools and districts has led to difficulties in interpretation. For example, the
. procedure is such that a school or district may improve in performance from one year to the next but nevertheless be reported to have declined relative to average statewide changes. Although the department issued supplemental materials during 1976-77 to facilitate interpretation, several features of the statewide rankings nevertheless have created misunderstandings about performance among individual schools and districts.
Review is needed to determine if alternative procedures can be developed to improve the utility of the testing program as a tool for both statewide monitoring of student achievement and local program improvement.
C. Office of Information/Program Dissemination
Reduction in School Crime and Violence
We recommend that the Department of Eduf}ation disseminate information to schools and districts about projects aimed at reducing school crime and violence funded by the Office of Criminal Justice Planning.
The'Budget Act of 1977 supplemental language recommended that a) the Department of Education apply to the state Office of Criminal Justice Planning (OCJP) for federal funds in order to develop innovative projects for reducing school crime and violence, and b) that the office fund projects designed to reduce crime and violence in the public schools. OCJP provided approximately $2.2 million directly to school districts and various community agencies for 18 projects. (Due to poor communication, the. department· did not apply for a grant.)
Projects funded include detailed information concerning goals and objectives and project methodology and contain an evaluation component. This information' could be useful to other schools as they attempt to deal with school crime and violence. Hence, inforI?ation about these projects
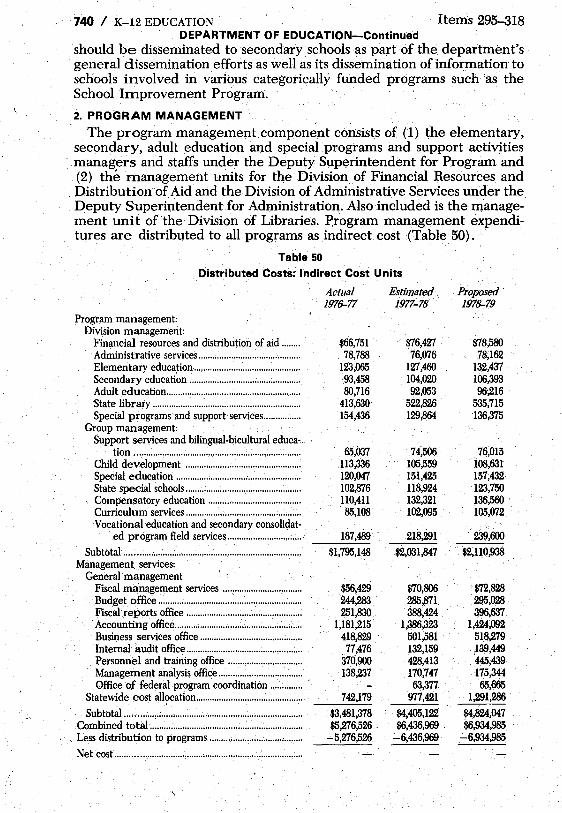
740 / K-12 EDUCATION Items 295-318 DEPARTMENT OF EDUCATION-Continued
should be disseminated to secondary schools as part of the department's general dissemination efforts as well as its dissemination of information to schools involved in various categorically funded programs such 'as the School Improvement Program.
2. PROGRAM MANAGEMENT
The program management component consists of (1) the elementary, secondary, adult education and special programs and support activities managers and staffs under the Deputy Superintendent for Program and (2) the management units for the Division of Financial Resources and
. Distributionof,Aid and the Division of Administrative Services under the Deputy Superintendent for Administration. Also included is the management unit of the Division of Libraries. Program managementexpendi~ tures are distributed to all programs as indirect cost (Table 50) .
. Table 50
DistributedCosts~ Indirect Cost Units
Actual Estimated 1976-77 1977-78
Program management: Division management:
Financial resources and distribution of aid ...... .. $66,751 $76,427 Administrative services ........................................... . 78,788 76,fJ16 Elementary education ............................................ .. 123,065 127,460 Secondary education ................................................ . 93,458 104,020 Adult education ........................................................ .. 80,716 92,053 State library ............................................................... . 413,630 '522,826 Special programs and support services .............. .. 154,436 129,864
Group management: Support services and bilingual-bicultural educa·.
tion ...................................................................... .. 65,037 7{506 Child development ................................................ .. 113,336 105,559 Special education .............................. , ...................... . 120,047 151,425 State special schools ................................................. . 102,876 118,924 Compensatory education ....... " .............................. . 110,411 132,321 Curriculum services ............................ ; .... : ............... . 85,108 102,095 Vocational education and secondary consolidat·
ed program field services .............................. .. 187,489 218,291
Subtotal ........... , ... : .... : ..................................................... .. $1,795,148 $2,031,847 Management services:
General management Fiscal management services ................................. . Budget office ................................ : ............................ . FiscaI' reports office ................................................ ..
$56,429 $70,806 244,283 285,871. 251,830 388,424
Accounting office ..................................................... . 1,181;215 1,386,323 Business services office .......................................... .. 418,829 501,581 Internal audit office ................................................. . 77,476 132,159
.' Personnel and training office .............................. .. 370,900 428,413 Management analysis office ........... , ....................... . 138;237 170,747 Office of federal program coordination .............. . 63,377
Statewide cost allocation ............................................. . 742,179 977,421
.Subtotal ............ , ............................................................. .. $3,481,378 $4,405,122 Combined total ......................................... : ....................... . $5;276,526 $6,436,969 . Less distribution to programs ............... " ...................... . -'-5;276,526 -6;436,969
. Net cost .............................................................................. ..
Proposed 1978-79
$78,580 78,162
132,437 106,393 96;216
535,715 136,375
76,015 108,631 157,432 123,750 136,560 . 105,072
239,600
$2,110,938
.$72,828 295,028 396,637
1,424,092 518;279 139,449 445,439 175,344 65,665
1,291,286
$4,824,047 $6,934,985
-6,934,985
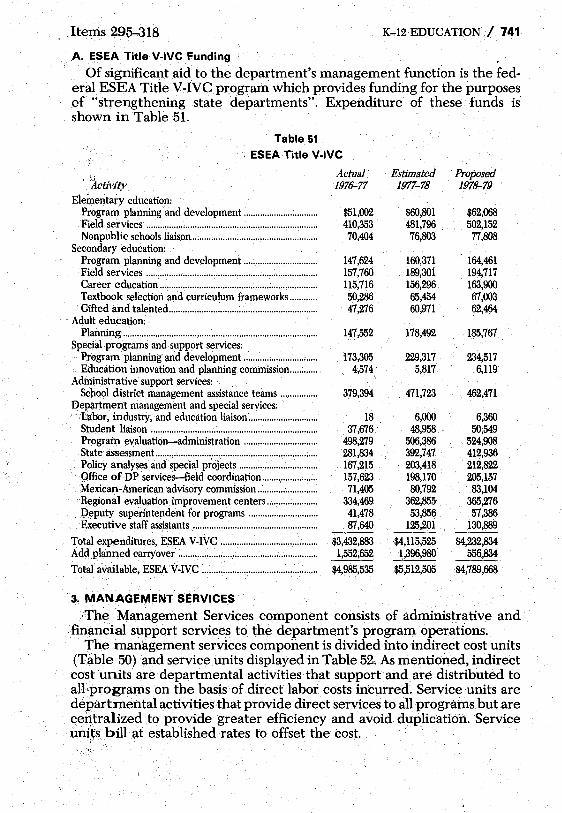
Items 295-318 K-12 EDUCATION / 741
,A. ESEA' Title V-IVC Funding
Of significant aid to the department's management function is the federal ESEA Title VeIVe program which provides funding for the purposes of "strengthening state departments". Expenditure of these funds is shown inTable 51.
Table 51 ESEA Title V-IVC
Elementary education: Program planning and development .............................. .. Field services ""."""""."."".""""."."""""""."" ... "." .. """." Nonpublic schools liaison """"".".".""".""" ... """"."""."".
Secondary education: Program planning and development .............................. .. Field services """""""."."".""""."""""""""."""""".""".". Career education ................................................................... . Textbook selection and curriculum frameworks .......... .. Gifted and talented ............................. : ................................ ..
Adult education: Planning ................................................................................... .
Special programs and support services: Pregram planning and development .............................. ..
. Education innovation and planning commission .......... .. Administrative support services: .
School district management assistance teams .............. .. Department management and special services:
'Labor, industry, and education liaison ................... : ........ .. Student liaison .................... : .................................................. . Program evaluation-administration ............................... . State assessment ..................................................................... . Policy analyses and special projects ................................ .. Office of DP services-field coordination ................. ; .... .. Mexican-American 'advisory commission .: ...................... .. Regional evaluation improvement centers .................... .. Deputy superintendent for programs ............................ ..
. Executive staff assistants ................................. ,' .................. ..
Total expenditures, ESEA V-lVC ......................................... . Add .planned carryover : ........................................................... ..
Total available, ESEA V-lVC ............... ; ................................ ..
3, MANAGEMENT SERVICES
Actual' 1976-77
$51,002 410,353 70,404
147,624 157,760 115,716 50,286 47,276
147,552
173,305 4,574
\
379,394
18 37,676
498,279 281,834 167,215 157,623 71,405
334,469 41,478 87,640
$3,432,883 1,552,652
$4,985,535
Estimated 1977-78
$60,801 481,796 76,803
160,371 189,30i 156,296 65,454 60,971
178,492
229,317 5,817
471,723
6,000 . 48,958 506,386 392,747 203,418 198,170 80,792
362,855 53,856
125,201
$4,115,525 1,396,980
$5,512,505
Proposed 1978-79
$62,068 502,152 77,808
164,461 194,717 163,900 67,003 62,464
185,767
234,517 6,119
462,471
6,360 50,549
524,908 412,936 212,822 205,157 83,104
365,276 57,386
130,889
$4,232,834 556,834
$4,789,668
The Management Services component consists of administrative and financial support services to the department's program operations.
The management services component is divided into indirect cost units (Table 50) and service units displayed in Table 52. As mentioned, indirect cost units are departmental activities that support and are distributed to all'programs an the basis of direct labor costs incurred. Service units are departmental activities that provide direct services to all progratns but are centralized to provide greater efficiency and avoid duplication. Service units bill at established rates to offset the cost. .

742 / K-12 EDUCATION
DEPARTMENT OF EDUCATION-Continued
Table 52
Distributed Costs: Service Units
Unit Publications services ................................................. . Publications distribution ........................................... . CDS flle,public and private school directories .. Copyright services ..................................................... . Media services ............................................................. . EDP management services ..................................... . Legal services ............................................................. . Duplicating services ................................................... . Word processing center ........................................... . Management .information center ........................... . Consolidated application and resources manage·
ment ....................................................................... . Systems and program supporL. .............................. .
Actual Estimated 1976-77 1977-78
$445,366 $576,580 214,521 246,010 92,091 88,490 14,396 22,577
202,255 247,224 81,364 99,371 18,361 32,255
582,041 519,434 169,777 214,540 443,171 . 440,214
635,138 226,963
738,117 278,591
Totals, service unit costs ............................................ $3,125,444 $3,503,403 -3,503,403 Less user charges ........................................................ -3,125,444
Net cost ......................................................................... .
A. Fiscal Management SYstem
Items 295-318
ProposecI 1978-79
$575,374 253,265 91,809 23,279
260,088 103,202 33,944
537;245 221,204 466,869
765,940 287;035
$3,619,254 -3,619,254
We recommend that the Department of Education submit a report to the fiscal subcommittees by April 10, 1978, summarizing the departments new fiscal management system and providing a comparison of the new and old organizational structures affected by the new system.. ",
During 1976-77, the Department of Education initiated a modifiC!a.tion of its fiscal system. The new system is to "have written procedures implementing fiscal requirements of federal and state law and regulations; one official source of financial data (fiscal data base); central accounting of LEA applications, allocations, expenditures, and audit reconciliation; centralized responsibility for payment of aid distribution to LEA's; fiscal year end procedures providing feedback from LEA's indicating fund source expenditures and status."
The development of the new system has extended into 1977-78 and is to be implemented July 1, 1978. The department advises that there will be a substantial reorganization in connection with the new system but(that it will not require any additional positions. The new organizationalstructure is not included in the Governor's Budget. We believe that the department should provide the fiscal subcommittees with the new organization~: structure indicating departmental activities involved and numbers and desci-iption of positions to be transferred~ ,
B. Paperwork
We recommend that the Department of Education submit a report to the Joint Legislative Budget Committee by October 1, 1978, regarding its successin.meeting the objectives of the Data Acquisition 'and Forms Con-trol Project. ,., '
In July 1 ~76, the Educational Management and Evaluation Commission reported to the State Board of Education that it had reviewed the department's data collection procedures and had found that the volume of information requested by- the department and the method of collection was resulting in a diversion of school staff time away from classroom activities.

Items 295-318 K-12 EDUCATION / 743
To analyze and improve the Department of Education's data control procedures, the department appointed a data acquisition and forms control manager. Objectives were set up and policies adopted by the department to. (a) establish department procedures regarding data collection, management, and use; (b) coordinate department data collection activities;.( c) review existing legislation to modify or eliminate the current statutory and regulatory requirements; (d) establish a departmental Data Acquisition Review Committee; and (e) create an advisory committee composed of local agency representatives. The department's primary long-range objectiveisto reduce the reporting burden on local public and private agencies.
Subsequently,the department established policies governing its data collection and form control activities. It has begun quarterly publication of a new 'document, the Data Acquisition Calendar, which lists inform ationabout every form to be submitted by local districts. An ongoing intradepartmental committee on data acquisition and a review panel composed of persons from local public and private agencies have been created. The department also plans to review existing legislation and recommend modification or elimination of current statutory or regulatory requests for unnecessary information.
The data acquisition and forms control project was established for 18 months. Because it will terminate in June of this year, we believe it is appropriate for the department to assess the project outcomes and report its findings to the Legislature. This report should include the department's procedure for review of this matter beyond June 30, 1978.
B. SPECIAL SERVICES
The Special Services element supports the (1) State Board of Education, (2) Education Commission of the states, (3) advisory commissions and com~ittees, (4) .Council for Private Postsecondary Educational Institutions,(5) school personnel staff development and resource centers, and (6) sex equity education.
Table 53 on the following page summarizes expenditures and funding for this element.
School Personnel Staff Development and Resource Programs
Chapter 966, Statutes of 1977, (AB 551) provides for the establishment of staff development programs in school districts. Funding for these programs was provided in Chapter 894, Statutes of 1977 (AB 65). Two distinct types of programs are funded through this legislation:
(1) Assistance is provided to school districts for establishing school site staff development programs. Such programs are designed by certificated
. personnel at school sites to improve skills, curricula, instructional materials, and school and classroom environments. Staff development programs already existing at the school site are to be consolidated with this effort insofar as possible. In 1978-79, $533,500 in local assistance funds are provided for this purpose.
(2), InadClition, provision is made for school districts to est~blish resource centers to assist school personnel. Centers are to assist schools in establishing staff development programs in schools having School Improvement Programs or local staff development programs established in

744 I K-12 EDUCATION
DEPARTMENT OF EDUCATION-Continued Table 53
Items 295-318
Special Services Expenditures and Funding
Actual Estimated Proposed 197~79 Change Component
1. State Board of Education ........... . 2. Education Commission of the
States ..... ; ......... : .................................. . 3. Advisory commissions and com-
mittees ............................................. . 4. Council for Private Postsecond-
ary Education ............................... ... 5. School personnel staff develop-
ment and resource centers ......... . 6. Sex equity in education ................. .
Total ......................................................... . State Operations:
General Fund ................................... . Federal funds ..................................... . Reimbursements ............................... .
Local Assistance: General Fund ................. : ................. .
1976-77 1977-78. 197~79
$162,334 $173,668 $183,313
34,769
271,827
16,338
$485,268
$355,703 129,560
5
35,000
350,713
12,553
145,500 4,000
$721,434
$558,739 158,695
4,{)()()
35,opo
367,434
13,418
1,164,000
$1,763,165
$579,047 165,618
$1,018,500
Amount Percent:. $9,645 5.6%
16,721 4:8
865 6.9
1,018,500 700.0 -4,000 -100.0
$1,041,731 144.4%
$20,308 3.6% 6,923
-4,{)()() N/A
. $1,018,500 N/A
accordance with (1) above. Staff development programs are to be CQnducted based on a "systematiC' assessment of the unmet needs of pupils and personnel in participating school districts." Centers also serve as a liaison between school personnel and other local agencies providing staff development services. Centers are operated by resource center policy boards established in accordance with Public Law 94-482 of 1976. Teacher representatives comprise a majority of board members. In 1978-79, $485,-000 is provided for setting up no fewer than five resource centers. .
AB 65 also mandates that beginning in 1977-78, $145,500 be allocated for state ,administration of these programs. State administration will include (a) providing leadership and direction to all local educational agencies in the development and implementation of staff development programs; (b) coordinating a number of categorical programs; and (c) disseminating and clarifying the state board policy on staff development to local educational agencies. The Department of Education was not able to submit a work plan for this program in time for us to review for this analysis.' .
1. STATE LIBRARY
PROGRAM IV
LIBRARY SERVICES
The primary responsibilities of the Library Services program are to (1) furnish reference materials and library assistance to· state government officials and employees, (2) maintain a library specializing in California history, and (3) provide consultant, leadership and resource services to the 182 city and county public libraries in the state~

Items 2915-318 K-12 EDUCATION / 745
New Program
The ·State Library is also responsible for the implementation of the California Library Services Act established by Chapter 1255, Statutes of 1977. It revises the current per capita grant system of local assistance and substitutes a support system based on the· number of transactions performed by each partiCipating library.The State Librarian has been allocated $140,000 from the General Fund for start-up activities in 1977-78, and will receive approximately $5 million in 1978-79 for full implementation of the act .
. Activities of the State Library are organi~~d into four service elements· and a . local assistance component. Table 54 presents expenditures and funding sources for these elements.
Table 54 Expenditures and Funding of Library Services
Actual Estimated Proposal Change Element / 1976-77 1977-78 1978-79 Amount Percent
a. Reference for Legislature $447,746 $490,448 $517,997 $27,549 5.6% h. Statewide Library Sup-
port and Development .... 6;935,183 6,660,074 11,005,239 .. 4,345,165 65.2 c. Special Services .................. 573,140 901,076 625,883 ~275,193 -30.5 d. Support Services : ............... 2,193,883 2,810,343 2,831;755 20,912 .7
Total ...................................... $10,149,952 $10,861,941 $14,980,374 $4,118,433 37.9% State Operations:
Gene{al Fimd ...................... $3,684,325 $4,588,114 $4,653,219 $65,105 1.4% Federal funds ...................... 897,465 1,022,697 897,226 -125,971 -12.2 Reimbursements ................ 121,837 406,276 284,263 -122,013 -30.0
Subtotal. ................... , ......... $4,703,627 $6,017,087 $5,834,708 $-182,379 -3.1% Local Assistance:
General Fund .................. : ... $1,000,000 $1,000,000 $5,110,000 $4,110,000 ~/A Federal funds ........... :., .. ; .. ; .. 4,446,325 3,844,854 . 4,035,667 190,813 4.9
Subtotal. ............................. $5,446,325 $4,844,854 $9,145,667 $4,300,813 88.7%
Increased Expenditures
The $4.3 million increase shown under statewide library support for the budget year is caused by the implementation of the new library act and its local assistance component of $4.1 million. Other changes include an augmentation of approximately $111,000 for clerical assistance in reducing backlogs, an increase of. $50,000 for the administration of the new library act, a grant of $261,263 from the federal Public Works Employment Act which will be used for temporary clerks, an increase in estimated federal revenue under the Library Services and Construction Act of $l90,000, and a reduction of $275,000 in the Special Service component due to the completion of an inventory automation project in the blind and physically handicapped section of the library. Table 54 shows that state operations will experience an overall decline insupport of $182,379 or 3.1 percent, whereas local assistance will increase by $4,300,813 or 88.7 percent.
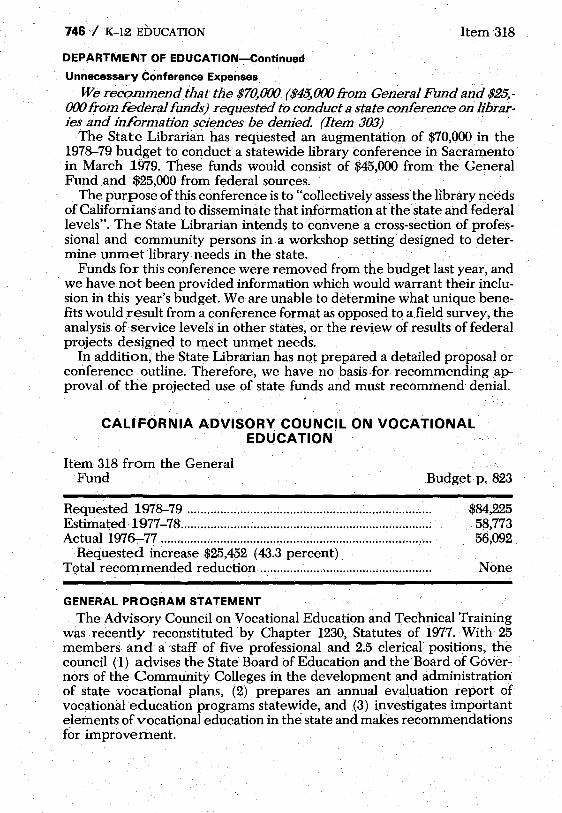
746/ K-12 EDUCATION
DEPARTMENT OF EDUCATION-Continued
Unnecessary Conference Expenses
Item 318
We recommend that the $70,000 ($45,000 from General Fund and $25,-000 from federal funds) requested to conduct a state conference on libraries and information sciences be denied (Item 303)
The State Librarian has requested an augmentation of $70,000 in the 1978--79 budget to conduct a statewide library conference in Sacramento in March 1979. These funds would consist of $45,000 from the General Fund and $25,000 from federal sources . . The purpose of this conference is to "collectively assess'the library needs
of Californians and to disseminate that information at·the state and feder-al levels". The State Librarian intends to convene a cross-section of professional and community persons in a workshop setting designed to deter-mine unmetlibrary needs in the state. .
Funds for this conference were removed from the budget last year, and we have not been provided information which would warrant their. inclusion in this year's budget. We are unable to determine what unique benefits would result from a conference format as opposed to afield survey, the analysis of service levels in other states, or the review of results of federal projects designed to meet unmet needs.
In addition, the State Librarian has not prepared a detailed proposal or conference outline. Therefore, we have no basis~for recommending approval of the projected use of state funds and must recommend denial.
CALIFORNIA ADVISORY COUNCIL ON VOCATIONAL EDUCATION
Item 318 from the General Fund Budget p. 823
Requested 1978--79 ......................................................................... . Estimated 1977-'-78 ............. ; ............................................................. . Actual 1976-77 ............................................ , .................................... .
Requested increase $25,452 (43.3 percent) Tptal recommended reduction ................................................... .
GENERAL PROGRAM STATEMENT
$84,225 58,773 56,092
None
The Advisory Council on Vocational Education and Technical Training was recently reconstituted by Chapter 1230, Statutes of 1977. With 25 members and a staff of five professional and 2.5 clerical positions, the council (1) advises the State Board of Education and the Board of Governors of the Community Colleges in the development and administration of state vocational plans, (2) prepares an annual evaluation report of vocational education programs statewide, and (3) investigates important elements of vocational education in the state and makes recommendations for improvement.
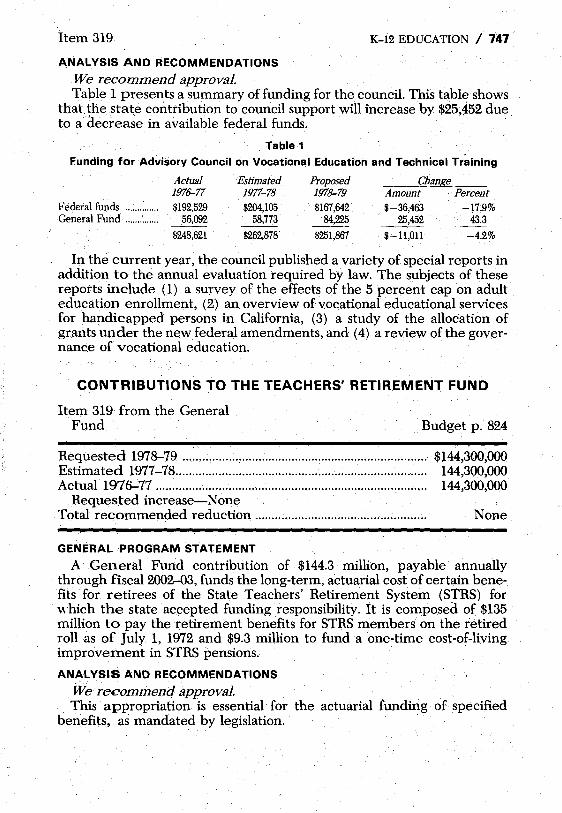
Item 319
ANALYSIS AND RECOMMENDATIONS
We recommend approval.
K-12 EDUCATION / 747
Table 1 presents a summary of funding for the council. This table shows thatthe state contribution to council support will increase by $25,452 due to a decrease in available federal funds.
Table 1
Funding for Advisory Council on VocationE!1 Education and Technical Training
Actual Estimated Proposed Change 1976-77 1977-78 1978-79 Amount . Percent
Federal funds .............. $192,529 $204,105 $167,642 $-36;463 . -17.9% General Fund .............. 56,092 58,773 84,225 25,452 43.3
$248,621 $262,878· $251,867 $-11,011 -4.2%
In the current year, the council published a variety of special reports in addition to the annual evaluation required by law. The subjects of these reports include (1) a survey of the effects of the 5 percent cap on adult education enrollment, (2) an overview of vocational educational services for handicapped persons in California, (3) a study of the allocation of grants under the new federal amendments, and (4) a review ofthe governanc.e of vocational education.
CONTRIBUTIONS TO THE TEACHERS' RETIREMENT FUND
Item 319 from the General . Fund Budget p. 824
Requested 1978-79 ........................................................................... $144,300,000 Estimated 1977-78............................................................................ 144,300,000 Actual 1976-77 .................................................................................. 144,300,000'
Requested increase-None Total recommended reduction .................................................... None
GENERAL PROGRAM STATEMENT
A General Fund contribution of $144.3 million, payable annually through fiscal 2002-03, funds the long-term, actuarial cost of certain benefits· for retirees of the State Teachers' Retirement System (STRS) for which the state accepted funding responsibility. It is composeo of $135 . million to pay the retirement benefits for STRS members on the retired roll as of July 1, 1972 and $9.3 million to fund a one-time cost-of-living improvement in STRS pensions.
ANALYSIS AND RECOMMENDATIONS
We recommend approval. . This appropriation is essential· for the actuarial funding of specified
benefits, as mandated by legislation ..
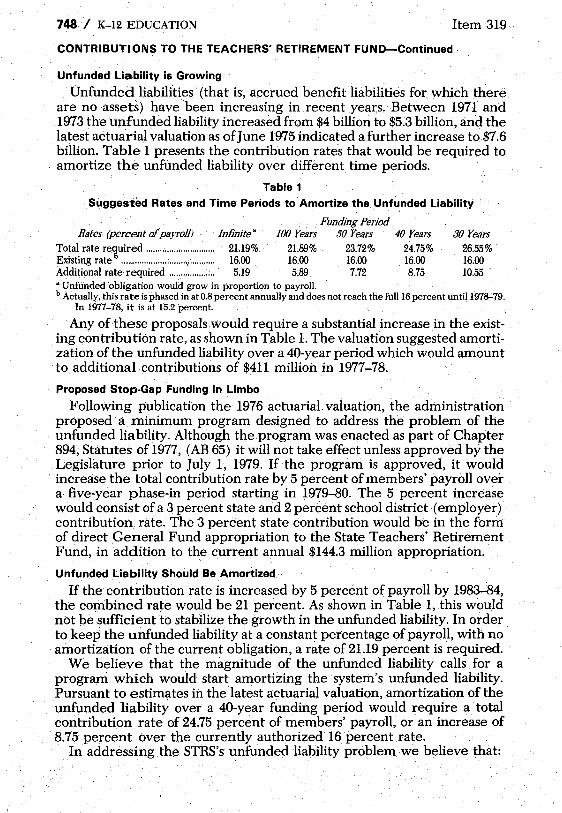
748 / K-12 EDUCATION Item 319
CONTRIBUTIONS TO THE TEACHERS' RETIREMENT FUND-Continued
Unfunded Liability is Growing ,
Unfunded liabilities (that is, accrued benefit liabilities for which there are no assets) have been increasing in recent years. Between 1971 and 1973 the unfunded liability increased from $4 billion to $5.3 billion, and the latest actuarial valuation as oOune 1975 indicated a further increase to $7.6 billion. Table 1 presents the contribution rates that would be required to amortize the unfunded liability over different time periods.
Table 1
Suggested Rates and Time Periods to Amortize the Unfunded Liability
Rates (percent of payroll) Infinite" To~al. rate re~uired .............................. 21.19% EXlstmg rate ......................................... 16.00 Additional rate required .................... 5.19
Funding Period ](}{) Years 50 Years 40 Years
21.89% 23.72% 24.75% 16.00 16.00 16.00 5.89 7.72 8.75
30 Years 26.55% 16.00 10.55
a Unfunded 'obligation would grow in proportion to payroll. b Actually, this rate is phased in at 0.8 percent annually and does not reach the full 16 percent until 197B:-79.
In 1977-78, it is at 15.2 percent.
Any of these proposals would require a substantial increase in the existing contribution rate, as shown in Table 1. The valuation suggested amortization of the unfunded liability over a 40-year period which would amount to additional contributions of $411 million in 1977-78.
Proposed Stop-Gap Funding in Limbo
Following publication the 1976 actuarial valuation, the administration proposed a minimum program designed to address the problem of the unfunded liability. Although the program was enacted as part of Chapter 894; Statutes of 1977, (AB 65) it will not take effect unless approved by the Legislature prior to July 1, 1979. If the program is approved, it would
, increase the total contribution rate by 5 percent of members' payroll over a five-year phase-in period starting in 1979-80. The 5 percent increase would consist of a 3 percent state and 2 percent school district ( employer) contribution rate. The 3 percent state contribution would be in the form of direct General Fund appropriation to the State Teachers' Retirement Fund, in addition to the current annual $144.3 million appropriation.
Unfunded Liability Should Be Amortized
If the contribution rate is increased by 5 percent of payroll by 1983-84, the combined rate would be 21 percent. As shown in Table 1, this would nbt be sufficient to stabilize the growth in the unfunded liability. In order to keep the unfunded liability at a constant percentage of payroll, with no amortization of the current obligation, a rate of 21.19 percent is required.
We believe that the magnitude of the unfunded liability calls for a program which would start amortizing the system's unfunded liability. Pursuant to estimates in the'latest actuarial valuation, amortization of the unfunded liability over a 40-year funding period would require a total contribution rate of 24.75 percent of members' payroll, or an increase of 8.75 percent over the currently authorized 16 percent rate.
In addressing the STRS's unfunded liability problem we believe that:
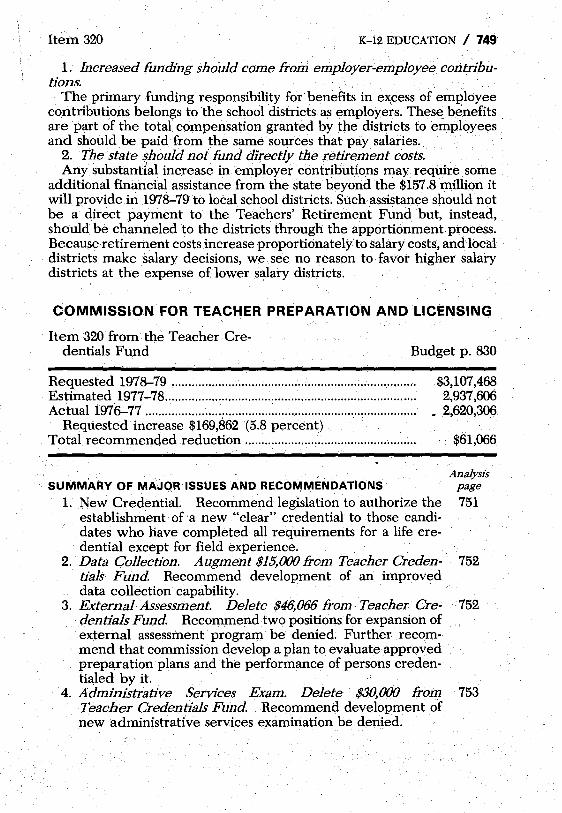
Item 320 K-12 EDUCATION / 749
1. Increased funding should come from employer-employee contributions. , The primary funding responsibility for'benefits in eX,cess of employee
contributions belongs to the school districts as, employers. These. benefits, are part of the total compensation granted by the districts to employees and should be paid from the same sources that pay salaries.
2. The state should not fund directly the retirement costs. Any substantial increase in employer contributions may require some
additional financial assistance from the state beyorid the $157.8 million it will provide in 1978-79 to local school districts. Such assistance should not be a direct payment to the Teachers' Retirement Fund but, instead, should be channeled to the districts' through the apportionment process. Because retirement costs increase proportionately' to salary costs, and local districts make salary decisions, we see no reason to favor higher salary districts at the expense of lower salary districts.
COMMISSION FOR TEACHER PREPARATION AND 'LICENSING
Item 320 from the Teacher Credentials Fund Budget p. 830
Requested 1978-79 .................. : ...................................................... . Estimated 1977-78 ........................................................................... . Actual 1976-77 ................................................................................. .
Requested increase $169,862(5.8 percent) ..
$3,107,468 2,937,606
_ 2,620,306
Total recommended reduction ................................................... .
SUMMARY OF MAJQRISSUES AND RECOMMENDATIONS
1. New Credential. Recommend legislation to authorize the establishment of a new "clear" credential to those candidates who have completed all requirements for a life credential except for field experience.
2. Data Collection. Augment $15,000 from Teacher Credentials Fund Recommend development of an improved data collection capability.
3. External Assessment. Delete $46,066 from Teacher Credentials Fund Recommend two positions for expansion of external assessment program be denied; Further recommend that commission develop a plan to evaluate approved preparation plans and the performance of persons credentialed by it.
4. Administrative Services Exam. Delete $30,000 froin Teacher Credentials Fund Recommend development of new administrative services examination be denied.
$61,066
Analysis page
751
752
752
753
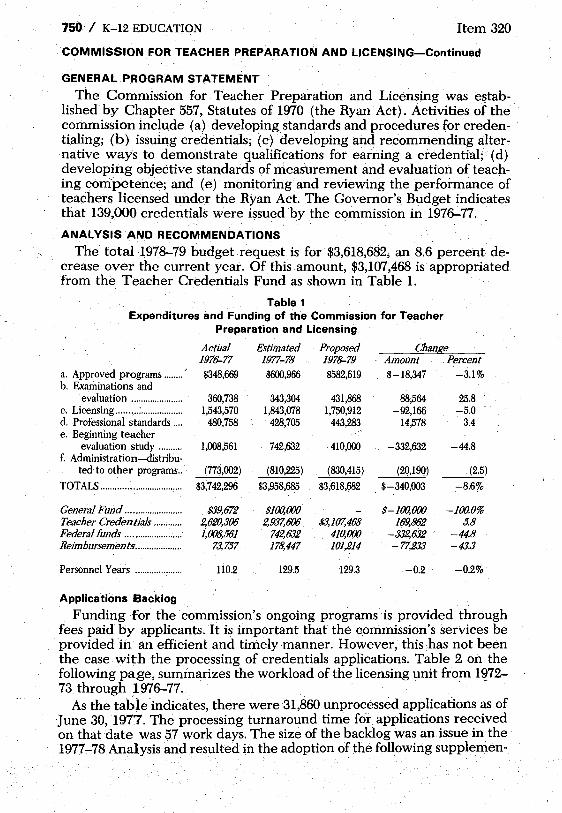
750 / K-T2 EDUCATION Item 320
COMMISSION FOR TEACHER PREPARATION AND LICENSING-Continued
GENERAL PROGRAM STATEMENT
The Commission for Teacher Preparation and Licensing was e1!tablished by Chapter 557, Statutes of 1970 (the Ryan Act). Activities of the commission include (a) developing standards and procedures for credentialing; (b) issuing credentials; (c) developing and recommending alternative ways to demonstrate qualifications for earning a credential; (d) developing objective standards of measurement and evaluation of teaching competence; and (e) monitoring and reviewing the performance of teachers licensed under the Ryan Act. The Governor's Budget indicates that 139,000 credentials were issued by the commission in 1976-77.
ANALYSIS AND RECOMMENDATIONS
The total 1978-79 budget request is for $3,618,682, an 8.6. percent decrease over the current year. Of this amount, $3,107,468 is appropriated from the Teacher Credentials Fund as shown in Table 1.
Table 1 Expenditures and Funding of the Commission for Teacher
Preparation and Licensing
Actual Estimated Proposed Change 1976-77 1977-78 197~79 AmoUnt Percent
a. Approved programs ........ ,
$348,669 $600,966 $582,619 $-18,347 -3.1% b. Examinations and
evaluation ...................... 360,738 343,304 431,868 88,564 25.8 c. Licensing ......... ~ .................. 1,543,570 1,843,078 1,750,912 -92,166 -5.0 d. Professional standards .... 480,758 428,705 443,283 14,578 3.4 e. Beginning teacher
evaluation study .......... 1,008,561 742,632 410,000 -332,632 -44.8 f. Administration-distribu-
ted to other programs .. (773,002) (810,225) (830,415) (20,19Q) (2.5)
TOTALS .................................. $3,742,296 $3,958,685 $3,618,682 $-340,003 -8.6%
General Fund ........................ $39,672 $100,000 $-100,000 -100.0% Teacher Credentials ............ 2,620,306 2,937,606 $3,107,468 169,862 5.8 Federal funds ........................ 1,008,561 742,632 410,000 -332,632 -#.8 Reimbursell}ents .................... 73,757 178,447 101,214 -77,2.J.'J -43.3
Personnel Years .................... 110.2 129.5 129.3 -0.2 -0.2%
Applications Backlog
Funding for the commission's ongoing programs is provided through fees paid by applicants. It is important that the commission's services be provided in an efficient and timely manner. However, this has not been the case with the processing of credentials applications. Table 2 on the following page, summarizes the workload of the licensing unit from 1~72-73 through 1976-77.
As the table indicates, there were 31,860 unprocessed applications as of June 30, 1977. The processing turnaround time for applications received on that date was 57 work days. The size of the backlog was an issue in the 1977-78 Analysis and resulted in the adoption of the followirig supplemen-
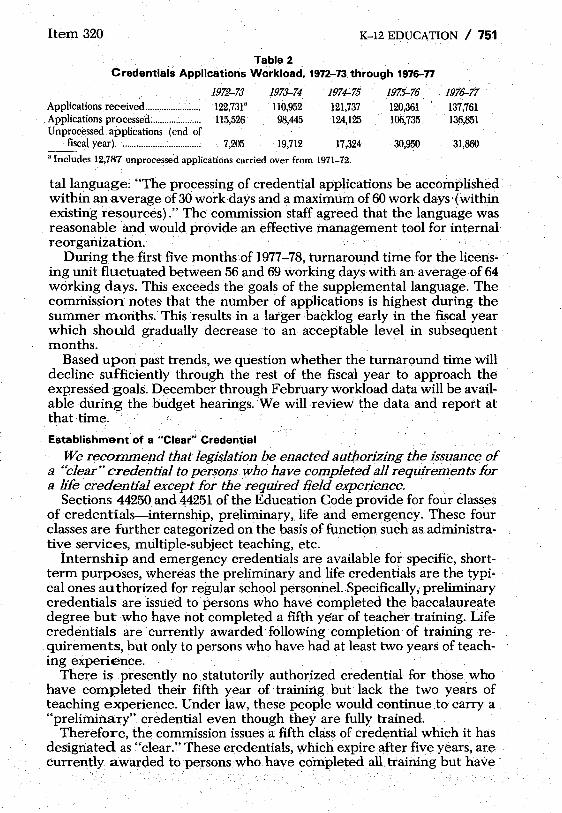
Item 320 K-12 EDUCATION / 751
Tabl~2
Credentiai~ Applications Workload~ 1972-73 through 1976-77
1972-73 1973-74 1974-75 1975-76 1976-77 Applications received ...................... .. Applications processed ..................... . Unprocessed applications (end of
fiscal year) ................................ ..
122,731" 115,526
7,'lIJ5
110,952 98,445
19,712
121,737 124,125
17,324
"Includes 12,787 unprocesse'd applications carried over from 1971-72.
120,361 106,735
30,950
137,761 136,851
31,860
tal language: "The processing of credential applications be accomplished within an average of 30 work days and a maximum of 60 work days'(within existing resources)." The commission staff agreed that the language was reasonable and would provide an effective management tool for internal reorganization.
During the first five months of 1977-78; turnaround time for the license ing unit fluctuated between 56 and 69 working days with an average of 64 working days. This exceeds the goals of the supplemental language. The commission notes that the number of applications is highest during the summer months. This results in a larger backlog early in the fiscal year which should gradually decrease to an acceptable level in subsequent months.
Based upon past trends, we question whether the turnaround time will decline sufficiently through the rest of the fiscal year to approach the expressed goals. December through February workload data will be available during the budget hearings. We will review the data and report at that time.
Establishment of a "Clear" Credential
We recoznmend that legislation be enacted authorizing the issuance of a "clear" credential to persons who have completed all requirements for a h'fecredenUal except for the 'required field experience.
Sections 44250 and 44251 of the Education Code provide for four classes of credentials-internship, preliminary, life and emergency. These four classes are further categorized on the basis of function such as administra-tive services, multiple-subject teaching, etc. .
Internship and emergency credentials are available for specific, shortterm purposes, whereas the preliminary and life credentials are the typical ones authorized for regular school personnel. Specifically, preliminary credentials are issued to persons who have completed the baccalaureate degree but who have not completed a fifth year of teacher training. Life credentials are currently awarded· following· completion· of training requirements, but only to persons who have had at least two years of teaching experience.
There is . presently no statutorily authorized credential for those who have completed their fifth year of training but lack the two years of teaching experience. Under law, these people would continue to carry a "preliminary" credential even though they are fully trained.
Therefore, the commission issues a fifth class of credential which it has deSignated as "clear." These credentials, which expire after five years, are currently awarded to persons who have completed all. training but have
752 / K-12 EDUCATION Item 320
COMMISSION FOR TEACHER PREPARATION AND LICENSING-Continued
hot met the experience requirements mandated for the life credential. In 1976-77 slightly over 20,000 (44 percent) of the credentials issued under the Ryan Act guidelines were designated as "clear" credentials.
We believe that it is reasonable to issue a distinct cred~ntialto persons who have met all preservice training requirements and that this should be authorized in law.
Data Collection
We recommend a one-time augmentation of $15,000 from the Teacher Credentials Fund to develop an improved data collection capability.
Section 44233 of the Education Code mandates that "The commission shall continuously accumulate data about the number and kind of applicants for the various credentials, patterns of application, issuance and nonissuance, and any other information deemed necessary and appropriate by the commission, the board or the Legislature".
Data regarding employment of credentialed persons are useful to the Legislature and to the commission in evaluating current programs and projecting future demand for teachers and other credentialed persons. However, the commission has not been gathering the necessary data.
For example, in preparing our report on school principals (October 1977) we sought to include detailed information on the administrative services credential. We found that the commission has not kept a systematic account of tfie method by which credentials are earned, of the sex and race of applicants, or of employment and turnover of certificated staff. Important data such as the basis upon which a substantial number of credentials (28 percent) were issued was also not available. .
The commission has acknowledged this problem and sought to rectify it by proposing the development oEa datacolledion system in its 1978-79 budget request. However, funding for such a system ($15,000) was not included in the Governor's BudgE£We believe that a basic data collection system is necessary and recommend a one-time augmentation of $15,000 from the Teacher Credentials Fund to support its development.
Evaluation and Monitoring, .
We recommend that the proposed $46,066 for increased External Assess-ment workload be denied. "
We further recommend that by September 1, 1978, the Commission for . Teacher Preparation and Licensing develop an adequate plan to evaluate approved preparation plans and the performance of persons credentialed by it.,
Education Code Section 44225, which enumerates the duties of the Commission forTeacher Preparation and Licensing, requires the commission: "to monitor and evaluate the results of its actions as it relates to the performance of teachers licensed under this article."
To accomplish this the CTPL monitors the operation of approved professional preparation programs at sample institutions of higher education through its" external assessment" program. This process in which institutions of higher education are visited by assessmentteams which ascertain the extent to which the institution is operating in accordance with its

Item 320 K.:..12 EDUCATION / 753
.credentialing program plans. In addition, current guidelines for teacher preparation programs require that each institution maintain a procedure for surveying graduates of its programs. These procedures are' also reviewed during the external assessment.
This. process is inadequate for evaluative purposes for several reasons: (1) The findings are not transmitted to the commission for review and institutions have not always conducted appropriate followup studies. (2) Comparisons between institutions are impossible because each develops its own design. (3) No studies have been made ofthe relative effectiveness of persons whose licenses were granted as a result of subject matter competencies demonstrated by tests as opposed to coursework completion. .(4) No assessment has been made of whether persons who. have completed all five years of preparation prior to gaining employment as teachers are superior to those who have completed only the baccalaureate' degree; (5) The design of the external assessment itself contains serious shortcomings. For example, thelatest report of results contains no overall findings or conclusions regarding programs.
We do not believe that the success of the commission's programs can be adequately evaluated until these deficiencies are corrected. We are confident that a design can be developed for evaluating programs and teachers which would yield valuable information to the Legislature, the commission.and the institutions regarding the performance of teachers licensed through the commission and the adequacy of preparation, programs.
The1978-79 GovernQr's Budget proposes an increase of $46,066 from the Tea<::her Credentials Fund to enabl.e the commission to expand the number of programs assessed from 60 to 72. We believe no increase should be granted until a plan has been developed which is capable of providing the information necessary for,program evaluation.
N&Vv Administrative Services Examination Development
We recommend deletion of $30,000 requested to develop a new examination for the administrative services credential.
The 1978-79 Governor's Budget propose's a one-time expenditure of $30,000 from the Teacher Credentials Fund to develop an improved examination for the administrative services credential. We believe this proposal should not be approved at this time.
Current statutes provide for the administrative services credential to be granted on the baSIS of either (a). completing an approved administrative services preparation program, (b) completing an internship, or (c) satisfactorily passing a test. Presently, the commission is using the educational administration and supervision examination, a part of the National Teachers' Examination (NTE) series prepared by the Educational Testing Serv-ices, to meet the test requirement. .
The commission reports that since 1974, when this examination was adopted, almost 25,000 persons have taken the examination and nearly 10,000 persons have obtained the administrative services credential on this basis. In, 1976-7'7, 68 percent of all administrative services credentials granted by the commission were awarded on this basis.
The NTE test has been criticized for several reasons, including anasser-

754 / POSTSECONDARY EDUCATION Item 320
COMMISSION FOR TEACHER PREPARATION AND LICENSING-Continued
tion that it was not developed for licensing purposes. In part due to such criticisms, the Legislature, in the last session, passed SB 87, which deleted the administrative services exam as a means for satisfying this requirement. However, the Governor vetoed this bill.
In 1977 a new form of the NTE test was adopted, and we are informed that the commission plans to convene an advisory panel to "review both the current scope and content of the new (current) examination" to evaluate its suitability for continued use as a licensing examination.
Therefore, we believe that the Legislature should not authorize the development of a new state examination until evidence has been provided that the revised NTE test inadequately evaluates administrative capabilities.
Recognition of the Federal Child Development Associate Credential
The Budget Act of 1977 includes supplemental language directing the commission to recognize (a) the Child Development Associate (CDA) specifically and (b) initial level training and field experience generally' within the state's system for credentialing child care teachers. The,CDA is awarded through a private, non-profit corporation. It is a certificate designed to qualify preschool teachers on the basis of demonstrated competencies, designated field experience and some formal or informal training, the amount determined by the individual's needs.
In responding to the Legislature's directive, the commission convened a cross-section of individuals involved in child development programs to examine the credentialing system, and adopted a revised children's center instructional permit system which includes both an entry level credential and recognition of field experience.
The commission concluded that the CDA alone was not sufficient to guarantee adequate .preparation of .child care teachers. Hence, :the proposed new permit regulations (a) recognize the CDA in conjunction with slightly less than a year of coursework in early childhood development as preparatjon for child care teachers in programs demonstrating "special need" but (b) require an additional year of coursework in general education for a CDA to be recognized on an ordinary basis (i.e., required units are approximately equivalent to an Associate of Arts degree). The' commission has scheduled steps to implement the new credentialing requirements during the next several months.