6carrier frequency selection of three-phase matrix converter
TRANSCRIPT
International Journal of Advances in Engineering & Technology, July 2011.
©IJAET ISSN: 2231-1963
41 Vol. 1,Issue 3,pp.41-54
CARRIER FREQUENCY SELECTION OF THREE-
PHASE MATRIX CONVERTER
Pawan Kumar Sen1, Neha Sharma
2, Ankit Kumar Srivastava
2, Dinesh Kumar
2,
Deependra Singh2 and K.S. Verma
2
1Department of Electrical and Electronics Engineering, K.N.I.P.S.S., Sultanpur (U.P.), India
2 Department of Electrical Engineering, K.N.I.T, Sultanpur (U.P.), India
ABSTRACT Analysis and design of Three-phase Matrix converter for R and R-L load is presented. In this paper Carrier
(switching) frequency for matrix converter is defined on behalf of the different values of R and R-L loads. An
Indirect space vector modulation (ISVM) technique is used for controlling the switching pattern of matrix
converter as operating in rectifier and inverter mode.
KEYWORDS
Direct Matrix Converter, Indirect Space Vector Modulation (ISVM) ISVM, Harmonics.
1. INTRODUCTION
In General, direct converter can be identified as three distinct topological approaches. The first and
simplest topology can be used to change the amplitude of an ac waveform. It is known as an ac
controller. The second can be utilized if the output frequency is much lower than the input source
frequency. This topology is called a Cycloconverter, and it approximates the desired output waveform
by synthesizing it from pieces of the input waveform. The last is matrix converter and it is most
versatile without any limits on the output frequency and amplitude. It replaces the multiple conversion
stages and the intermediate energy storage element by a single power conversion stage, and uses a
matrix of semiconductor bidirectional switches, with a switch connected between each input terminal
to each output terminal as shown in Fig. 1.
Among the most desirable features in power frequency changers are-
• Simple and compact power circuit.
• Generation of load voltage with arbitrary amplitude and frequency.
• Sinusoidal input and output currents.
• Operation with unity power factor for any load.
• Regeneration capability.
These ideal characteristics can be fulfilled by Matrix Converters. The matrix converter has several
advantages over traditional rectifier-inverter type power frequency converters. It provides sinusoidal
input and output waveforms, with minimal higher order harmonics and no sub harmonics, it has
inherent bi-directional energy flow capability, and the input power factor can be fully controlled. Last
but not least, it has minimal energy storage requirements, which allows to get rid of bulky and
lifetime- limited energy-storing capacitors. [2], [3].
With nine bi-directional switches the matrix converter can theoretically assume 512 (29) different
switching states combinations. But not all of them can be usefully employed. Regardless to the control
method used, the choice of the matrix converter switching states combinations to be used must
comply with two basic rules. Taking into account that the converter is supplied by a voltage source

International Journal of Advances in Engineering & Technology, July 2011.
©IJAET ISSN: 2231-1963
42 Vol. 1,Issue 3,pp.41-54
and usually feeds an inductive load, the input phases should never be short-circuited and the output
currents should not be interrupted.
Fig 1. Three-phase matrix converter
2. MODULATION TECHNIQUE
The block diagram of the Matrix Converter is represented in Fig.1, various modulation techniques can
be applied to the AC-AC matrix Converter to achieve sinusoidal output voltages and input currents.
An optimal modulation strategy should minimize the input current and the output voltage harmonic
distortion and device power loss [4]. The first modulator proposed for Matrix Converters, known as
the Venturini modulation, employed a scalar model [5]. This model gives a maximum voltage transfer
ratio of 0.5. An injection of a third harmonic of the input and output voltage was proposed in order to
fit the reference output voltage in the input system envelope. This technique is used to achieve a
voltage transfer ratio with a maximum value of 0.866.
2.1 Venturini's Optimum Method
This method improves the target output voltage matrix Vo(t) to include third harmonics of the input
and output frequencies. The target output voltages in Equation 1 are modified in order to include the
third harmonics. The maximum theoretical output to input voltage ratio, q, can be increased up to
86%, [6]
( )
( )
)1(
3
4
3
2
0
0
0
+
+=
πω
πω
ω
t
timo
Cos
Cos
tCos
qVtV

International Journal of Advances in Engineering & Technology, July 2011.
©IJAET ISSN: 2231-1963
43 Vol. 1,Issue 3,pp.41-54
The voltage transfer ratio may be defined as the output fundamental to the input fundamental ratio and
its maximum value is 0.866.
( )
( ) ( ) ( )
( ) ( )
( ) ( )
)2(
332
13
6
1
3
4
332
13
6
1
3
2
332
13
6
1
00
00
00
+−
+
+−
+
+−
=
tCostCosCos
tCostCosCos
tCostCostCos
qVtV
it
it
i
imo
ωωπ
ω
ωωπ
ω
ωωω
2.2 Output Voltage
Each output voltage waveform is synthesized by sequential piecewise sampling of the input voltage
waveforms. The sampling rate has to be set much higher than both input and output frequencies, and
the duration of each sample is controlled in such a way that the average value of the output waveform
within each sample period tracks the desired output waveform. In Fig. 2. the output voltage waveform
of a matrix converter is shown and compared to the output waveform of a traditional voltage source
inverter (VSI), [4, 5, 6].
2.3 Input Current
The input currents are directly generated by the output currents, synthesized by sequential piecewise
sampling of the output current waveforms. If the switching frequency of the matrix converter is set to
a value that is much higher than the input and output frequency, the input currents drawn by the
converter are sinusoidal, their harmonic spectrum consists only of the fundamental desired component
plus a harmonic content around the switching frequency. In Fig. 3 The input current drawn by a
matrix converter for a 2 kHz switching frequency is shown.
Fig 2. Output voltage waveform generated by a VSI and a matrix converter

International Journal of Advances in Engineering & Technology, July 2011.
©IJAET ISSN: 2231-1963
44 Vol. 1,Issue 3,pp.41-54
Fig 3. Matrix converter input current and harmonic spectrum. Switching frequency 2 KHz.
3. INPUT FILTER
The input filter acts as an interface between the matrix converter and the AC mains In general, the
design of an input filter for static power converters operating from an ac power system has to meet
three main requirements:
• Carrying out the required switching noise attenuation.
• Having a low input displacement angle between filter input voltage and current.
• Guaranteeing overall system stability, [7].
4. MAIN SIMULATION MODEL
Simulation results of three-phase to three-phase matrix converter (TPMC) are presented in the
following figures. The simulation parameters are shown in Table 1. There is different simulation
results of TPMC presented in this work that shows the variation of switching frequency of IGBTs.
The results show that the harmonics in the output waveform goes on decreasing as we increase the
switching frequency.
Fig 4. Main circuit model of TPMC for R load without filter.

International Journal of Advances in Engineering & Technology, July 2011.
©IJAET ISSN: 2231-1963
45 Vol. 1,Issue 3,pp.41-54
Table 1 Simulation Parameters for TPMC with R Load
Input Source (AC) 110 Vpeak
Reference Frequency signal (fr) 60 Hz
Switching Frequency Variable
Type of Load Resistive
Value of Resistance 100Ω
Fig. 5. Voltage waveform of TPMC for R load without LC filter
Case 1: fc= 5 KHz In this case the switching frequency or simply say the carrier frequency of sinusoidal pulse width
modulation is taken as 5 kHz. Hence we can see that considerable amount of harmonics are present in
output voltage waveforms. The output waveforms for case 1 are presented in Fig. 6-9.
Fig.6. Input Voltage waveform of TPMC for R load with LC filter.
Fig.7. Input Current waveform of TPMC for R load with LC filter

International Journal of Advances in Engineering & Technology, July 2011.
©IJAET ISSN: 2231-1963
46 Vol. 1,Issue 3,pp.41-54
Fig.8. Output Voltage waveform of TPMC for R load with LC filter
Fig.9. Output Current waveform of TPMC for R load with LC filter.
Case 1: fc= 6 KHz
In this case the switching frequency or simply say the carrier frequency of sinusoidal pulse width
modulation is taken as 6 kHz. Hence we can see that considerable amount of harmonics are present in
output voltage waveforms but lesser than as in case 1. The output waveforms for case 2 are presented
in Fig. 10-13.
Fig.10. Input Voltage waveform of TPMC for R load with LC filter
Fig.11. Input Current waveform of TPMC for R load with LC filter

International Journal of Advances in Engineering & Technology, July 2011.
©IJAET ISSN: 2231-1963
47 Vol. 1,Issue 3,pp.41-54
Fig.12. Output Voltage waveform of TPMC for R load with LC filter
Fig.13. Output Current waveform of TPMC for R load with LC filter.
Case 1: fc= 10 KHz
In this case the switching frequency or simply say the carrier frequency of sinusoidal pulse width
modulation is taken as 10 kHz. Hence we can see that considerable amount of harmonics are present
in output voltage waveforms but lesser than as in case 1. The output waveforms for case 2 are
presented in fig. 14-17.
Fig.14. Input Voltage waveform of TPMC for R load with LC filter
Fig.15. Input Current waveform of TPMC for R load with LC filter

International Journal of Advances in Engineering & Technology, July 2011.
©IJAET ISSN: 2231-1963
48 Vol. 1,Issue 3,pp.41-54
Fig.16. Output Voltage waveform of TPMC for R load with LC filter
Fig.17. Output Current waveform of TPMC for R load with LC filter.
Case 1: fc= 20 KHz
In this case the carrier frequency is taken as 20 kHz. From output waveforms it is clearly visible that
the harmonics have become almost negligible. The output waveforms are presented in fig. 18-21.
Fig.18. Input Voltage waveform of TPMC for R load with LC filter
Fig.19. Input Current waveform of TPMC for R load with LC filter

International Journal of Advances in Engineering & Technology, July 2011.
©IJAET ISSN: 2231-1963
49 Vol. 1,Issue 3,pp.41-54
Fig.20. Output Voltage waveform of TPMC for R load with LC filter
Fig.21.Output Current waveform of TPMC for R load with LC filter.
The study of all above simulation results shows that as we are increasing the switching frequency of
the bi-directional switches or simply say the carrier frequency of the sinusoidal pulse width
modulation, we get better results. The unnecessary harmonic contents have also been reduced. At
carrier frequency of 20 kHz the results are very smooth, and the harmonic contents become almost
zero.
4.2 SIMULATION RESULTS OF TPMC WITH R-L LOAD
The simulation MODEL in Fig. 4 could be used to study the behavior of the three-phase matrix
converter under variety of the operating conditions, including different reference frequency and
variety of load. However, the three-phase matrix converter with R-L load is also studied as shown in
figure 22-33.
Case 1: L= 0.1 µH
As discussed earlier we get the optimum result from simulation model in fig. 4 for fc=20 kHz for R
Load. Now simulating the model of fig. 4 with R-L Load, taking L as a variable at fc =20 kHz.
Initially the value of inductor is taken as 0.1 µH. The results are presented in fig. 22-25, shows the
effect of load inductance on the input and output voltage as well as current.
Table 2 simulation parameters for three phase matrix converter with R-L load
Input Source (AC) 110 Vpeak
Reference Frequency signal (fr) 60 Hz
Switching Frequency 3kHz
Type of Load Resistive-Inductive (R-L)
Input filter (L) 0.0010 H
Input filter (C) 0.01118 F

International Journal of Advances in Engineering & Technology, July 2011.
©IJAET ISSN: 2231-1963
50 Vol. 1,Issue 3,pp.41-54
Fig.22. Input Voltage waveform of TPMC for R-L load with LC filter
Fig.23. Input Current waveform of TPMC for R-L load with LC filter
Fig.24. Output Voltage waveform of TPMC for R-L load with LC filter
Fig.25. Output Current waveform of TPMC for R-L loads with LC filter.
Case 1: L= 1 µ
As discussed earlier we get the optimum result from simulation model in fig.4 for fc=20 kHz for R
Load. Now simulating the model of fig. 4 with R-L Load, taking L as a variable at fc =20 kHz.

International Journal of Advances in Engineering & Technology, July 2011.
©IJAET ISSN: 2231-1963
51 Vol. 1,Issue 3,pp.41-54
Initially the value of inductor is taken as 0.1 µH. The results are presented in fig. 22-25, shows the
effect of load inductance on the input and output voltage as well as current.
Fig.26.Input Voltage waveform of TPMC for R-L load with LC filter
Fig.27. Input Current waveform of TPMC for R-L load with LC filter
Fig.28. Output Voltage waveform of TPMC for R-L load with LC filter
Fig.29. Output Current waveform of TPMC for R-L load with LC filter.
Case 1: L= 10 µH
As discussed earlier we get the optimum result from simulation model in fig. 4 for fc=20 kHz for R
Load. Now simulating the model of fig. 4 with R-L Load, taking L as a variable at fc =20 kHz.
Initially the value of inductor is taken as 0.1 µH. The results are presented in fig. 22-25, shows the
effect of load inductance on the input and output voltage as well as current.
International Journal of Advances in Engineering & Technology, July 2011.
©IJAET ISSN: 2231-1963
52 Vol. 1,Issue 3,pp.41-54
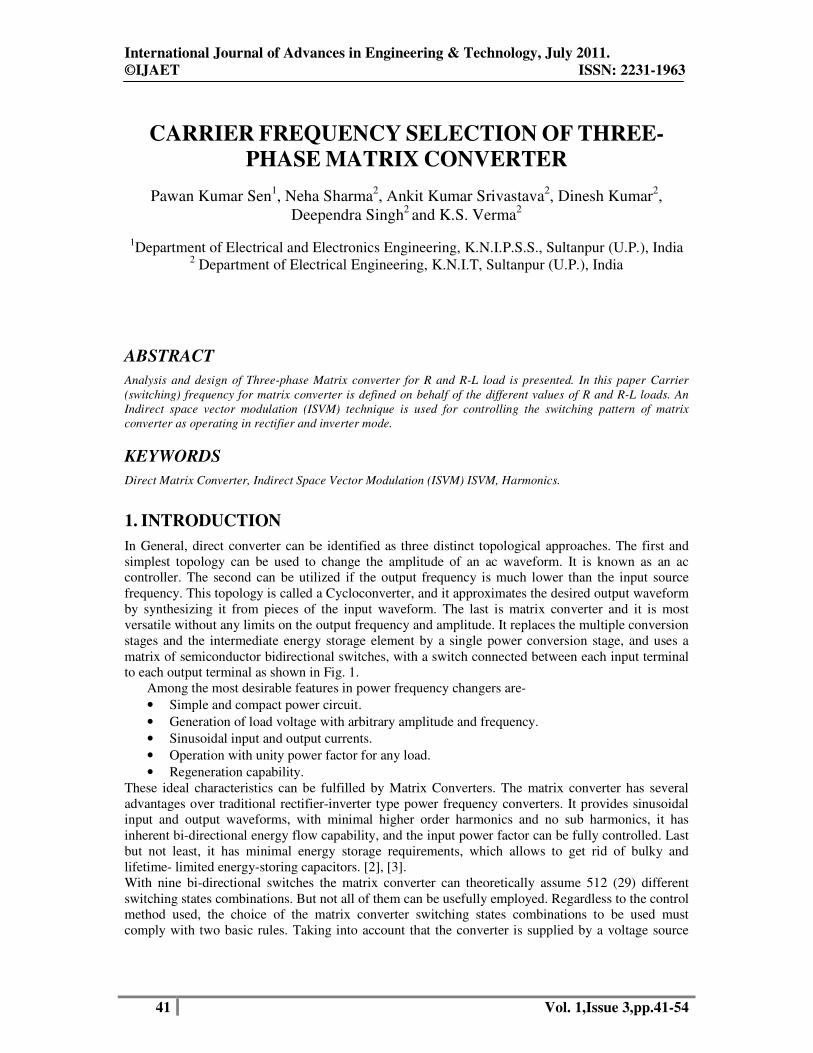
Fig.30. Output Voltage waveform of TPMC for R-L load with LC filter
Fig.31. Output Current waveform of TPMC for R-L load with LC filter
Case 1: L= 100 µH
As discussed earlier we get the optimum result from simulation model in fig. 4 for fc=20 kHz for R
Load. Now simulating the model of fig. 4 with R-L Load, taking L as a variable at fc =20 kHz.
Initially the value of inductor is taken as 0.1 µH. The results are presented in fig. 22-25, shows the
effect of load inductance on the input and output voltage as well as current.
Fig.32. Output Voltage waveform of TPMC for R-L load with LC filter.
International Journal of Advances in Engineering & Technology, July 2011.
©IJAET ISSN: 2231-1963
53 Vol. 1,Issue 3,pp.41-54
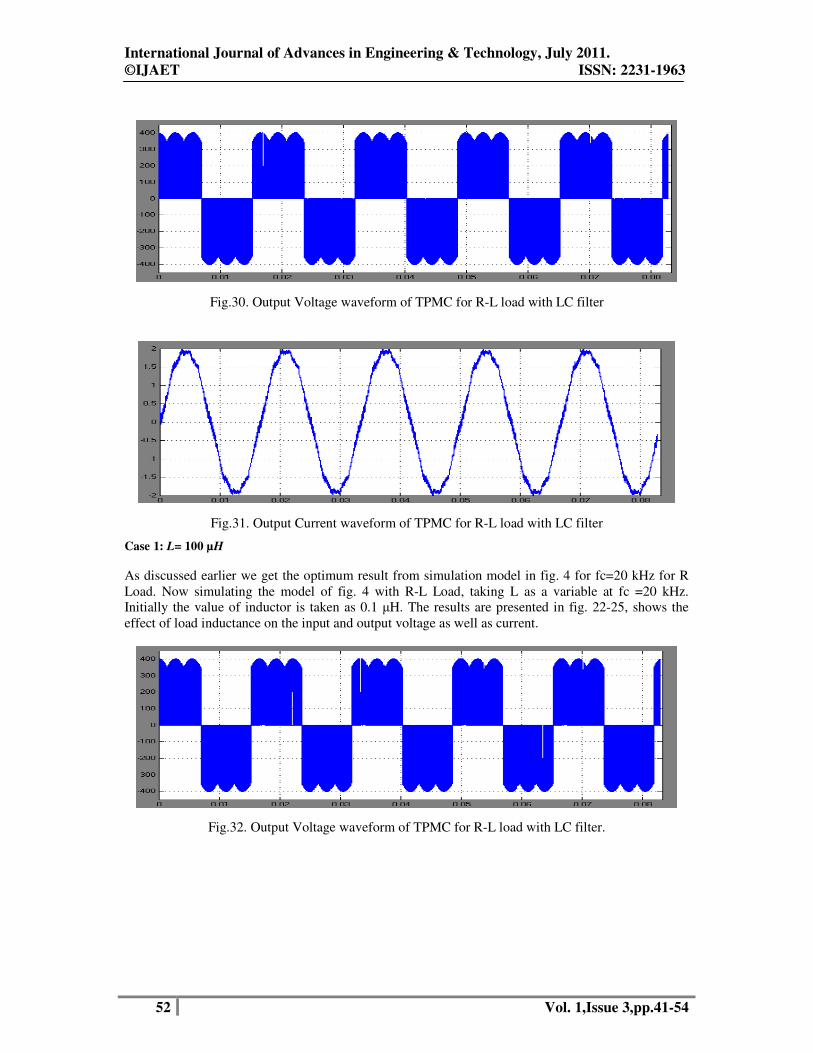
Fig.33. Output Current waveform of TPMC for R-L load with LC filter
Above results with R-L load shows that, the waveform of three-phase to three-phase matrix converter
have almost negligible deviation from R load at very low value of inductance. When we are
increasing the value of inductance gradually there is a very small change seen in the waveform. So the
matrix converters can be used in such applications where the need of variation in the load inductance.
The effect of load inductance is illustrated in fig. 22-33.
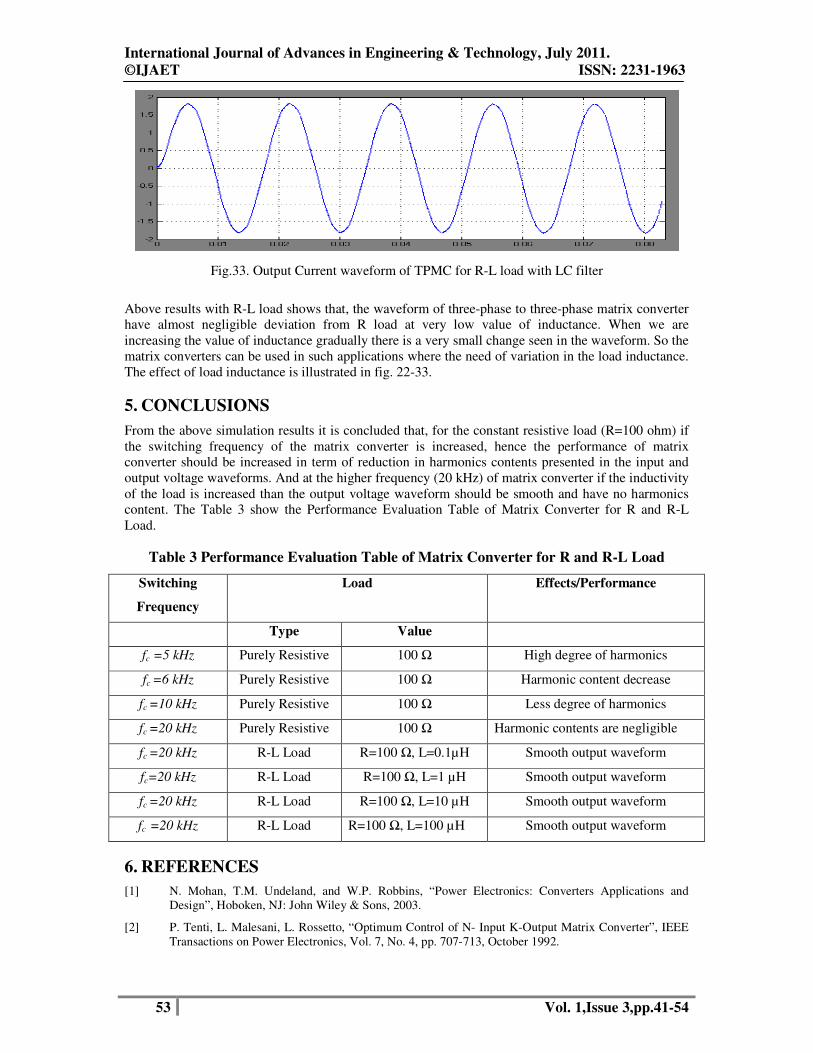
5. CONCLUSIONS
From the above simulation results it is concluded that, for the constant resistive load (R=100 ohm) if
the switching frequency of the matrix converter is increased, hence the performance of matrix
converter should be increased in term of reduction in harmonics contents presented in the input and
output voltage waveforms. And at the higher frequency (20 kHz) of matrix converter if the inductivity
of the load is increased than the output voltage waveform should be smooth and have no harmonics
content. The Table 3 show the Performance Evaluation Table of Matrix Converter for R and R-L
Load.
Table 3 Performance Evaluation Table of Matrix Converter for R and R-L Load
Switching
Frequency
Load Effects/Performance
Type Value
fc =5 kHz Purely Resistive 100 Ω High degree of harmonics
fc =6 kHz Purely Resistive 100 Ω Harmonic content decrease
fc =10 kHz Purely Resistive 100 Ω Less degree of harmonics
fc =20 kHz Purely Resistive 100 Ω Harmonic contents are negligible
fc =20 kHz R-L Load R=100 Ω, L=0.1µH Smooth output waveform
fc=20 kHz R-L Load R=100 Ω, L=1 µH Smooth output waveform
fc =20 kHz R-L Load R=100 Ω, L=10 µH Smooth output waveform
fc =20 kHz R-L Load R=100 Ω, L=100 µH Smooth output waveform
6. REFERENCES
[1] N. Mohan, T.M. Undeland, and W.P. Robbins, “Power Electronics: Converters Applications and
Design”, Hoboken, NJ: John Wiley & Sons, 2003.
[2] P. Tenti, L. Malesani, L. Rossetto, “Optimum Control of N- Input K-Output Matrix Converter”, IEEE
Transactions on Power Electronics, Vol. 7, No. 4, pp. 707-713, October 1992.

International Journal of Advances in Engineering & Technology, July 2011.
©IJAET ISSN: 2231-1963
54 Vol. 1,Issue 3,pp.41-54
[3] M. Apap, J.C. Clare, P.W. Wheeler, and K.J. Bradley, “Analysis and Comparison of AC-AC Matrix
Converter Control Strategies,” 34th Annual IEEE Power Electronics Specialist Conference, 2003, vol.
3, pp. 1287-1292, June 2003.
[4] Alberto Alesina and Marco G. B. Venturini, “Solid- State Conversion: A Fourier Analysis Approach to
generalized Transformer Synthesis,” IEEE Transactions on Circuits and Systems, vol. CAS-28, no. 4,
pp.319-330, April 1981.
[5] J. Oyama, T. Higuchi, E. Yamada, T. Koga, and T. Lipo, “New Control Strategy for Matrix
Converter,” 20th Annual IEEE Power Electronics Specialists Conference, 1989, vol. 1, pp. 360-367,
June 1989.
[6] T. Matsuo, S. Bernet, R.S. Colby and T.A. Lipo, “Application of the Matrix Converter to Induction
Motor Drives,” Conference Record of Thirty-First IEEE/IAS Annual Meeting, vol. 1, pp. 60-67, 1996.
Authors:
Pawan Kumar Sen received his B.Tech degree in Electrical Engineering in 2008 U. P.
Technical University Lucknow (U.P.), India. he obtained is M.Tech degree in Power
Electronics and Drives in Department of Electrical Engineering, Kamla Nehru Institute of
Technology, Sultanpur, (U.P.), India, affiliated to G.B. Technical University Lucknow
(U.P.), India. Currently he is working as assitant professor in department of electrical and
electronics engineering KNIPSS, Sultanpur(U.P.) His interests are in the areas of
Microprosessor and Power Electronics and drive.
Neha Sharma received her B.Tech degree in Electrical Engineering in 2007 U. P. Technical
University Lucknow (U.P.), India. Currently, she is pursuing M.Tech in Power Electronics
and Drives in Department of Electrical Engineering, Kamla Nehru Institute of Technology,
Sultanpur. Her interests are in the areas of Control System and Drive.
Ankit Kumar Srivastava received his B.Tech Degree in Electrical Engineering in 2008 from
the VBS Purvanchal University, Jaunpur (U.P.), India. Currently, he is pursuing M.Tech in
Power Electronics and Drives in Department of Electrical Engineering, Kamla Nehru Institute
of Technology, Sultanpur, (U.P.), India, affiliated to G.B. Technical University Lucknow
(U.P.), India. His interests are in the area of Power Electronics and drive.
Dinesh Kumar received his B.Tech degree in Electrical Engineering in 2009 from G.B.
Technical University Lucknow (U.P.), India. Currently, he is pursuing M.Tech in Power
Electronics and Drives in from Kamla Nehru Institute of Technology, Sultanpur, (U.P.), India,
affiliated to G.B. Technical University Lucknow (U.P.), India. His interests are in the area of
Power Electronics and Control System.
Deependra Singh received the B. Tech and M.E degrees both in electrical engineering in
1997 and 1999 from Harcourt Butler Technological Institute, Kanpur, India and University of
Roorkee, Roorkee, India, respectively. He obtained his Ph.D in Electrical Engineering from
U.P. Technical University, Lucknow, India. Presently, He is associate professor in department
of electrical engineering in Kamla Nehru Institute of Technology, Sultanpur (UP), India. His
research interests are distributed generation planning and distribution system analysis.
K. S. Verma received the B. Tech and M.Tech. degrees both in electrical engineering from
department of electrical engineering, Kamla Nehru Institute of Technology, Sultanpur (UP),
India respectively. He obtained his Ph.D in Electrical Engineering from Indian Institute of
Technology (IIT), Roorkee, Uttaranchal, India. Presently, He is professor in department of
electrical engineering and also working as the Director in Kamla Nehru Institute of
Technology, Sultanpur (UP), India. His research interests are FACTS, open power market,
simulation and design of power systems, distributed generation planning.