6th awbr international conference 9 10 june 2011...
TRANSCRIPT
6th AWBR International Conference │ Bordeaux Management School │ 9-10 June 2011
1
6th
AWBR International Conference
9 – 10 June 2011
Bordeaux Management School – BEM – France
Competition between and competition within: the strategic positioning of competing
countries in key export markets
Armando Maria Corsi University of South Australia, Australia
Larry Lockshin University of South Australia, Australia
Simone Mueller MAPP, Aarhus University, Denmark
Abstract
Purpose: This research aims to understand how five Producing Countries (PCs) – Australia,
Chile, France, South Africa and the US –are perceived by consumers in five Consuming
Countries (CCs) – UK, Ireland, US, Canada, and Sweden – in relation to the following
product dimensions: taste profile and distinctiveness, wine type, labelling, packaging,
consumption occasion, safety, reliability and environmental friendliness.
Design/methodology/approach: An international consumer panel company provided about
500 respondents per CC, who took part in an on-line survey. A pick-any approach measured
the associations of product attributes to each of the five PCs. Deviations from the expected
value greater than 5% characterise differences in perception by consumers in a specific CC to
the PCs.
Findings and Practical implications: The study shows the efficacy of the pick-any approach
to simultaneously provide information on the position occupied by a PC in the minds of
consumers located in different CCs and the role played by different PCs in a specific CC.
These results will be particularly useful for both public and private wine bodies when
designing export strategies.
Key words: cross-national, pick-any approach, competition, positioning, country image.
6th AWBR International Conference │ Bordeaux Management School │ 9-10 June 2011
2
Introduction
The last twenty years have seen a fast internationalisation of wine markets across the globe
and the rise of the new wine world, competing with traditional wine producing countries
(OIV, 2010). This research fills an important gap as new and old wine countries are involved
in strong competition in most international wine markets with significant import share. While
new wine world producers have initially been perceived as relatively homogeneous by wine
consumers, large investments in national marketing campaigns and long term presence in the
markets have likely resulted in differences within new world producing countries. On the
other hand, the initial success of new world wine countries have forced old wine producers to
adapt and to change their wine making and marketing. This competition has almost resulted in
a reversal of the original positioning, where new wine world producers now strive for
regionality and organic production, formerly a stronghold of traditional producers. Similarly,
old wine countries now compete with brands and modern packaging to keep or regain market
shares lost to new world competitors. It is therefore unclear, to what degree consumers’
country images still differ between old and new wine producing countries.
Large and small wineries regularly export their products to generally more than one country
(Crozet et al., 2009). It is, therefore, important to understand how consumers perceive wines
coming from different Producing Countries (PC) in key Consuming Countries (CC), not only
in relation to traditional intrinsic and extrinsic product attributes (Mueller et al., 2010a), their
taste (Sirieix and Remaud, 2010), their value-for money (Orth, 2006), or matching with food
(Casini et al., 2009), but they are also required to be safe, reliable, and environmentally
friendly (Euromonitor International, 2010).
In addition, knowing the positioning of a country in consumers’ minds is important, because
when consumers are in front of a shelf or a menu, they are faced with multiple wine areas. If
one knows only how good a country is, without having information on how much better or
worse the country appears in relation to its main competitors, one risks putting in place
inefficient exporting strategies. By using a free-choice pick-any approach (Driesener and
Romaniuk, 2006), this research aims to understand how five PCs – Australia, Chile, France,
South Africa and the US –are perceived in five CCs – UK, Ireland, US, Canada, and Sweden
– in relation to a series of intrinsic and extrinsic product attributes, whose baseline level of
importance has been provided by existing literature (Goodman, 2009; Loveless et al., 2010).
Literature Review
Wine is never chosen for one exclusive reason. Some elements are certainly more important
than others, but the final consumer choice is generally determined by a mix of factors.
Researchers often focus their attention on the dichotomy between intrinsic and extrinsic
attributes (Egan et al, 2008; Mueller et al., 2010a), but new elements such as the consumption
occasion (Halsted, 2002; Martinez-Carrasco Martinez et al., 2006), environmental friendliness
(Mueller and Remaud, 2010; Sirieix and Remaud, 2010), safety and reliability (Loveless et
al., 2010) have been progressively taken into account.
Taste and packaging attributes
There is a long history of research debating the relative importance of intrinsic attributes,
relating to the taste of wine, and extrinsic attributes, such as labelling information and
packaging. While both attribute types are important to consumers when evaluating wine, the
majority of studies conclude that extrinsic product information is dominant (Lange et al.,
2002; Combris et al., 2009; Siegrist and Cousins, 2009; Mueller, et al. 2010a; Mueller and
Szolnoki, 2010). Consumers’ perceptions of a wine producing country are suggested to differ
regarding taste, labelling and packaging attributes.
6th AWBR International Conference │ Bordeaux Management School │ 9-10 June 2011
3
Value for money
Price has an ambivalent role for consumers’ wine quality perception and purchase intent.
Consumers usually associate wines of higher price with higher quality (Plassman et al., 2008;
Mueller et al., 2010a), when evaluating liking. But when it comes to purchase intent, most
consumers prefer lower and medium over higher prices (Mueller et al., 2010a). Accordingly,
value for money perceptions are suggested to be an integral part of wine producing country
perceptions.
Wine consumption occasion
The importance of intrinsic and extrinsic elements varies in relation to the occasion in which
the wine is consumed (Hall et al., 2001). For example, Martinez-Carrasco Martinez et al.
(2006) report differences in the utility between formal wine occasions in restaurants relative
to informal consumption. More recently, the results of an international research project about
consumers’ preferences toward wine in retail (Goodman, 2009) and on-premise (Goodman et
al., 2008) resulted in strong differences in the importance of choice drivers between both
occasions. Recommendations and grape variety were two key elements for the choice of wine
in a retail environment, while matching with food and the desire to try something different are
most important in an on-premise setting. Wines from different countries of origin are likely to
differ in consumers’ perceived suitability to fulfil these different needs of informal and formal
occasions.
Environmental friendliness
Environmental issues are increasingly in consumer attention and are becoming a key issue in
the competition between old and new wine countries. Mueller and Remaud (2010) found that
only a small share of Australian consumers are willing to pay a price premium for eco-
friendly claims, but organic wines strongly improved in terms of consumers’ evaluation
between 2007 and 2009. Delmas and Grant (2008) investigated the price premium American
consumers are willing to pay for eco-certification and Sirieix and Remaud (2010) measured
perceptions Australian consumers have with environmental friendly wine. At this stage it is
unknown, how consumers in different CCs differ in their perception of environmental
friendliness across several PCs.
Food safety and reliability
Wine safety and reliability are the result of a combination of extrinsic elements, such as
medals, prices, brands, and region of origin (Lockshin, et al. 2006). These elements have been
widely investigated in the wine marketing literature for consumer choices analyses, but they
have been never put in relation to safety and reliability; this differs to what we have seen in
other food categories such as poultry (Stefani et al., 2008), beef (Loureiro and Umberger,
2007), or other fresh products (Pouliot and Sumner, 2008). Only Rocchi and Stefani (2006)
observed that traditional origins are sometimes interpreted as a sign of reliability, but also can
be a sign of lack of tradition.
Cross-country image research
The concept of Country Image (CI) refers to the descriptive, inferential and informational
beliefs one has about a particular country (Martin and Eroglu, 1993). It conceptually derives
from the literature on Country of Origin (COO) effects (Balestini and Gamble, 2006, Wang
and McCluskey, 2010; Veale and Quester, 2010), as COO cues can be salient and relevant for
high involvement products such as wine (Zeugner-Roth and Diamantopoulos, 2010). CI is
important in the wine sector as it is able to influence product evaluation of wine purchasing
(Arias-Bolzmann et al., 2003, Batt and Dean, 2010) and affects price expectations
(Papadopoulos and Heslop, 2002).
6th AWBR International Conference │ Bordeaux Management School │ 9-10 June 2011
4
However, contrasting to other product categories, where CI effects have been comparatively
investigated at a cross country level (Elliot et al., 2010; Yeh et al., 2010), all the studies in the
wine marketing literature focused on single-countries (Lee and Lockshin, 2010, Wang and
McCluskey, 2010). Only more general studies on preferences towards intrinsic and extrinsic
wine attributes and choice drivers have been conducted in multiple countries (Goodman,2009;
Jarvis and Stasi, 2010; Remaud et al., 2010;) showing significant differences between New
World (NW) and Old World (OW) countries.
To our best knowledge, we are not aware of a study comparing country of origin perceptions
of old and new wine producing countries across a number of key export markets. This
research fills an important gap as new and old wine countries are involved in strong
competition in most international wine markets with significant import share.
Sample and Method
The authors selected five old and new world PCs from four continents, which strongly
compete in most import wine markets – Australia, Chile, South Africa and the US as new
wine world countries and France as the most typical representative of the old wine world.
Respondents were selected in five CCs – UK, Ireland, US, Canada, and Sweden – which
represent key export markets for each of the PCs selected above. These CCs show different
cultural and wine purchasing backgrounds, which are likely to provide different results in the
perceptions of the various PCs. An international consumer panel company provided about 500
respondents per CC, who took part in an on-line survey. The respondents had to be frequent
wine consumers, that is they drank wine at least once per month.
A list of attributes for each of the seven main intrinsic and extrinsic product dimensions –
taste profile and distinctiveness, wine type, labelling, packaging, consumption occasion,
safety and reliability and environmental friendliness – was developed based on an extensive
review of existing wine marketing literature as discussed in the literature review. Due to space
limitations, it is not possible to present the complete list of country image items, a sub-sample
is provided in the first column of Appendix A.
A pick-any approach (Driesener and Romaniuk, 2006) measures the associations with each of
the five PCs. This recent methodology has been widely applied in the branding field
(Romaniuk et al., 2007; Bogomolova and Romaniuk, 2010; Nenycz-Thiel and Romaniuk,
2009), but it has been always used to measure associations to identity brand elements, such as
descriptors, colours and slogans, not countries of origin. The method consists of showing
respondents a list of product (brand) attributes for each of the dimensions researchers want to
investigate. For each dimension respondents are asked to indicate which, if any, country
(brand) they would associate with each attribute. Respondents could select as many attributes
as they wanted and could also link the same attribute to more than one PC. Like other forced-
choice methods, the pick-any approach allows obtaining similar information as forced-choice
approaches, but it is quicker to understand and complete (Bogomolova and Romaniuk, 2010)
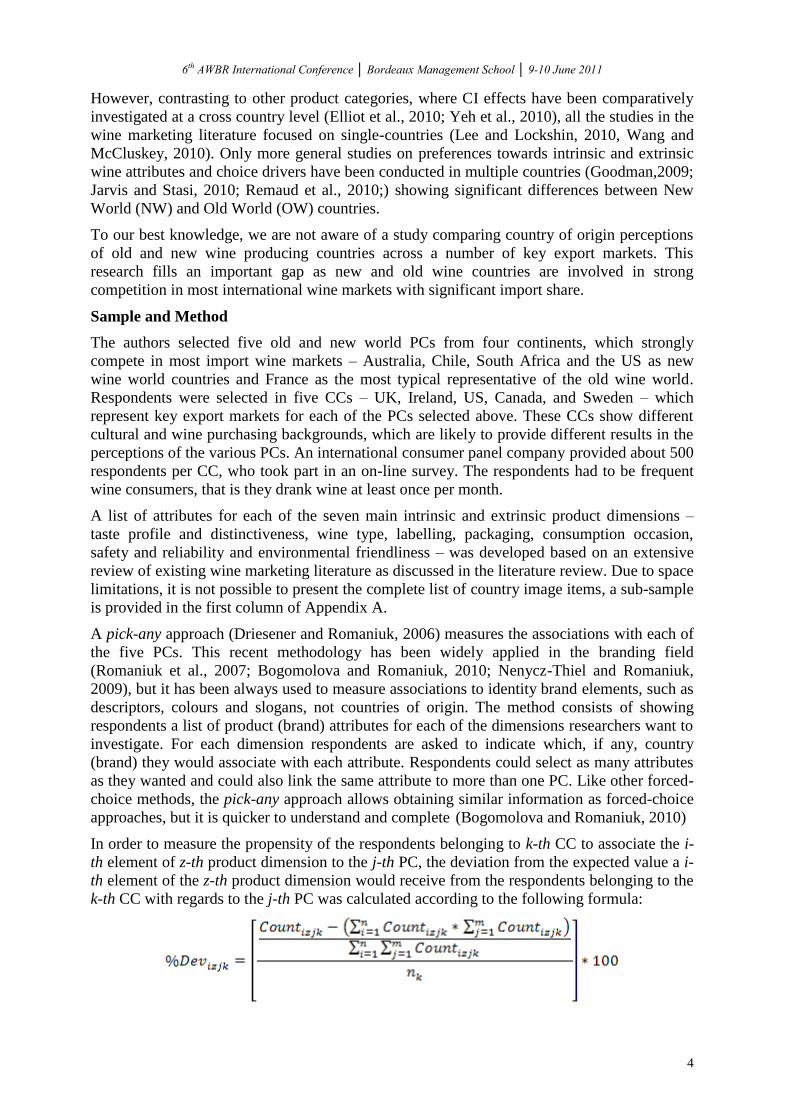
In order to measure the propensity of the respondents belonging to k-th CC to associate the i-
th element of z-th product dimension to the j-th PC, the deviation from the expected value a i-
th element of the z-th product dimension would receive from the respondents belonging to the
k-th CC with regards to the j-th PC was calculated according to the following formula:

6th AWBR International Conference │ Bordeaux Management School │ 9-10 June 2011
5
where:
Countizjk = number of times the i-th element of the z-th product dimension has been
associated to the j-th PC by the respondents belonging to the k-th CC;
nk = number of respondents for the k-th CC.
Analogous to the concept of statistical significance, all the i-th deviations greater than 5%
from the expected value are considered important and therefore characterise unique
perceptions of a specific consuming country towards a specific producing country.
Results
A summary of the findings will be provided for each PC for all six country image dimensions.
Due to space limitations detailed tables with CC specific results cannot be shown here. The
Appendix gives an example of a CC specific results table.
Taste profile and distinctiveness
The results for taste profile and distinctiveness (see Table 1) show that Australian wines were
perceived as good, not boring and easy to drink in every CC. This result is particularly
interesting, as none of the other PCs obtained a similar judgement. Chilean wines were
positively judged in terms of taste and ease of drinking only in Ireland and Sweden. These
CCs appreciated the varieties produced in Chile and thought that these wines were exciting.
At the same time, Irish, English and Swedish consumers believed Chile is not a very
distinctive wine region. In addition, Chilean wine styles and varieties were perceived as very
homogeneous in Ireland and Canada. This judgement was shared with South African wines,
especially in the United Kingdom, US, Ireland and Sweden. However, in the UK and the US,
South African products were thought of as having neither appeal nor tradition; they were
considered exciting, not boring, and fashionable, in Ireland and Sweden. In this context it is
worth noting the positioning of US wines. They were thought to be boring, not easy to drink
or tasty among the five CCs. Moreover, they were perceived as not coming from a very
unique region and were perceived to be very similar to each other.
France, as the old world producer, was different from all other PCs. The first element to
observe was that French wines had a very unique and distinctive profile, with the highest
degree of deviation from the average. History and tradition were their key strengths. They
were perceived as complex, elegant and thought-provoking wines. Moreover, in the
consumers’ perception they offered a wider range of styles and varieties, which also make
them more exciting. On the other side, French wines were not particularly appreciated for
their taste and certainly are not easy to drink.
Tab. 1: Taste profile and distinctiveness
Producing countries summary of perceptions in the five CCs
Australia Good, not boring, easy to drink
Chile Good and easy to drink in Ireland and Sweden, but not distinctive and homogeneous
France History and tradition, complex, elegant, exciting and provoking wines
South Africa Very homogeneous wine styles and varieties, no appeal or tradition
USA Boring, not easy to drink, very similar between each other and not coming from a very distinctive region
Wine Types
This dimension measured which wine type consumers associate with each PC (see Table 2), it
was noted that English, Irish and Swedish consumers considered Australia as the home of

6th AWBR International Conference │ Bordeaux Management School │ 9-10 June 2011
6
white wines, while US and Canada associated this country with the production of red wines. It
is interesting to observe that Chile is generally recognised as a red wine PC, and that one
cannot think about sparkling wines without mentioning France. Conversely, South Africa
showed a tendency towards both red and white wines, while all CCs, apart from Sweden,
thought of the US when being asked about rosé wine.
Tab. 2: Wine types
Producing countries summary of perceptions in the five CCs
Australia White wines for the UK, Ireland and Sweden, Red wines for USA and Canada
Chile Red wines
France Sparkling wines
South Africa Red and white wines
USA Rosé wines for all but Sweden
Labelling, packaging and price
Australia and USA were considered very similar in relation to labelling, packaging and price.
Wines coming from these two countries were perceived as not expensive and as easy to
understand. The labels were associated with being modern and, with regard to Australian
wines, also unique, especially for Canadian and US consumers. The ability to produce good-
value-for-money wines was also recognised for Chile, but this country was still not able to
communicate this to its final users. Chilean wine labels lacked modernity and were difficult to
understand; a situation. This last point is also common to French wines. Every CC thought
that French wines were very difficult to understand and were also very classic. At the same
time, they were also considered expensive, so consumers did not often think of buying them
in the future (see Table 3).
Tab. 3: Labelling, packaging and price
Producing countries summary of perceptions in the five CCs
Australia Not expensive and easy to understand, modern and unique labels, especially for Canada and the US
Chile Good-value-for-money, but they lack modernity and are difficult to understand
France Classic, expensive, and difficult to understand labels
South Africa Good-value-for-money and modern packaging only for Sweden
USA Not expensive and easy to understand, modern labels
Consumption Occasions
In terms of consumption occasions, France again generated the most distinctive profile among
our CCs. While South African wines did not seem to play a role for daily consumption or as
wines for special occasions, and Chilean, Australian and US wines were considered good for
a dinner at home with friends or for a relaxed night out, French wines were synonymous with
celebration. To honour a special occasion, having a dinner in a fine dining restaurant, or to
give a gift, French wines were preferred in every CC. It is also interesting to note that the
consumption of French wine was strongly associated with food. While consumers did not
have any particular problem in opening a bottle of wine coming from other PCs without
having a meal, French wines are thought to be ideal with food (see Table 4).
Tab. 4: Consumption Occasions
Producing countries summary of perceptions in the five CCs

6th AWBR International Conference │ Bordeaux Management School │ 9-10 June 2011
7
Australia Dinner at home with friends or a relaxed night out
Chile Dinner at home with friends or a relaxed night out
France Special occasions, dinner in a fine dining restaurant, gifts to be matched with food
South Africa Indifferent
USA Dinner at home with friends or a relaxed night out
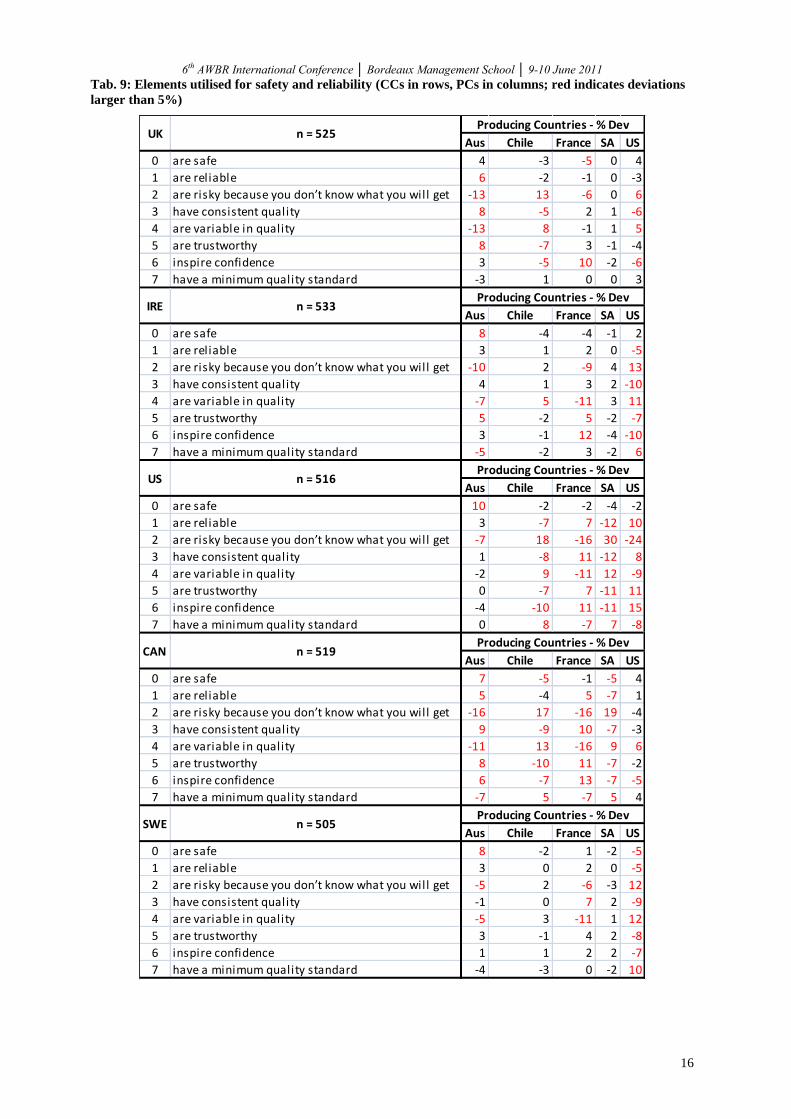
Wine safety and reliability
In terms of perceptions of wine safety and reliability (see Table 5), the US and Canada
appeared to be the two CCs where PCs had the most distinctive profiles in consumer
perception. The % deviations for these two CCs, were much higher than for Ireland, Sweden
or the UK. Common elements between Canada and the US were the lack of trust towards
Chile and South Africa. It was believed that wines coming from these two regions are not safe
and lack quality control, with the consequence that consumers do not really know what they
are going to consume. Moreover, production was not considered reliable, and quality
variability is one of the elements which characterised them the most.
Conversely, France, despite the negative judgments on label clarity, was considered safer and
able to supply reliable products. Quality controls were perceived as being above minimum
levels and, in general, French production inspired trust. This safety, however, did not seem to
stem from labelling information, but from the credibility of French wine regions and
vineyards, as well as from the possibility of knowing who is behind the production of a
certain wine. It is interesting to note that, while US consumers had confidence in domestic
production, judging it as safe, trustworthy, reliable, and able to guarantee good quality
controls, consumers in other CCs critically perceived trustworthiness, reliability and quality
standards of US wines. Finally, Australian wines were positively considered by all CCs,
especially for the ability to produce safe wines. In addition, Canadian, English, and Irish
consumers thought it possible to know who made the wines and appreciate the reliability of
Australian wines. The perception of safety seemed to come more from what it is on label than
the region or vineyards a wine comes from.
Tab. 5: Wine safety and reliability
Producing countries summary of perceptions in the five CCs
Australia Safe wines. Canada, Ireland and UK appreciate Australian reliability, but based on what is on labels rather than wine areas and vineyards
Chile Not safe, lacking quality control, not reliable and variable quality for US and Canada
France Safe and able to supply reliable products. Credibility of French wine areas and vineyards
South Africa Not safe, lacking quality control, not reliable and very variable quality for US and Canada
USA Trustworthy, reliable and good quality controls only for domestic consumers
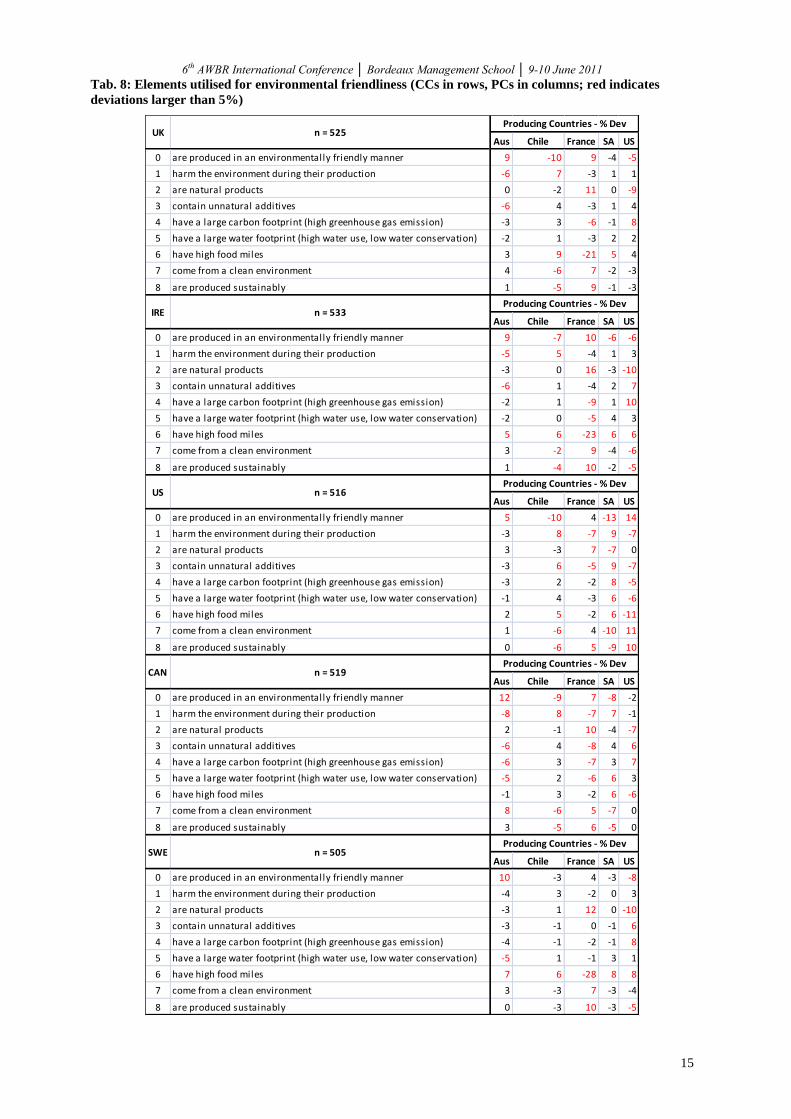
Environmental friendliness
Finally, we present the results of the perception of environmental friendliness of the five PCs
(see Table 6). South African wines were quite negatively judged by US consumers. Canadian
and US consumers thought that South African wine was not environmentally friendly or
sustainable. They felt the production of wine generates serious environmental damage, which
is reflected in the carbon and water footprint left by these wines. A similar opinion, although
less negative, was given by US consumers of Chilean wines, which were perceived as not

6th AWBR International Conference │ Bordeaux Management School │ 9-10 June 2011
8
environmentally friendly products from polluted areas. Conversely, French wines obtained a
high score from all CCs. French production was considered as very natural and respectful of
the environment. French wines were perceived to be sustainably produced, requiring little
energy or water. As such, the environment in France was considered very clean. Although it
may appear obvious that English, Irish and Swedish consumers think that these products do
not generate many food miles given their proximity to France, it is interesting to observe that
this opinion was also common among Canadian and US consumers. These last two CCs
believed that Chilean and South African wines have higher food mileage. As for safety and
reliability aspects, it is again interesting to observe the nationalistic position of US consumers
with regard to their domestic production. Contrary to other CCs, who did not believe in the
natural, sustainable and environmentally friendly US wine production, American consumers
believed that domestic production does not have much impact in terms of energy and water
and does not use unnatural substances. This might not be surprising as the US was the only
country, which was selected both as PC and CC in this study. Similar deviating self
perceptions are likely for other wine producing countries.
Finally, Australian wines were considered respectful of the environment among all CCs, but
they were slightly perceived as having high food miles in Ireland and Sweden. In particular,
the Canadian market was very much in favour of Australian production. These wines were put
at the same level as French wines, especially in relation to the cleanliness of the environment
and the carbon and water footprint.
Tab. 6: Environmental friendliness
Producing countries summary of perceptions in the five CCs
Australia Environmentally friendly, especially in Canada. Canadian consumers put Australia on the same level of France. High food mileage in Ireland and Sweden
Chile Not environmentally friendly, coming from polluted areas, with a high food mileage for US and Canada
France Natural, sustainable and respectful of the environment. Low food mileage
South Africa Not environmentally friendly, coming from polluted areas, with a large carbon and water footprint and high food mileage for US and Canada
USA Natural, sustainable and environmentally friendly only for US consumers
Conclusion
The study measured consumer perceptions with five different new and old world wine
producing countries across five consuming countries. Results revealed that new wine
producing countries were not seen as homogeneous but were perceived distinctively
differently from each other in most CCs. During their market presence of more than ten to
fifteen years in most export markets, new world wine producing countries have build up
unique country images. At the same time our research confirmed a still existing strong divide
in the profile between new world and the most prominent old world country, France, which
had the most distinctive profile in all CCs.
From a methodological perspective this study confirmed the efficacy of the pick-any approach
to simultaneously provide information on the position occupied by a PC in the minds of
consumers located in different CCs and on the role played by different PCs in a specific CC.
In a quicker and easier to understand approach than forced-choice methods, the pick-any
approach provides a wide range of information to marketers.

6th AWBR International Conference │ Bordeaux Management School │ 9-10 June 2011
9
From a managerial point of view, this data is particularly useful for both public and private
wine bodies, when export strategies need to be designed or realigned. If we discuss the results
in relation to Australia, for example, we can see that this PC has a relative competitive
advantage in relation to Chile, South Africa or the US in most importing countries. Australian
wine may well compete with the other new world PCs, when consumers need to chose a wine
for a dinner with friends or for a casual night out, focusing in particular on the clarity of its
labels and the reliability of its production. Moreover, in case Australian producers want to
export to Canada or the US, they should stress the environmental character of Australian wine
production. At this stage Australia is still not able to compete with French wines in the on-
premise sector.
Further research could look at extending this study to other PCs and CCs, in order to identify
the positioning of other competing PCs in the minds of consumers located in other strategic
key markets. Moreover, segmentation analyses (Mueller and Rungie, 2009) should be
performed on this data, aiming at understanding whether consumers differentiate more
between different PCs or between the product attributes they are exposed to.
References
Arias-Bolzmann, L., Sak, O., Musalem, A., and Lodish, L. (2003), “Wine pricing: The
influence of country of origin, variety, and wine magazine rating, International Journal
of Wine Marketing, Vol. 15 No. 2, pp.47-58.
Balestrini, P., and Gamble, P. (2006), “Country-of-origin effects on Chinese wine
consumers”, British Food Journal, Vol. 108 No.6, pp. 396-412.
Batt, P. J., and Dean, A. (2000), “Factors influencing the consumer’s decision-Australia and
New Zealand Wine Industry”, Journal Marketing Supplement, Vol. 15 No. 4, pp. 34-41.
Bogomolova, S., and Romaniuk, J. (2010), “Brand equity of defectors and never boughts in a
business financial market”, Industrial Marketing Management, Vol. 39, pp. 1261-1268.
Casini, L., Corsi, A. M., and Goodman, S. (2009), “Consumer preferences of wine in Italy
applying Best:Worst scaling”, International Journal of Wine Business Research, Vol. 21
No. 1, pp. 64-78.
Combris, P., Bazoche, P., Giraud-Héraud, E., and Issanchou, S. (2009), “Food choices: What
do we learn from combining sensory and economic experiments?” Food Quality and
Preference, Vol. 20 No. 8, pp. 550-557.
Crozet, M., Head, K., and Mayer, T. (2009), “Quality sorting and trade: firm-level evidence
for French wine”, AAWE Working Paper No. 40, available at http://www.wine-
economics.org/workingpapers/AAWE_WP40.pdf (accessed 25/01/11).
Delmas, M. A., and Grant, L. E. (2008), “Eco-labeling strategies: the eco-premium puzzle in
the wine industry”, AAWE Working Paper no. 13, available at: http://www.wine-
economics.org/workingpapers/AAWE_WP13.pdf (accessed 3/11/10).
Driesener, C., and Romaniuk, J., (2006), “Comparing methods of brand image measurement”,
International Journal of Market Research, Vol. 48 No. 6, pp. 681-698.
Elliot, S., Papadopoulos, N., and Kim, S. (2010), “An Integrative Model of Place Image:
Exploring Relationships between Destination, Product, and Country images”, Journal of
Travel Research, Vol. 20 No. 10, pp. 1-15.
Euromonitor (2010), “Global Wine: Challenges and Opportunities Facing the Wine Industry”,
available at

6th AWBR International Conference │ Bordeaux Management School │ 9-10 June 2011
10
http://www.euromonitor.com/Global_Wine_Challenges_and_Opportunities_Facing_the_
Wine_Industry (accessed 25/01/11).
Goodman, S. (2009), “An international comparison of retail consumer wine choice”,
International Journal of Wine Business Research, Vol. 21 No. 1, pp. 41-49.
Goodman, S., Lockshin, L., and Cohen, E. (2008), “Influencers of consumer choice in the on-
premise environment: more international comparisons”, The Australian & New Zealand
Grapegrower & Winemaker, February, pp. 76-78.
Hall, J., O’Mahony, B., and Lockshin, L. (2001), “Exploring the links between wine choice
and dining occasion: factors of influence”, International Journal of Wine Marketing, Vol.
13 No. 1, pp. 36-49.
Jarvis, W., and Stasi, A. (2009), “Attribute purchasing heterogeneity: A cross-country
comparison”, Paper presented at the Australian and New Zealand Marketing Academy
Conference, Monash University, Australia, 30th
November-2nd
December.
Lange, C., Martin, C., Chabanet, C., Combris, P., and Issanchou, S. (2002), “Impact of the
information provided to consumers on their willingness to pay for Champagne:
comparison with hedonic scores”, Food Quality and Preference, Vol. 13 No. 7-8, pp.
597-608.
Lee, R., and Lockshin, L. (2010), “Halo effects of tourists’ destination image on domestic
product perceptions”, Australasian Marketing Journal, available on-line 14th
December 2010.
Lockshin, L., Jarvis, W., d’Hauteville, F., and Perrouty, J. P. (2006), “Using simulations from
discrete choice experiments to measure consumer sensitivity to brand, region, price and
awards in wine choice”, Food Quality and Preference, Vol. 17, pp. 166-178.
Loureiro, M., and Umberger, W. (2007), “A choice experiment model for beef: What US
consumer responses tell us about relative preferences for food safety, country-of-origin
labeling and traceability”, Food Policy, Vol. 32 No. 4, pp. 496-514.
Loveless, K., Mueller, S., Lockshin, L., and Corsi, A. M. (2010), “The relative importance of
sustainability, quality control standards and traceability for wine consumers: a cross-
national segmentation”, Paper presented at the Australian and New Zealand Marketing
Academy Conference, University of Canterbury, New Zealand, 29th
November-1st
December.
Martin, I. M., and Eroglu, S. (1993), “Measuring a multi-dimensional construct: country
image, Journal of Business Research, Vol. 28 No. 3, pp. 191-210.
Martinez-Carrasco Martinez, L., Brugarolas Mollà-Bauzà, Del Campo Gomis, F. J., and
Martinez Povera, A. (2006), “Influence of purchase place and consumption frequency
over quality wine preferences”, Food Quality and Preference, Vol. 17, pp. 315-327.
Mueller, S., and Remaud, H. (2010), “Are Australian consumers becoming more
environmentally conscious? Robustness of the latent preference segments over time”,
Paper presented at the 5th
International Academy of Wine Business Research Conference,
University of Auckland, New Zealand, 8th
-10th
February.
Mueller, S., and Rungie, C. (2009), “Using the attitude heterogeneity structure to identify
consumer segments”, International Journal of Wine Business Research, Vol. 21 No. 1,
pp. 24-40.
6th AWBR International Conference │ Bordeaux Management School │ 9-10 June 2011
11
Mueller, S., Lockshin, L., and Louviere, L. (2010b), “What you see may not be what you get:
Asking consumers what matters may not reflect what they choose”, Marketing Letters,
Vol. 21 No. 4, pp. 335-350.
Mueller, S., Osidacz, P., Francis, L., and Lockshin, L. (2010a), “The relative importance of
extrinsic and intrinsic wine attributes: combining discrete choice and informed sensory
consumer testing”, Paper presented at the 5th
International Academy of Wine Business
Research Conference, University of Auckland, New Zealand, 8th
-10th
February.
Nenycz-Thiel, M., and Romaniuk, J. (2009), “Perceptual categorization of private labels and
national brands”, Journal of Product & Brand Management, Vol. 18 No. 4, pp. 251-261.
OIV (2010), “World Statistics”, available at http://news.reseau-
concept.net/pls/news/p_entree?i_sid=&i_type_edition_id=20508&i_section_id=20510&i
_lang=33 (accessed 25/01/11).
Orth, U. (2006), “Different brands for different occasions : drivers of consumer public and
private choices”, Paper presented at the 3rd
International Wine Business & Marketing
Research Conference, Montpellier SupAgro, France, 6th
-8th
July.
Papadopoulos, N. and Heslop, L. (2002), “Country equity and country branding: Problems
and prospects”, Brand Management, Vol. 9 No. 4-5, pp. 294-314.
Plassmann, H., O’Doherty, J., Shiv, B., and Rangel, A. (2008), “Marketing actions can
modulate neural representations of experienced pleasantness”, Proceedings of the
National Academy of Sciences, Vol. 105 No. 3, pp. 1050-1054.
Pouliot, S., and Sumner, D. A. (2008), “Traceability, Liability, and Incentives for Food Safety
and Quality”, American Journal of Agricultural Economics, Vol. 90 No. 1, pp. 15-27.
Remaud, H., Chabin, Y. und Mueller, S. (2010), Do consumers value sustainable wine
claims?, Refereed paper, Proceedings of the Conference of the International World Wine
Organisation (OIV), 20-27 June, Tbilisi, Georgia.
Rocchi, B., and Stefani, G. (2006), “Consumers’ perception of wine packaging: a case study”,
International Journal of Wine Marketing, Vol. 18 No. 1, pp. 33-44
Romaniuk, J., Sharp, B., and Ehrenberg, A. (2007), “Evidence concerning the importance of
perceived brand differentiation”, Australasian Marketing Journal, Vol. 15 No. 2, pp. 42-
54.
Siegrist, M., and Cousin, M. E. (2009), “Expectations influence sensory experience in a wine
tasting”, Appetite, Vol. 52 No. 3, pp. 762-765.
Sirieix, L., and Remaud, H. (2010), “Consumer perceptions of eco-friendly vs. conventional
wines in Australia”, Paper presented at the 5th
International Academy of Wine Business
Research Conference, University of Auckland, New Zealand, 8th
-10th
February.
Stefani, G., Cavicchi, A., Romano, D., and Lobb, A. E. (2008), “Determinants of intention to
purchase chicken in Italy: the role of consumer risk perception and trust in different
information sources”,
Agribusiness, Vol. 24 No. 4, pp. 523-537.
Veale, R., and Quester, P. (2010), “Sensing or knowing? Investigating the influence of
knowledge and self confidence on consumer beliefs regarding the effect of extrinsic cues
on wine quality”, Paper presented at workshop The World’s Wine Markets by 2030:
Terroir, Climate Change, R&D and Globalisation, University of Adelaide, Australia, 7th
-
9th
February.
6th AWBR International Conference │ Bordeaux Management School │ 9-10 June 2011
12
Wang, H., and McCluskey, J. (2010), “Effects of information and country of origin on
Chinese consumer preferences for wine: an experimental approach in the field”, Paper
presented at the Annual Meeting of the Agricultural and Applied Economics Association.
, Denver, Colorado, 25th
-27th
July, available at
http://ageconsearch.umn.edu/bitstream/61330/2/AAEA%20main%20paper.pdf (accessed
11/01/11).
Yeh, C., Chen, C., and Sher, P. (2010), “Investigation on perceived country image of
imported food”, Food Quality and Preference, Vol. 21, pp. 849-856.
Zeugner-Roth, K. P., and Diamantopoulos, A. (2010), “Advancing the country image
construct: Reply to Samiee’s (2009) commentary”, Journal of Business Research, Vol.
63, pp. 446-449.

6th AWBR International Conference │ Bordeaux Management School │ 9-10 June 2011
13
Appendix
Tab. 7: Elements utilised for taste profile and distinctiveness dimension (CCs in rows, PCs in columns; red
indicates deviations larger than 5%)
UK n = 525 Producing Countries - % Dev
Aus Chile France SA US
0 taste good 10 1 -15 5 -2
1 are easy to drink 11 0 -18 5 2
2 are complex and thought provoking -6 4 9 -1 -6
3 have a lot of different styles and a variety of tastes 2 -3 7 -1 -6
4 taste pretty much the same and are boring -9 0 -4 -5 17
5 are truly different from wines from other countries -2 7 -3 3 -5
6 are produced in distinct wine regions -7 -9 23 -6 -2
Ireland n = 533 Producing Countries - % Dev
Aus Chile France SA US
0 taste good 12 7 -17 4 -7
1 are easy to drink 13 7 -24 3 1
2 are complex and thought provoking -8 0 15 -1 -7
3 have a lot of different styles and a variety of tastes -2 -2 10 0 -6
4 taste pretty much the same and are boring -5 -7 -10 -2 24
5 are truly different from wines from other countries -3 5 3 2 -6
6 are produced in distinct wine regions -7 -10 23 -5 0
US n = 516 Producing Countries - % Dev
Aus Chile France SA US
0 taste good 8 1 -7 0 -2
1 are easy to drink 5 -1 -11 -1 8
2 are complex and thought provoking -3 0 10 -1 -7
3 have a lot of different styles and a variety of tastes -2 -4 1 -3 8
4 taste pretty much the same and are boring 1 4 -5 6 -6
5 are truly different from wines from other countries -1 1 3 4 -7
6 are produced in distinct wine regions -8 -2 9 -5 6
Canada n = 519 Producing Countries - % Dev
Aus Chile France SA US
0 taste good 10 2 -9 2 -5
1 are easy to drink 7 2 -12 0 3
2 are complex and thought provoking -3 1 11 0 -9
3 have a lot of different styles and a variety of tastes 3 -7 6 -2 0
4 taste pretty much the same and are boring -9 -1 -12 1 20
5 are truly different from wines from other countries 1 6 0 4 -11
6 are produced in distinct wine regions -8 -4 16 -4 1
Sweden n = 505 Producing Countries - % Dev
Aus Chile France SA US
0 taste good 10 5 -10 4 -8
1 are easy to drink 10 5 -18 2 1
2 are complex and thought provoking -5 0 9 1 -6
3 have a lot of different styles and a variety of tastes 1 0 4 1 -7
4 taste pretty much the same and are boring -7 -4 -5 -7 23
5 are truly different from wines from other countries -2 2 -4 6 -1
6 are produced in distinct wine regions -7 -7 24 -6 -3

6th AWBR International Conference │ Bordeaux Management School │ 9-10 June 2011
14
6th AWBR International Conference │ Bordeaux Management School │ 9-10 June 2011
15
Tab. 8: Elements utilised for environmental friendliness (CCs in rows, PCs in columns; red indicates
deviations larger than 5%)
Aus Chile France SA US
0 are produced in an environmentally friendly manner 9 -10 9 -4 -5
1 harm the environment during their production -6 7 -3 1 1
2 are natural products 0 -2 11 0 -9
3 contain unnatural additives -6 4 -3 1 4
4 have a large carbon footprint (high greenhouse gas emission) -3 3 -6 -1 8
5 have a large water footprint (high water use, low water conservation) -2 1 -3 2 2
6 have high food miles 3 9 -21 5 4
7 come from a clean environment 4 -6 7 -2 -3
8 are produced sustainably 1 -5 9 -1 -3
Aus Chile France SA US
0 are produced in an environmentally friendly manner 9 -7 10 -6 -6
1 harm the environment during their production -5 5 -4 1 3
2 are natural products -3 0 16 -3 -10
3 contain unnatural additives -6 1 -4 2 7
4 have a large carbon footprint (high greenhouse gas emission) -2 1 -9 1 10
5 have a large water footprint (high water use, low water conservation) -2 0 -5 4 3
6 have high food miles 5 6 -23 6 6
7 come from a clean environment 3 -2 9 -4 -6
8 are produced sustainably 1 -4 10 -2 -5
Aus Chile France SA US
0 are produced in an environmentally friendly manner 5 -10 4 -13 14
1 harm the environment during their production -3 8 -7 9 -7
2 are natural products 3 -3 7 -7 0
3 contain unnatural additives -3 6 -5 9 -7
4 have a large carbon footprint (high greenhouse gas emission) -3 2 -2 8 -5
5 have a large water footprint (high water use, low water conservation) -1 4 -3 6 -6
6 have high food miles 2 5 -2 6 -11
7 come from a clean environment 1 -6 4 -10 11
8 are produced sustainably 0 -6 5 -9 10
Aus Chile France SA US
0 are produced in an environmentally friendly manner 12 -9 7 -8 -2
1 harm the environment during their production -8 8 -7 7 -1
2 are natural products 2 -1 10 -4 -7
3 contain unnatural additives -6 4 -8 4 6
4 have a large carbon footprint (high greenhouse gas emission) -6 3 -7 3 7
5 have a large water footprint (high water use, low water conservation) -5 2 -6 6 3
6 have high food miles -1 3 -2 6 -6
7 come from a clean environment 8 -6 5 -7 0
8 are produced sustainably 3 -5 6 -5 0
Aus Chile France SA US
0 are produced in an environmentally friendly manner 10 -3 4 -3 -8
1 harm the environment during their production -4 3 -2 0 3
2 are natural products -3 1 12 0 -10
3 contain unnatural additives -3 -1 0 -1 6
4 have a large carbon footprint (high greenhouse gas emission) -4 -1 -2 -1 8
5 have a large water footprint (high water use, low water conservation) -5 1 -1 3 1
6 have high food miles 7 6 -28 8 8
7 come from a clean environment 3 -3 7 -3 -4
8 are produced sustainably 0 -3 10 -3 -5
SWE n = 505Producing Countries - % Dev
US n = 516Producing Countries - % Dev
CAN n = 519Producing Countries - % Dev
UK n = 525Producing Countries - % Dev
IRE n = 533Producing Countries - % Dev
6th AWBR International Conference │ Bordeaux Management School │ 9-10 June 2011
16
Tab. 9: Elements utilised for safety and reliability (CCs in rows, PCs in columns; red indicates deviations
larger than 5%)
Aus Chile France SA US
0 are safe 4 -3 -5 0 4
1 are reliable 6 -2 -1 0 -3
2 are risky because you don’t know what you will get -13 13 -6 0 6
3 have consistent quality 8 -5 2 1 -6
4 are variable in quality -13 8 -1 1 5
5 are trustworthy 8 -7 3 -1 -4
6 inspire confidence 3 -5 10 -2 -6
7 have a minimum quality standard -3 1 0 0 3
Aus Chile France SA US
0 are safe 8 -4 -4 -1 2
1 are reliable 3 1 2 0 -5
2 are risky because you don’t know what you will get -10 2 -9 4 13
3 have consistent quality 4 1 3 2 -10
4 are variable in quality -7 5 -11 3 11
5 are trustworthy 5 -2 5 -2 -7
6 inspire confidence 3 -1 12 -4 -10
7 have a minimum quality standard -5 -2 3 -2 6
Aus Chile France SA US
0 are safe 10 -2 -2 -4 -2
1 are reliable 3 -7 7 -12 10
2 are risky because you don’t know what you will get -7 18 -16 30 -24
3 have consistent quality 1 -8 11 -12 8
4 are variable in quality -2 9 -11 12 -9
5 are trustworthy 0 -7 7 -11 11
6 inspire confidence -4 -10 11 -11 15
7 have a minimum quality standard 0 8 -7 7 -8
Aus Chile France SA US
0 are safe 7 -5 -1 -5 4
1 are reliable 5 -4 5 -7 1
2 are risky because you don’t know what you will get -16 17 -16 19 -4
3 have consistent quality 9 -9 10 -7 -3
4 are variable in quality -11 13 -16 9 6
5 are trustworthy 8 -10 11 -7 -2
6 inspire confidence 6 -7 13 -7 -5
7 have a minimum quality standard -7 5 -7 5 4
Aus Chile France SA US
0 are safe 8 -2 1 -2 -5
1 are reliable 3 0 2 0 -5
2 are risky because you don’t know what you will get -5 2 -6 -3 12
3 have consistent quality -1 0 7 2 -9
4 are variable in quality -5 3 -11 1 12
5 are trustworthy 3 -1 4 2 -8
6 inspire confidence 1 1 2 2 -7
7 have a minimum quality standard -4 -3 0 -2 10
UK n = 525Producing Countries - % Dev
IRE n = 533Producing Countries - % Dev
SWE n = 505Producing Countries - % Dev
US n = 516Producing Countries - % Dev
CAN n = 519Producing Countries - % Dev