7 49 - altia€¦ · for the german market with a selection of the most iconic nordic beverage...
TRANSCRIPT
ANNUAL REPORT2018
7 49 108CORPORATE RESPONSIBILITY Altia's corporate responsibility in 2018
FINANCIAL STATEMENTS 2018 Consolidated financial statements of Altia Group
CEO'S REVIEW CEO Pekka Tennilä comments on Altia's year 2018

ALTIA IS A LEADING NORDIC ALCOHOLIC BEVERAGE
BRAND COMPANY operating in the wines and spirits
markets in the Nordic and Baltic countries. We produce,
import, market, sell and distribute both own and partner
brand beverages. We also have production in Cognac,
France. Further, Altia exports alcoholic beverages to approx-
imately 30 countries in Europe, Asia and North America. We
want to support the development of a modern, responsible
Nordic drinking culture.
Our business model is based on offering a strong portfolio
of our own brands and a versatile range of international
partner brands. Our key export brands are Koskenkorva,
O.P. Anderson and Larsen. Other iconic Nordic brands are
Chill Out, Blossa, Xanté, Jaloviina, Leijona, Explorer and
Grönstedts, among others.
We also provide our customers with production, packaging
and logistics services. In addition, by-products from the
production process, such as starch, feed components and
technical ethanols, are sold to industrial customers.
Sustainability is an important business factor for us. For
example, the operations at our Koskenkorva distillery are
based on bio- and circular economy, making use of 100% of
the Finnish barley it uses as a raw ingredient. The circular
economy at the Koskenkorva distillery brought Altia the
Green Company of the Year award in 2018.
Altia’s shares are listed on Nasdaq Helsinki.
Altia in brief
HEAD OFFICE
DISTILLERY
PRODUCTION
SALES OFFICE
WAREHOUSE
Let’s drink better
2BOARD REPORT
BUSINESS OVERVIEW
CORPORATERESPONSIBILITY
CORPORATE GOVERNANCE
FINANCIAL STATEMENTS
ANNUAL REPORT2018

BUSINESS OVERVIEW 2Altia in brief 2Financial key ratios 2018 4Responsibility key figures 2018 6CEO's review 7Altia’s year 2018 9Strategy 11Value created 13Circular economy 14Segments 15Operating environment 18Brands 20Altia as an investment 22
REPORT BY THE BOARD OF DIRECTORS 24Non-financial statement 40Key ratios of the Group 45
CORPORATE RESPONSIBILITY 49Steering of Altia's responsibility work 50Altia's responsibility programme 2018–2020 51Stakeholder dialogue 52Stakeholder interaction 53Materiality analysis 55Responsibility cornerstones 58
Altia & Customers 59Altia & Society 63Altia & Environment 69Altia & Employees 78
Reporting framework 85GRI content index 86
CORPORATE GOVERNANCE 93Corporate governance statement 94Remuneration statement 101Board of Directors and Executive Management Team 104
FINANCIAL STATEMENTS* 108Consolidated financial statements 110Notes to the consolidated financial statements 114
1. Operating result 1162. Operating assets and liabilities related to operations 1213. Financial items and capital structure 1334. Financial and capital risk 1455. Consolidation 1526. Other notes 156
Parent company’s (Altia Plc) financial statements 167 Notes to Altia Plc financial statements 171Board of Directors’ proposal for the distribution of profits 180Auditor's note 180Auditor's report 181
Contact information Back cover
Contents
*More detailed table of contents of financial statements can be found on page 109.
7
20
14
49
CIRCULAR ECONOMY The Koskenkorva distillery is based on bio and circular economy. The distillery runs mostly on bioenergy produced from barley husks.
HOW TO READ THIS REPORT Altia's Annual Report 2018 consists of business overview, report by the Board of Directors, corporate responsibility section, governance statements and financial state-ments. You can navigate within the Report by scrolling down the pages or by using the hyperlinks on the top navigation and contents pages.
Menu symbol leads to this page
OUR BRANDS Altia has a unique portfolio of iconic brands, such as Koskenkorva, Larsen and O.P. Anderson.
CEO'S REVIEW Pekka Tennilä comments on Altia's year 2018.
CORPORATE RESPONSIBILITY Altia and Koskenkorva distillery were chosen as the Green Company of the Year 2018. Read more about our corporate responsibility work.
3BOARD REPORT
BUSINESS OVERVIEW
CORPORATERESPONSIBILITY
CORPORATE GOVERNANCE
FINANCIAL STATEMENTS
ANNUAL REPORT2018
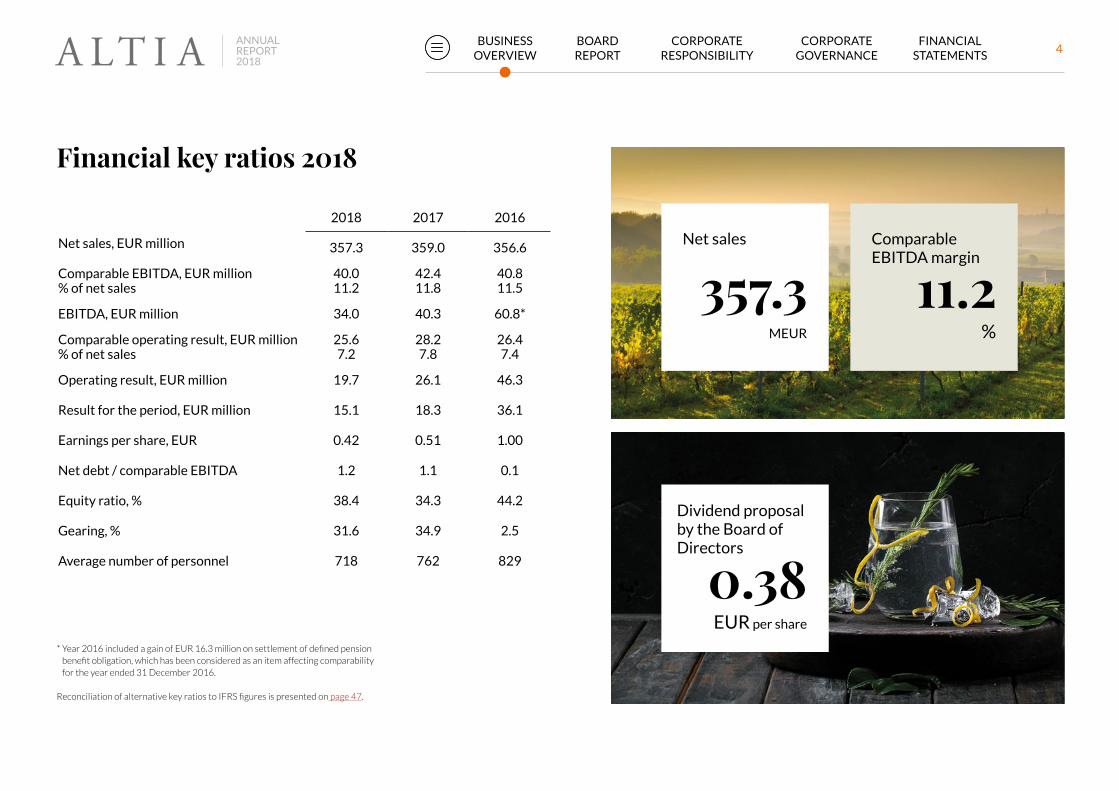
Financial key ratios 2018
2018 2017 2016
Net sales, EUR million 357.3 359.0 356.6
Comparable EBITDA, EUR million % of net sales
40.0 11.2
42.4 11.8
40.811.5
EBITDA, EUR million 34.0 40.3 60.8*
Comparable operating result, EUR million % of net sales
25.6 7.2
28.2 7.8
26.4 7.4
Operating result, EUR million 19.7 26.1 46.3
Result for the period, EUR million 15.1 18.3 36.1
Earnings per share, EUR 0.42 0.51 1.00
Net debt / comparable EBITDA 1.2 1.1 0.1
Equity ratio, % 38.4 34.3 44.2
Gearing, % 31.6 34.9 2.5
Average number of personnel 718 762 829
* Year 2016 included a gain of EUR 16.3 million on settlement of defined pension benefit obligation, which has been considered as an item affecting comparability for the year ended 31 December 2016.
Reconciliation of alternative key ratios to IFRS figures is presented on page 47.
357.3 MEUR
Net sales
11.2 %
Comparable EBITDA margin
0.38EUR per share
Dividend proposal by the Board of Directors
4BOARD REPORT
BUSINESS OVERVIEW
CORPORATERESPONSIBILITY
CORPORATE GOVERNANCE
FINANCIAL STATEMENTS
ANNUAL REPORT2018
2018201720162015
600
500
400
300
200
100
0
24
20
16
12
8
4
0
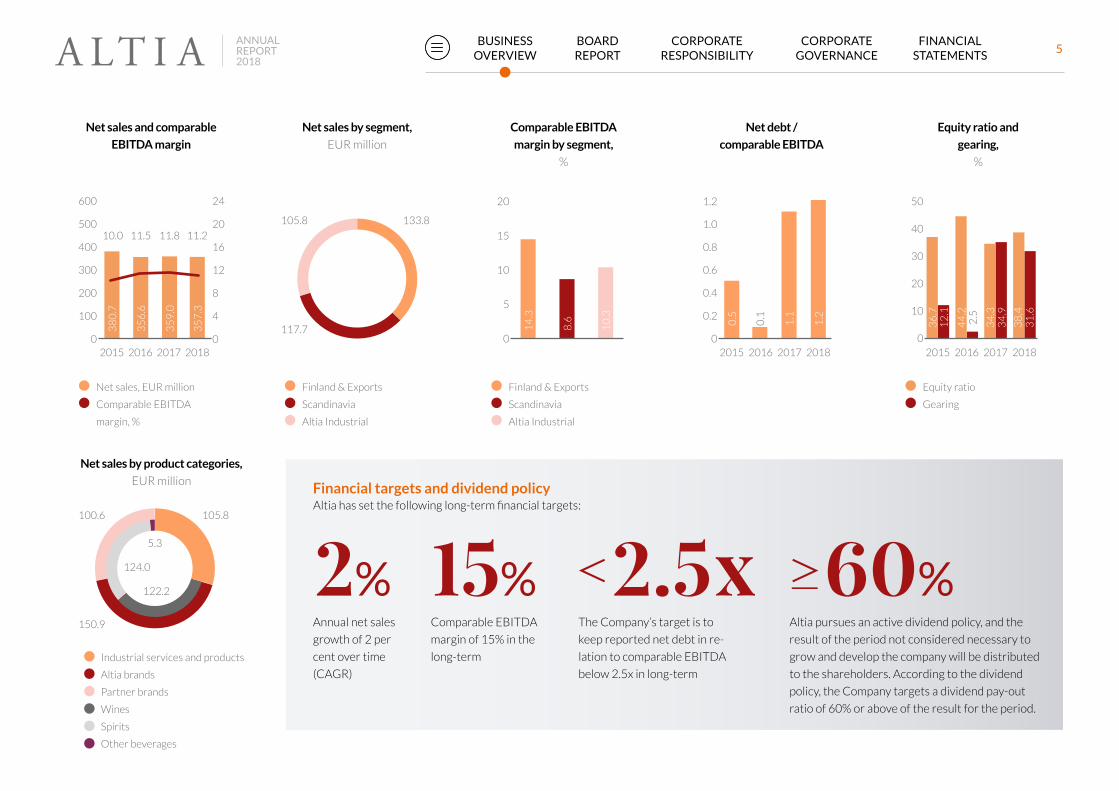
Net sales, EUR million
Comparable EBITDA
margin, %
Net sales and comparable
EBITDA margin
10.0 11.5
35
6.6
35
9.0
35
7.3
38
0.7
11.8 11.2
Finland & Exports
Scandinavia
Altia Industrial
Net sales by segment,
EUR million
133.8
117.7
105.8
Industrial services and products
Altia brands
Partner brands
Wines
Spirits
Other beverages
Net sales by product categories,
EUR million
105.8
150.9
100.6
5.3
124.0
122.2
20
15
10
5
0
Comparable EBITDA
margin by segment,
%
Finland & Exports
Scandinavia
Altia Industrial
14
.3
8.6
10
.3
2018201720162015
1.2
1.0
0.8
0.6
0.4
0.2
0
Net debt /
comparable EBITDA
0.1
0.5
1.1
1.2
50
40
30
20
10
02018201720162015
Equity ratio and
gearing,
%
Equity ratio
Gearing
34
.3
2.5
34
.9
44
.2
12
.13
6.7
38
.43
1.6
Financial targets and dividend policyAltia has set the following long-term financial targets:
Comparable EBITDA
margin of 15% in the
long-term
The Company’s target is to
keep reported net debt in re-
lation to comparable EBITDA
below 2.5x in long-term
Altia pursues an active dividend policy, and the
result of the period not considered necessary to
grow and develop the company will be distributed
to the shareholders. According to the dividend
policy, the Company targets a dividend pay-out
ratio of 60% or above of the result for the period.
≥ 60%< 2.5 x15%Annual net sales
growth of 2 per
cent over time
(CAGR)
2%
Industrial services and products
Altia brands
Partner brands
Wines
Spirits
Other beverages
Net sales by product categories,
EUR million
105.8
150.9
100.6
5.3
124.0
122.2
5BOARD REPORT
BUSINESS OVERVIEW
CORPORATERESPONSIBILITY
CORPORATE GOVERNANCE
FINANCIAL STATEMENTS
ANNUAL REPORT2018

Use of barley
Average alcoholic strength of A
ltia’
s o
wn
pro
du
ctio
n
31.3 %vol
Reduction in carbon dioxide emissions
54 % 211.7 million kg
Responsibility key figures 20182018 2017 2016
Produced or imported beverages (million liters) 95.1 93.8 90.0
Average alcoholic strength of Altia’s own production (% vol.) 31.3 31.7 31.6
Use of barley (million kg) 211.7 206.0 192.2
Reduction in Koskenkorva CO2 emissions
compared to 2014 base year 54% 56% 42%
Average waste recycling & reutilisation rate 99.7% 99.5% 99.5%
Water use (1 000 m3) 660.3 663.4 1 136.0
Sickness absence % 3.4 3.3 3.2
Number of accidents in relation to hours worked 13 11 8
6BOARD REPORT
BUSINESS OVERVIEW
CORPORATERESPONSIBILITY
CORPORATE GOVERNANCE
FINANCIAL STATEMENTS
ANNUAL REPORT2018
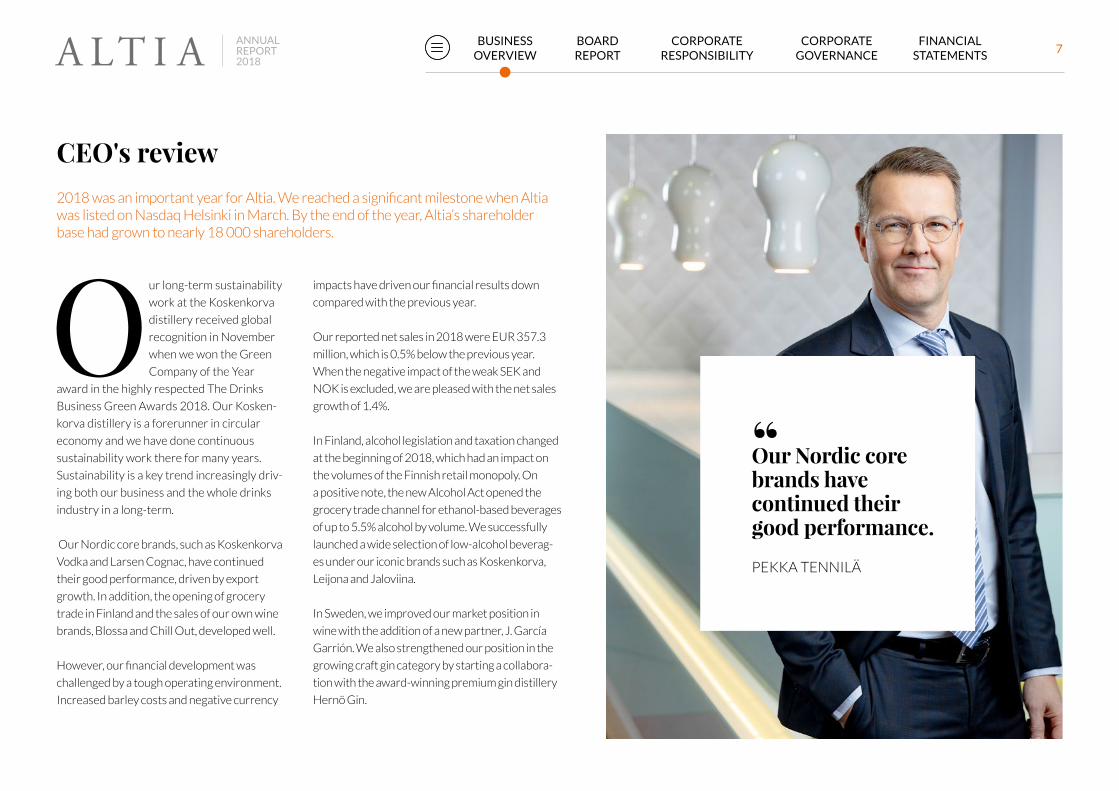
2018 was an important year for Altia. We reached a significant milestone when Altia was listed on Nasdaq Helsinki in March. By the end of the year, Altia’s shareholder base had grown to nearly 18 000 shareholders.
CEO's review
Our long-term sustainability
work at the Koskenkorva
distillery received global
recognition in November
when we won the Green
Company of the Year
award in the highly respected The Drinks
Business Green Awards 2018. Our Kosken-
korva distillery is a forerunner in circular
economy and we have done continuous
sustainability work there for many years.
Sustainability is a key trend increasingly driv-
ing both our business and the whole drinks
industry in a long-term.
Our Nordic core brands, such as Koskenkorva
Vodka and Larsen Cognac, have continued
their good performance, driven by export
growth. In addition, the opening of grocery
trade in Finland and the sales of our own wine
brands, Blossa and Chill Out, developed well.
However, our financial development was
challenged by a tough operating environment.
Increased barley costs and negative currency
impacts have driven our financial results down
compared with the previous year.
Our reported net sales in 2018 were EUR 357.3
million, which is 0.5% below the previous year.
When the negative impact of the weak SEK and
NOK is excluded, we are pleased with the net sales
growth of 1.4%.
In Finland, alcohol legislation and taxation changed
at the beginning of 2018, which had an impact on
the volumes of the Finnish retail monopoly. On
a positive note, the new Alcohol Act opened the
grocery trade channel for ethanol-based beverages
of up to 5.5% alcohol by volume. We successfully
launched a wide selection of low-alcohol beverag-
es under our iconic brands such as Koskenkorva,
Leijona and Jaloviina.
In Sweden, we improved our market position in
wine with the addition of a new partner, J. García
Garrión. We also strengthened our position in the
growing craft gin category by starting a collabora-
tion with the award-winning premium gin distillery
Hernö Gin.
Our Nordic core brands have continued their good performance.
PEKKA TENNILÄ
“
7BOARD REPORT
BUSINESS OVERVIEW
CORPORATERESPONSIBILITY
CORPORATE GOVERNANCE
FINANCIAL STATEMENTS
ANNUAL REPORT2018
Towards the year-end, we introduced an exten-
sive selection of Blossa glöggs, both in alcoholic
and non-alcoholic categories. Blossa Annual 18,
with the taste of limoncello and Mediterranean
herbs, was well received by consumers.
Taking the right steps in digitalising AltiaWork with our digital platforms viinimaa.fi and
folkofolk.se – which are our key channels in com-
municating directly with consumers in Finland
and Sweden – has proven successful and the site
traffic has increased. In May 2018, we opened a
new web-shop and brand site, nordicspirits.com,
for the German market with a selection of the
most iconic Nordic beverage brands such as
Koskenkorva Vodka, O.P. Anderson Aquavit and
Blossa Glögg.
Corporate responsibility at the core of our strategy 2018 marked the first year of Altia’s corporate
responsibility action programme for 2018–2020.
We continued our work as an amfori BSCI mem-
ber to ensure responsibility throughout our sup-
ply chain. Altogether, 21 audits were conducted
at our partners, suppliers or sub-suppliers.
To meet the increasing demand for ethically
certified wines, we applied for the Fair for Life
certification, which we were granted at the end
of 2018.
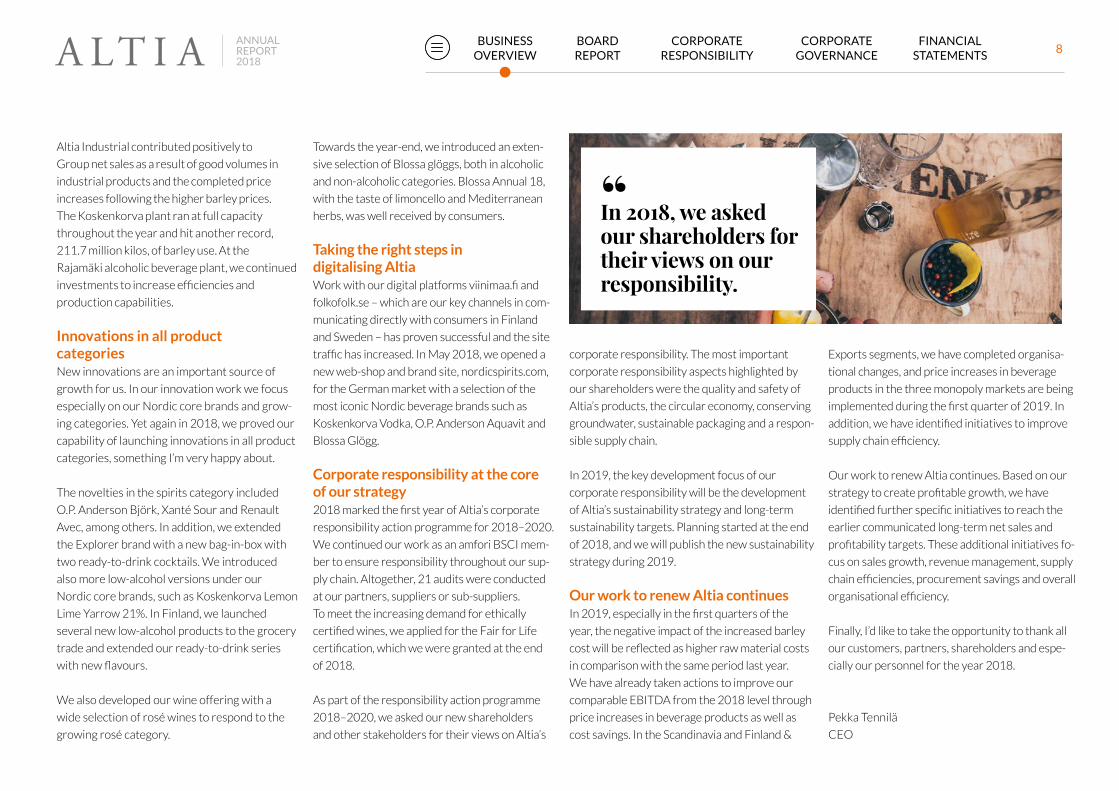
As part of the responsibility action programme
2018–2020, we asked our new shareholders
and other stakeholders for their views on Altia’s
Altia Industrial contributed positively to
Group net sales as a result of good volumes in
industrial products and the completed price
increases following the higher barley prices.
The Koskenkorva plant ran at full capacity
throughout the year and hit another record,
211.7 million kilos, of barley use. At the
Rajamäki alcoholic beverage plant, we continued
investments to increase efficiencies and
production capabilities.
Innovations in all product categoriesNew innovations are an important source of
growth for us. In our innovation work we focus
especially on our Nordic core brands and grow-
ing categories. Yet again in 2018, we proved our
capability of launching innovations in all product
categories, something I’m very happy about.
The novelties in the spirits category included
O.P. Anderson Björk, Xanté Sour and Renault
Avec, among others. In addition, we extended
the Explorer brand with a new bag-in-box with
two ready-to-drink cocktails. We introduced
also more low-alcohol versions under our
Nordic core brands, such as Koskenkorva Lemon
Lime Yarrow 21%. In Finland, we launched
several new low-alcohol products to the grocery
trade and extended our ready-to-drink series
with new flavours.
We also developed our wine offering with a
wide selection of rosé wines to respond to the
growing rosé category.
corporate responsibility. The most important
corporate responsibility aspects highlighted by
our shareholders were the quality and safety of
Altia’s products, the circular economy, conserving
groundwater, sustainable packaging and a respon-
sible supply chain.
In 2019, the key development focus of our
corporate responsibility will be the development
of Altia’s sustainability strategy and long-term
sustainability targets. Planning started at the end
of 2018, and we will publish the new sustainability
strategy during 2019.
Our work to renew Altia continuesIn 2019, especially in the first quarters of the
year, the negative impact of the increased barley
cost will be reflected as higher raw material costs
in comparison with the same period last year.
We have already taken actions to improve our
comparable EBITDA from the 2018 level through
price increases in beverage products as well as
cost savings. In the Scandinavia and Finland &
Exports segments, we have completed organisa-
tional changes, and price increases in beverage
products in the three monopoly markets are being
implemented during the first quarter of 2019. In
addition, we have identified initiatives to improve
supply chain efficiency.
Our work to renew Altia continues. Based on our
strategy to create profitable growth, we have
identified further specific initiatives to reach the
earlier communicated long-term net sales and
profitability targets. These additional initiatives fo-
cus on sales growth, revenue management, supply
chain efficiencies, procurement savings and overall
organisational efficiency.
Finally, I’d like to take the opportunity to thank all
our customers, partners, shareholders and espe-
cially our personnel for the year 2018.
Pekka Tennilä
CEO
In 2018, we asked our shareholders for their views on our responsibility.
“
8BOARD REPORT
BUSINESS OVERVIEW
CORPORATERESPONSIBILITY
CORPORATE GOVERNANCE
FINANCIAL STATEMENTS
ANNUAL REPORT2018

Altia’s year 2018
Altia introduced O.P. Anderson Aquavit to the US market Altia partnered with Frederick Wildman and Sons to bring the Swedish aquavit classic O.P. Anderson to the US market, where it was launched in the beginning of 2018.
January March
Altia strengthens distribution of Larsen Cognac in Asia Altia partnered with AsiaEuro to distribute Larsen Cognac in China and Hong Kong, Macau, Singapore, Malaysia and Indonesia. The long-term partnership includes distribu-tion of the entire Larsen range and two new cognacs – Larsen VSOP Reserve and Larsen XO Reserve – launched exclusively for AsiaEuro’s portfolio in Asia.
New Alcohol Act in Finland Finland’s new Alcohol Act opened the grocery trade channel outside of mo-nopolies for Altia’s noted brands, such as Koskenkorva, Leijona and Jaloviina.
Altia wins Grand Effie with Koskenkorva Vodka brand renewal Altia and Koskenkorva Vodka won the Grand Effie at the Effie Awards Finland 2017. Altia earned the Grand Effie prize with Koskenkorva Vodka brand renewal and marketing commu-nications campaign, launched in 2016.
Altia represents J. García Carrión’s wine portfolio in Sweden Altia became the exclusive rep-resentative of J. García Carrión’s wine portfolio in Sweden. J. García Carrión, founded in 1890, is one of the biggest wine producers in Europe and has wineries in ten D.O. areas in Spain.
Altia was listed on Nasdaq HelsinkiTrading in Altia’s shares started on the prelist of the Helsinki Stock Exchange on 23 March 2018, and on the official list of the Helsinki Stock Exchange on 27 March 2018.
Launch of Renault AvecRenault Avec is a Cognac created specifically to drink with coffee. Avec’s taste profile is achieved by using a new and unique process of cask-making that involves triple steaming and fire toasting. Renault Avec was placed 7th in The Spirits Business’ list of Top 50 innovative new spirits of 2018.
April
Launch of Leijona long drinks Altia launched Leijona long drinks on the Finnish grocery trade market. New long drink selection, Lei-jona Lonkero, consists of three fresh flavours: grape, lime and cranberry.
Launch of Koskenkorva Salmiakki alcohol-free Altia launched an alcohol-free version of the classic Koskenkorva Salmiakki liqueur in Finland.
May
Q1 report:Start of the year in line with expectations, compa-rable EBITDA improving.
Altia opened Nordic Spirits webshop and brand siteThe Nordic Spirits webshop opened for the German market with a selection of Altia’s most iconic beverage brands, such as Koskenkorva Vodka, O.P. Anderson Aquavit, Larsen Cognac and Blossa Glögg.
June
Launch of Koskenkorva VichyAltia launched Koskenkorva Vichy on the Finnish gro-cery trade market. Koskenkorva Vichy is a sugar-free low-ABV combination of car-bonated spring water, natural berry and fruit flavours and original Koskenkorva Vodka.
9BOARD REPORT
BUSINESS OVERVIEW
CORPORATERESPONSIBILITY
CORPORATE GOVERNANCE
FINANCIAL STATEMENTS
ANNUAL REPORT2018
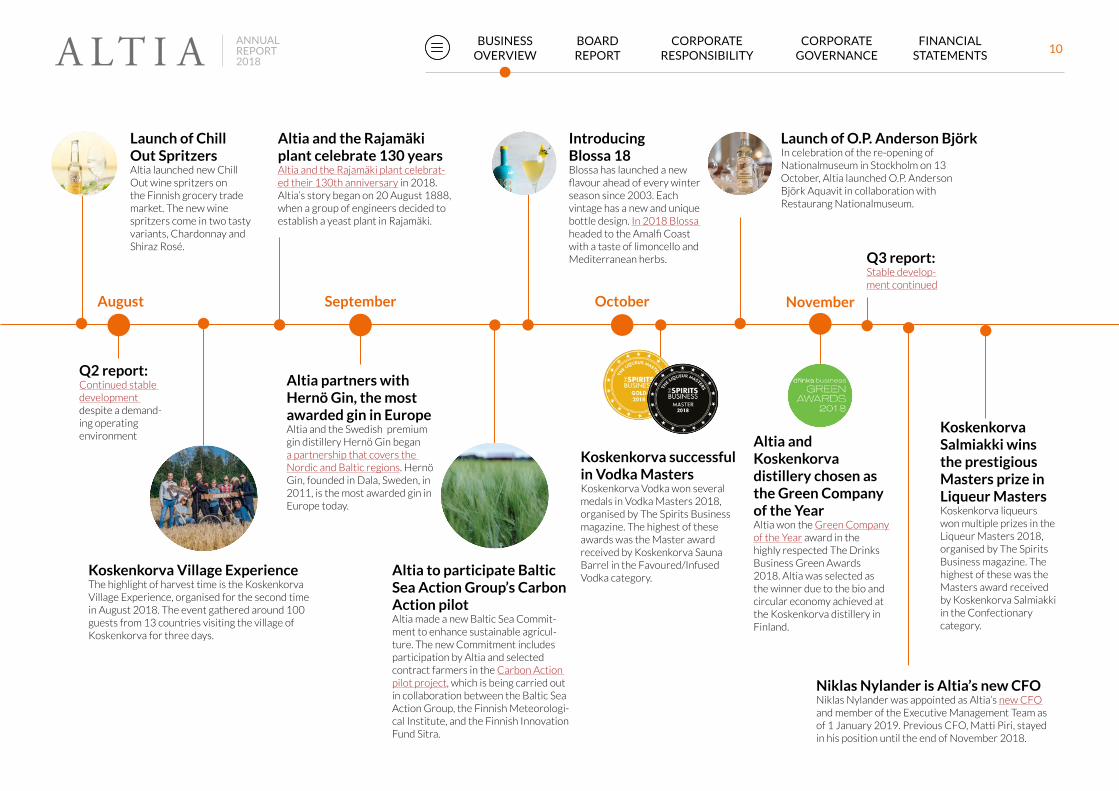
August
Launch of Chill Out SpritzersAltia launched new Chill Out wine spritzers on the Finnish grocery trade market. The new wine spritzers come in two tasty variants, Chardonnay and Shiraz Rosé.
Q2 report:Continued stable development despite a demand-ing operating environment
Altia and the Rajamäki plant celebrate 130 yearsAltia and the Rajamäki plant celebrat-ed their 130th anniversary in 2018. Altia’s story began on 20 August 1888, when a group of engineers decided to establish a yeast plant in Rajamäki.
Koskenkorva Village ExperienceThe highlight of harvest time is the Koskenkorva Village Experience, organised for the second time in August 2018. The event gathered around 100 guests from 13 countries visiting the village of Koskenkorva for three days.
Altia partners with Hernö Gin, the most awarded gin in Europe Altia and the Swedish premium gin distillery Hernö Gin began a partnership that covers the Nordic and Baltic regions. Hernö Gin, founded in Dala, Sweden, in 2011, is the most awarded gin in Europe today.
Altia to participate Baltic Sea Action Group’s Carbon Action pilotAltia made a new Baltic Sea Commit-ment to enhance sustainable agricul-ture. The new Commitment includes participation by Altia and selected contract farmers in the Carbon Action pilot project, which is being carried out in collaboration between the Baltic Sea Action Group, the Finnish Meteorologi-cal Institute, and the Finnish Innovation Fund Sitra.
Introducing Blossa 18Blossa has launched a new flavour ahead of every winter season since 2003. Each vintage has a new and unique bottle design. In 2018 Blossa headed to the Amalfi Coast with a taste of limoncello and Mediterranean herbs.
October
Koskenkorva successful in Vodka MastersKoskenkorva Vodka won several medals in Vodka Masters 2018, organised by The Spirits Business magazine. The highest of these awards was the Master award received by Koskenkorva Sauna Barrel in the Favoured/Infused Vodka category.
September
Launch of O.P. Anderson Björk In celebration of the re-opening of Nationalmuseum in Stockholm on 13 October, Altia launched O.P. Anderson Björk Aquavit in collaboration with Restaurang Nationalmuseum.
Altia and Koskenkorva distillery chosen as the Green Company of the Year Altia won the Green Company of the Year award in the highly respected The Drinks Business Green Awards 2018. Altia was selected as the winner due to the bio and circular economy achieved at the Koskenkorva distillery in Finland.
Koskenkorva Salmiakki wins the prestigious Masters prize in Liqueur Masters Koskenkorva liqueurs won multiple prizes in the Liqueur Masters 2018, organised by The Spirits Business magazine. The highest of these was the Masters award received by Koskenkorva Salmiakki in the Confectionary category.
Niklas Nylander is Altia’s new CFO Niklas Nylander was appointed as Altia’s new CFO and member of the Executive Management Team as of 1 January 2019. Previous CFO, Matti Piri, stayed in his position until the end of November 2018.
November
Q3 report:Stable develop-ment continued
10BOARD REPORT
BUSINESS OVERVIEW
CORPORATERESPONSIBILITY
CORPORATE GOVERNANCE
FINANCIAL STATEMENTS
ANNUAL REPORT2018
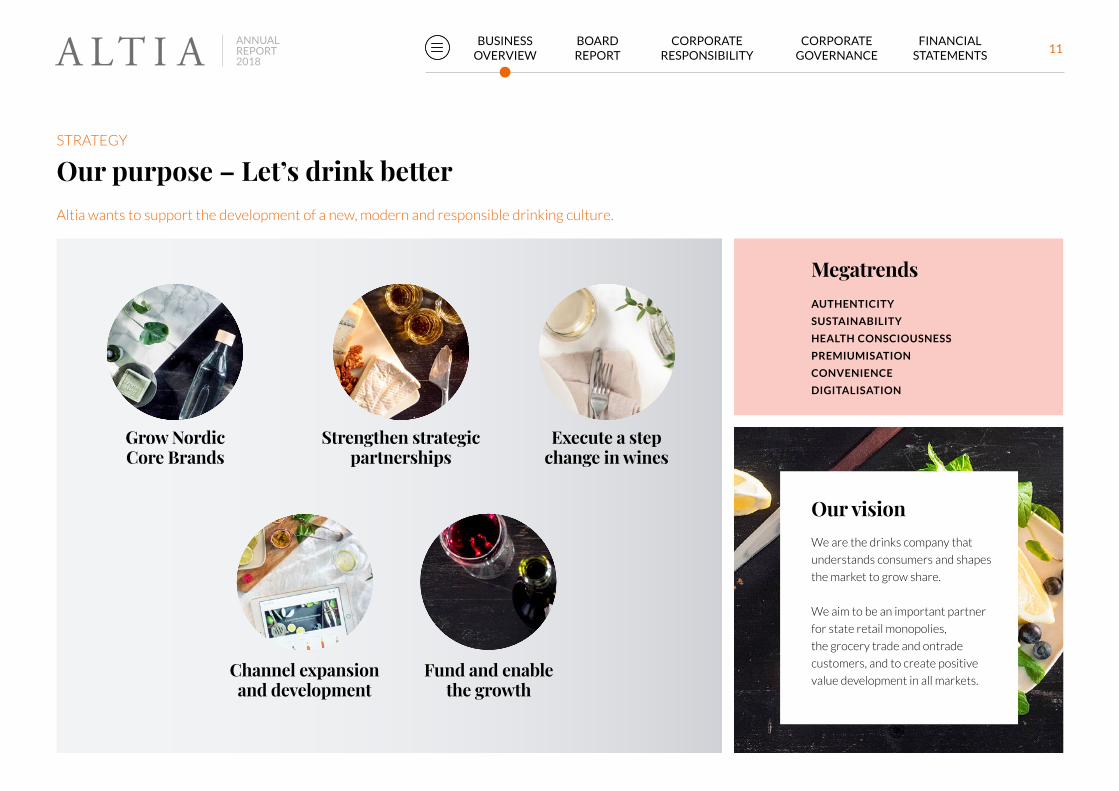
Altia wants to support the development of a new, modern and responsible drinking culture. Let's drink better.
STRATEGY
Channel expansion and development
Fund and enable the growth
Our visionWe are the drinks company that
understands consumers and shapes
the market to grow share.
We aim to be an important partner
for state retail monopolies,
the grocery trade and ontrade
customers, and to create positive
value development in all markets.
AUTHENTICITY
SUSTAINABILITY
HEALTH CONSCIOUSNESS
PREMIUMISATION
CONVENIENCE
DIGITALISATION
Strengthen strategic partnerships
Grow Nordic Core Brands
Execute a step change in wines
Megatrends
Our purpose – Let’s drink betterSTRATEGY
Altia wants to support the development of a new, modern and responsible drinking culture.
11BOARD REPORT
BUSINESS OVERVIEW
CORPORATERESPONSIBILITY
CORPORATE GOVERNANCE
FINANCIAL STATEMENTS
ANNUAL REPORT2018

Altia's strategy focuses on creating sustainable and profitable growth
Grow Altia’s Nordic core brandsOur iconic Nordic core brands are the expres-
sion of our long heritage in the Nordic region
and are among the region’s best-known spirit
and wine brands. Through continuous inno-
vation and product development supported
by efficient brand building and marketing, we
continue to introduce exciting novelties, line
extensions and new products under our Nordic
core brands. We target growing categories,
new consumer segments and occasions, as well
as new geographical markets. We expect to
grow both in volume and value in our home and
export markets.
Execute a step change in wines We continue to grow Altia’s own wine brands
portfolio by offering new products, brands and
packaging to meet Nordic market trends and
consumer needs. We focus on strengthening our
market shares in growing wine segments such as
sparkling and rosé wines, and on innovative wine-
based products such as aromatised wines.
Our extensive network of partners, and bulk
wine partners representing all wine categories
STRATEGY
and countries of origin relevant to Nordic
consumers and our customers, offers opportu-
nities for product innovation.
We also focus on addressing the growing con-
sumer demand for sustainability and ecological
wine sourcing and production, and modern
wine packaging such as tetras, pouches and
bag-in-boxes (BIB).
Strengthen strategic partnershipsWe continue to strengthen our strategic part-
nerships and offer the best route-to-market for
Nordic and Baltic consumers. We leverage our
extensive competences in sales and marketing
execution, and provide the necessary consum-
er and market insights to help our partners find
and develop new business opportunities cover-
ing the whole value chain – product and liquid
innovation, packaging solutions, production,
and warehousing and logistics services. Our
partners benefit from our distribution network
covering all relevant channels such as monop-
olies, on-trade, grocery trade and travel retail.
Further, partner brands are promoted through
Altia's digital platfroms.
Channel expansionWe continue to further develop Altia’s grocery
trade offering and the ready-to-drink (RTD)
category. We focus on category manage-
ment and launching new products and line
extensions in the growing segment of low and
non-alcoholic beverages.
Altia is a leading player in digital sales and mar-
keting in the Nordic wine and spirits market
through its digital platforms Viinimaa,
Folk-o-Folk, Joogikultuur and Nordicspirits.
com. We focus on continuously developing
our data-driven marketing capabilities, digital
reach, presence and visibility in the markets.
Fund and enable growth – Continuous improvement of overall efficiencyWe continuously improve overall efficiencies,
productivity, our capabilities and ways of work-
ing across the entire Group and in all functions.
We focus on areas such as procurement, the
supply chain, product portfolio management
and organisational efficiency.
Active brand portfolio managementWe continue to actively manage and develop
our brand portfolio. This may include poten-
tial selective acquisitions and/or divestments
to support growth in selected categories or
regions.
Let’s drink better
12BOARD REPORT
BUSINESS OVERVIEW
CORPORATERESPONSIBILITY
CORPORATE GOVERNANCE
FINANCIAL STATEMENTS
ANNUAL REPORT2018

Value created: Let’s drink better
OUR BUSINESS ACTIVITIES
OUR PEOPLE We employ 718 people with unique capabilities and knowhow.
OUR BRANDS We develop and build our own brands as well as those of the partners we represent.
OUR PARTNERS We build partnerships with our brand partners and develop relationships with suppliers.
PHYSICAL ASSETSWe have production, logistics and office sites in seven countries.
FINANCIAL CAPITALAltia’s total assets amounted to EUR 390.4 million in 2018.
NATURAL RESOURCESBarley, water and energy are key inputs for our activities. We utilise the resources efficiently – up to 100% in the case of barley.
EMPLOYEES: We provide meaningful work, inspiring targets and a possibility to make a difference.
• Employment and salaries• Meaningful work and on-the-job learning• Work-life balance• Occupational health and safety
OUR ASSETS
THE KEY TRENDS SHAPING OUR BUSINESS:
VALUE CREATED
SOCIETY: We are committed to promoting responsible alcohol consumption and take seriously the harm caused by alcohol misuse. We promote good working conditions in our supply chains.
• Responsible drinking culture• Support for Finnish agriculture• Significant tax contribution• Responsibility in supply chain• Transparency and good governance
CUSTOMERS & CONSUMERS: We offer products for positive occasions: higher quality, local production, lighter, organic, environmental friendly and ethically produced.
• Good and shared moments• New and innovative quality products• Unique and comprehensive brand portfolio,
consisting of locally produced products and leading international wine and spirit brands
ENVIRONMENT: We minimise the environmental impacts of our own production and promote sustainable practices in our value chain.
• Production based on circular economy principles
• Sustainable & recyclable packaging solutions• Sustainable agriculture• Conserving groundwater
Authenticity Sustainability Health consciousness Premiumisation Convenience Digitalisation
INDUSTRIAL PRODUCTS & SERVICESWe utilise efficiently the side-streams of our production
to produce a variety of end products and services.
At Koskenkorva distillery, the raw material and all the outputs are utilised fully, with no waste.
INNOVATION & CONTINUOUS IMPROVEMENT We continuously develop our offering and provide new products in premium, low-alcohol and non-alcohol categories. We improve our ways of working and
investigate new sources of improved operational performance.
LOGISTICS & WAREHOUSING
We operate own logistics centres
and cooperate with our suppliers and
partners to ensure sustainable logistics.
DISTILLING, MATURATION &
BLENDINGWe have distilleries
in Koskenkorva and Sundsvall,
production plants in Rajamäki and Taba-
salu, and production and aging cellars in
Cognac.
BOTTLING & PACKAGING
We use environmentally
friendly packaging materials and
efficient bottling systems.
SALES & MARKETING
We sell and market our products
responsibly to our customers in home and export markets.
OUR PRODUCTS
SOURCINGWe source Finnish barley, wine, other raw materials and
packaging materials to produce high
quality products, and purchase wines and spirits from our
partners.
TECHNICAL ETHANOLS
STARCH
FEED COMPONENTS
SPIRITS
OTHER BEVERAGES
WINES
13BOARD REPORT
BUSINESS OVERVIEW
CORPORATERESPONSIBILITY
CORPORATE GOVERNANCE
FINANCIAL STATEMENTS
ANNUAL REPORT2018

Koskenkorva plant uses 100% of the barley grain
Altia’s distillery in the village of Koskenkorva uses about 210 million kilos of Finnish barley a year. The distillery produces grain spirit for Altia’s alcoholic beverages. The Koskenkorva plant is based on bio and circular economy: 100% of the grain is utilised. None of it goes to waste. Altia received the Green Company of the Year 2018 award for the circular economy at the Koskenkorva distillery.
CIRCULAR ECONOMY
In addition to grain spirit, the Kosken-
korva plant produces several by-
products, such as starch and raw ma-
terial for animal feed. Even the carbon
dioxide generated in the fermentation
process is collected and used – for
example, in greenhouse cultivation. Barley
starch is used in the paper and board indus-
tries, as well as the food industry and brew-
eries. A versatile product range enables the
Koskenkorva plant’s unique material efficien-
cy. The barley husk that would otherwise not
be used in the Koskenkorva plant’s production
is incinerated in the plant’s own bioenergy
power plant, which supplies steam energy for
the distillery.
The 10-megawatt bioenergy power plant has
been operating at full capacity since January
2015, and it uses barley husk as its primary
fuel. Barley husk is peeled in Koskenkorva’s grain
spirit and starch production throughout the year.
In terms of technology and fuel mix, the Kosken-
korva bioenergy power plant is the first of its
kind in Finland.
Thanks to the bioenergy power plant and renew-
able fuel, the Koskenkorva plant has been able
to reduce its carbon dioxide emissions by over
50% since 2014. The plant’s steam generation
fuel self-sufficiency is about 60%. To make the
circular economy circle complete, ashes from the
bioenergy power plant are used as fertiliser on
the fields.
Altia was awarded as the Green Company of the
Year in the highly respected The Drinks Busi-
ness Green Awards 2018. Altia was selected as
the winner due to the bio and circular economy
achieved at the Koskenkorva distillery.
CO2
Koskenkorva Distillery &
bioenergy plant
Around 50% reduction in CO
2
emissions*
34-39% of barley grain is used in starch production
32-37% of barley grain is used in the production of feed components
AROUND 210 MILLION KG of Finnish barley a year
20-25% of barley grain is used in grain spirit production
TECHNICAL ETHANOL
ALCOHOLIC BEVERAGES
CIRCULAR ECONOMY
*In comparison with 2014
STARCHCAPTURED
GRAIN SPIRIT
ASHES
FEED
Around 60% fuel self-sufficiency rate in steam production
14BOARD REPORT
BUSINESS OVERVIEW
CORPORATERESPONSIBILITY
CORPORATE GOVERNANCE
FINANCIAL STATEMENTS
ANNUAL REPORT2018

Finland & ExportsThe Finland & Exports segment comprises the
import, sale and marketing of wines, spirits and
other beverages in Finland and the Baltics, as well as
exports and travel retail.
KEY OWN BRANDS:
Koskenkorva, Leijona, Jaloviina, Chill Out, Blossa, Renault,
Larsen, Saaremaa
KEY FOCUS AREAS:
• Developing ways of working with the state retail monopoly
to continue as an important partner
• Growing exports of key brands Koskenkorva, Larsen and
O.P. Anderson in the key markets of Russia, Asia and the
US, and capturing new markets
• Continuing to develop and grow grocery trade in Finland
through innovation and novelties
• Continuing to develop Altia’s digital reach via viinimaa.fi
and nordicspirits.com to consumers and customers
• Continuous evaluation of product portfolio and on-going
revenue management
EUR million 2018 2017 2016Net sales 133.8 133.9 133.9
Comparable EBITDA 19.2 19.6 20.2
Comparable EBITDA, % of net sales
14.3 14.6 15.0
Average number of personnel 95 100 104
SEGMENTS
Net sales by product category,
EUR million
Spirits
Wines
Other beverages
78.154.2
1.5
86.447.4
Altia brands
Partner brands
Net sales by brand group,
EUR million
Net sales by country,
%
6622
12
Finland
Travel Retail & Exports
Baltics
Read more about the segment's performance in 2018 on page 30
15BOARD REPORT
BUSINESS OVERVIEW
CORPORATERESPONSIBILITY
CORPORATE GOVERNANCE
FINANCIAL STATEMENTS
ANNUAL REPORT2018

ScandinaviaThe Scandinavia segment comprises the import,
sale and marketing of wines, spirits and other
beverages in Sweden, Norway and Denmark.
KEY OWN BRANDS:
O.P. Anderson, Explorer, Grönstedts, Koskenkorva, Blossa,
Chill Out, Larsen, Xanté
KEY FOCUS AREAS:
• Developing and growing the Nordic core brands through
innovations in new occasions and categories as well as with
line extensions
• Strengthening strategic wine and spirits partnerships and
cooperation throughout the value chain
• Continuing to develop Altia’s digital reach to consumers
and customers via folkofolk.se
• Continuous evaluation of product portfolio and on-going
revenue management
EUR million 2018 2017 2016Net sales 117.7 123.7 127.4
Comparable EBITDA 10.1 11.5 10.4
Comparable EBITDA, % of net sales
8.6 9.3 8.2
Average number of personnel 85 86 87
SEGMENTS
45.968.0
3.8
Net sales by product category,
EUR million
Spirits
Wines
Other beverages
64.453.3
Altia brands
Partner brands
Net sales by brand group,
EUR million
Net sales by country,
%
Sweden
Norway
Denmark
73
20
7
Read more about the segment's performance in 2018 on page 31
16BOARD REPORT
BUSINESS OVERVIEW
CORPORATERESPONSIBILITY
CORPORATE GOVERNANCE
FINANCIAL STATEMENTS
ANNUAL REPORT2018
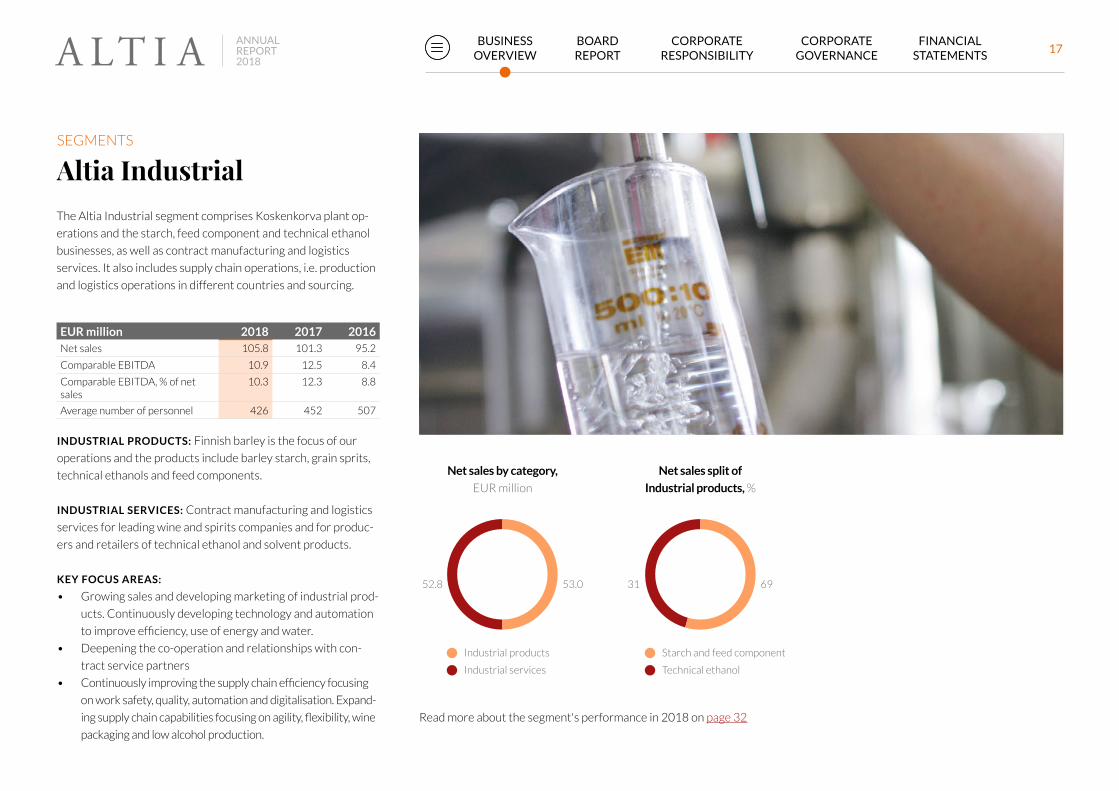
Altia IndustrialThe Altia Industrial segment comprises Koskenkorva plant op-
erations and the starch, feed component and technical ethanol
businesses, as well as contract manufacturing and logistics
services. It also includes supply chain operations, i.e. production
and logistics operations in different countries and sourcing.
INDUSTRIAL PRODUCTS: Finnish barley is the focus of our
operations and the products include barley starch, grain sprits,
technical ethanols and feed components.
INDUSTRIAL SERVICES: Contract manufacturing and logistics
services for leading wine and spirits companies and for produc-
ers and retailers of technical ethanol and solvent products.
KEY FOCUS AREAS:
• Growing sales and developing marketing of industrial prod-
ucts. Continuously developing technology and automation
to improve efficiency, use of energy and water.
• Deepening the co-operation and relationships with con-
tract service partners
• Continuously improving the supply chain efficiency focusing
on work safety, quality, automation and digitalisation. Expand-
ing supply chain capabilities focusing on agility, flexibility, wine
packaging and low alcohol production.
EUR million 2018 2017 2016Net sales 105.8 101.3 95.2
Comparable EBITDA 10.9 12.5 8.4
Comparable EBITDA, % of net sales
10.3 12.3 8.8
Average number of personnel 426 452 507
SEGMENTS
53.052.8
Industrial products
Industrial services
Net sales by category,
EUR million
6931
Starch and feed component
Technical ethanol
Net sales split of
Industrial products, %
Read more about the segment's performance in 2018 on page 32
17BOARD REPORT
BUSINESS OVERVIEW
CORPORATERESPONSIBILITY
CORPORATE GOVERNANCE
FINANCIAL STATEMENTS
ANNUAL REPORT2018
A ltia operates in the wine and
spirits markets in the Nordic
and Baltic countries, as well as
in travel retail in the Nordics.
These constitute Altia’s home
market.
The wine and spirits markets in Finland, Sweden
and Norway are highly regulated. The variations
in regulations between these countries have an
impact on national retail sales structures, adver-
tising and pricing mechanisms.
In the off-trade markets in Finland, Sweden
and Norway, the majority of wines and spirits
are sold through state retail monopolies (Alko,
Systembolaget and Vinmonopolet respectively),
which form Altia’s largest sales channel.
In the monopoly markets, grocery trade is a chan-
nel for low and non-alcoholic wines and glöggs,
ready-to-drink products (RTDs), beers and ciders.
In Denmark and the Baltics, the off-trade mar-
kets mainly consist of grocery trade.
The on-trade (“HoReCa”) channel plays an im-
portant role in new product launches and pro-
vides Altia with an opportunity to promote and
increase customers’ brand awareness as well as
monitor and affect future consumer trends.
Travel retail, comprising airline, sea and border
trade, has traditionally been an important
channel in the Nordic and Baltic region due to
price differences between countries caused by
different alcohol tax levels and duty-free sales.
All consumer product sales outside Altia’s home
market are defined as exports. Altia exports
alcoholic beverages to approximately 30 coun-
tries, for example, Koskenkorva Vodka to Russia
and the US, Larsen Cognac to China and O.P.
Anderson to the US.
Altia competes in the wine and spirits market
with global, Nordic and smaller local spirits
brands and wine producers and importers.
Compared to the spirits market, the wine mar-
ket is fragmented, as there are several smaller
producers, importers and distributors.
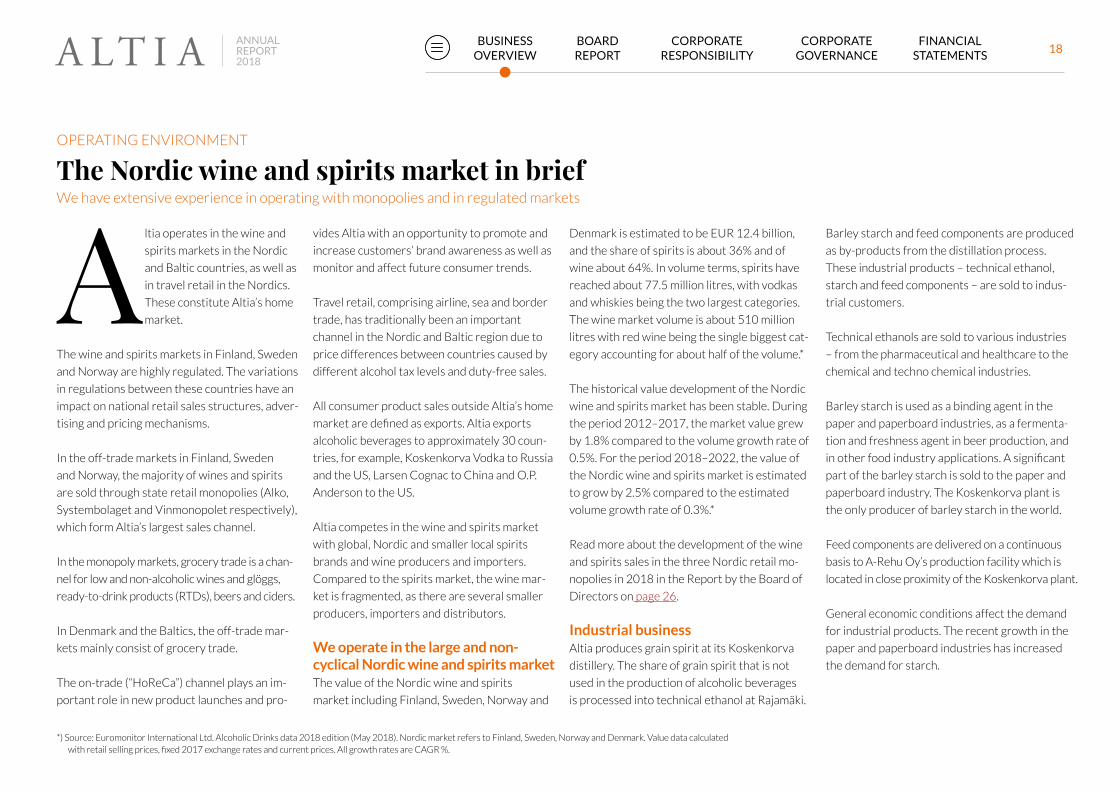
We operate in the large and non-cyclical Nordic wine and spirits market The value of the Nordic wine and spirits
market including Finland, Sweden, Norway and
Denmark is estimated to be EUR 12.4 billion,
and the share of spirits is about 36% and of
wine about 64%. In volume terms, spirits have
reached about 77.5 million litres, with vodkas
and whiskies being the two largest categories.
The wine market volume is about 510 million
litres with red wine being the single biggest cat-
egory accounting for about half of the volume.*
The historical value development of the Nordic
wine and spirits market has been stable. During
the period 2012–2017, the market value grew
by 1.8% compared to the volume growth rate of
0.5%. For the period 2018–2022, the value of
the Nordic wine and spirits market is estimated
to grow by 2.5% compared to the estimated
volume growth rate of 0.3%.*
Read more about the development of the wine
and spirits sales in the three Nordic retail mo-
nopolies in 2018 in the Report by the Board of
Directors on page 26.
Industrial business Altia produces grain spirit at its Koskenkorva
distillery. The share of grain spirit that is not
used in the production of alcoholic beverages
is processed into technical ethanol at Rajamäki.
Barley starch and feed components are produced
as by-products from the distillation process.
These industrial products – technical ethanol,
starch and feed components – are sold to indus-
trial customers.
Technical ethanols are sold to various industries
– from the pharmaceutical and healthcare to the
chemical and techno chemical industries.
Barley starch is used as a binding agent in the
paper and paperboard industries, as a fermenta-
tion and freshness agent in beer production, and
in other food industry applications. A significant
part of the barley starch is sold to the paper and
paperboard industry. The Koskenkorva plant is
the only producer of barley starch in the world.
Feed components are delivered on a continuous
basis to A-Rehu Oy’s production facility which is
located in close proximity of the Koskenkorva plant.
General economic conditions affect the demand
for industrial products. The recent growth in the
paper and paperboard industries has increased
the demand for starch.
OPERATING ENVIRONMENT
The Nordic wine and spirits market in briefWe have extensive experience in operating with monopolies and in regulated markets
*) Source: Euromonitor International Ltd. Alcoholic Drinks data 2018 edition (May 2018). Nordic market refers to Finland, Sweden, Norway and Denmark. Value data calculated with retail selling prices, fixed 2017 exchange rates and current prices. All growth rates are CAGR %.
18BOARD REPORT
BUSINESS OVERVIEW
CORPORATERESPONSIBILITY
CORPORATE GOVERNANCE
FINANCIAL STATEMENTS
ANNUAL REPORT2018

Our brand portfolio is well positioned to capture the growth pockets created by key market trends
AUTHENTICITY – In an uncertain and chang-
ing world, consumers seek what they can trust.
• Connoisseurship
• Locality, provenance and heritage
• Craftsmanship
SUSTAINABILITY – Consumers favour envi-
ronmentally-friendly packaging. Recyclability is
more important than ever.
• Ethical wellbeing
• Fairly traded
• Environmental responsibility
• Transparency
HEALTH CONSCIOUSNESS – There is an
increasing demand for low and non-alcoholic,
and lower sugar products. Natural ingredients
have become more important than ever.
• Balanced life
• Clean culture movement
• Freshness and simplicity
• Natural ingredients
PREMIUMISATION – Consumers seek quality
over quantity.
• Quality all around
• Scarcity is luxury
• Premium experiences
CONVENIENCE – Smaller serving sizes and
ready-to-drink solutions as well as easy to
serve and share.
• On-demand
• Easy access
• Convenient packaging
OPERATING ENVIRONMENT
19BOARD REPORT
BUSINESS OVERVIEW
CORPORATERESPONSIBILITY
CORPORATE GOVERNANCE
FINANCIAL STATEMENTS
ANNUAL REPORT2018
Our Nordic core brands
In 2018, we refined our portfolio of Nordic core brands to better reflect
strategic growth opportunities. The ambition is to achieve greater focus
and impact. Our key export brands are Koskenkorva Vodka, Larsen
Cognac and O.P. Anderson Aquavit. The focus for these brands is geo-
graphical growth and expanding their footprint into new channels and
technologies.
We are also investing in our other iconic Nordic brands, which are Chill Out,
Blossa and Xanté, as well as Leijona and Jaloviina in Finland, and Explorer and
Grönstedts in Sweden. In addition to these Nordic core brands, Altia has a
considerable portfolio of other local brands that play across categories and
price ties, enabling Altia to be involved where the consumer opportunities lie.
Everything we do starts with the consumer. Through continuous consumer
research, we have created a profound understanding of Nordic consumers
and their needs. Every development project is guided by strong consumer
engagement, whether innovation and product development or the marketing
of our brands. The continuous involvement of Altia’s own consumer community
enables us to be close to the people who love our brands and help us develop
them further.
Altia’s strategy is to create value through its brands. We have a unique portfolio of iconic brands, which are rooted in the Nordic heritage and are among the region’s best-known spirits and wine brands.
BRANDS
20BOARD REPORT
BUSINESS OVERVIEW
CORPORATERESPONSIBILITY
CORPORATE GOVERNANCE
FINANCIAL STATEMENTS
ANNUAL REPORT2018

Koskenkorva is a classic vodka made from nature’s best ingredi-
ents. Koskenkorva has been distilled in the village of Koskenkorva
since 1953. We use the northernmost grown barley, pure unfil-
tered groundwater and continuous distillation, which make for the
product’s unique style. Koskenkorva has won several awards in
international industry competitions.
Sustainability is an instrumental part of the Koskenkorva brand.
The Koskenkorva distillery is a forerunner in the bio and circular
economy. Altia and the Koskenkorva distillery won the 2018
Green Company of the Year, awarded by the Drinks Business
Green Awards.
The ambition for Koskenkorva is that it will become the world’s
most trusted and respected vodka.
Larsen Cognac is a combination of the open-minded and coura-
geous Scandinavian spirit and the craftmanship and expertise
of French Cognac connoisseurs. The history of the brand stems
from a young Norwegian adventurer, Jens Reidar Larsen. We
want to challenge the status quo of the Cognac industry and
explore new and surprising ways of consuming Cognac. Our
Cognac has a unique identity and style, just as Jens Reidar
always intended.
Larsen Cognac has recently been introduced to China and is
one of our key export brands.
The ambition for Larsen is that it will become the innovative
and original Cognac choice for brown spirit explorers.
Aquavit is an exciting, very Nordic, spirits category. The bar-
tender community sees it as an exquisite cocktail ingredient.
O.P. Anderson is the oldest and leading aquavit brand in
Sweden, and it is taking promising steps elsewhere in the
Nordics. The classic spice formula of O.P. Anderson has
inspired many of today’s aquavits. Although O.P. Anderson is
associated with tradition, it is the modern take on the brand
that makes it so exciting.
The O.P. Anderson organic Björk and the ready-to-drink
alternative respond to the more responsible drinking quest of
the modern consumer.
The ambition for O.P. Anderson is that it will become the
leader, going beyond the traditional aquavit category.
Our key export brandsBRANDS
21BOARD REPORT
BUSINESS OVERVIEW
CORPORATERESPONSIBILITY
CORPORATE GOVERNANCE
FINANCIAL STATEMENTS
ANNUAL REPORT2018

Key investment highlights
• Nordic market leader with a unique portfolio of iconic brands, which are rooted
in the Nordic heritage and are among the best known spirits and wine brands in the
region. In addition, Altia has an extensive wine portfolio including both own and nu-
merous well-known partner wine brands. Altia’s brand portfolio is in a good position to
meet both Nordic and global market trends. Read more about brands on page 20.
• Experience and scale that provide a strong capacity to operate in the stable and
profitable Nordic market. Our scale, wide assortment, product innovation capabili-
ties, market expertise and consumer knowledge place us in a good position to react to
the growth opportunities provided by market trends. Read more about the market on
page 18.
• Clear strategy that builds profitable growth. Read more about strategy on page 11.
• Altia’s integrated operating model enables full capacity utilisation. Operations and
resources are combined and shared between Altia’s own brands, partner brands and
industrial products. The integrated operating model allows a wider use of product de-
velopment and innovation capabilities as well as market knowledge. Sustainability is a
key success factor for Altia’s business operations. The Koskenkorva plant’s operations
are based on the circular economy, making use of one-hundred per cent of the barley
grain. Read more about the circular economy on page 14.
• An experienced management team with a proven record of creating and executing
Altia’s strategy. The management team members have strong and extensive experience
in the Nordic and Baltic alcohol markets as well as in operating in a brand-focused and
trend-driven market environment. Altia’s management is presented on page 106.
• Altia’s operations are characterised by stable and diversified revenue streams
underpinned by resilient consumption of wine and spirits. A significant part of Altia’s
net sales comes through the state alcohol retail monopolies in Finland, Sweden and
Norway. By focusing on improving profitability, carefully managing capital expenditure
requirements and efficiently managing working capital, Altia is able to support high
and stable cash flow that enables an attractive dividend yield. Read more in the
Financial Statements from page 108 onwards.
ALTIA AS AN INVESTMENT
04/2018
12/2018
11/2018
08/2018
07/2018
06/2018
05/2018
10/2018
09/2018
Altia
150
125
100
75
50
Share price development
Share quotations, index 100 = 23.3.2018
OMXHBPI
Ownership structure as at 31 Dec 2018
Shareholders by sector,
% of shares
Public sector
Financial and insurance corporations
Households
Non-financial corporations
Non-profit institutions
Rest of the world
Share of nominee-registered shares was 26.7%
44.7
29.8
18.2
4.02.7 0.7
Ownership structure as at 31 Dec 2018
Shareholders by sector,
% of shares
Public sector
Financial and insurance corporations
Households
Non-financial corporations
Non-profit institutions
Rest of the world
Share of nominee-registered shares was 26.7%
44.7
29.8
18.2
4.02.7 0.7
Source: Nasdaq Helsinki
Source: Euroclear Finland
Key information about Altia’s share
Market: Nasdaq Helsinki Ltd.
Sector: Food & Beverage/ Consumer goods
Trading code: ALTIA
ISIN code: FI4000292438
Listing date: 23 March 2018
Market cap: EUR 256 million
High: EUR 9.50
Low: EUR 7.015
Closing: EUR 7.07
2018
22BOARD REPORT
BUSINESS OVERVIEW
CORPORATERESPONSIBILITY
CORPORATE GOVERNANCE
FINANCIAL STATEMENTS
ANNUAL REPORT2018

Information for shareholders IPO in briefTHE INITIAL PUBLIC OFFERING (IPO) OF ALTIA was carried out during March
2018. The IPO attracted strong demand and was significantly oversubscribed.
The IPO included a share sale by the State of Finland of 23 000 000 existing
shares to private individuals and entities in Finland and to institutional inves-
tors as private placements in Finland and internationally, as well as an issue of
180 485 new shares to the permanent employees of Altia in Finland and Sweden.
The subscription price for the sale shares was set at EUR 7.50 per sale share and
EUR 6.75 per share in the personnel offering. A total of 6 000 000 shares were
allocated to private individuals and entities in Finland, and 17 000 000 shares
were allocated to institutional investors. Approximately 16 500 investors submit-
ted a subscription commitment in the public share sale.
Following the IPO, Altia’s market capitalisation was approximately EUR 271.1
million. Trading in Altia’s shares commenced on Nasdaq Helsinki on 23 March 2018.
Find out more about the IPO on our website at
www.altiagroup.com/ipo
CASE
Annual General MeetingAltia’s Annual General Meeting (AGM)
is planned to be held on Wednesday,
15 May 2019 in Merikaapelihalli in
Kaapelitehdas, at Tammasaarenlaituri 5,
entrance M1, Helsinki.
Participation
Instructions for those wishing to attend the
AGM are given in the notice to the meeting
which will be published on Altia’s website at
www.altiagroup.com/agm2019.
Dividend proposal
The Board of Directors proposes to the AGM
that a dividend of EUR 0.38 per share be
distributed for the financial period ending 31
December 2018.
7 February Financial Statements Bulletin 2018
Week 12 Annual Report 2018
8 May Business Review for January–March 2019
15 August Half-Year Report for January–June 2019
7 November Business Review for January–September 2019
Financial information in 2019
ALTIA AS AN INVESTMENT
Altia applies a silent period of 30 days be-
fore the publication of financial statements,
half-yearly reports and interim reports.
Updated information about Altia and the
financial calendar can be found at
www.altiagroup.com/investors. Investor
Relations contacts can be found on the website.
23BOARD REPORT
BUSINESS OVERVIEW
CORPORATERESPONSIBILITY
CORPORATE GOVERNANCE
FINANCIAL STATEMENTS
ANNUAL REPORT2018

Report by the Board of Directors
24BOARD REPORT
BUSINESS OVERVIEW
CORPORATERESPONSIBILITY
CORPORATE GOVERNANCE
FINANCIAL STATEMENTS
ANNUAL REPORT2018

KEY RATIOS
2018 2017 2016
Net sales, EUR million 357.3 359.0 356.6
Comparable EBITDA, EUR million 40.0 42.4 40.8
% of net sales 11.2 11.8 11.5
EBITDA, EUR million 34.0 40.3 60.8*
Comparable operating result, EUR million 25.6 28.2 26.4
% of net sales 7.2 7.8 7.4
Operating result, EUR million 19.7 26.1 46.3
Result for the period, EUR million 15.1 18.3 36.1
Earnings per share, EUR 0.42 0.51 1.00
Net debt / comparable EBITDA 1.2 1.1 0.1
Average number of personnel 718 762 829
*) Year 2016 included a net gain of EUR 16.3 million on settlement of defined pension benefit obligation, which has been considered as an item affecting comparability for the year ended 31 December 2016.
Altia Group’s 2018 financial statements are prepared in accordance with IFRS. Comparative information is based on corresponding figures for 2017 (figures in brackets), unless otherwise stated.
A ltia is a leading Nordic alco-
holic beverage brand com-
pany operating in the wines
and spirits markets in the
Nordic countries, Estonia
and Latvia. We produce,
import, market, sell and distribute both own
and partner brand beverages. We also have
production in Cognac, France. Further, Altia
exports alcoholic beverages to approximately
30 countries.
Report by the Board of Directors
Altia’s financial development in 2018 was
challenged by external factors in the operating
environment. Increased raw material costs
and the negative impact from currencies have
driven financial results down.
When excluding the negative impact from
currencies, net sales grew by 1.4%. Altia’s Nordic
core brands such as Koskenkorva Vodka and
Larsen Cognac continued to perform at a good
level driven by growth in exports. In addition,
25BOARD REPORT
BUSINESS OVERVIEW
CORPORATERESPONSIBILITY
CORPORATE GOVERNANCE
FINANCIAL STATEMENTS
ANNUAL REPORT2018
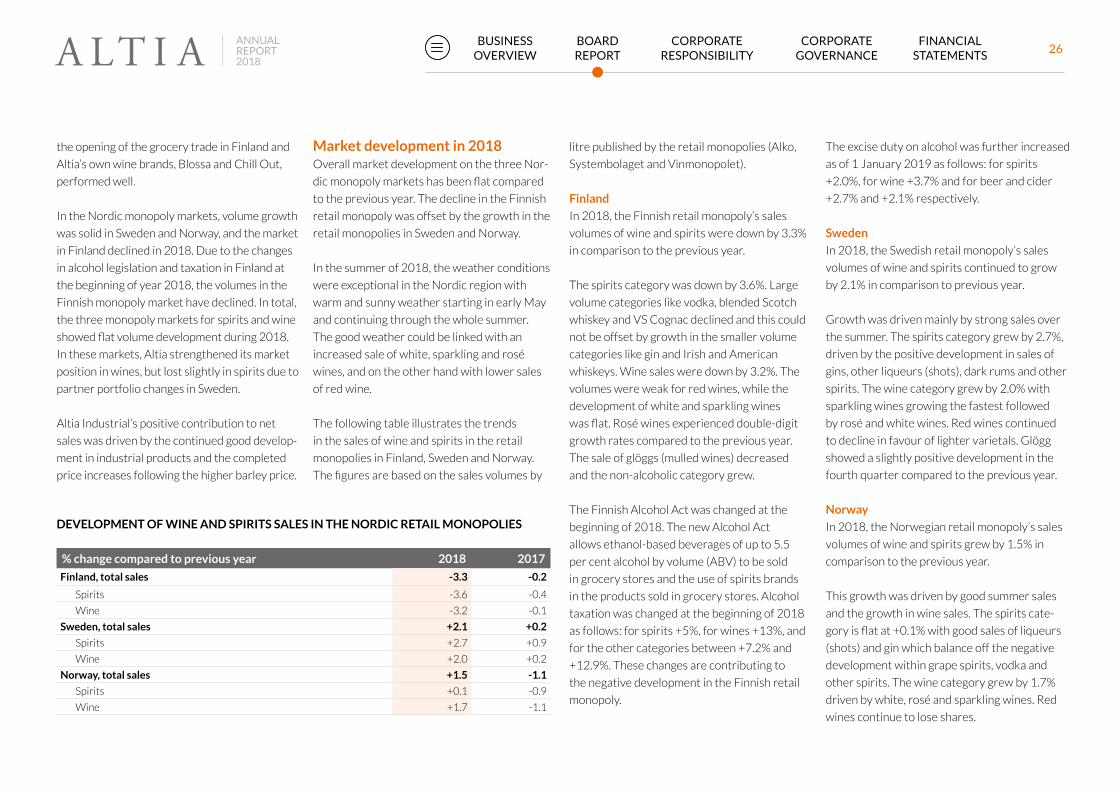
DEVELOPMENT OF WINE AND SPIRITS SALES IN THE NORDIC RETAIL MONOPOLIES
% change compared to previous year 2018 2017
Finland, total sales -3.3 -0.2
Spirits -3.6 -0.4
Wine -3.2 -0.1
Sweden, total sales +2.1 +0.2
Spirits +2.7 +0.9
Wine +2.0 +0.2
Norway, total sales +1.5 -1.1
Spirits +0.1 -0.9
Wine +1.7 -1.1
the opening of the grocery trade in Finland and
Altia’s own wine brands, Blossa and Chill Out,
performed well.
In the Nordic monopoly markets, volume growth
was solid in Sweden and Norway, and the market
in Finland declined in 2018. Due to the changes
in alcohol legislation and taxation in Finland at
the beginning of year 2018, the volumes in the
Finnish monopoly market have declined. In total,
the three monopoly markets for spirits and wine
showed flat volume development during 2018.
In these markets, Altia strengthened its market
position in wines, but lost slightly in spirits due to
partner portfolio changes in Sweden.
Altia Industrial’s positive contribution to net
sales was driven by the continued good develop-
ment in industrial products and the completed
price increases following the higher barley price.
Market development in 2018Overall market development on the three Nor-
dic monopoly markets has been flat compared
to the previous year. The decline in the Finnish
retail monopoly was offset by the growth in the
retail monopolies in Sweden and Norway.
In the summer of 2018, the weather conditions
were exceptional in the Nordic region with
warm and sunny weather starting in early May
and continuing through the whole summer.
The good weather could be linked with an
increased sale of white, sparkling and rosé
wines, and on the other hand with lower sales
of red wine.
The following table illustrates the trends
in the sales of wine and spirits in the retail
monopolies in Finland, Sweden and Norway.
The figures are based on the sales volumes by
litre published by the retail monopolies (Alko,
Systembolaget and Vinmonopolet).
Finland
In 2018, the Finnish retail monopoly’s sales
volumes of wine and spirits were down by 3.3%
in comparison to the previous year.
The spirits category was down by 3.6%. Large
volume categories like vodka, blended Scotch
whiskey and VS Cognac declined and this could
not be offset by growth in the smaller volume
categories like gin and Irish and American
whiskeys. Wine sales were down by 3.2%. The
volumes were weak for red wines, while the
development of white and sparkling wines
was flat. Rosé wines experienced double-digit
growth rates compared to the previous year.
The sale of glöggs (mulled wines) decreased
and the non-alcoholic category grew.
The Finnish Alcohol Act was changed at the
beginning of 2018. The new Alcohol Act
allows ethanol-based beverages of up to 5.5
per cent alcohol by volume (ABV) to be sold
in grocery stores and the use of spirits brands
in the products sold in grocery stores. Alcohol
taxation was changed at the beginning of 2018
as follows: for spirits +5%, for wines +13%, and
for the other categories between +7.2% and
+12.9%. These changes are contributing to
the negative development in the Finnish retail
monopoly.
The excise duty on alcohol was further increased
as of 1 January 2019 as follows: for spirits
+2.0%, for wine +3.7% and for beer and cider
+2.7% and +2.1% respectively.
Sweden
In 2018, the Swedish retail monopoly’s sales
volumes of wine and spirits continued to grow
by 2.1% in comparison to previous year.
Growth was driven mainly by strong sales over
the summer. The spirits category grew by 2.7%,
driven by the positive development in sales of
gins, other liqueurs (shots), dark rums and other
spirits. The wine category grew by 2.0% with
sparkling wines growing the fastest followed
by rosé and white wines. Red wines continued
to decline in favour of lighter varietals. Glögg
showed a slightly positive development in the
fourth quarter compared to the previous year.
Norway
In 2018, the Norwegian retail monopoly’s sales
volumes of wine and spirits grew by 1.5% in
comparison to the previous year.
This growth was driven by good summer sales
and the growth in wine sales. The spirits cate-
gory is flat at +0.1% with good sales of liqueurs
(shots) and gin which balance off the negative
development within grape spirits, vodka and
other spirits. The wine category grew by 1.7%
driven by white, rosé and sparkling wines. Red
wines continue to lose shares.
26BOARD REPORT
BUSINESS OVERVIEW
CORPORATERESPONSIBILITY
CORPORATE GOVERNANCE
FINANCIAL STATEMENTS
ANNUAL REPORT2018

Strategy and financial targetsThe core of Altia’s strategy is to deliver profita-
ble growth through the five strategic streams:
• Grow Nordic core brands
• Execute a step change in wines
• Strengthen strategic partnerships
• Channel expansion and development
• Fund and enable growth - Efficiency and
performance initiatives.
To support the abovementioned organic
strategic streams, Altia continues an active
brand portfolio management, which includes
potential selective acquisitions and/or
divestments.
Financial targets
Altia has set the following long-term financial
targets:
• Comparable EBITDA margin of 15% in the
long-term
• Annual net sales growth of 2 per cent over
time (CAGR)
• The target is to keep reported net debt
in relation to comparable EBITDA below
2.5x in long-term
Dividend policy
Altia pursues an active dividend policy, and the
result of the period not considered necessary
to grow and develop the Company will be
distributed to the shareholders. According
to the dividend policy, the Company targets a
dividend pay-out ratio of 60% or above of the
result for the period.
Key events in 2018
Initial public offering (IPO)
The IPO of Altia Plc was carried out during
March 2018. The IPO included a share sale by
the State of Finland and a personnel offering
to the permanent employees of Altia in Finland
and Sweden.
Growth of Nordic core brands
During 2018, Altia’s Nordic core brands have
developed well and the positive development
of exports plays an important role. The exports
of Larsen Cognac to Asia was started at the
beginning of the year. For Koskenkorva Vodka
Russia is an important market and in the US
Altia continues to strengthen distribution.
With O.P. Anderson Aquavit Altia is targeting
the US market.
Altia has launched innovations under the
Nordic core brands. For example, Renault Avec
cognac for which an innovative maturation
method has been used. Further, launches have
been made for Explorer vodka, Xanté liqueur,
O.P Anderson Aquavit and Koskenkorva
Vodka.
Innovations in wine
During 2018, Altia continued to develop its
wine offering by bringing several wine novel-
ties to the Nordic retail monopolies. Among
others, an extensive line up of rosé wines to re-
spond to the strong rosé wine trend especially
during the summer. The portfolio of sparkling
wines was also added with new products such
as Amies Amies and the aromatised sparkling
Say Blush in Sweden. In the red wine category,
Altia launched its own innovation Novellus
both in Sweden and Finland. In the glögg cat-
egory, Altia presented an extensive line up of
Blossa glöggs and a new Blossa Annual.
Partner wines representing global wine re-
gions in all categories play an important role in
Altia’s overall wine portfolio.
New strategic partnerships
During 2018, Altia strengthened its market
position on the large Swedish wine market with
the addition of a new strategic partner, García
Carrión.
In addition, Altia further strengthened its gin
portfolio on the Swedish market with the start
of collaboration with the award-winning Swed-
ish premium gin producer Hernö Gin.
Channel expansion
In the beginning of 2018, the grocery trade
opened up for Altia in Finland. During the
year, Altia has proved its innovation capabil-
ity and presented a extensive line up of new
products under its Nordic core brands such as
Koskenkorva Vichy and Village series, Leijona
and Jaloviina long drinks. The distribution of
the new low-alcohol (ABV below 5.5%) grocery
trade products has developed well.
Altia continuously develops its digital platforms
Viinimaa in Finland and folkofolk in Sweden.
Through more focused initiatives and optimised
content, the user traffic to the sites has increased.
In May 2018, Altia opened a webshop for Nor-
dic alcoholic beverages on the German market
– www.nordicspirits.com.
Financial reviewIn 2018, Altia’s reported net sales amounted
to EUR 357.3 (359.0) million, corresponding
to a decrease of 0.5%. The impact of the weak
SEK and NOK is significant as the net sales in
constant currencies grew by 1.4%. The net sales
of both the Finland & Exports and the Scandina-
via segments in constant currencies were at the
same level as last year. Altia Industrial’s net sales
increased mainly as a result of price increases
due to the barley cost push and good volumes in
industrial products.
The net sales of spirits declined from last
year due to lower volumes in Finland, partner
portfolio changes in Sweden and the currency
impact. The decline was partly offset by growth
in exports and grocery trade in Finland. Despite
the good volume development in wine, the net
sales declined driven by the currency impact.
27BOARD REPORT
BUSINESS OVERVIEW
CORPORATERESPONSIBILITY
CORPORATE GOVERNANCE
FINANCIAL STATEMENTS
ANNUAL REPORT2018

NET SALES BY SEGMENT
EUR million 2018 2017 Change, %
Finland & Exports 133.8 133.9 -0.1
Scandinavia 117.7 123.7 -4.9
Altia Industrial 105.8 101.3 4.4
TOTAL 357.3 359.0 -0.5
NET SALES BY PRODUCT CATEGORY
EUR million 2018 2017 Change, %
Spirits 124.0 125.9 -1.5
Wine 122.2 124.7 -2.0
Other beverages 5.3 8.4 -37.2
Industrial products and services 105.8 101.3 4.4
Other 0.0 -1.3
TOTAL 357.3 359.0 -0.5
COMPARABLE EBITDA BY SEGMENT
EUR million 2018 2017
Finland & Exports 19.2 19.6
Scandinavia 10.1 11.5
Altia Industrial 10.9 12.5
Other -0.3 -1.1
TOTAL 40.0 42.4
% net sales 11.2 11.8
ITEMS AFFECTING COMPARABILITY
EUR million 2018 2017
Comparable EBITDA 40.0 42.4
Net gains or losses from business and assets disposals 0.4 1.3
Cost for closure of business operations and restructurings -1.1 -1.1
Major corporate projects
Costs related to the closed voluntary pension scheme -0.7
Costs related to a planned stock exchange listing -4.6 -2.4
Total items affecting comparability -6.0 -2.1
EBITDA 34.0 40.3
In 2018, the comparable EBITDA, i.e. EBITDA
excluding items affecting comparability (IAC),
was EUR 40.0 (42.4) million, which is 11.2%
(11.8%) of net sales. Items affecting compa-
rability totalled EUR -6.0 (-2.1) million out
of which EUR 4.6 million relate to the initial
public offering of Altia. In addition, restructur-
ing costs from efficiency measures in Finland
and Sweden as well as costs related to the
closed voluntary pension schemes impact the
IAC amount. Reported EBITDA was EUR 34.0
(40.3) million.
Other operating income amounted to EUR 7.4
(8.3) million, consisting mainly of proceeds of
sales of fixed assets of EUR 0.5 (1.6) million;
income from the sales of steam, energy and
water of EUR 3.4 (3.4) million; and rental
income of EUR 1.4 (1.0) million.
Employee benefit expenses totalled EUR 49.9
(52.0) million, including EUR 37.9 (40.4) million
in wages and salaries.
Other operating expenses amounted to EUR
73.9 (72.9) million.
Net financial expense amounted to EUR 2.3
(1.9) million. The share of profit in associates
and income from interests in joint operations
totalled EUR 1.2 (0.9) million.
Taxes for the reporting period were EUR 3.6
(6.7) million which corresponds to an effective
tax rate of 19.1% (27.0%). In 2017, the effec-
tive tax rate was high due to a re-assessment of
deferred tax liability relating to Estonia.
The result for the period amounted to EUR
15.1 (18.3) million, and earnings per share
were EUR 0.42 (0.51).
Cash flow, balance sheet and investments
Net cash flow from operations in 2018 totalled
EUR 6.5 (37.6) million. The decline in cash
flow is driven by the development in working
capital, the decline in reported profits includ-
ing the costs from the IPO and other items
reported under items affecting comparability
as well as the taxes paid during the financial
year. On the working capital side, the receiva-
bles increased by EUR 7.4 million driven by the
channel expansion in exports and the offering
28BOARD REPORT
BUSINESS OVERVIEW
CORPORATERESPONSIBILITY
CORPORATE GOVERNANCE
FINANCIAL STATEMENTS
ANNUAL REPORT2018

in grocery trade. Especially the impact from the
Chinese New Year is visible in the last quarter
of the year. Also, the increased overall volumes
in the Altia Industrial segment and the higher
invoicing at the end of the year for increased
barley costs are further boosting the receiva-
bles. The EUR 5.5 million increase in inventory
is driven mainly by increased purchases of
barley at the end of the year due to barley
market fluctuations. In addition, extended
grocery trade offering, new partner brands as
well as the increased volumes in Altia Industri-
al segment impacted the inventory level. The
negative impact from trade and other payables
amounted to EUR 4.3 million in the year-end as
the payables were not optimised to offset the
increased asset levels. Taxes paid during the
year were based on a taxable income estimate
for the year. The estimate used exceeded the
currently expected outcome thus generating a
too high cash tax outflow for the year.
In total, the receivables sold amounted to EUR
80.2 (83.6) million at the end of the period.
At the end of the period, the Group’s net debt
amounted to EUR 47.4 (47.7) million and the
reported net debt to comparable EBITDA ratio
was 1.2 (1.1). Gearing was 31.6% (34.9%) and
equity ratio was 38.4% (34.3%).
The Group’s liquidity reserve comprised a
revolving credit facility of EUR 60.0 million of
which EUR 0.0 (10.0) million was in use as well
as an overdraft facility of EUR 10.0 million,
which was unused as of 31 December 2018
and 2017. Altia Group’s liquidity position was
good throughout the review period.
The total in the consolidated balance sheet
decreased to EUR 390.4 (398.4) million.
Gross capital expenditure totalled EUR 7.7
(11.9) million. Capital expenditure was primar-
ily related to investments at the Rajamäki plant
and the further development of information
technology and digital capabilities.
BALANCE SHEET KEY FIGURES
2018 2017
Reported net debt / comparable EBITDA 1.2 1.1
Borrowings, EUR million 89.4 100.1
Net debt, EUR million 47.4 47.7
Equity ratio, % 38.4 34.3
Gearing, % 31.6 34.9
Capital expenditure, EUR million -7.7 -11.9
Total assets, EUR million 390.4 398.4
29BOARD REPORT
BUSINESS OVERVIEW
CORPORATERESPONSIBILITY
CORPORATE GOVERNANCE
FINANCIAL STATEMENTS
ANNUAL REPORT2018

EUR million 2018 2017 Change, %
Net sales 133.8 133.9 -0.1
Comparable EBITDA 19.2 19.6 -1.9
Comparable EBITDA, % of net sales 14.3 14.6
Average number of personnel 95 100
EUR million 2018 2017 Change, %
Spirits 78.1 76.1 2.6
Wine 54.2 56.3 -3.7
Other beverages 1.5 1.3 11.6
Other 0.2
TOTAL 133.8 133.9 -0.1
Business reviewFinland & Exports
The Finland & Exports segment comprises the import, sale and marketing of wine and spirits, and other
beverages in Finland and the Baltics, as well as travel retail and exports.
In 2018, net sales for the Finland & Exports
segment were EUR 133.8 (133.9) million.
The positive development in exports of Altia’s
Nordic core brands and the good devel-
opment in the Finnish grocery trade have
offset the challenges in the segment’s other
markets. In exports, the opening of the Asian
distribution for Larsen Cognac in particular
has contributed to its growth. Throughout
the year, the spirits and wine volumes of the
Finnish retail monopoly have been at a lower
level compared to the previous year, which
has impacted Altia’s monopoly sales of spirits
and wine negatively. However, despite of the
volume decline, Altia’s market shares both in
spirits and wine have remained on the same
level as last year. The net sales in travel retail
and the Baltics continued to decline driven
mainly by weak development in sea traffic and
Tallinn harbour trade.
In 2018, the comparable EBITDA was EUR
19.2 (19.6) million, which equals a comparable
EBITDA margin of 14.3% (14.6%). Profitability
has been impacted by the weak monopoly and
travel retail sales, but with the cost control of
operating expenses the impact has been largely
mitigated.
Business events in 2018
Since the beginning of 2018, Altia has launched
a good line up of low-alcohol products aimed at
the Finnish grocery trade. Products have been
launched under Altia’s iconic spirits brands,
such as Koskenkorva Vichy and Koskenkorva
Village series, as well as Jaloviina and Leijo-
na long drinks. The products have been well
received and gained a good distribution.
During 2018 Altia brought several novelties
to the Finnish retail monopoly both in the
spirits and wine segments. These included
a new type of cognac, Renault Avec, and a
number of rosé wines in the growing rosé
wine category.
The digital platform Viinimaa which is Altia’s
key channel in communicating directly with
consumers in Finland, has developed strongly
during 2018. The site traffic has increased
by over 80% from last year's level because of
more focused actions and optimised content.
In May, Altia opened a webshop for Nordic
alcoholic beverages (www.nordicspirits.com) in
Germany. The webshop is an addition to Altia’s
existing digital platforms, and complements
traditional exports channels.
30BOARD REPORT
BUSINESS OVERVIEW
CORPORATERESPONSIBILITY
CORPORATE GOVERNANCE
FINANCIAL STATEMENTS
ANNUAL REPORT2018

EUR million 2018 2017 Change, %
Net sales 117.7 123.7 -4.9
Comparable EBITDA 10.1 11.5 -12.1
Comparable EBITDA, % of net sales 8.6 9.3
Average number of personnel 85 86
EUR million 2018 2017 Change, %
Spirits 45.9 49.8 -7.8
Wine 68.0 68.5 -0.7
Other beverages 3.8 7.0 -45.7
Other -1.5
TOTAL 117.7 123.7 -4.9
Scandinavia
The Scandinavia segment comprises the import, sale and marketing of wine and spirits, and
other beverages in Sweden, Norway and Denmark.
In 2018, reported net sales for the Scandinavia
segment were EUR 117.7 (123.7) million, with
a considerable negative impact caused by the
weak SEK and NOK. The business has shown
a stable development throughout the year
and in constant currencies net sales improved
by 0.6% compared to the previous year. In
Sweden, wine sales have grown as a result of
deliveries from a new partner starting in June
2018. Spirits sales in Sweden have declined
due to partner portfolio changes. In Norway,
spirits sales have continued to develop well.
In 2018, the comparable EBITDA was EUR
10.1 (11.5) million, which equals a comparable
EBITDA margin of 8.6% (9.3%). The weak SEK
and NOK are the main reason for driving the
profitability down and to some extent partner
portfolio changes. Cost control of operating
expenses has partly compensated for the
negative impacts.
Business events in 2018
Altia has actively launched new products
in the Swedish retail monopoly throughout
the year. For example, in spirits new flavours
were launched under Altia’s key brands. The
Explorer brand was extended with a bag-in-
box with two ready-to-drink cocktails, the
O.P. Anderson brand was extended with O.P.
Björk and the Xanté brand was extended with
Xanté Sour.
Altia further strengthened its gin portfo-
lio with the start of collaboration with the
award-winning Swedish premium gin producer
Hernö Gin.
In wines, Altia’s market positions strengthened
with the new partner. In addition, Altia’s own
wine brand, Chill Out was revamped with a
new design and packaging.
The digital platform folkofolk, which is Altia’s
key channel in communicating directly with
consumers in Sweden, has developed strong-
ly during 2018. Focusing and aligning the
platform and social media channels as well as
using efficient data analytics have improved
site traffic.
31BOARD REPORT
BUSINESS OVERVIEW
CORPORATERESPONSIBILITY
CORPORATE GOVERNANCE
FINANCIAL STATEMENTS
ANNUAL REPORT2018

EUR million 2018 2017 Change, %
Net sales 105.8 101.3 4.4
Comparable EBITDA 10.9 12.5 -12.2
Comparable EBITDA, % of net sales 10.3 12.3
Average number of personnel 426 452
Altia Industrial
The Altia Industrial segment comprises Koskenkorva plant operations and the starch, feed component
and technical ethanol businesses, as well as contract manufacturing and logistics services. It also includes
supply chain operations, i.e. production and logistics operations in different countries and sourcing.
In 2018, net sales for the Altia Industrial segment
were EUR 105.8 (101.3) million. The increase in
net sales is driven by good volume development
in the starch and feed component businesses as
well as the price increases due to the barley cost
push. The demand for technical ethanol has been
stable and contract manufacturing volumes were
slightly above last year’s level.
In 2018, the comparable EBITDA was EUR
10.9 (12.5) million, which equals a comparable
EBITDA margin of 10.3% (12.3%).
Production volumes and key projects
During 2018, the Rajamäki alcoholic beverage
plant produced 64.7 (63.4) million litres of
spirits and wine.
The strong demand of starch has enabled
the Koskenkorva plant to run at full capacity
throughout the year.
The use of grain at the Koskenkorva plant
reached a record high of 211.7 (206.0) million
kilos, an increase of 2.8% compared to the
previous year mainly driven by higher volumes
in starch production. Grain spirits production
including technical ethanols was 22.0 (22.9)
million kilos, starch production was 68.9 (64.5)
million kilos and feed component production
was 62.2 (59.8) million kilos.
At the Koskenkorva plant the investment to
increase starch capacity was finalised and a
new process automation system was taken
into use. During 2018, Koskenkorva started to
offer Viljatori web-based services to purchase
grain. Farmers can monitor Altia’s grain pur-
chase offers and close the deals with the web
services. Also, the receiving process of grain
was digitalised. The time slots for unloading
the grain deliveries can be booked 24/7 by the
suppliers.
At the Rajamäki alcoholic beverage plant
investments to increase efficiencies contin-
ued. Installation of new filling equipment for
production of wine and low alcohol beverages
was completed.
32BOARD REPORT
BUSINESS OVERVIEW
CORPORATERESPONSIBILITY
CORPORATE GOVERNANCE
FINANCIAL STATEMENTS
ANNUAL REPORT2018

Research and development activitiesThe Group’s direct research and development
expenditure amounted to EUR 3.3 (3.4) million
and was related to the product development of
alcoholic beverages.
Corporate Governance StatementA separate Corporate Governance Statement
has been issued and published in connection
with the Board of Directors’ Report. The
statement is also available on Altia’s website at
www.altiagroup.com.
General Meetings of ShareholdersExtraordinary General Meeting
The Extraordinary General Meeting of Altia
Plc held on 22 February 2018 elected Mr
Jukka Ohtola to the Board of Directors of
Altia Plc.
Annual General Meeting
The 2018 Annual General Meeting of Altia
Plc, convened on 1 March 2018, adopted the
financial statements for the financial year
2017. The members of the Board of Directors
and the CEO were discharged from liability for
the financial year 2017. The Annual General
Meeting elected the members of the Board of
Directors and the auditor. As proposed by the
Board of Directors, the Annual General Meet-
ing decided that no dividend is distributed for
the financial year 2017.
Board composition and Board CommitteesThe Annual General Meeting elected the fol-
lowing members to the Board of Directors:
• Sanna Suvanto-Harsaae, chairman
• Kai Telanne, vice chairman
• Kim Henriksson
• Annikka Hurme
• Tiina Lencioni
• Jukka Ohtola
• Torsten Steenholt
The Board of Directors has assessed the
independence of its members. All members of
the Board of Directors are independent of the
company. Jukka Ohtola holds an office with
the Ownership Steering Department of the
Prime Minister’s Office. All other members of
the Board of Directors are independent of the
shareholders of the company.
The Board of Directors has two committees,
the Audit Committee and the Human Resourc-
es Committee. The members of the Audit
Committee are Kim Henriksson (chairman),
Tiina Lencioni and Sanna Suvanto-Harsaae.
The members of the Human Resources Com-
mittee are Sanna Suvanto-Harsaae (chairman),
Annikka Hurme, Jukka Ohtola and Kai Telanne.
Shareholders’ Nomination Board In October 2018, the Company announced
that its three largest registered shareholders
have nominated the following representatives
to the Shareholders’ Nomination Board:
• Jarmo Väisänen, Ownership Steering
Department, Prime Minister’s Office
• Hanna Kaskela, Varma Mutual Pension
Insurance Company
• Annika Ekman, Ilmarinen Mutual Pension
Insurance Company
The Nomination Board elected Jarmo Väisänen
as its chairman. The chairman of Altia’s Board
of Directors, Sanna Suvanto-Harsaae acts as
an expert in the Nomination Board.
AuditorAltia Plc's auditor is authorised public account-
ants PricewaterhouseCoopers Oy, with Ylva
Eriksson, APA, as the principal auditor.
Group structureThere were no changes in Group structure
during 2018.
Chief Executive Officer and Group ManagementIn 2018, the Executive Management Team of
Altia comprised the following members:
• Pekka Tennilä, CEO
• Janne Halttunen, SVP Scandinavia
• Kari Kilpinen, SVP Finland & Exports
• Kirsi Lehtola, SVP Human Resources
• Matti Piri, CFO
(until the end of November 2018)
• Kirsi Puntila, SVP Marketing
• Hannu Tuominen, SVP Altia Industrial
In November, the appointment of Niklas
Nylander as Altia’s new Chief Financial
Officer (CFO) and member of the Executive
Management Team as of 1 January 2019 was
announced.
Share capital and sharesAt the end of the reporting period, Altia Plc's
share capital amounted to EUR 60 480 378.36
and the number of issued shares was
36 140 485.
The initial public offering (IPO) of Altia Plc
was carried out during March 2018. The IPO
included a share sale by the State of Finland
of 23 000 000 existing shares to retail and
institutional investors and an issue of 180 485
new shares to the permanent employees of
Altia in Finland and Sweden. The subscription
price for the sale shares was set at EUR 7.50
per sale share and EUR 6.75 per share in the
personnel offering. Altia’s shares are listed on
the Nasdaq Helsinki. All shares carry one vote
and have equal voting rights. The trading code
of the shares is “ALTIA”, and the ISIN code is
FI4000292438.
33BOARD REPORT
BUSINESS OVERVIEW
CORPORATERESPONSIBILITY
CORPORATE GOVERNANCE
FINANCIAL STATEMENTS
ANNUAL REPORT2018
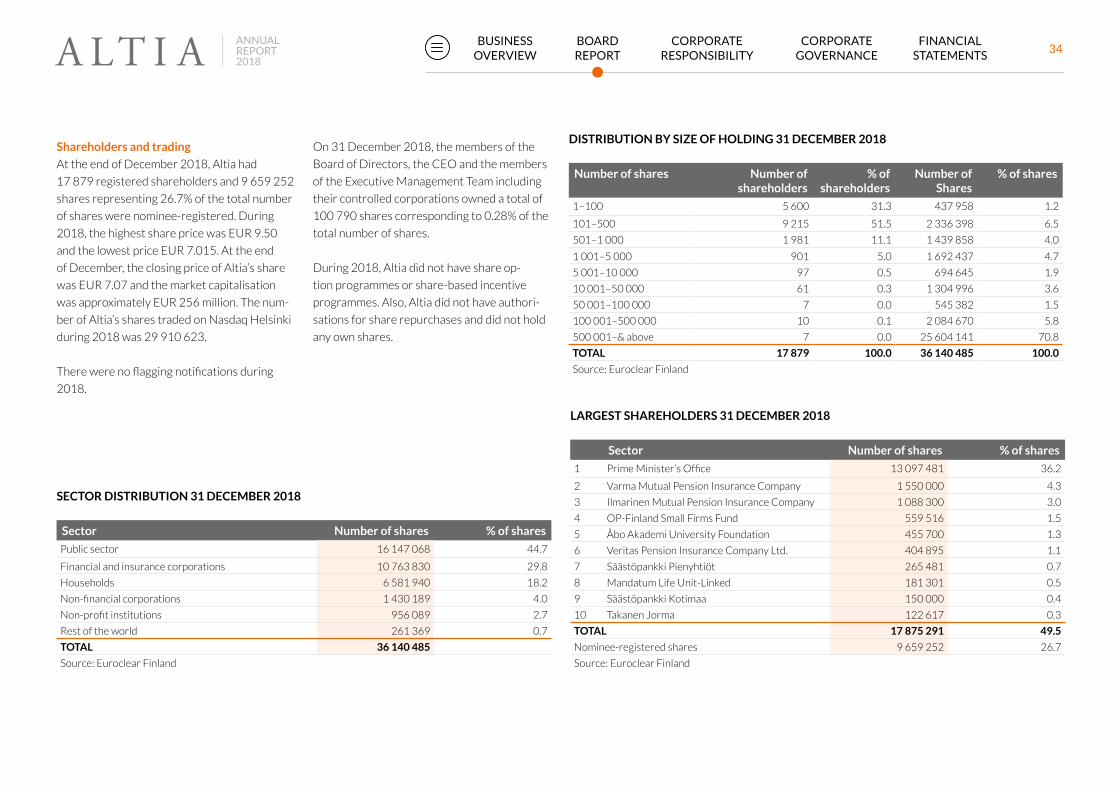
SECTOR DISTRIBUTION 31 DECEMBER 2018
Sector Number of shares % of shares
Public sector 16 147 068 44.7
Financial and insurance corporations 10 763 830 29.8
Households 6 581 940 18.2
Non-financial corporations 1 430 189 4.0
Non-profit institutions 956 089 2.7
Rest of the world 261 369 0.7
TOTAL 36 140 485
Source: Euroclear Finland
DISTRIBUTION BY SIZE OF HOLDING 31 DECEMBER 2018
Number of shares Number of shareholders
% of shareholders
Number of Shares
% of shares
1–100 5 600 31.3 437 958 1.2
101–500 9 215 51.5 2 336 398 6.5
501–1 000 1 981 11.1 1 439 858 4.0
1 001–5 000 901 5.0 1 692 437 4.7
5 001–10 000 97 0.5 694 645 1.9
10 001–50 000 61 0.3 1 304 996 3.6
50 001–100 000 7 0.0 545 382 1.5
100 001–500 000 10 0.1 2 084 670 5.8
500 001–& above 7 0.0 25 604 141 70.8
TOTAL 17 879 100.0 36 140 485 100.0
Source: Euroclear Finland
LARGEST SHAREHOLDERS 31 DECEMBER 2018
Sector Number of shares % of shares
1 Prime Minister’s Office 13 097 481 36.2
2 Varma Mutual Pension Insurance Company 1 550 000 4.3
3 Ilmarinen Mutual Pension Insurance Company 1 088 300 3.0
4 OP-Finland Small Firms Fund 559 516 1.5
5 Åbo Akademi University Foundation 455 700 1.3
6 Veritas Pension Insurance Company Ltd. 404 895 1.1
7 Säästöpankki Pienyhtiöt 265 481 0.7
8 Mandatum Life Unit-Linked 181 301 0.5
9 Säästöpankki Kotimaa 150 000 0.4
10 Takanen Jorma 122 617 0.3
TOTAL 17 875 291 49.5
Nominee-registered shares 9 659 252 26.7
Source: Euroclear Finland
Shareholders and trading
At the end of December 2018, Altia had
17 879 registered shareholders and 9 659 252
shares representing 26.7% of the total number
of shares were nominee-registered. During
2018, the highest share price was EUR 9.50
and the lowest price EUR 7.015. At the end
of December, the closing price of Altia’s share
was EUR 7.07 and the market capitalisation
was approximately EUR 256 million. The num-
ber of Altia’s shares traded on Nasdaq Helsinki
during 2018 was 29 910 623.
There were no flagging notifications during
2018.
On 31 December 2018, the members of the
Board of Directors, the CEO and the members
of the Executive Management Team including
their controlled corporations owned a total of
100 790 shares corresponding to 0.28% of the
total number of shares.
During 2018, Altia did not have share op-
tion programmes or share-based incentive
programmes. Also, Altia did not have authori-
sations for share repurchases and did not hold
any own shares.
34BOARD REPORT
BUSINESS OVERVIEW
CORPORATERESPONSIBILITY
CORPORATE GOVERNANCE
FINANCIAL STATEMENTS
ANNUAL REPORT2018

PersonnelIn 2018, Altia Group had an average of 718
(762) employees. On 31 December 2018, Altia
Group had 678 (703) employees, of whom 402
(411) were in Finland, 114 (117) in Sweden, 19
(21) in Denmark, 28 (29) in Norway, 32 (37) in
Latvia, 61 (65) in Estonia, and 22 (23) in France.
The decrease in personnel was primarily due
to non-replacement or other internal ar-
rangements in Finland, and due to continued
reorganisation of operations in Latvia. Negotia-
tions on reorganisation of Altia’s Scandinavia
segment and on operational changes in Finland
sales were completed towards the end of the
year. These arrangements aimed at renewing
ways of working as well as simplifying the
organisational structure, and will affect the
number of personnel in 2019.
In 2018, training courses were arranged for
the commercial organisation, sales and mar-
keting personnel and Let’s Lead Better training
for managers was continued. The Altia Tasting
personnel survey was conducted in Janu-
ary-February 2018. The new survey gave more
accurate tools for managers to develop their
leadership. In the Rajamäki plant, a leadership
program was carried out with focus on building
the safety culture.
Incentive programmes
Altia’s salaried, senior salaried employees and
management participate in an annual perfor-
mance bonus program. The potential annual
bonus is based on both the Group’s and its
business units’ targets, as well as on personal
targets. Bonuses are paid either once a year or
more frequently as an annual bonus or sales bo-
nus. Workers participate in a production bonus
system. The production bonuses are based on
the targets of each production unit. Altia’s CEO,
the members of the Executive Management
Team and selected key employees are part of a
long-term incentive scheme for 2017–2019.
Based on the profit for 2017, annual perfor-
mance bonuses amounting to EUR 2.6 (3.7)
million, including social expenses, were paid
in 2018. Sales commissions totalling EUR 0.1
(0.1) million were paid during the year. Pro-
duction bonuses totalling EUR 0.4 (0.4) million
were included in the result for the period. In
connection with the IPO in 2018, the top man-
agement were paid a one-off reward totalling
EUR 1.4 million for investing the net sum of the
received award in the company by subscribing
shares in the personnel offering. Additionally, a
130-year celebration bonus totalling EUR 0.6
million was paid to Altia employees, excluding
top management.
Corporate Responsibility In December 2018, Altia was nominated as the
Green Company of the Year in the interna-
tional Drinks Business Green Awards 2018,
organised by the Drinks Business magazine.
The recognition was awarded to Altia for the
bio and circular economy achievements at the
Koskenkorva distillery.
For Altia, responsibility is both a strategic
priority and a key success factor in its busi-
ness. The aim of Altia’s efforts in the area of
corporate responsibility is to build sustainable
long-term business. Altia wants to support
the development of a modern and responsi-
ble Nordic drinking culture in its operating
countries in accordance with the company’s
purpose, Let’s Drink Better.
The focus areas of Altia's responsibility work
are divided into four cornerstones: Altia &
Customers, Altia & Society, Altia & Environ-
ment and Altia & Employees. The cornerstones
are based on Altia’s purpose and strategy,
stakeholder expectations, the company’s own
operating principles and codes of conduct,
as well as the amfori BSCI Code of Conduct,
which in turn is based on key international
agreements protecting workers’ rights. Altia
has joined the amfori BSCI initiative and aims
at annually increase the traceability and trans-
parency of product and raw material supply
chains. Altia launched its new Code of Conduct
in 2018 to further highlight the company’s
commitment to responsibility, transparency
and integrity.
In 2018, Altia updated its corporate respon-
sibility materiality analysis based on investor
views. This was done by conducting a web
based survey for private shareholders and
interviews with a number of institutional inves-
tors. Based on the findings, the focus areas of
Altia’s corporate responsibility cornerstones
were amplified. The most important corporate
responsibility aspects highlighted by Altia’s
shareholders were the quality and safety of
Altia’s products, the circular economy, conserv-
ing groundwater, sustainable packaging and
responsible supply chain.
Altia has defined a group level corporate re-
sponsibility action plan for 2018–2020, based
on its strategy and responsibility cornerstones.
The action plan progressed as planned in 2018.
More details can be found in the Non-Financial
Statement published in connection with the
Report by the Board of Directors and in the
Annual Report’s dedicated section on Corpo-
rate Responsibility.
35BOARD REPORT
BUSINESS OVERVIEW
CORPORATERESPONSIBILITY
CORPORATE GOVERNANCE
FINANCIAL STATEMENTS
ANNUAL REPORT2018

Health, safety and environmentOccupational health and safety
Occupational safety is a vital part of Altia’s cor-
porate responsibility. Altia aims to reduce the
number of accidents, absences caused by acci-
dents and sickness absences. To achieve these
goals, various occupational safety targets were
set and related actions were conducted across
different Altia sites during 2018.
In 2018, the sickness absence rate was 3.4%
(3.3%). The accident frequency (the number of
accidents per one million working hours) for
accidents requiring at least one day of absence
was 13 (11). There were no fatal work-related
accidents in 2018 (0).
The environment and energy efficiency
Altia’s work with environmental matters focus-
es on minimising the environmental impacts
generated by Altia's own operations. The most
significant environmental impacts of Altia’s
operations are energy consumption, water
consumption, waste water quality, waste gener-
ation and the non-quality costs generated from
scrapped raw materials, packaging materials
and end products. Environmental indicators
have been defined to support the reduction
of these impacts. Annual targets and related
actions were defined for different locations.
The environmental indicator for reducing
waste volume in relation to production volume
decreased at Tabasalu but increased at Ra-
jamäki in 2018, compared to the levels in 2017.
Organic loading of wastewater increased both
at Rajamäki and Koskenkorva plants during the
reporting period. At Koskenkorva, the increase
resulted from including A-Rehu’s wastewater
amounts into the calculation. A-Rehu operates
on Koskenkorva plant area. Water consumption
relative to production decreased at Tabasalu,
Rajamäki and Koskenkorva. The absolute
amount of water used decreased at Rajamäki
and Tabasalu and increased at Koskenkorva.
The average waste reutilisation rate for the
Altia production sites in Rajamäki, Koskenkorva
and Tabasalu, was 99.7% in 2018 (99.5%).
The bioenergy power plant at Koskenkorva,
which uses barley husks as its primary fuel, has
enabled the Koskenkorva plant to reduce its
carbon dioxide emissions and achieve a 59.9%
self-sufficiency rate in fuels for steam produc-
tion in the reporting period. The bioenergy
power plant has been operating at full capacity
since January 2015. The use of renewable fuel
has reduced the Koskenkorva plant’s carbon
dioxide emissions by 54% in 2018 compared to
the base year 2014 level.
Energy efficiency achieved through various
energy saving measures is a major development
area for the company both in terms of profit-
ability and environmental responsibility. Altia
is committed to the Finnish energy efficiency
agreement for the period of 2017–2025, with
the target to reduce energy consumption by
10% by the year 2025, compared to the base
year 2014. In 2018, energy use relative to
production volume increased slightly at the
Rajamäki plant and remained at the previous
year’s level at the Koskenkorva plant.
Risks and risk managementRisk management
Altia’s risk management aims to support the
realisation of the company’s strategy, risk iden-
tification, and means to reduce the likelihood
and impact of risk materialisation, as well as
to safeguard business continuity. Risks may
be the result of an internal or external event.
The Group’s risk management policy has been
approved by Altia Plc’s Board of Directors.
The risk management policy describes the
goals, principles and responsibilities of Altia’s
risk management and the related reporting
principles. In line with this, the risk manage-
ment steering group supports and coordi-
nates risk management as part of the Group’s
planning and control processes and reports key
risks to the company’s management and Audit
Committee. The most significant risks and
uncertainties are assessed yearly in the Report
of the Board of Directors.
Altia’s business areas are responsible for risks
related to their operations, as well as for their
identification, prevention and key limitation
methods. The Group’s finance department
manages financial risks according to the hedging
principles defined in the company’s financial pol-
icy. The management principles of the Group’s
most significant financial risks are described
in more detail in the Notes to the Consolidat-
ed Financial Statements, under section 4.1.
Financial risk management (p. 145). The finance
department is also responsible for insurance
programmes that cover the entire Group.
Altia’s risk management process is based on
the ISO 31000 standard, as applicable. The
Corporate Governance Statement includes a
more detailed description of the risk manage-
ment process (p. 37).
Most significant risks and uncertainties
For reporting and risk assessment purposes,
risks are categorised into five classes: strategic
and business risks, operational and process-
related risks, damage risks, financial risks
and compliance risks. The Board of Directors
assesses these central risks and the measures
aiming to reduce the likelihood of their materi-
alisation every three months.
Strategic and business risks relate to deci-
sion-making, resource allocation, management
systems and the capacity to respond to chang-
es in the operating environment (Strategy peri-
od: long-term, 3–5 years). Responsibility risks
36BOARD REPORT
BUSINESS OVERVIEW
CORPORATERESPONSIBILITY
CORPORATE GOVERNANCE
FINANCIAL STATEMENTS
ANNUAL REPORT2018

Risk Description Risk managementRaw material price risk
The availability of domestic barley and its market price has a significant impact on the profitability of Altia’s business.
Altia ensures the availability of barley with contract farming and the price of barley in cooperation with farmers and grain companies.
Risks related to customers and consum-er demand
Our customers in Altia’s market areas include Nordic retail monopolies, whole-salers who sell alcohol, restaurants, retail stores, travel retail, international wine and spirits companies and import-ers operating in the export markets. The wide customer base provides Altia with diverse opportunities for the long-term development of customer cooperation.
Changes in consumer behaviour may, in the long term, shift the emphasis in the demand for Altia’s products between different product categories.
A strong market position, efficient industrial processes, good quality and well-known brands improve Altia’s chances to manage the risk.
Changes in consumption patterns and the need to adjust operations are prepared for by investing in consumer-driven product development.
Product safety risks
As a wine and spirits company, it is par-ticularly important for Altia to ensure the quality and safety of raw materials and finished goods throughout the supply chain.
Altia employs modern methods to ensure the safe-ty of production processes and to eliminate various microbiological, chemical and physical hazards. In ensuring product safety, Altia complies with the operating methods required by food safety man-agement and quality certificates.
Damage risks
Altia has production facilities in Finland, Estonia and France. A fire or other unforeseen event may interrupt the operations of a production facility.
All of our production facilities have insurance policies for material damage and the interruption of operations in the Group’s insurance programme. Key production facilities are subject to a risk sur-vey every 1–2 years. Continuity plans serve to limit any possible loss of profits.
Financial risks
The key risks related to finance in Altia’s operations are currency transaction and translation risks, interest rate risks and refinancing and liquidity risks.
Financial risk management aims to mitigate any impact that price fluctuations and other uncer-tainties in the financial markets have on operating results, the balance sheet and cash flow and to ensure sufficient liquidity. The management princi-ples of the Group’s most significant financial risks are described in more detail in the Notes to the Consolidated Financial Statements, under section 4.1. (p. 145) Financial risk management.
Compliance Key compliance risks in Altia’s oper-ations relate to the breach of laws, regulations and decisions by authorities concerning reporting, permits and licenses, marketing of alcoholic bever-ages, competition law and processing of personal data.
Compliance risk management aims to avoid sanc-tions, consequences and official investigations and decisions that may damage the company’s profita-bility, business continuity and reputation. Altia aims to manage compliance risks and ensure ethically sustainable business practices with guidance and regular training.
Business EnvironmentStrategic ChoicesMarketsRegulatoryCorporate Responsibility
Processes and Controls SourcingPersonnelIT and Security
Financial MarketsLiquidityCounterparty
PropertySafetyEnvironmentLiabilities
Strategic and Business
ReportingData PrivacyCompetition lawLicensesEthics
Financial
Operations
Compliance
ALTIA'S RISK CHART
Hazard
related to business operations are described in
the Non-Financial Statement (p. 40) published
in connection with the Report by the Board of
Directors.
Operational risks concern the implementation
of strategy and day-to-day business opera-
tions. Such risks include deviations in pro-
cesses, systems and conduct (Budget period:
short-term, 1–2 years).
Damage risks are errors, malfunctions and ac-
cidents occurring within Altia or its operating
environment, resulting in damage or loss.
Financial risks pertain to changes in market
prices, the short- and long-term adequacy of
financial assets and the ability of counterpar-
ties to meet their financial obligations.
Compliance risks involve violations of laws
and permits as well as ethically sustainable
business practices applicable to the company’s
operations and industry. The following table
contains a summary of key uncertainties with
an either positive or negative effect on Altia’s
operations:
37BOARD REPORT
BUSINESS OVERVIEW
CORPORATERESPONSIBILITY
CORPORATE GOVERNANCE
FINANCIAL STATEMENTS
ANNUAL REPORT2018

Price risk associated with commodities
Barley
In 2018, Altia consumed approximately
211.7 (206) million kilos of Finnish barley to
produce ethanol and starch. The availability
of high-quality domestic barley is ensured
through contract cultivation and cooperation
with grain growers and grain handling com-
panies. The market price of barley fluctuates
significantly year by year as a result of sev-
eral factors that affect Finnish barley supply
and demand. The price of barley is therefore
considered to be a significant risk for Altia
during the financial year. The price risk has
not been hedged against with derivative
instruments.
Electricity
A strong increase in the market price of
electricity is a significant risk for Altia. The
risk is managed by following Altia’s principles
for electricity procurement. These principles
determine the hedging limits within which the
electricity price risk is hedged against. The
hedges are executed with the OTC-derivatives
of Nasdaq OMX Oslo ASA.
The hedging service for electricity procure-
ment has been outsourced.
At the end of 2018, the hedging ratio for
deliveries for the next 12 months was 64.1%
(67.6%), in line with the set targets. In 2018, the
average hedging ratio was 68.0% (70.0%).
Cash flow hedge accounting in accordance with
IFRS 9 is applied to the hedges against electric-
ity price risk, and hedge effectiveness is tested
quarterly. All hedging was effective in 2018 (the
ineffective portion EUR -0.1 million in 2017 was
recognised in financial costs).
Altia purchases its electricity straight from the
Nord Pool Spot markets as a delivery tied to the
spot price of the Finnish price area.
Sensitivity to market risks
The following table describes the sensitivity of
the Group’s profit and equity (before taxes) to
changes in electricity prices, foreign exchange
rates and interest rates. When Altia applies
hedge accounting, the sensitivity is directed at
equity. When hedge accounting is not applied,
the sensitivity is recognised as a potential impact
on profit or loss.
The sensitivity to foreign exchange rate changes
is calculated from the net currency position
resulting from financial instruments.
The total group floating rate liability position
consists of floating rate liabilities EUR 75.0
Sensitivity of financial instruments to market risks (before taxes) in accordance with IFRS 7 2018 2017
EUR millionIncome statement Equity
Income statement Equity
+/-10% electricity - +/-0.3 - +/-0.3
+/-10% change in EUR/NOK exchange rate +/-0.1 +/-0.1
+/-10% change in EUR/SEK exchange rate +/-2.0 +/-2.0
+/-10% change in EUR/USD exchange rate -/+0.5 -/+0.4
+/-10% change in EUR/AUD exchange rate -/+0.2 -/+0.2
+/-1%-points change in interest rates -0.5 + 0.6 -0.7 + 0.8
Note: +10% increase in EUR/SEK exchange rate would have an EUR +2.0 million effect in income statement. Other risks with same principle.
(85.0) million and floating leg of interest rate
swap EUR 20.0 (20.0) million which is netting
the interest rate risk.
An increase of one percentage point in interest
rates would have an effect of EUR -0.5 (-0.5)
million on the income statement. The effect
of the increase in market interest rates on the
Group’s profit is determined by net interest
expenses.
Short-term risks and uncertaintiesThe most significant uncertainties in the com-
pany’s operations relate to the overall econom-
ic development and its impacts on consump-
tion, as well as the effects of alcohol taxes and
legislation on consumer behaviour. Unexpect-
ed and unforeseen disruptions in production
and deliveries form the major short-term risks
related to operations, as well as sudden and
significant changes in prices of raw materials,
especially related to barley.
Altia Plc’s Board of Directors has confirmed
the Group Risk Management Policy. Risk man-
agement is aimed at supporting the implemen-
tation of Altia Group’s strategy, the identifi-
cation of risks and methods for reducing the
probability and impacts of risks, as well as
ensuring business continuity. Risks may arise
from internal or external events.
38BOARD REPORT
BUSINESS OVERVIEW
CORPORATERESPONSIBILITY
CORPORATE GOVERNANCE
FINANCIAL STATEMENTS
ANNUAL REPORT2018

Outlook 2019Market outlook
The development of the Group’s business
operations and profitability are affected by the
competitive environment, the overall economic
outlook, imports by consumers and changes
in alcohol taxation. Uncertainty related to
changes in consumer buying behaviour and
consumer demand continues.
Seasonality
There are substantial seasonal fluctuations in
the consumption of alcoholic beverages im-
pacting the net sales and cash flow of Altia. The
company typically generates large amounts
of its revenue and cash flow during the fourth
quarter of the year whereas, the first quarter
of the year is significantly lower. In addition,
excise taxes related to the high season at the
end of the year are paid in January, resulting
in large cash outflows at the beginning of the
year.
Guidance
The comparable EBITDA is expected to im-
prove from the 2018 level.
The positive trend of Altia’s Nordic core brand
portfolio is expected to continue. Market
development in Finland is expected to flatten
out in comparison to 2018 and the markets
in Sweden and Norway are expected to grow.
The negative impact of the increased barley
cost will be reflected in high raw material costs
especially in the first quarters of the year. The
guidance assumes a normal harvest in 2019.
In addition, the impact from the implementa-
tion of the new IFRS 16 standard is expected
to improve comparable EBITDA by 3–4
million.
Dividend proposalAccording to the financial statements on 31
December 2018, the parent company’s distrib-
utable funds amount to EUR 72 084 125.87
including profit for the period of EUR
14 102 839.85.
There have been no significant changes to the
parent company’s financial position after the
end of the financial year.
The Board of Directors proposes to the Annual
General Meeting that a dividend of EUR 0.38
per share be paid for the financial year 2018.
The Board’s proposal is based on earnings per
share (EPS) and takes into consideration the
items affecting comparability included in the
result for 2018.
Annual General Meeting 2019Altia Plc’s Annual General Meeting (AGM)
2019 is planned to be held on 15 May 2019 in
Helsinki. The Board of Directors will summon
the AGM later.
Financial calendar 2019The Annual Report 2018 including the finan-
cial statements, Board of Directors' report,
Auditor's report, the Corporate Governance
statement and the remuneration statement will
be published in English and Finnish on Altia’s
website during week 12 (the week starting on
18 March).
Altia will publish financial reports in 2019 as
follows:
• 8 May 2019: Business Review for
January–March 2019
• 15 August 2019: Half-Year Report for
January–June 2019
• 7 November 2019: Business Review for
January–September 2019
Events after the periodOn 30 January, the proposals by the Sharehold-
ers’ Nomination Board to the Annual General
Meeting were announced. The Nomination
Board proposes that the number of members of
the Board of Directors be seven (7) and that the
present members Kim Henriksson, Tiina Lencioni,
Jukka Ohtola, Torsten Steenholt, Sanna Suvan-
to-Harsaae and Kai Telanne be re-elected and
Anette Rosengren be elected as a new member.
Further, the Nomination Board proposes that
the remuneration to be paid to the members
of the Board of Directors during the next term
consist of a monthly term of office fee as follows:
EUR 4 000 per month, Chairman; EUR 2 500 per
month, Vice Chairman; EUR 2 000 per month,
member.
In addition to the monthly fee, the Board mem-
bers would receive a meeting fee for the Board
of Directors and Board Committee meetings of
EUR 600 per meeting for Board members re-
siding in Finland and EUR 1 200 per meeting for
Board members residing abroad. Travel expens-
es would be reimbursed in accordance with the
company’s travel policy.
Helsinki, 6 February 2019
Altia Plc
Board of Directors
39BOARD REPORT
BUSINESS OVERVIEW
CORPORATERESPONSIBILITY
CORPORATE GOVERNANCE
FINANCIAL STATEMENTS
ANNUAL REPORT2018

IntroductionCorporate responsibility is both a strategic
priority and a key success factor for Altia. The
aim of the company’s responsibility efforts
is to build a sustainable long-term business.
Altia wants to promote a modern and respon-
sible Nordic drinking culture. This target is
summarised in the company’s purpose, Let’s
Drink Better. Better drinking can be inter-
preted as, for example, a drinking culture that
is of a higher quality, moderate in quantity,
lighter, more social or more environmentally
friendly.
Altia has reported on the company’s respon-
sibility efforts for ten years in accordance
with the model for corporate responsibility
reporting for state-owned companies1 and the
Global Reporting Initiative (GRI) guidelines.
This non-financial statement describes, in
accordance with the Finnish Accounting
Act, Altia’s approach to the management of
environmental, social and employee matters,
as well as matters related to respect for human
rights and anti-corruption and bribery, in its
operations. More detailed information about
our responsibility work is provided in a sep-
arate section on Corporate Responsibility in
Annual Report.
Non-financial statement
Business model Altia’s business model is based on offering a
strong portfolio of its own brands and a versatile
range of international partner brands, as well
as providing services to its customers utilis-
ing the company’s production, packaging and
logistics capacity. In addition, by-products from
the production process are sold to industrial
customers in other industries. The integrated
operating model creates significant economies
of scale in sourcing, production and distribution,
and allows the company to take advantage of its
shared operations – such as consumer research,
innovation, product development and overall
know-how – and use its centralised support func-
tions efficiently. The Business Overview section
contains a description of how Altia creates value.
Environmental mattersa. Policies and ways of working (including
due diligence)
Altia’s work on environmental matters focuses
on minimising the environmental impacts of
the company’s own operations. Altia aims for
high material and resource efficiency, and
develops products and their packaging with a
view to achieving a lower environmental im-
pact. In addition, necessary measures are taken
to protect the groundwater resources used as
an ingredient in Altia’s products.
The environmental aspects relevant to the
company are assessed at three-year intervals.
In the assessment conducted in 2018, energy
consumption, water consumption, wastewater
and its quality, as well as waste generation,
were identified as the most significant environ-
mental aspects. Environmental key perfor-
mance indicators and annual reduction targets
were defined to support the reduction of these
impacts. Plant-specific targets and the actions
necessary to achieve the targets are set annu-
ally, and progress is monitored monthly with
the help of the indicators.
The standards, policies and principles relevant
to Altia’s environmental work include:
• Altia Code of Conduct
• Altia Quality, Safety and Environmental
Principles
• ISO14001 Environmental Management
System standard; the certification covers
Altia’s operations in Finland
b. Principal risks and their management
Environmental risks are assessed regularly as
part of the assessment of Altia’s environmental
impacts and of Altia Group’s risk management.
The principal risks identified include possi-
ble leaks to the soil or waterways (including
groundwater areas), overruns of the waste-
water quality limits in Altia’s environmental
permits, and the costs related to maintaining
compliance with increasingly strict environ-
mental regulations as well as the fines and
sanctions resulting from any non-compliance
with the said regulations.
The risks are managed through various meas-
ures, including the maintenance of an envi-
ronmental management system in accordance
with the ISO14001 standard, regular monitor-
ing of wastewater quality, ownership of land in
groundwater areas and monitoring legislative
developments.
c. Outcome and KPIs
Altia’s environmental work received notable
international recognition in 2018 when the
company was nominated as the Green Com-
pany of the Year in The Drinks Business Green
Awards. The recognition was awarded to Altia
for the bio and circular economy achievements
at the Koskenkorva distillery.
In Finland, Altia has joined the voluntary
Energy Efficiency Agreement, the other parties
of which are the Ministry of Economic Affairs
and Employment, industry associations and
companies. With the agreement, Altia commits
to reducing its energy consumption by 10%
1 Government Resolution on State Ownership Policy 3 November 2011, Annex 3
40BOARD REPORT
BUSINESS OVERVIEW
CORPORATERESPONSIBILITY
CORPORATE GOVERNANCE
FINANCIAL STATEMENTS
ANNUAL REPORT2018
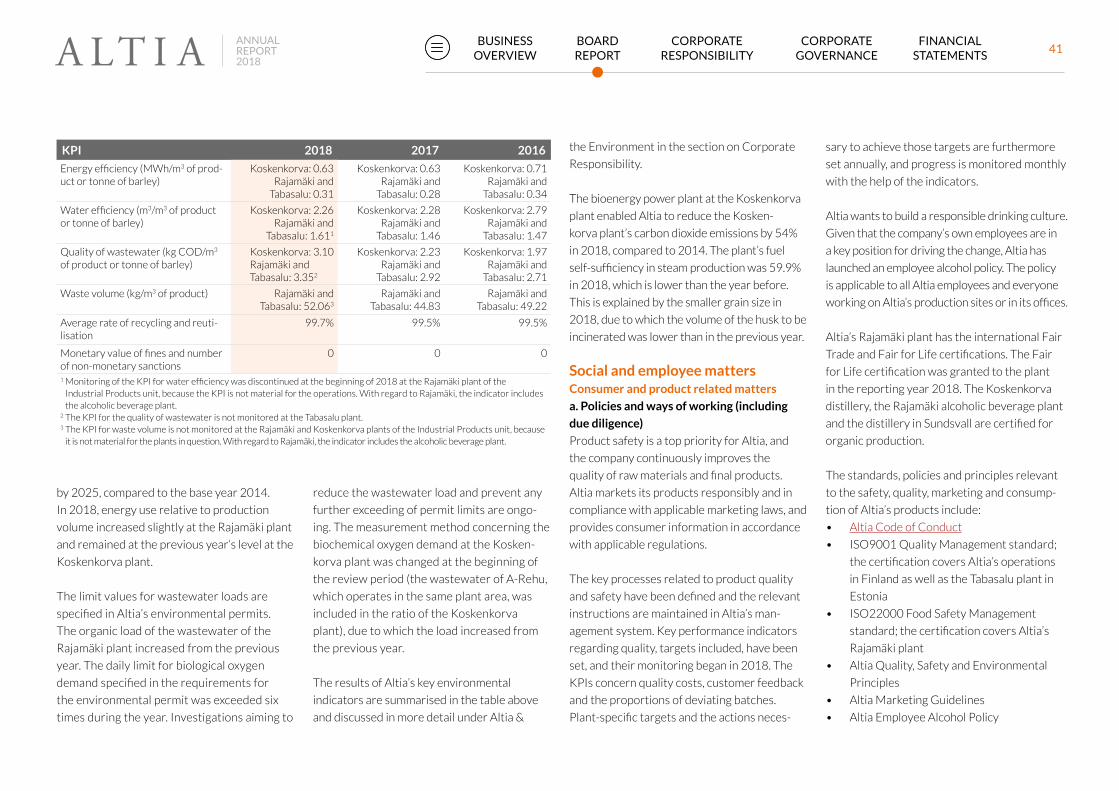
KPI 2018 2017 2016
Energy efficiency (MWh/m3 of prod-uct or tonne of barley)
Koskenkorva: 0.63Rajamäki and
Tabasalu: 0.31
Koskenkorva: 0.63Rajamäki and
Tabasalu: 0.28
Koskenkorva: 0.71Rajamäki and
Tabasalu: 0.34
Water efficiency (m3/m3 of product or tonne of barley)
Koskenkorva: 2.26Rajamäki and
Tabasalu: 1.611
Koskenkorva: 2.28Rajamäki and
Tabasalu: 1.46
Koskenkorva: 2.79Rajamäki and
Tabasalu: 1.47
Quality of wastewater (kg COD/m3 of product or tonne of barley)
Koskenkorva: 3.10Rajamäki and Tabasalu: 3.352
Koskenkorva: 2.23Rajamäki and
Tabasalu: 2.92
Koskenkorva: 1.97Rajamäki and
Tabasalu: 2.71
Waste volume (kg/m3 of product) Rajamäki and Tabasalu: 52.063
Rajamäki and Tabasalu: 44.83
Rajamäki and Tabasalu: 49.22
Average rate of recycling and reuti-lisation
99.7% 99.5% 99.5%
Monetary value of fines and number of non-monetary sanctions
0 0 0
1 Monitoring of the KPI for water efficiency was discontinued at the beginning of 2018 at the Rajamäki plant of the Industrial Products unit, because the KPI is not material for the operations. With regard to Rajamäki, the indicator includes the alcoholic beverage plant.
2 The KPI for the quality of wastewater is not monitored at the Tabasalu plant.3 The KPI for waste volume is not monitored at the Rajamäki and Koskenkorva plants of the Industrial Products unit, because
it is not material for the plants in question. With regard to Rajamäki, the indicator includes the alcoholic beverage plant.
by 2025, compared to the base year 2014.
In 2018, energy use relative to production
volume increased slightly at the Rajamäki plant
and remained at the previous year’s level at the
Koskenkorva plant.
The limit values for wastewater loads are
specified in Altia’s environmental permits.
The organic load of the wastewater of the
Rajamäki plant increased from the previous
year. The daily limit for biological oxygen
demand specified in the requirements for
the environmental permit was exceeded six
times during the year. Investigations aiming to
reduce the wastewater load and prevent any
further exceeding of permit limits are ongo-
ing. The measurement method concerning the
biochemical oxygen demand at the Kosken-
korva plant was changed at the beginning of
the review period (the wastewater of A-Rehu,
which operates in the same plant area, was
included in the ratio of the Koskenkorva
plant), due to which the load increased from
the previous year.
The results of Altia’s key environmental
indicators are summarised in the table above
and discussed in more detail under Altia &
the Environment in the section on Corporate
Responsibility.
The bioenergy power plant at the Koskenkorva
plant enabled Altia to reduce the Kosken-
korva plant’s carbon dioxide emissions by 54%
in 2018, compared to 2014. The plant’s fuel
self-sufficiency in steam production was 59.9%
in 2018, which is lower than the year before.
This is explained by the smaller grain size in
2018, due to which the volume of the husk to be
incinerated was lower than in the previous year.
Social and employee mattersConsumer and product related matters
a. Policies and ways of working (including
due diligence)
Product safety is a top priority for Altia, and
the company continuously improves the
quality of raw materials and final products.
Altia markets its products responsibly and in
compliance with applicable marketing laws, and
provides consumer information in accordance
with applicable regulations.
The key processes related to product quality
and safety have been defined and the relevant
instructions are maintained in Altia’s man-
agement system. Key performance indicators
regarding quality, targets included, have been
set, and their monitoring began in 2018. The
KPIs concern quality costs, customer feedback
and the proportions of deviating batches.
Plant-specific targets and the actions neces-
sary to achieve those targets are furthermore
set annually, and progress is monitored monthly
with the help of the indicators.
Altia wants to build a responsible drinking culture.
Given that the company’s own employees are in
a key position for driving the change, Altia has
launched an employee alcohol policy. The policy
is applicable to all Altia employees and everyone
working on Altia’s production sites or in its offices.
Altia’s Rajamäki plant has the international Fair
Trade and Fair for Life certifications. The Fair
for Life certification was granted to the plant
in the reporting year 2018. The Koskenkorva
distillery, the Rajamäki alcoholic beverage plant
and the distillery in Sundsvall are certified for
organic production.
The standards, policies and principles relevant
to the safety, quality, marketing and consump-
tion of Altia’s products include:
• Altia Code of Conduct
• ISO9001 Quality Management standard;
the certification covers Altia’s operations
in Finland as well as the Tabasalu plant in
Estonia
• ISO22000 Food Safety Management
standard; the certification covers Altia’s
Rajamäki plant
• Altia Quality, Safety and Environmental
Principles
• Altia Marketing Guidelines
• Altia Employee Alcohol Policy
41BOARD REPORT
BUSINESS OVERVIEW
CORPORATERESPONSIBILITY
CORPORATE GOVERNANCE
FINANCIAL STATEMENTS
ANNUAL REPORT2018

KPI 2018 2017 2016
Amount of income taxes paid and excise taxes collected
EUR 452.3 million
The full tax footprint is available in the
section on Corporate Responsibility
EUR 425.6 million
The full tax footprint is available in the
section on Corporate Responsibility
EUR 466.3 million
The full tax footprint is available in the
2016 Responsibility Report
b. Principal risks and their management
The risks are assessed as part of quality and
safety risk assessments and as part of Altia
Group’s risk management. The principal
risks identified include failure to comply with
hygiene requirements, lack of consistency in
the quality of products, any contamination of
products, as well as defects in raw materials or
packaging. Such incidents can lead to prod-
uct recalls or make the company subject to
legal claims. As the alcohol business is highly
regulated, stricter regulation regarding the
marketing and advertising of alcoholic bever-
ages or their taxation, for example, could have
an impact on the company’s operations.
To manage risks of this type, Altia maintains
quality and food safety management systems
in accordance with international standards.
Quality is monitored continuously during
production by means of line inspections and
testing, as well as the analysis of end products.
Instructions and process are maintained in
view of possible recalls and situations are
practised regularly by way of phantom testing.
Applicable legislation and any developments
therein are reviewed regularly.
c. Outcome and KPIs
Altia’s Rajamäki plant received the ISO 22000
food safety certificate in 2017, and food
safety was improved in accordance with the
ISO 22000 standard during the reporting
period. During the year, the company ar-
ranged training for all employees through an
online platform, enhanced quality monitoring
during production by, for instance, adopting a
manufacturing execution system (MES), and
continued to improve the plant’s condition
by carrying out floor and wall repairs, among
others. Plant-specific targets and the actions
necessary to achieve those targets are set
annually and progress is monitored monthly
with the help of the indicators.
Employee matters
a. Policies and ways of working (including
due diligence)
Altia is committed to building a culture with
a motivating and supportive working envi-
ronment based on safety, openness, equality
and trust. The company values diversity and
promotes equal treatment and equal oppor-
tunities. Altia maintains a continuous dialogue
with its employees by sharing information and
engaging the employees, and respects the free-
dom of association and the right to collective
bargaining. All Altia employees are expected
to respect each other’s rights to fair treatment
and to act in accordance with the Altia Behav-
iours. These are Renew Bravely, Show Direction,
Build Success Together and Implement!
Altia wants to ensure safe and healthy working
conditions for all its employees. The goal is
to reduce sickness absences, the number of
accidents and the number of absences caused
by accidents. Plant-specific targets and the
actions necessary to achieve those targets
are set annually, and progress is monitored
monthly by way of key performance indicators.
Targets are also set and action plans prepared
for operating locations that are not within the
scope of the OHSAS 18001:2007 certification.
The standards, policies and principles relevant
to employee matters include:
• Altia Code of Conduct
• Altia Behaviours
• OHSAS 18001:2007 Occupational Health
and Safety Management standard; the
certification covers Altia’s operations in
Finland
• Altia Quality, Safety and Environmental
Principles
• amfori BSCI Code of Conduct
b. Principal risks and their management
The risks are assessed as part of Altia Group’s
risk management. The principal risks relate to
Altia’s ability to recruit, develop, motivate and
retain the right know-how and succeed in daily
leadership, the maintenance of good collabora-
tion practices with employees and their unions,
as well as the occurrence of accidents. To
manage the risks, Altia develops its employer
value proposition, recruitment and retention,
conducts the employee satisfaction survey
Altia Tasting on an annual basis, maintains fre-
quent collaboration with unions, and maintains
an occupational health and safety management
system in accordance with the OHSAS 18001
standard.
c. Outcome and KPIs
The company has organised training for its
commercial organisation, as well as the sales
and marketing personnel, every year since
2016. The Let’s Lead Better training for man-
agers was kicked off in 2017. The Let’s Lead
Better training is based on the principles of
the Altia Behaviours, which are part of all the
development and training of Altia’s people.
Altia’s annual Altia Tasting employee survey
was organised in January 2018. The revised
42BOARD REPORT
BUSINESS OVERVIEW
CORPORATERESPONSIBILITY
CORPORATE GOVERNANCE
FINANCIAL STATEMENTS
ANNUAL REPORT2018

KPI 2018 2017 2016
Sickness absence, % 3.4 3.3 3.2
Accident absence rate 13 11 8
Accident absence, % 0.07 0.29 0.22
Number of accidents 17 16 N/A
The number of accidents was not monitored at all sites in 2016, due to which the KPI for 2016 is missing. An accident is defined as any accident leading to at least one day of absence. More details about the indicators are available under Altia & Employees in the section on Corporate Responsibility.
KPI 2018 2017 2016
Share of purchases from risk countries as identified in amfori BSCI risk country classification
3% 4% 4%
Number of grievances related to human rights re-ported through the whistleblowing channel
0 0 N/A
The whistleblowing channel was launched in October 2017, due to which the first full year figure concerns 2018.
survey provided managers with increasingly
precise results for the development of their own
leadership. The most important development
targets uncovered in the employee survey
related to the communication of opportunities
for competence development, the develop-
ment of leadership skills and the visibility of the
executive management. Several measures were
carried out during the year to develop these
areas, such as the Let’s Lead Better training
sessions and Altia’s Top Leader’s Forum.
The results of the indicators for occupational
health and safety are presented in the table
above. There were no fatal work-related
accidents during the year.
Respect for human rights
a. Policies and ways of working
(including due diligence)
Altia is committed to respecting and promoting
human rights and international labour stand-
ards in accordance with the United Nation’s
(UN) Universal Declaration of Human Rights
and the key conventions of the International
Labour Organization (ILO). Altia also expects the
same from its suppliers, partners and subcon-
tractors.
Altia’s most relevant human rights impacts are
related to the sourcing of wines, spirits and raw
materials. In 2017, Altia joined amfori BSCI and
amfori BSCI’s Sustainable Wine Programme to
develop responsible sourcing. As a participant
Altia is committed to furthering the principles of
the amfori BSCI Code of Conduct in its supply
chains. The code of conduct’s principles are
based on key international agreements and
frameworks such as ILO conventions and decla-
rations, the UN Guiding Principles on Business
and Human Rights, as well as OECD guidelines
for multinational enterprises.
Altia’s due diligence process is developed con-
tinuously. It is currently composed of mapping
the supply chains of our products and their
components, using a questionnaire to gather
information about our suppliers’ and partners’
responsibility work, contractual obligations as
well as participation in and utilisation of the
tools offered by amfori BSCI, including third
party audits. Altia has a whistleblowing channel
open to all stakeholders, maintained by an
independent third party.
The standards, policies and principles relevant to
Altia’s work with human rights matters include:
• Altia Code of Conduct
• amfori BSCI Code of Conduct
• Altia Code of Conduct for Suppliers and
Subcontractors
b. Principal risks and their management
The principal risks are related to Altia’s busi-
ness relationships and primarily concern the
wine, spirits and raw material supply chains
where these extend to countries with a higher
risk of possible violations of international
labour standards. In addition, Altia’s customers
have demands for social compliance within
the supply chains, and any violation of such
demands by Altia’s suppliers, sub-suppliers or
partners could lead to situations where a cus-
tomer stops any further deliveries of a product.
The risks are managed with the due diligence
process explained above.
c. Outcome and KPIs
21 amfori BSCI audits (full audits or follow-up
audits) were conducted at Altia’s suppliers,
partners or their sub-suppliers in 2018 (18 in
2017). The areas where improvement needs
were identified included the maintenance of
sufficient management systems to ensure com-
pliance with social responsibility, occupational
health and safety and compliance with regu-
lations related to working hours. In addition,
focused inspections, commissioned by Altia’s
customers, continued at some of suppliers or
partners in South Africa.
During 2018, Altia personnel responsible for
sourcing took part for example in a web based
training of responsible sourcing, organised by
Altia’s customer. Additionally, an amfori BSCI
audit planning for 2019 was initiated for sup-
pliers of raw materials for Altia’s proprietary
brands. Furthermore, Altia continued its coop-
eration with various stakeholders to address
the concerns regarding working conditions at
South African vineyards.
43BOARD REPORT
BUSINESS OVERVIEW
CORPORATERESPONSIBILITY
CORPORATE GOVERNANCE
FINANCIAL STATEMENTS
ANNUAL REPORT2018

KPI 2018 2017 2016
Communication and training on anti-corruption policies
Online course on the Altia Code of Con-duct organised for
the entire personnel
The relevant em-ployees at Altia were provided with online
training
N/A
Number of anti-corruption and bribery incidents reported through the whis-tleblowing channel
0 0 N/A
Anti-corruption and -bribery mattersa. Policies and ways of working (including
due diligence)
Altia has zero tolerance towards bribery and
corruption. The company is committed to op-
erating fairly and to not offering improper ben-
efits to any party. Altia also expect its repre-
sentatives, consultants, agents, subcontractors
and other business partners to unconditionally
refrain from corruptive behaviour when per-
forming services for Altia or on its behalf. Altia
does not support, either directly or indirectly,
political parties or organisations. Nor does the
company participate in financing the election
campaigns of individual candidates.
Altia published its new Code of Conduct is
2018. The Altia Code of Conduct describes the
company’s commitment to responsibility and
integrity. The cornerstones of the Altia Code
of Conduct are our employees, our business and
our integrity. Every Altia employee is familiar-
ised with the Altia Code of Conduct, including
the company’s anti-bribery and corruption
activities, with the help of an online course.
Altia has a whistleblowing channel maintained
by an independent third party. The channel
is open to all Altia employees and external
stakeholders. All concerns raised, whether
through the channel or through other means,
are investigated in accordance with an estab-
lished process to ensure accuracy, anonymity
and fairness.
The standards, policies and principles relevant
to anti-corruption and bribery matters include:
• Altia Code of Conduct
• Anti-Bribery and Corruption Policy
• Whistleblowing channel
b. Principal risks and their management
The risks are assessed as part of Altia Group’s
risk management. The principal risks associ-
ated with anti-corruption and bribery matters
include a reputational risk caused by any act
of corruption or bribery, especially related
to Altia’s key persons and business partners.
Given that the alcohol business is often a
regulated business, obtaining the necessary
licenses and permits is associated with a risk of
corruption or bribery, especially in countries
with a high corruption index. The risks are
managed through contractual obligations, third
party due diligence inspections concerning
suppliers and distributors, where necessary, as
well as internal training on the Altia Anti-Brib-
ery and Corruption Policy.
c. Outcome and KPIs
In 2018, Altia arranged a Code of Conduct
online course, mandatory for its entire per-
sonnel. The whistleblowing channel has been
in use since 2017. No reports were submitted
through the whistleblowing channel in 2018.
The first full-year figures on reports received
through the whistleblowing channel were
available in 2018.
Helsinki, 6 February 2019
Altia Plc
Board of Directors
44BOARD REPORT
BUSINESS OVERVIEW
CORPORATERESPONSIBILITY
CORPORATE GOVERNANCE
FINANCIAL STATEMENTS
ANNUAL REPORT2018
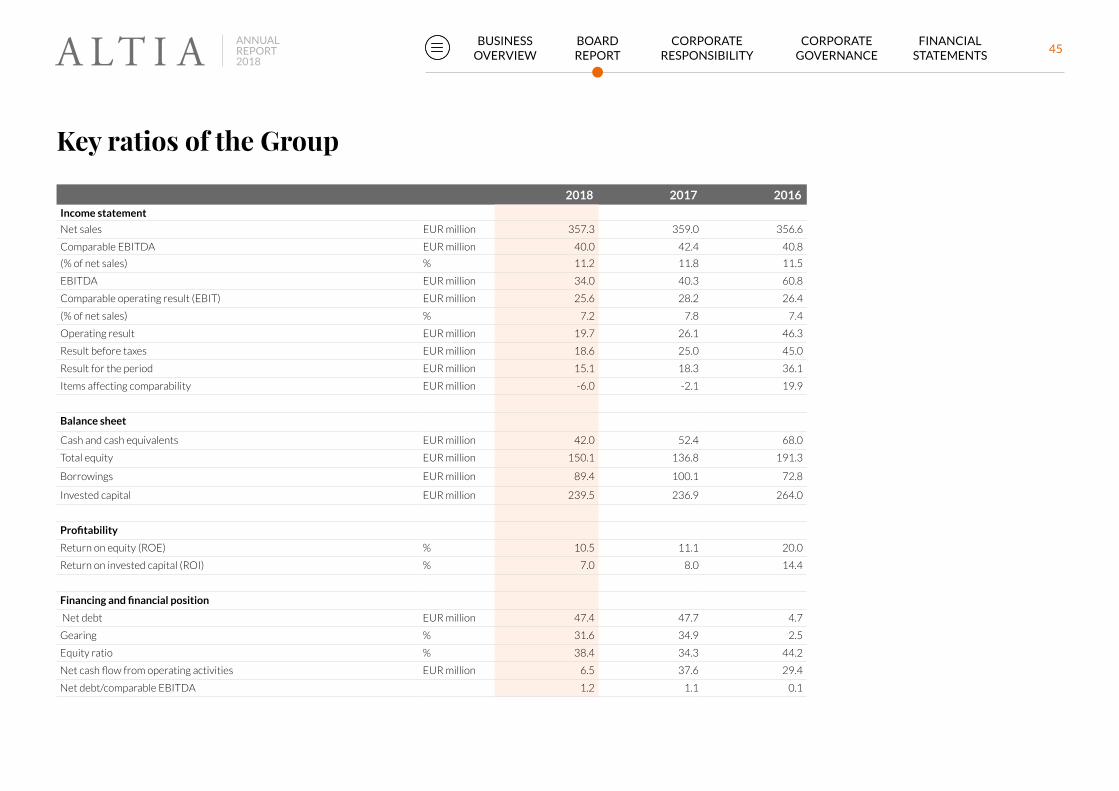
2018 2017 2016
Income statement
Net sales EUR million 357.3 359.0 356.6
Comparable EBITDA EUR million 40.0 42.4 40.8
(% of net sales) % 11.2 11.8 11.5
EBITDA EUR million 34.0 40.3 60.8
Comparable operating result (EBIT) EUR million 25.6 28.2 26.4
(% of net sales) % 7.2 7.8 7.4
Operating result EUR million 19.7 26.1 46.3
Result before taxes EUR million 18.6 25.0 45.0
Result for the period EUR million 15.1 18.3 36.1
Items affecting comparability EUR million -6.0 -2.1 19.9
Balance sheet
Cash and cash equivalents EUR million 42.0 52.4 68.0
Total equity EUR million 150.1 136.8 191.3
Borrowings EUR million 89.4 100.1 72.8
Invested capital EUR million 239.5 236.9 264.0
Profitability
Return on equity (ROE) % 10.5 11.1 20.0
Return on invested capital (ROI) % 7.0 8.0 14.4
Financing and financial position
Net debt EUR million 47.4 47.7 4.7
Gearing % 31.6 34.9 2.5
Equity ratio % 38.4 34.3 44.2
Net cash flow from operating activities EUR million 6.5 37.6 29.4
Net debt/comparable EBITDA 1.2 1.1 0.1
Key ratios of the Group
45BOARD REPORT
BUSINESS OVERVIEW
CORPORATERESPONSIBILITY
CORPORATE GOVERNANCE
FINANCIAL STATEMENTS
ANNUAL REPORT2018

2018 2017 2016
Share-based key ratios
Earnings / share (Basic and diluted) EUR 0.42 0.51 1.00
Equity / share EUR 4.15 3.80 5.32
Dividend / share EUR 0.38* - 1.96
Dividend/earnings % 91.2* - 196
Effective dividend yield % 5.4* - -
Price/Earnings 17.0 - -
Closing share price on the last day of trading EUR 7.07 - -
Highest EUR 9.50 - -
Lowest EUR 7.015 - -
Market value of shares at the end of period EUR million 255.5 - -
Number of shares outstanding at the end of period 36 140 485 35 960 000 35 960 000
Personnel
Average number of personnel 718 762 829
* Board's proposal
46BOARD REPORT
BUSINESS OVERVIEW
CORPORATERESPONSIBILITY
CORPORATE GOVERNANCE
FINANCIAL STATEMENTS
ANNUAL REPORT2018

RECONCILIATION OF ALTERNATIVE PERFORMANCE MEASURES (APM) TO IFRS FIGURES AND ITEMS AFFECTING COMPARABILITY (IAC)
EUR million 2018 2017
Items affecting comparability
Net gains or losses from business and assets disposals 0.4 1.3
Cost for closure of business operations and restructurings -1.1 -1.1
Major corporate projects
Costs related to the closed voluntary pension scheme -0.7 -
Costs related to stock exchange listing -4.6 -2.4
Total items affecting comparability -6.0 -2.1
Comparable EBITDA
Operating result 19.7 26.1
Less:
Depreciation, amortisation and impairment 14.4 14.2
Total items affecting comparability 6.0 2.1
Comparable EBITDA 40.0 42.4
% of net sales 11.2 11.8
Comparable EBIT
Operating result 19.7 26.1
Less:
Total items affecting comparability 6.0 2.1
Comparable EBIT 25.6 28.2
% of net sales 7.2 7.8
Altia presents alternative performance
measures as additional information to financial
measures presented in the consolidated
income statement, consolidated balance sheet
and consolidated statement of cash flows pre-
pared in accordance with IFRS. In Altia’s view,
alternative performance measures provide
significant additional information on Altia’s
results of operations, financial position and
cash flows to management, investors, analysts
and other stakeholders.
Alternative performance measures should not
be viewed in isolation or as a substitute to the
IFRS financial measures. All companies do not
calculate alternative performance measures in
a uniform way, and therefore Altia’s alternative
performance measures may not be comparable
with similarly named measures presented by
other companies.
The alternative performance measures are
unaudited.
47BOARD REPORT
BUSINESS OVERVIEW
CORPORATERESPONSIBILITY
CORPORATE GOVERNANCE
FINANCIAL STATEMENTS
ANNUAL REPORT2018

THE DEFINITIONS AND REASONS FOR THE USE OF FINANCIAL KEY INDICATORS
Key figure Definition Reason for the use
Operating margin, % Operating result / Net sales Operating result shows result generated by the operating activities.
EBITDA EBITDA margin, %
Operating result before depreciation and amortizationEBITDA / Net sales
EBITDA is the indicator to measure the performance of the Group.
Comparable operating result Comparable operating margin, %
Comparable EBITDA
Comparable EBITDA margin, % Items affecting comparability
Operating result excluding items affecting comparabilityComparable operating result / Net sales
EBITDA excluding items affecting comparability
Comparable EBITDA / Net salesMaterial items outside normal business, such as net gains or losses from business and assets disposals, impairment losses, cost for closure of business operations and restructurings, major corporate projects including direct transaction costs related to business acquisitions, voluntary pension plan change and costs related to other corporate development.
Comparable EBITDA, comparable EBITDA margin, comparable operating result and compa-rable operating margin are presented in addition to EBITDA and operating result to reflect the underlying business performance and to enhance comparability from period to period. Altia believes that these comparable performance measures provide meaningful supple-mental information by excluding items outside normal business, which reduce comparability between the periods.
Comparable EBITDA is an internal measure to assess performance of Altia and key perfor-mance measure at segment level together with net sales.
Comparable EBITDA margin is also one of Altia’s financial targets. Comparable EBITDA is commonly used as a base for valuation purposes outside the Company and therefore impor-tant measure to report regularly.
Invested capital Total equity + Borrowings Base for ROI measure.
Return on equity (ROE), % Result for the period / Total equity This measure can be used to evaluate how efficiently Altia has been able to generate results in relation to the equity of the Company.
Return on invested capital (ROI), %
(Result for the period + Interest expenses) / (Total equity + Non-current and current bor-rowings) (average)
This measure is used to evaluate how efficiently Altia has been able to generate net results in relation to the total investments made to the Company.
Borrowings Net debt
Non-current borrowings + Current borrowingsBorrowings – cash and cash equivalents
Net debt is an indicator to measure the total external debt financing of the Group.
Gearing, % Net debt / Total equity Gearing ratio helps to show financial risk level and it is a useful measure for management to monitor the level of Group’s indebtedness. Important measure for the loan portfolio.
Equity ratio, % Total equity / Total assets – Advances received Equity / assets ratio helps to show financial risk level and it is a useful measure for manage-ment to monitor the level of Group’s capital used in the operations.
Net debt / Comparable EBITDA Net debt / Comparable EBITDA The level of Net debt / Comparable EBITDA is one of Altia’s financial targets.
Earnings / share Result for the period attributable to shareholders of the parent company/Share-issue adjusted number of shares during the period
Equity/share Equity attributable to shareholders of the parent company /Share- issue adjusted number of shares at the end of period
Dividend/share Dividend distribution for period/Number of shares (basic) at the end of period
Dividend / earnings % Dividend/share / Earnings/ share
Effective dividend yield % Dividend/share / Price of share at the end of the accounting period
Price / earnings Price of share at the end of accounting period / Earnings/share
Market value of outstanding shares The number of shares at the end of accounting period x the price of the share at the end of accounting period.
48BOARD REPORT
BUSINESS OVERVIEW
CORPORATERESPONSIBILITY
CORPORATE GOVERNANCE
FINANCIAL STATEMENTS
ANNUAL REPORT2018

Corporate Responsibility
49BOARD REPORT
BUSINESS OVERVIEW
CORPORATERESPONSIBILITY
CORPORATE GOVERNANCE
FINANCIAL STATEMENTS
ANNUAL REPORT2018

Steering of Altia’s responsibility work
Our responsibility work is guided by Altia’s purpose and strategy, the expecta-tions of our stakeholders, our business principles, as well as the amfori BSCI Code of Conduct, which is based on international conventions and to which we are committed to.
A ltia’s responsibility affairs are
discussed regularly in Altia’s
Corporate Responsibility
Working Group, whose 14
members represent Altia’s
different business opera-
tions. The Corporate Responsibility Working
Group ensures that Altia’s responsibility pro-
gramme proceeds according to the set targets.
The Working Group reports on the progress
of CR work to the Executive Management
Team. The Working Group is chaired by Altia’s
Senior Vice President, Scandinavia, a member
of the Executive Management Team.
Each member of the Executive Management
Team is accountable for the responsibility
affairs related to their own organisation.
Concrete actions and measures supporting
responsibility have been integrated in the
operational planning of each business area and
approved by the Executive Management Team.
The implementation of these measures is moni-
tored in the business areas’ respective manage-
ment teams and in Altia’s Corporate Responsi-
bility Working Group. Based on this progress
and taking into consideration the expectations
of stakeholders, the Corporate Responsibility
Working Group proposes development targets
for Altia’s future responsibility programme.
The progress of responsibility work is monitored
with the help of various meters and indicators.
These include environmental meters from waste
volumes to the consumption of water and en-
ergy, accident frequency rates and sickness ab-
sence percentages, as well as personnel surveys.
Altia’s Corporate Responsibility Manager is in
charge of development and reporting related to
Altia’s corporate responsibility and the coordina-
tion of the company-level responsibility work.
Further information: Materiality analysis (p. 55).
50BOARD REPORT
BUSINESS OVERVIEW
CORPORATERESPONSIBILITY
CORPORATE GOVERNANCE
FINANCIAL STATEMENTS
ANNUAL REPORT2018

Altia’s responsibility action programme 2018–2020
Altia & Customers • Continue work on and increase communication about
Altia’s Lets Drink Better aim• Continue work with product safety & quality for different
product categories• Continue work to increase traceability in the value chain• Balance the product portfolio with responsible and
sustainable consumption trends and set targets• Highlight corporate responsibility in Altia brand stories
Altia & Society• Maintain good cooperation with
stakeholders related to responsible and sustainable drinking culture
• Continue work to increase transparency and traceability in the supply chain
• Progress according to targets set for amfori BSCI audit coverage
• Utilise efficiently the tools and resources provided by amfori BSCI and continue the development of Altia’s responsible sourcing processes
Altia & Environment • Continue work on reduction of energy usage and CO
2
emissions• Continue work on sustainable and efficient packaging strat-
egy, for example by reducing overpacking, using more recy-cled and recyclable materials and using lighter packaging
• Investigate solutions for reducing or reutilising waste alcohol from production
• Continue work in optimising logistics to minimise Altia's
CO2
footprint• Continue energy saving operations according to targets set
in the energy efficiency agreement • Continue cooperation with BSAG and contract farmers to
promote sustainable agriculture• Protect Rajamäki’s pure groundwater• Continue work to improve the quality of wastewater
Altia & Employees• Continue the wide and versatile
occupational health and safety work to enhance a safety culture aiming for zero accidents
• Enhance leadership and organisa-tional culture based on annual Altia Tasting results
• Enhance employee health and wellbeing through concrete initiatives, for example work ergonomics
• Promote a happy and productive workplace
• Incorporate the views and expectations of new shareholders in Altia’s corporate responsibility programme
• Enhance communication of Altia's corporate responsibility efforts through various communication channels, both internally and externally
• Continue the integration of corporate responsibility-related risks more systematically in the Altia Group risk management process
Altia’s responsibility programme 2018–2020
2018 marked the first year of Altia’s corporate responsibility action programme for 2018–2020. In the following sections of this report, we will report on the progress of this new action programme during 2018.
We already started plan-
ning our responsibility
action programme
during the second half
of 2017. The action
programme is based on
our strategy, desk analysis of trends and drivers
in the industry, previous responsibility action
plans, views from our stakeholders, Executive
Management Team, Altia’s Corporate Respon-
sibility Working Group as well as several other
Altia key personnel. The outcome of this planning
process was that we received 45 ideas for devel-
oping Altia’s corporate responsibility in 2018–
2020, with several concrete actions for each
idea. Based on these ideas, the company purpose
and corporate responsibility cornerstones and
each cornerstone’s focus areas, we built our
corporate responsibility action programme for
2018–2020. Prioritised actions are selected an-
nually and included in the relevant business’s op-
erational planning. The programme’s implemen-
tation is frequently reviewed in the Corporate
Responsibility Working Group, and the results
are reported to the Executive Management
Team. Altia’s Corporate Responsibility Manager
leads the work. The table below presents the key
focus areas of Altia’s responsibility programme.
Key development in 2019
In 2019, we will continue the work started in
2018 to implement the responsibility pro-
gramme for 2018-2020. In 2019, the devel-
opment actions are related to our purpose
Lets Drink Better, brand image and marketing,
consumer focus and understanding, innovation
and product development, operational efficien-
cy, sustainability in value chain, risk manage-
ment and personnel and management. We will
also focus on the views and expectations of
our new shareholders towards our CR work.
The key development focus of Altia Corporate
responsibility in 2019 will be Altia's sustaina-
bility strategy and long-term targets that will
be published during 2019. Product quality and
safety as well as the occupational health and
safety will remain among the top priorities. The
focus will also be in climate change and other
sustainability related risks and their incorpora-
tion into the Altia corporate risk management
processes. The continuous work to increase
our supply chain transparency and traceability
will continue. We are also preparing for LCA
(Life cycle analysis) calculations for our core
products. Furthermore, we are developing our
packaging further to reduce the impact on the
environment.
51BOARD REPORT
BUSINESS OVERVIEW
CORPORATERESPONSIBILITY
CORPORATE GOVERNANCE
FINANCIAL STATEMENTS
ANNUAL REPORT2018

Stakeholder dialogue ALTIA'S STAKEHOLDERS
We highly value our stakeholders’ views on our corporate responsibility. In 2018, six months after the IPO, we updated our corporate responsibility materiality analysis based on investors’ views.
A t Altia, our stakeholders’ per-
ceptions of our responsibility
are of the utmost impor-
tance to us. The views of our
stakeholders are among the
key drivers in developing and
prioritising our operations related to corporate
responsibility. We want to communicate our
operations to our stakeholders openly and
transparently through various communication
channels.
In addition to interaction through various
communication channels in the course of
normal business operations, we regularly ask
our stakeholders about their perceptions of
our responsibility. The most recent survey was
conducted in 2018 and was used as input in
updating our materiality analysis. The survey
was conducted in two parts. A web-based
survey was directed at Altia’s private share-
holders. Additionally, a number of one-to-one
interviews were held with institutional inves-
tors. Based on the findings, the materiality as-
sessment and focus areas of Altia’s corporate
responsibility cornerstones were amplified.
Our other stakeholder activities during 2018
included the organising of a panel discussion
with Pernod-Ricard at SuomiAreena on the
stage of the Finnish Food and Drink Industries’
Federation. The topic of the panel discussions
was the impact of the new alcohol law on drink-
ing culture in Finland. The discussion focused
on how the change of the drinking culture in
a more sustainable direction would be seen in
restaurants.
During the reporting period, issues discussed
and closely followed by the media and other
stakeholders were mainly connected with the
new Finnish Alcohol Act and its effects on con-
sumer behaviour, commerce, shelf selections
and the private importing of alcohol.
Altia was invited to participate in the working
group of the Minister of Family Affairs and So-
cial Services, which monitors the effects of the
new Alcohol Act and discusses drinking culture
among different stakeholders. Participants
in the working group included authorities,
substance abuse and health organisations and
representatives of different sectors.
Altia actively participates in discussion on
social media channels such as Twitter. We
have also continued the development of our
communication channels by launching an
investor website under the group website
altiagroup.com.
Altia’s Cheers! developer community, with over
1 600 participants, remained active: more than
50 consumer insight projects were conducted
during the reporting year.
Altia’s main stakeholders, their expectations
and our engagement channels are presented in
the following table.
52BOARD REPORT
BUSINESS OVERVIEW
CORPORATERESPONSIBILITY
CORPORATE GOVERNANCE
FINANCIAL STATEMENTS
ANNUAL REPORT2018

OwnersPolitical
decision-makers, public authorities
Business customers Personnel Partners
• direct contacts and meetings
• investor fairs and events, seminars
• annual general meetings• financial reporting and
conference calls/webcasts • external communications,
releases, website
• reporting• direct contacts• audits• external communications
• direct contacts• digital channels• customer training• requests for quotation
and contracts• fairs and other events
• internal communications• training• development discussions• cooperation procedures• team practices and
procedures
• meetings and direct contacts
• reporting• newsletters• requests for quotation
and contracts• fairs and other events
• economic contribution• sustainable growth• risk management,
corporate governance, transparency
• reducing environmental impacts
• responsible supply chain• responsibility towards
employees
• compliance with laws and regulations
• reducing environmental impacts
• responsible supply chain
• responsibility towards employees
• cooperation and responsi-bility towards customers
• product quality and safety• supporting responsible
drinking culture • responsible marketing
and sourcing• reducing environmental
impacts
• responsibility towards employees
• product quality and safety• advocating responsible
alcohol consumption and responsible marketing
• reducing environmental impacts
• advocating responsible alcohol consumption through responsible marketing
• consumer and market understanding
• cooperation and partnership
Stakeholder interaction
STAKEHOLDER
Altia’s main stakeholders, their expectations and our engagement channels are presented in the table below.
EXPECTATIONS
ENGAGEMENT CHANNELS
ALTIA'S STAKEHOLDERS
53BOARD REPORT
BUSINESS OVERVIEW
CORPORATERESPONSIBILITY
CORPORATE GOVERNANCE
FINANCIAL STATEMENTS
ANNUAL REPORT2018
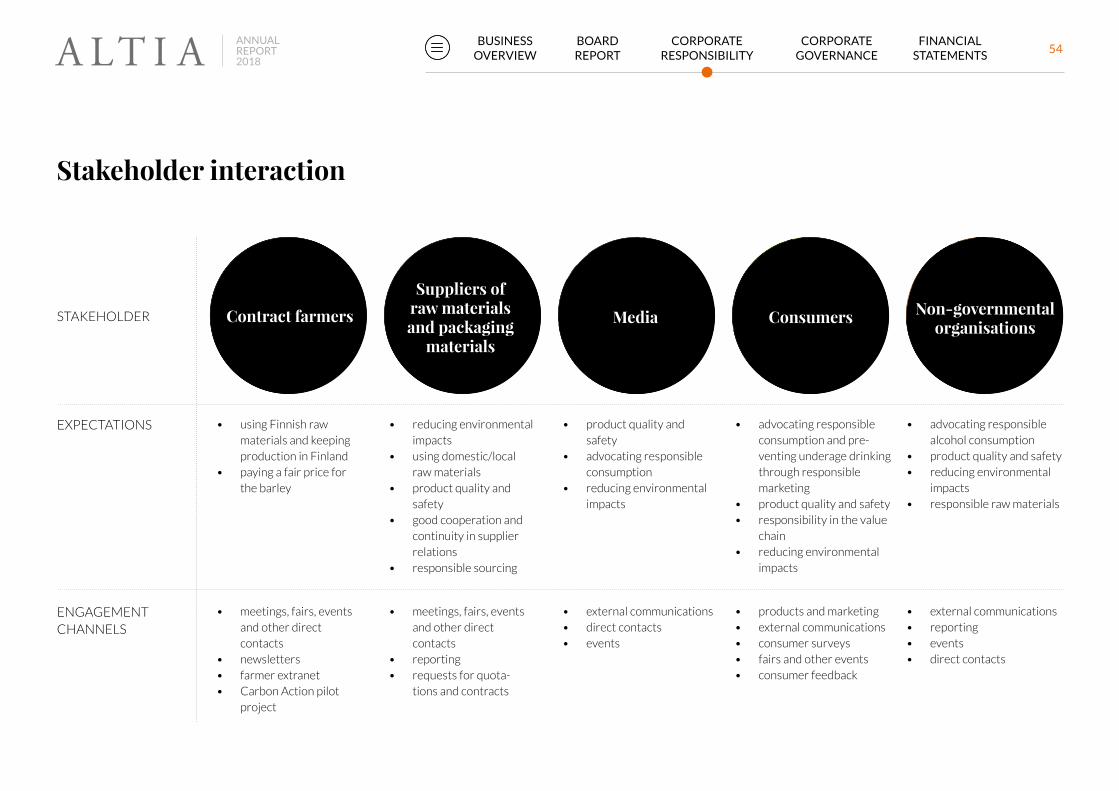
Contract farmers
Suppliers of raw materials and packaging
materials
Media Consumers Non-governmental organisations
• using Finnish raw materials and keeping production in Finland
• paying a fair price for the barley
• reducing environmental impacts
• using domestic/local raw materials
• product quality and safety
• good cooperation and continuity in supplier relations
• responsible sourcing
• product quality and safety
• advocating responsible consumption
• reducing environmental impacts
• meetings, fairs, events and other direct contacts
• newsletters• farmer extranet• Carbon Action pilot
project
• meetings, fairs, events and other direct contacts
• reporting• requests for quota-
tions and contracts
• external communications• direct contacts• events
• advocating responsible consumption and pre-venting underage drinking through responsible marketing
• product quality and safety• responsibility in the value
chain• reducing environmental
impacts
• advocating responsible alcohol consumption
• product quality and safety• reducing environmental
impacts• responsible raw materials
• products and marketing• external communications• consumer surveys• fairs and other events• consumer feedback
• external communications• reporting• events• direct contacts
STAKEHOLDER
EXPECTATIONS
ENGAGEMENT CHANNELS
Stakeholder interaction
54BOARD REPORT
BUSINESS OVERVIEW
CORPORATERESPONSIBILITY
CORPORATE GOVERNANCE
FINANCIAL STATEMENTS
ANNUAL REPORT2018

Materiality analysis
In 2018, six months after the IPO, we
updated our corporate responsibility
materiality analysis to better reflect
our investors’ views and expectations
of our corporate responsibility. This
was done by conducting both a web-
based survey to private shareholders, being
open to other stakeholder groups, and inter-
viewing a number of institutional investors.
The analysis was conducted between Septem-
ber and November 2018. The materiality anal-
ysis process included a robust desktop study
of global megatrends and trends related to the
development of responsibility in the alcohol
industry, a web-based survey of stakeholders,
interviews with institutional investors, and the
review and update of the materiality matrix
based on the requirements of GRI standards.
The updated corporate responsibility materiali-
ty matrix can be seen on the next page.
The web-based survey
The web-based survey on material corporate
responsibility topics was available on Altia’s web-
site and shared through social media, resulting in
a total of 308 responses. About 30% of respond-
ents were Altia’s shareholders, about 30% were
customers and another 30% were consumers.
Respondents also included the media, farmers,
NGOs, investors, retailers and politicians.
In the survey, we asked our stakeholders
to score the different focus areas of corpo-
rate responsibility according to the level of
importance, from 1 to 5. The survey was based
on Altia’s current corporate responsibility cor-
nerstones and focus areas, a desktop study to
ensure the special and timely attention areas
of corporate responsibility concerning Altia
and Altia’s stakeholders were considered in the
assessment, and the views of Altia manage-
ment. The assessment areas on the basis of
the desktop study included climate change, the
circular economy in packaging and production,
water usage, workforce diversity, employee
development, biodiversity and transparency.
Among all the web-based survey respond-
ents, the quality and safety of Altia’s products
scored the highest importance. Other mate-
rial topics raised by all the respondents were
corporate governance and transparency,
conserving groundwater, utilising responsibly
produced raw materials, minimising our own
environmental impacts and human rights in the
supply chain.
Among Altia’s shareholders, product quality
and safety was seen as the most important
focus area of corporate responsibility, whilst
transparency and good governance was
raised as a new focus area. The conserving of
groundwater, the circular economy, sustaina-
ble packaging, utilising responsibly produced
raw materials and occupational safety were
also highlighted.
Interviews with Altia’s
institutional investors
As part of the materiality analysis and to gain
a deeper understanding of our investors’
expectations of our responsibility work, we
conducted a number of interviews with our
large institutional investors.
Based on these interviews, the overall result
was that Altia’s ESG (environmental, social,
governance) performance was considered to
be of a high level. In the interviews, product
safety and quality were seen as the single most
important focus area for Altia. Other impor-
tant focus areas identified were responsible
marketing, the circular economy, responsibly
produced and traceable raw materials and sus-
tainable packaging. The megatrend of health
and wellbeing was highlighted as relevant for
careful monitoring by Altia. ESG reporting and
communication were considered good, having
room for improvement in conciseness, acces-
sibility and business alignment. Overall, based
on the interviews, Altia’s corporate responsi-
bility was seen to be good, with an opportunity
to build brands further on the basis of Altia’s
circular economy, pure ground water and
authenticity.
Altia’s corporate responsibility performance was
scored by all respondents to the web-based survey
at 3.4 and by shareholders at 3.6 (on a scale of
1–5).
Transition to reporting according to
GRI standards
As part of the update of our corporate
responsibility materiality analysis, we up-
dated the materiality asessment to fullfil the
requirements of the GRI standards. According
to the GRI standards, materiality is assessed
by an organisation’s impact on the economy,
environment, and society and by the topic’s
influence on stakeholder decision making. The
dimensions for considering materiality were
shifted to a focus on impact on stakeholder de-
cision making instead of on immediate business
consequences.
Results
The megatrends driving Altia’s corporate
responsibility were identified as health and
wellbeing, the circular economy and climate
change.
55BOARD REPORT
BUSINESS OVERVIEW
CORPORATERESPONSIBILITY
CORPORATE GOVERNANCE
FINANCIAL STATEMENTS
ANNUAL REPORT2018

The key focus areas of Altia’s corporate respon-
sibility based on our stakeholder views were:
• Product quality and safety
• Responsible marketing
• Conserving groundwater
• Occupational health and safety
• Transparency and good governance
• Responsibily produced raw materials
• Climate change (energy and CO2
emissions)
• The circular economy
• Sustainable packaging
Based on the findings, the cornerstones of
Altia responsibility remained Altia & Custom-
ers, Altia & Society, Altia & Environment and
Altia & Employees. New focus areas emerging
as material under the cornerstones were
transparency and good governance, employ-
ee development and sustainable packaging.
Already existing material topics that were
amended were a balanced portfolio aligned
with responsible consumption trends, respon-
sibly produced and traceable raw materials,
sustainable and resilient agriculture, energy
consumption and CO2 emissions, and employ-
ee development and good leadership.
The results were reviewed by our Corporate
Responsibility Working Group. Our Executive
Management Team and our Board of Directors
approved the updated responsibility corner-
stones and the materiality matrix in December
2018. The results will be taken as one of the
key drivers in the development of Altia’s corpo-
rate responsibility and incorporated in Altia’s
corporate responsibilty action programme for
2018–2020.
Level of organization’s economic, environmental & social impacts
HighLow
Low
Hig
hLe
vel o
f sta
keho
lder
con
cern
Material aspects Quality & safety of Altia products
Responsibly produced andtraceable raw material
Balanced product portfolio aligned with responsible consumption trends
Responsible marketing
Responsibility in supply chain
Transparency and good governance
Energy consumption and CO2 emissions
Sustainable and resilient agriculture
Conserving groundwater
Sustainable packaging
Well-being of employees
Occupational health & safety
Employee development & good leadership
Altia & Society
Altia & Environment
Altia & Employees
Altia & Customers
F
D
R
M
P
G
Q
E
O
B
K
A
T
F
G
M
P
KB
A
E
O
Q
D
New topics are highlighted with a dark red rim
Topic has been reworded
R
T
Read more: Responsibility cornerstones (p. 58).
56BOARD REPORT
BUSINESS OVERVIEW
CORPORATERESPONSIBILITY
CORPORATE GOVERNANCE
FINANCIAL STATEMENTS
ANNUAL REPORT2018

Material topic Boundary 1 Management approach
Quality and safety of Altia's products
Altia, partners, raw material suppliers • ISO22000 food safety management system2 ,• ISO9001 Quality management system3
• Altia Quality Safety and Environment Principles
Responsibly produced and tracea-ble raw materials
Altia, partners, raw material suppliers • ISO22000 food safety management system• Altia Quality Safety and Environment Principles• amfori BSCI Code of Conduct• amfori BSCI risk country classification• Altia Code of Conduct for Suppliers and Subcontractors
Balanced product portfolio aligned with responsible consumption trends
Altia, partners, customers, raw material suppliers • ISO9001 Quality management system4
• Altia research and development• Annual consumer insight projects
Responsible marketing Altia • Altia Marketing Principles
Transparency and good governance
Altia • Finnish Corporate Governance Code 2015• Altia’s tax strategy• Market Abuse Regulation (MAR)• Securities Market Act• Rules of the Exchange• Finnish Corporate Governance Code 2015• Guidelines for Insiders (Nasdaq Helsinki)• Guidelines by FIN-FSA• Accounting Act
Energy consumption and CO2
emissions
Altia • ISO14001 Environmental management system5
• Energy efficiency agreement• Altia Quality Safety and Environment Principles
Sustainable and resilient agriculture
Altia, farmers • ISO14001 Environmental management system• ISO9001 Quality managagement system
Conserving groundwater Altia • Finnish laws and regulations• Water abstraction permit• Land ownerships• Control of operations of owned land• ISO14001 environmental management system
Sustainable packaging Altia, partners, raw material suppliers • ISO9001 quality management system• ISO14001 environmental management system• Fair trade• Fair for Life• Altia
Well-being of employees Altia • Altia Tasting
Employee development and good leadership
Altia • Altia Tasting
Occupational health and safety Altia • OHSAS18001 Occupational health and safety management system
1 The boundary indicates whether the aspect is material within the company or outside the company. 2 The certification covers Altia's Rajamäki plant.3 The certification covers Altia’s operations in Finland (The Koskenkorva plant, the Rajamäki plant and the technical ethanol unit, and the functions at the Helsinki headquarters) and the Tabasalu plant. 4 The certification covers Altia’s operations in Finland (The Koskenkorva plant, the Rajamäki plant and the technical ethanol unit, and the functions at the Helsinki headquarters) and the Tabasalu plant. 5 The certification covers Altia's operations in Finland.
57BOARD REPORT
BUSINESS OVERVIEW
CORPORATERESPONSIBILITY
CORPORATE GOVERNANCE
FINANCIAL STATEMENTS
ANNUAL REPORT2018
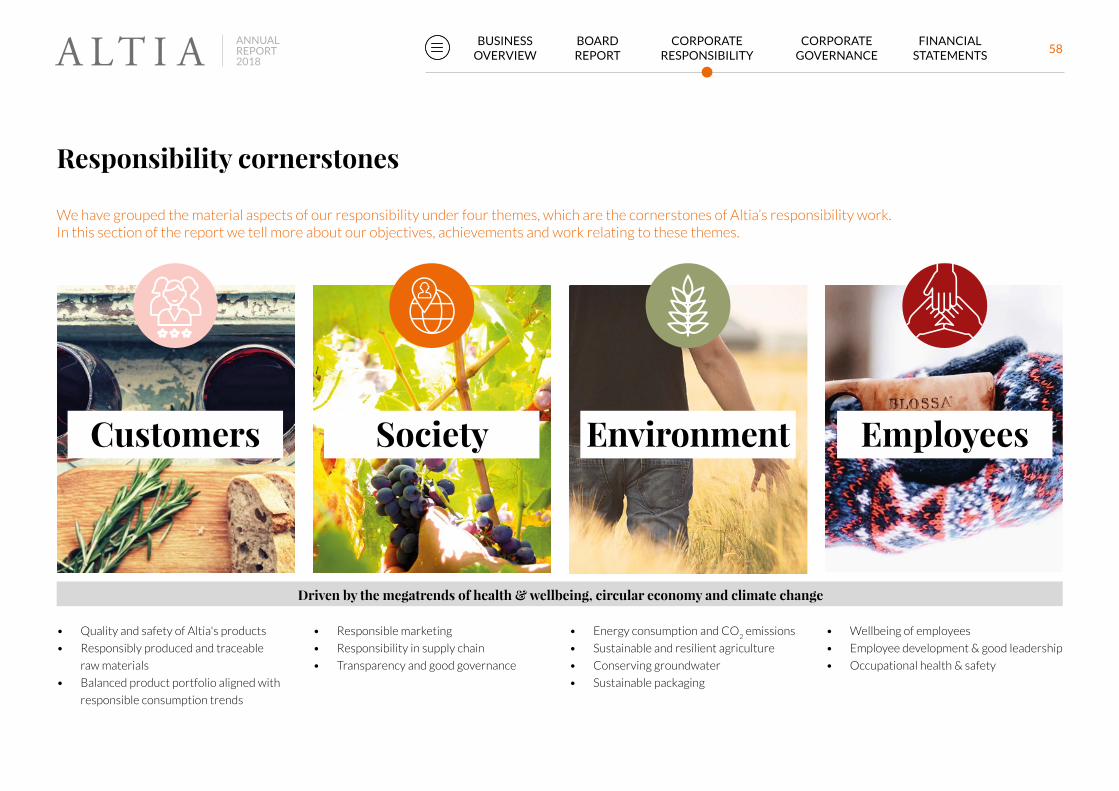
Responsibility cornerstones
We have grouped the material aspects of our responsibility under four themes, which are the cornerstones of Altia’s responsibility work. In this section of the report we tell more about our objectives, achievements and work relating to these themes.
• Responsible marketing
• Responsibility in supply chain
• Transparency and good governance
• Quality and safety of Altia's products
• Responsibly produced and traceable
raw materials
• Balanced product portfolio aligned with
responsible consumption trends
• Energy consumption and CO2 emissions
• Sustainable and resilient agriculture
• Conserving groundwater
• Sustainable packaging
• Wellbeing of employees
• Employee development & good leadership
• Occupational health & safety
Customers Society Environment Employees
Driven by the megatrends of health & wellbeing, circular economy and climate change
58BOARD REPORT
BUSINESS OVERVIEW
CORPORATERESPONSIBILITY
CORPORATE GOVERNANCE
FINANCIAL STATEMENTS
ANNUAL REPORT2018

3.2 ML
Organic products sold
95.1 million litres Produced or imported beverages
3.2 million litres Organic products sold
3 Recalls
1 600 Members in Altia’s Cheers!
developer community
• Product quality and safety: ensuring the quality and safety of raw materials and
end products.
• Utilising responsibly produced raw materials: working with suppliers and partners
to ensure products and raw materials are produced responsibly and transparently.
• Traceability of products: knowing where raw materials and products come from.
• Organic and ethically certified products: developing operations and balance
product portfolio to respond to the demand for sustainable products.
Responsibly produced high-quality products are our priority.
Customers95.1 MLProduced or imported b
ever
ages
ALTIA &
59BOARD REPORT
BUSINESS OVERVIEW
CORPORATERESPONSIBILITY
CORPORATE GOVERNANCE
FINANCIAL STATEMENTS
ANNUAL REPORT2018

CASE
First-class quality control at the Rajamäki plant
Product quality and safety are at the top of Altia’s list of priorities, and their assur-
ance is embedded in Altia’s operating methods. Every product produced or arriving
at the Rajamäki plant, including wines, goes through a strict quality control process
before it is sold to Altia’s customers. In recent years, Altia has successfully prolonged
the shelf-life of wines by reducing their exposure to oxygen.
Read more about quality control:
altiagroup.com/responsibility/responsibility-cases
Through our products, we want
to support the development
of a modern and responsi-
ble Nordic drinking culture,
emphasising responsible
values and quality rather than
quantity. This target is summarised in Altia’s
purpose, Let’s Drink Better. We ensure the
safety of our products when used in modera-
tion and continuously improve the quality of
raw materials and final products. We also want
to use ingredients and raw materials that are
produced responsibly and transparently. In
addition, we have expan ded our selection of
low- and non-alcoholic and organic and ethical-
ly certified products in recent years.
Quality monitoring applies to beverages pro-
duced and bottled at the Rajamäki and Taba-
salu plants. The Rajamäki alcoholic beverage
plant is committed to continously maintain
consumer confidence in its products through
the development and implementation of food
safety systems and practices. Food safety is the
responsibility of all employees who have a direct
influence on ingredients, packaging, manufac-
turing, storage and the transport of products.
During the reporting year, Altia’s Rajamäki
plant maintained its ISO 22000 certificate
covering its operations, which is related to food
Altia & Customers
safety management. The plant also improved
product quality with several measurements
related to hygiene and housekeeping, and
developed its online quality control. In addition,
quality training was provided to all employees.
Quality control also continued at Altia’s plants in
Koskenkorva, Tabasalu and Cognac during the
reporting year.
With over 1 600 members, Altia’s Cheers!
Developer community provides the opportunity
for an active and agile dialogue with different
consumer and stakeholder groups. We under-
stand that sustainability is becoming an increas-
ingly important topic for our customers as they
navigate brands and products. Storytelling plays
a crucial role in making the topic understand-
able and relatable. In making responsible and
sustainable choices, customers are unwilling to
compromise on quality. Authenticity, transpar-
ency and craft have become important features
of sustainability, as have the ethical and respon-
sible value chain, starting with production.
To develop responsible sourcing, Altia joined
amfori BSCI and amfori BSCI’s Sustainable
Wine Programme in 2017. As a member,
Altia is committed to furthering the principles
of the amfori BSCI Code of Conduct in its
supply chains.
60BOARD REPORT
BUSINESS OVERVIEW
CORPORATERESPONSIBILITY
CORPORATE GOVERNANCE
FINANCIAL STATEMENTS
ANNUAL REPORT2018

CASE
Responsible wine production is on the rise
As consumption patterns shift in an increasingly sustainable direction, so grows
the demand for environmentally friendly, ethically produced and certified wines.
Training, audits and certifications can ensure a wine’s responsible production and
sourcing process. Altia complies with strict responsibility principles, as well as
quality, safety and environmental standards, which apply to the entire supply chain.
Read more about our sourcing process:
altiagroup.com/responsibility/responsibility-cases
Altia wants to contribute to the enhancement
of wellbeing and to ensure ethical behaviour in
the value chain. Altia’s Rajamäki plant has been
granted the international Fairtrade and Fair for
Life certifications. The Fair for Life certification
was granted to the plant in the reporting year
2018. The Fair for Life certification covers Altia’s
operational sites in Rajamäki, Finland and in
Brunna, Sweden. The Koskenkorva distillery,
the Rajamäki alcoholic beverage plant and the
distillery in Sundsvall are certified for organic
production.
The criteria of Fairtrade and Fair for Life and
the organic certifications set requirements for
all operators in the Altia organic and ethically
certified product supply chain. Long-term busi-
ness relations and cooperation with producers
are the starting point for Altia, and all the parties
involved in the supply chain commit to this.
All companies involved in the supply chain of
Fairtrade and Fair for Life are certified, from the
vineyards or farms all the way to the packaging
of the finished products. Meeting the organic,
Fairtrade and Fair for Life criteria and the tracea-
bility of the raw materials throughout the supply
chain is monitored by the certification bodies.
Concerning the use of responsibly produced
raw materials, we frequently send our corpo-
rate social responsibility questionnaire to the
suppliers of ingredients for Altia’s proprietary
brands and implement Altia’s Code of Conduct
for Suppliers and Subcontractors, which states
our minimum expectations of our suppliers with
regard to responsible conduct.
Read more about our targets and achievements
during the reporting year in the table on the
following page.
61BOARD REPORT
BUSINESS OVERVIEW
CORPORATERESPONSIBILITY
CORPORATE GOVERNANCE
FINANCIAL STATEMENTS
ANNUAL REPORT2018

Objective 2018–2020 Actions 2018 Progress 2018
Continue work to ensure the qual-ity and safety of Altia’s products, including low- and non-alcoholic products.
• Develop the food safety and quality certification status of Altia’s own production plants.
• Certification of new ISO9001:2015 standard in Finland and Estonia.• New quality control tools were implemented at the Rajamäki plant: online alcohol
content measurement, MES (Manufacturing Execution System).• A new HSEQ tool was implemented in the units in Finland.
Continue work to ensure trace-ability and responsibility in the value chain of raw materials and products.
• Continue work with suppliers and partners to ensure products and raw materials are produced responsibly.
• Continue work with the amfori BSCI initiative. • Continuously develop the traceability of products.
• amfori BSCI full audits or re-audits were conducted for 21 suppliers, partners or their sub-suppliers.
• 3% of Altia‘s purchases are from amfori BSCI risk countries.• 80% of Altia’s direct risk country suppliers have a social responsibility certificate.• A Supplier Code of Conduct has been included whenever contracts have been updated.• Altia obtained a Fair for Life certification.• A Fairtrade surveillance audit was conducted at Altia in November 2018.• At the Rajamäki plant, the SAP ERP implementation improved product and raw
material traceability.• Volume (in litres sold) of organic products decreased by 11% compared with 2017.• Volume (in litres sold) of Fairtrade products increased by 45% compared with 2017.
This was due to new Fairtrade product launches at the end of 2017.
Keep product portfolio aligned with responsible and sustainable consumption trends.
• Develop operations and product portfolio to respond to the demand for organic, low alcohol and certified products.
• 2 new organic products were launched in 2018.• 13 new non-alcoholic or low-alcoholic products were launched in 2018.• Successful launch of wide selection of low-alcoholic beverages under iconic brands
including Koskenkorva, Chill Out and Leijona.
Altia & Customers – Objectives and progress
62BOARD REPORT
BUSINESS OVERVIEW
CORPORATERESPONSIBILITY
CORPORATE GOVERNANCE
FINANCIAL STATEMENTS
ANNUAL REPORT2018

452.3 MEUR Excise and income taxes
206.8 MEUR Value of purchased raw materials,
goods and services
15% Share of total barley
harvest in Finland
21 Social responsibility audits
3% Share of purchases from amfori BSCI
risk countries
• Responsible marketing: compliance with applicable laws, regulations and industry
codes in each operating country.
• Advocating responsible consumption: communication and cooperation with
industry operators to advocate a responsible drinking culture.
• Economic contribution: generating economic value added in our operating area.
• Responsibility in supply chain: a member of amfori BSCI and cooperation with
other supply chain operators to promote responsible operations throughout the
supply chain.
• Operating transparently in accordance with good governance practices.
We advocate a responsible drinking culture and promote responsible operations throughout the supply chain.
49.9 MEUR
Sala
ries, commissions etc.
7.7 MEUR
Inve
stments
SocietyALTIA &
63BOARD REPORT
BUSINESS OVERVIEW
CORPORATERESPONSIBILITY
CORPORATE GOVERNANCE
FINANCIAL STATEMENTS
ANNUAL REPORT2018

We want to support the
development of a mod-
ern and responsible
Nordic drinking culture
in our operating coun-
tries in accordance
with our purpose, Let’s Drink Better. We align
our product portfolio with responsible consump-
tion trends. We market our products responsibly
and in compliance with applicable marketing
laws. We acknowledge our wider impact on
value chains and work within the acknowledged
framework of amfori BSCI to further respect and
promote the importance of human rights and key
international labour standards.
During 2018, we organised a panel discussion
with Pernod-Ricard about responsible drinking
culture at SuomiAreena, a key stakeholder forum
in Finland. The discussion took place on the
stage of the Finnish Food and Drink Industries’
Federation. The topic of the panel discussions
was the impact of the new Alcohol Act, that came
effective in 2018, on drinking culture in Finland.
The discussion focused on how the change in the
drinking culture in a more sustainable direction
can be seen in restaurants.
During the reporting period, issues discussed
and closely followed by the media and other
stakeholders were mainly related to the new
Finnish Alcohol Act and its effects on consumer
behaviour, commerce, shelf selections and the
private importing of alcohol.
Internally, we are committed to the Altia Employ-
ee Alcohol Policy, an alcohol consumption policy
applicable to all Altia employees and anyone
working at Altia’s production sites or offices. The
policy affirms our commitment to responsible
alcohol consumption, lists the situations at work
where alcohol may be consumed as part of cer-
tain tasks (for example product development or
quality analysis) and provides information about
the support offered if there is reason to suspect
irresponsible alcohol use.
We have also continued to add “responsibility
statements” to labels and in marketing. The state-
ment is most often in the form of a link to an EU or
national industry website providing information
about the responsible consumption of alcohol.
Altia has joined the amfori BSCI initiative and
aims to annually increase the traceability and
transparency of product and raw material supply
chains. Although Altia has itself been an amfori
BSCI member since 2017, we have, as a supplier
to amfori BSCI participants, implemented the
principles of the amfori Code of Conduct since
Altia & Society
2012. By becoming a full participant, we have
been able to enhance our opportunities and
capabilities of developing long-term responsibility
work and transparency in our supply chain.
Our approach to human rights issues and the
key outcomes in 2018 are described in more
detail in the Non-financial statement, page 40.
Read more about our targets and achieve-
ments during the reporting year in the table
on page 68.
64BOARD REPORT
BUSINESS OVERVIEW
CORPORATERESPONSIBILITY
CORPORATE GOVERNANCE
FINANCIAL STATEMENTS
ANNUAL REPORT2018
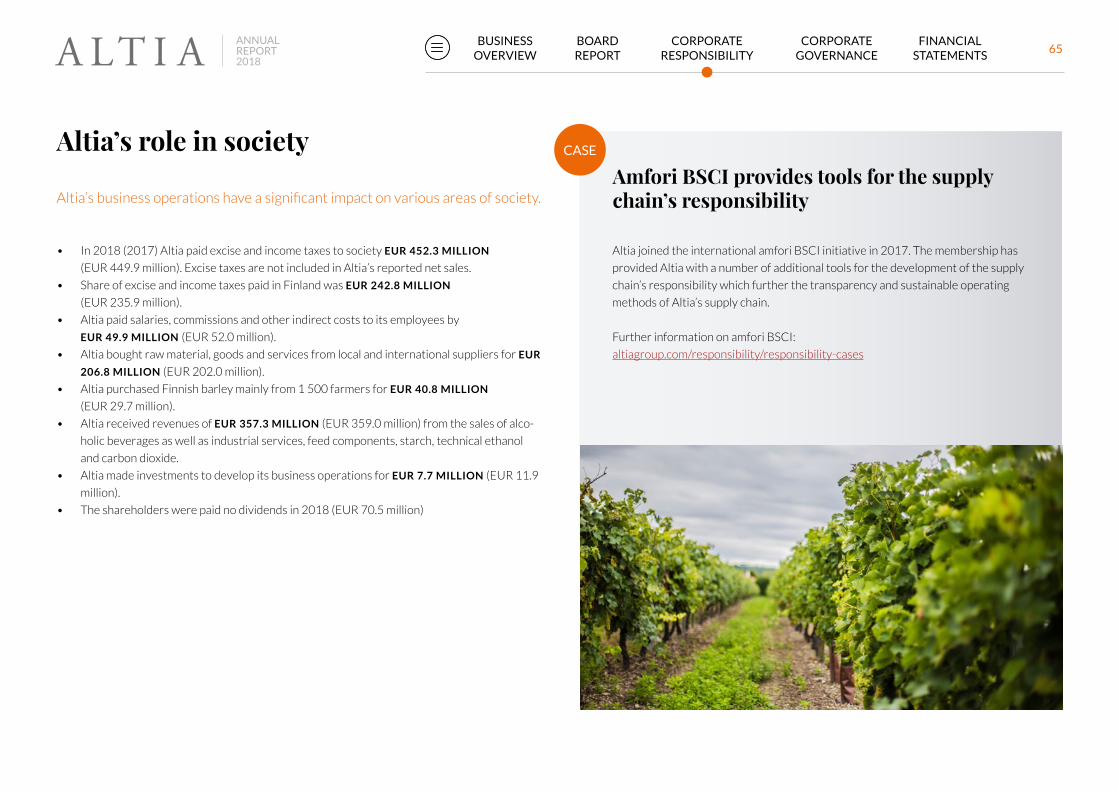
Altia’s business operations have a significant impact on various areas of society.
Altia’s role in society
• In 2018 (2017) Altia paid excise and income taxes to society EUR 452.3 MILLION
(EUR 449.9 million). Excise taxes are not included in Altia’s reported net sales.
• Share of excise and income taxes paid in Finland was EUR 242.8 MILLION
(EUR 235.9 million).
• Altia paid salaries, commissions and other indirect costs to its employees by
EUR 49.9 MILLION (EUR 52.0 million).
• Altia bought raw material, goods and services from local and international suppliers for EUR
206.8 MILLION (EUR 202.0 million).
• Altia purchased Finnish barley mainly from 1 500 farmers for EUR 40.8 MILLION
(EUR 29.7 million).
• Altia received revenues of EUR 357.3 MILLION (EUR 359.0 million) from the sales of alco-
holic beverages as well as industrial services, feed components, starch, technical ethanol
and carbon dioxide.
• Altia made investments to develop its business operations for EUR 7.7 MILLION (EUR 11.9
million).
• The shareholders were paid no dividends in 2018 (EUR 70.5 million)
CASE
Amfori BSCI provides tools for the supply chain’s responsibility
Altia joined the international amfori BSCI initiative in 2017. The membership has
provided Altia with a number of additional tools for the development of the supply
chain’s responsibility which further the transparency and sustainable operating
methods of Altia’s supply chain.
Further information on amfori BSCI:
altiagroup.com/responsibility/responsibility-cases
65BOARD REPORT
BUSINESS OVERVIEW
CORPORATERESPONSIBILITY
CORPORATE GOVERNANCE
FINANCIAL STATEMENTS
ANNUAL REPORT2018
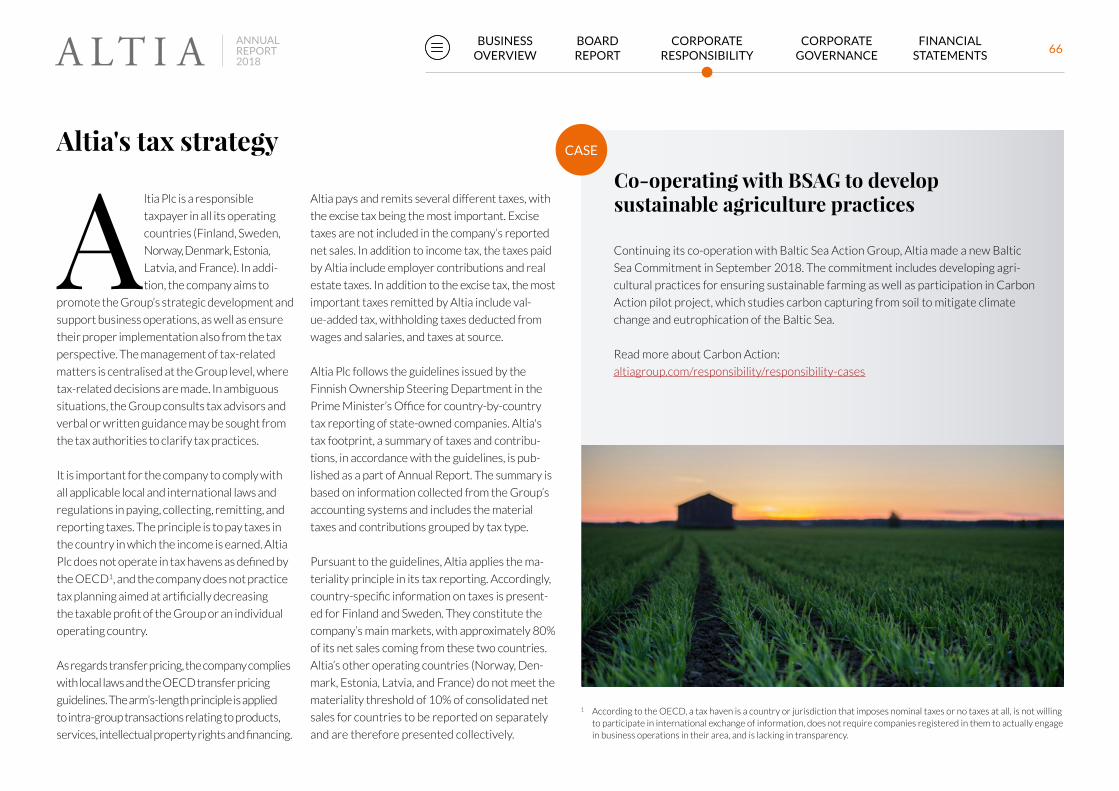
Altia's tax strategy
A ltia Plc is a responsible
taxpayer in all its operating
countries (Finland, Sweden,
Norway, Denmark, Estonia,
Latvia, and France). In addi-
tion, the company aims to
promote the Group’s strategic development and
support business operations, as well as ensure
their proper implementation also from the tax
perspective. The management of tax-related
matters is centralised at the Group level, where
tax-related decisions are made. In ambiguous
situations, the Group consults tax advisors and
verbal or written guidance may be sought from
the tax authorities to clarify tax practices.
It is important for the company to comply with
all applicable local and international laws and
regulations in paying, collecting, remitting, and
reporting taxes. The principle is to pay taxes in
the country in which the income is earned. Altia
Plc does not operate in tax havens as defined by
the OECD1, and the company does not practice
tax planning aimed at artificially decreasing
the taxable profit of the Group or an individual
operating country.
As regards transfer pricing, the company complies
with local laws and the OECD transfer pricing
guidelines. The arm’s-length principle is applied
to intra-group transactions relating to products,
services, intellectual property rights and financing.
CASE
Co-operating with BSAG to develop sustainable agriculture practices
Continuing its co-operation with Baltic Sea Action Group, Altia made a new Baltic
Sea Commitment in September 2018. The commitment includes developing agri-
cultural practices for ensuring sustainable farming as well as participation in Carbon
Action pilot project, which studies carbon capturing from soil to mitigate climate
change and eutrophication of the Baltic Sea.
Read more about Carbon Action:
altiagroup.com/responsibility/responsibility-cases
Altia pays and remits several different taxes, with
the excise tax being the most important. Excise
taxes are not included in the company’s reported
net sales. In addition to income tax, the taxes paid
by Altia include employer contributions and real
estate taxes. In addition to the excise tax, the most
important taxes remitted by Altia include val-
ue-added tax, withholding taxes deducted from
wages and salaries, and taxes at source.
Altia Plc follows the guidelines issued by the
Finnish Ownership Steering Department in the
Prime Minister’s Office for country-by-country
tax reporting of state-owned companies. Altia's
tax footprint, a summary of taxes and contribu-
tions, in accordance with the guidelines, is pub-
lished as a part of Annual Report. The summary is
based on information collected from the Group’s
accounting systems and includes the material
taxes and contributions grouped by tax type.
Pursuant to the guidelines, Altia applies the ma-
teriality principle in its tax reporting. Accordingly,
country-specific information on taxes is present-
ed for Finland and Sweden. They constitute the
company’s main markets, with approximately 80%
of its net sales coming from these two countries.
Altia’s other operating countries (Norway, Den-
mark, Estonia, Latvia, and France) do not meet the
materiality threshold of 10% of consolidated net
sales for countries to be reported on separately
and are therefore presented collectively.
1 According to the OECD, a tax haven is a country or jurisdiction that imposes nominal taxes or no taxes at all, is not willing to participate in international exchange of information, does not require companies registered in them to actually engage in business operations in their area, and is lacking in transparency.
66BOARD REPORT
BUSINESS OVERVIEW
CORPORATERESPONSIBILITY
CORPORATE GOVERNANCE
FINANCIAL STATEMENTS
ANNUAL REPORT2018
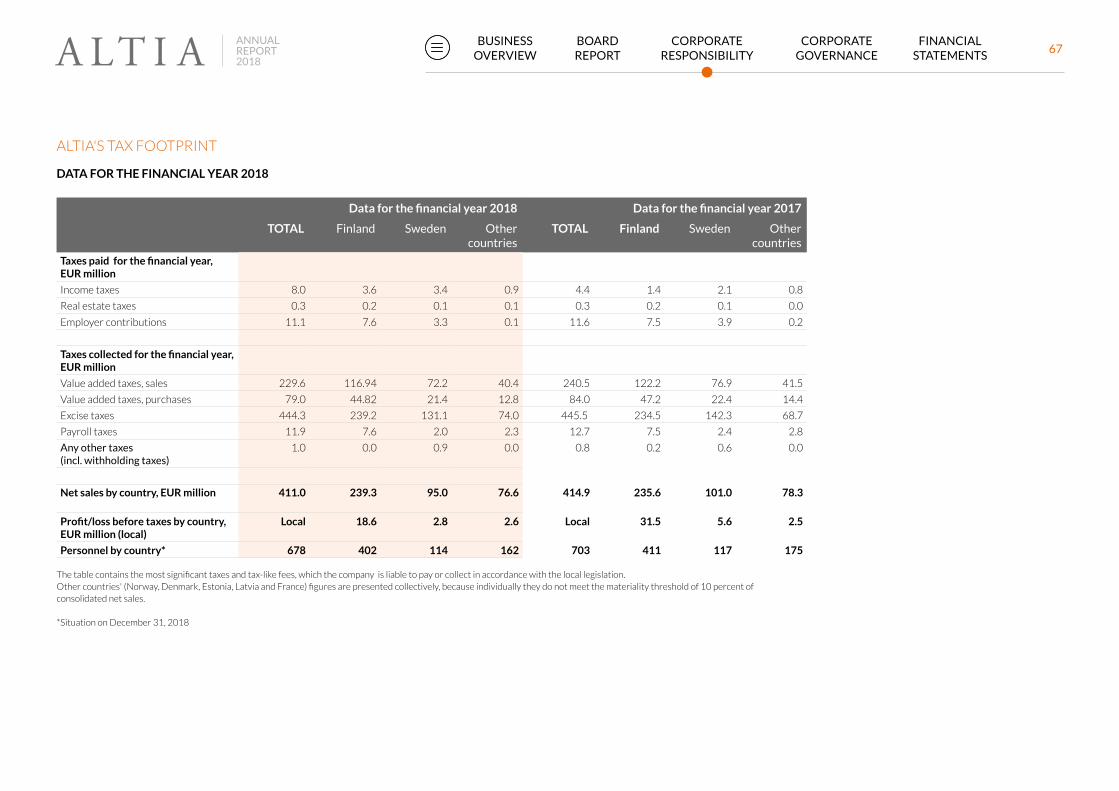
DATA FOR THE FINANCIAL YEAR 2018
Data for the financial year 2018 Data for the financial year 2017
TOTAL Finland Sweden Other countries
TOTAL Finland Sweden Other countries
Taxes paid for the financial year, EUR million
Income taxes 8.0 3.6 3.4 0.9 4.4 1.4 2.1 0.8
Real estate taxes 0.3 0.2 0.1 0.1 0.3 0.2 0.1 0.0
Employer contributions 11.1 7.6 3.3 0.1 11.6 7.5 3.9 0.2
Taxes collected for the financial year, EUR million
Value added taxes, sales 229.6 116.94 72.2 40.4 240.5 122.2 76.9 41.5
Value added taxes, purchases 79.0 44.82 21.4 12.8 84.0 47.2 22.4 14.4
Excise taxes 444.3 239.2 131.1 74.0 445.5 234.5 142.3 68.7
Payroll taxes 11.9 7.6 2.0 2.3 12.7 7.5 2.4 2.8
Any other taxes (incl. withholding taxes)
1.0 0.0 0.9 0.0 0.8 0.2 0.6 0.0
Net sales by country, EUR million 411.0 239.3 95.0 76.6 414.9 235.6 101.0 78.3
Profit/loss before taxes by country, EUR million (local)
Local 18.6 2.8 2.6 Local 31.5 5.6 2.5
Personnel by country* 678 402 114 162 703 411 117 175
The table contains the most significant taxes and tax-like fees, which the company is liable to pay or collect in accordance with the local legislation. Other countries' (Norway, Denmark, Estonia, Latvia and France) figures are presented collectively, because individually they do not meet the materiality threshold of 10 percent of consolidated net sales.
*Situation on December 31, 2018
ALTIA'S TAX FOOTPRINT
67BOARD REPORT
BUSINESS OVERVIEW
CORPORATERESPONSIBILITY
CORPORATE GOVERNANCE
FINANCIAL STATEMENTS
ANNUAL REPORT2018

Objective 2018–2020 Actions 2018 Progress 2018
Continue responsible marketing in compliance with applicable laws, regulations and industry codes in each operating country
• Responsibility statements were used in marketing communications. • Marketing guidelines, principles and processes are in place. Responsibility statements have been added where applicable.
Advocate a responsible and sustainable drinking culture in consultation with stakeholders
• Altia organised a panel discussion with Pernod-Ricard about responsible drinking culture at SuomiAreena.
• Altia continued to participate in industry cooperation to advocate responsible drinking.
Generating economic value added • Altia continues to implement its strategy, developing its business and aiming to improve profitability, productivity and flexibility.
• In 2018*, Altia employed 678 persons, of whom 402 worked in Finland. *December 31, 2018
• Income taxes amounted to EUR 8.0 million and excise taxes paid on products sold by Altia totalled EUR 444.3 million.
• Altia purchased 211.7 million kilograms of Finnish barley, which is about 15% percent of the total Finnish barley harvest.
Respect and promote responsibili-ty, transparency and traceability in the supply chain.
• Altia efficiently utilises the tools and resources provided by amfori BSCI and continues to develop its responsible supply chain processes.
• Altia has progressed according to targets concerning amfori BSCI audits and responsibility policies coverage in countries classified as risk countries.
• 21 (18) full amfori BSCI audits or follow up audits were conducted at Altia’s suppliers, partners or their sub-suppliers
• Amfori BSCI audits were conducted in 2018 in the Altia supply chain in Chile, Guatemala, Guyana, Italy and South Africa.
• Active cooperation was continued with wine producers regarding amfori BSCI principles.
• The share of purchases from risk countries as identified by the amfori BSCI risk country classification was 3% (4%).
• amfori BSCI audit planning was conducted for Altia’s own suppliers.• Altia continued active cooperation with customers, suppliers, partners and other
importers to address challenges in the South African wine industry.
Altia & Society – Objectives and progress
68BOARD REPORT
BUSINESS OVERVIEW
CORPORATERESPONSIBILITY
CORPORATE GOVERNANCE
FINANCIAL STATEMENTS
ANNUAL REPORT2018

• Minimising the environmental impacts of our operations: further
developing our operations and products to minimise environmental
impacts, such as energy consumption and carbon dioxide emissions.
• Developing more sustainable packaging.
• Promoting sustainable agriculture: cooperation with farmers to promote
sustainable farming practices.
• Protecting groundwater: protecting groundwater reserves in
the Rajamäki plant area.
We reduce our environmental impact and promote sustainable agriculture.
Average waste utilisation rate
99.7%
211.7 million kg Finnish barley
1 500 Farmers
60% Self-sufficiencyinfuelsforsteam
production at Koskenkorva
54% Reduction in carbon dioxide emissions in the
Koskenkorva plant area compared with 2014
660 294 m3 Water consumption
99.7% Average waste utilisation rate
EnvironmentALTIA &
69BOARD REPORT
BUSINESS OVERVIEW
CORPORATERESPONSIBILITY
CORPORATE GOVERNANCE
FINANCIAL STATEMENTS
ANNUAL REPORT2018

USE OF MATERIALS AND RAW MATERIALS
2018 2017 2016
Liquids
Liquid raw material, beverages (m3) 66 181 68 935 65 076
Liquid raw material, technical products (m3) 17 517 15 600 15 270
Materials
Barley (t) 211 700 206 000 192 200
Packaging materials (t) 34 209 34 367 32 737
Raw materials for products (t) 4 345 4 213 4 732
Trading products
Liquids (m3) 25 331 24 840 24 960
Packaging materials (t) 8 822 9 535 9 433
A ltia’s environmental impacts
are mainly related to its own
production at the Koskenkorva
and Rajamäki plants in Finland
and at the Tabasalu plant in
Estonia. Its most significant
environmental impacts are related to energy con-
sumption, water consumption, wastewater and
the generation of waste. The production volumes
and the related environmental impacts of Altia’s
plant in Cognac, France are smaller than those of
the production plants mentioned above. The most
significant environmental impacts of the Cognac
plant are related to energy consumption. For
this reason, Altia will expand its energy efficiency
measures to cover Cognac as of 2019.
In 2018, Altia bottled a total of around 70 million
litres of beverages. Its largest production plant, the
Rajamäki alcoholic beverage plant, bottled 64.7
million litres of beverages in 2018 (63.4 million
litres in 2017).
Altia is a significant buyer of domestic barley in
Finland. In 2018, Altia bought 211.7 (206.0 in
2017) million kilos of barley for its Koskenko-
rva distillery, mainly from 1 500 farmers. This
represents around 15% (14%) of the total barley
crop in Finland and 33% (30%) of the barley sold
in Finland. The barley was used to produce 22.0
(22.9) million kilos of grain spirit, 68.9 (64.5) million
kilos of starch and 62.2 (59.8) million kilos of feed
components. During the reporting year, the circu-
lar economy at Altia's Koskenkorva distillery was
Altia’s environmental impacts
granted an international and highly regarded Green
Company of the Year award. The Koskenkorva plant
operates in line with the principles of the circular
economy - all its production outcomes are used
either internally or by Altia’s customers. Read more
about circular economy on page 14.
Altia cooperates with contract farmers to promote
sustainable farming practices and improve material
efficiency to continuously reduce the environ-
mental impacts of its production operations. In
2018, Altia made a new Baltic Sea commitment to
promote the sustainability of the farming methods
used in its beverage production. This new commit-
ment is a continuation of the company’s coopera-
tion with the Baltic Sea Action Group (BSAG) since
2015. As part of the Baltic Sea commitment, Altia
and selected contract farmers participate in the
Carbon Action pilot project of the BSAG, the Finn-
ish Meteorological Institute and Sitra. The Carbon
Action project studies how climate change and the
eutrophication of the Baltic Sea can be controlled
by storing carbon in the soil through more effective
farming practices. The participating contract farm-
ers take part in the pilot by assigning part of their
field area to the study, during which information is
collected about the impact of farming practices on
the soil. The research project runs for five years.
Altia improves the efficiency of its logistics
operations by combining the transport of its own
products with that of its partners’ products and by
operating close to its customers.
CO2
Koskenkorva Distillery &
bioenergy plant
Around 50% reduction in CO
2
emissions*
34-39% of barley grain is used in starch production
32-37% of barley grain is used in the production of feed components
AROUND 210 MILLION KG of Finnish barley a year
20-25% of barley grain is used in grain spirit production
TECHNICAL ETHANOL
ALCOHOLIC BEVERAGES
CIRCULAR ECONOMY
*In comparison with 2014
STARCHCAPTURED
GRAIN SPIRIT
ASHES
FEED
Around 60% fuel self-sufficiency rate in steam production
70BOARD REPORT
BUSINESS OVERVIEW
CORPORATERESPONSIBILITY
CORPORATE GOVERNANCE
FINANCIAL STATEMENTS
ANNUAL REPORT2018

CASE
Protecting valuable natural resources
Rajamäki is home to one of the most important groundwater areas in Finland.
Pure water plays an important role in Altia’s production, in that it guarantees the
products’ high quality. Altia monitors the groundwater levels continuously, and the
Rajamäki area is protected with great care. The operations of the Rajamäki plant
are developed continuously in a more ecological direction by, for instance, recycling
process water and monitoring vehicles operating in the area.
Read more about our water monitoring:
altiagroup.com/responsibility/responsibility-cases
A ltia’s Koskenkorva plant,
Rajamäki alcoholic beverage
plant and Rajamäki Industrial
Products unit – as well as
Altia's support functions and
sales and marketing unit at
its headquarters in Helsinki – have environ-
mental management systems that are certified
to meet the ISO 14001 standard. Altia’s plant
in Tabasalu, production plant in Cognac and
logistics centre in Brunna comply with local
environmental laws and regulations. All Altia’s
locations comply with its quality, safety and
environmental principles.
Our policies and operating methods
Altia’s environmental targets
Environmental management systems are fur-
ther developed through internal and external
audits. Energy and environmental aspects are
taken into account in production processes
and their planning, and in investments related
to production. Key environmental aspects are
discussed regularly at executive management
meetings. Employees’ environmental aware-
ness is increased and maintained through
environmental goals, internal communication
channels and environmental audits.
A ltia’s key environmental
aspects are determined
during assessments carried
out every three years. In the
assessment conducted in
2018, energy consumption,
water consumption, wastewater load and
waste generation were identified as the most
significant envirnmental aspects. Five envi-
ronmental targets have been determined in
order to reduce the most significant environ-
mental impacts of Altia’s operations. Their
achievement is monitored using environmental
indicators, with annual reduction targets for
each unit. The achievement of environmental
targets is monitored on a monthly basis. Meas-
ures necessary for meeting environmental
targets are determined annually for each pro-
duction plant, and these targets are included in
their environmental programmes. Altia had the
following environmental targets for 2018:
• Reducing wastewater load
• Reducing energy consumption
• Reducing water consumption
• Reducing the volume of waste material
• Cutting costs arising from waste
71BOARD REPORT
BUSINESS OVERVIEW
CORPORATERESPONSIBILITY
CORPORATE GOVERNANCE
FINANCIAL STATEMENTS
ANNUAL REPORT2018

The table below presents the environmental performance of Altia’s production plants in terms of its selected indicators in 2016–2018.
2018 2017 2016
Environmental target KoskenkorvaRajamäki and
Tabasalu KoskenkorvaRajamäki and
Tabasalu KoskenkorvaRajamäki and
Tabasalu
Reducing energy consumption (MWh per m3 of product or tonne of barley)
0.63 0.31 0.63 0.28 0.71 0.34
Reducing water consumption (m3 per m3 of product or tonne of barley)
2.26 1.611 2.28 1.46 2.79 1.47
Improving wastewater quality (kg COD per m3 of product or tonne of barley)2
3.10 3.35 2.23 2.92 1.97 2.71
Reducing the volume of waste material (kg per m3 of product)3
- 52.06 - 44.83 - 49.22
1) With regard to Rajamäki, the indicator includes water consumption at the alcoholic beverage plant. The water consumption indicator for the Rajamäki plant of the Industrial Products unit has not been monitored since the beginning of 2018, as the indicator is not material to the operations.
2) The wastewater quality indicator is not monitored at the Tabasalu plant.3) The waste volume indicator is not monitored at the Rajamäki and Koskenkorva plants of the Industrial Products unit, as it is not material to the units in question.
With regard to Rajamäki, the indicator includes waste volume at the alcoholic beverage plant.
Energy efficiencyEnergy consumption relative to production
increased at the Rajamäki plant and remained
at the previous year's level at the Koskenkorva
plant in 2018.
Most of the energy used in Altia’s production
operations is consumed by the Koskenkorva
plant, which uses around 133 GWh of energy
per year. Most of this is used in the distillation
process and the manufacture of starch. The
Rajamäki plant consumes around 29 GWh of
energy per year, most of it used for heating
buildings.
Since 2017, Altia has been part of the Finnish
voluntary Energy Efficiency Agreement for the
period 2017–2025. The parties to the agree-
ment include Finnish ministries, industry asso-
ciations and individual companies. During the
new agreement period, Altia aims to reduce its
energy consumption further by 10% by 2025
compared with 2014.
Altia’s energy efficiency measures are based
on its annual and long-term targets and
the results of the energy efficiency reviews
conducted at the Koskenkorva and Rajamäki
plants in 2015.
20
18
20
17
20
16
20
15
20
14
250
200
150
100
50
0
20
6
20
3
17
0
16
0
16
4Total energy consumption
GWh
20
18
20
17
20
16
20
15
20
14
85
11
0
78
75
73
120
100
80
60
40
20
0
Työnumero: 2
Carbon dioxide emissions,
t CO2 equiv. emissions
x 1,000
20
18
20
17
20
16
20
15
20
14
250
200
150
100
50
0
20
6
20
3
17
0
16
0
16
4
Total energy consumption
GWh
20
18
20
17
20
16
20
15
20
14
85
11
0
78
75
73
120
100
80
60
40
20
0
Työnumero: 2
Carbon dioxide emissions,
t CO2 equiv. emissions
x 1,000
Environmental performance
72BOARD REPORT
BUSINESS OVERVIEW
CORPORATERESPONSIBILITY
CORPORATE GOVERNANCE
FINANCIAL STATEMENTS
ANNUAL REPORT2018

Most of the energy used by the Koskenkorva
distillery is generated by Altia’s bioenergy
power plant, which has been operating at full
capacity since January 2015. The biopower
plant uses barley husks as its primary fuel.
Other fuels include biomass from grains
(barley husk pellets), fusel alcohols, peat and
fuel oil. Ashes from the biopower plant have
been approved for fertiliser use, meaning that
unprocessed ashes can be used as fertiliser in
fields even in groundwater areas.
Water consumption and the protection of groundwater areasWater is one of Altia's products' key raw ma-
terials. Water is also used in the fermentation
process, cooling and the cleaning of production
lines and facilities.
The water used in Altia’s products is unpro-
cessed groundwater from Rajamäki. It meets
the quality requirements without chemical or
mechanical treatment. Water quality is exam-
ined regularly by sending samples for analysis
to an external laboratory. Altia uses less than
10% of the groundwater formed in the ground-
water area each month.
Altia protects water quality by monitoring
groundwater quality and surface levels, owning
land in groundwater areas and affecting land
use, and by maintaining conservation areas.
In addition, Altia takes care of its land areas
with partners and local parties. Altia owns 1
100 hectares of land – equal to 1 500 football
fields – in the Rajamäki area, including two
protected swamp areas (144 hectares and 7.5
hectares). Altia's operations have no negative
effect on the swamp areas.
In 2018, water consumption relative to
production decreased at Koskenkorva,
Rajamäki and Tabasalu plants. At the Rajamäki
plant, an extensive investment in chemical
protective basins was completed, involving
the replacement of protective basins in the
field tank area.
Wastewater quality managementWastewater quality at Koskenkorva and Ra-
jamäki is monitored on a daily basis by meas-
uring chemical oxygen demand from samples.
The limit values for wastewater loads are
specified in Altia’s environmental permits.
Organic loading of wastewater increased
both at Rajamäki and Koskenkorva in 2018.
Factors contributing to the increase at the
Koskenkorva plant included process changes
at A-Rehu and Altia’s increased production
volumes. At the Rajamäki plant, the increase
was mainly related to the production of glögg.
For this reason, the average monthly biological
oxygen demand (BOD) in wastewater exceed-
ed the permit limit in July and August. Alto-
gether, the daily BOD limit was exceeded six
times during 2018.
Wastewater from production operations at
Koskenkorva is pre-treated and wastewater
from the Rajamäki plant is treated before it is
delivered to municipal wastewater treatment
plants. At Tabasalu, wastewater is collect-
ed in tanks and transported to a municipal
treatment plant. During the reporting period,
no consequences were imposed on Altia for
violations of permit limits or environmental
laws and regulations.
Waste recycling and reuseAltia seeks to reduce waste by reducing
the amount of packaging material requiring
disposal. Relative to production, the indicator
for waste volume was higher in 2018 than in
2017, due to a temporary increase in glass
waste in connection with renewals related
to bottles. The amount of biowaste also
increased. This was due to an increase in the
production of distillates for beverages made
available through the grocery trade. Almost all
the waste generated at Altia’s plants is reused
as materials or energy. During the reporting
period, the average waste utilisation rate at
Rajamäki, Tabasalu and Koskenkorva increased
to 99.7% (99.5% in 2017).
RECYCLING AND OTHER REUSE AT ALTIA’S PRODUCTION PLANTS
Recycling and other reuse, %
Unit 2018 2017 2016
Koskenkorva 99.9% 99.9% 99.9%
Rajamäki 98.5% 95.3% 96.5%
Tabasalu 82.0% 87.8% 83.0%
Average 99.7% 99.5% 99.5%
73BOARD REPORT
BUSINESS OVERVIEW
CORPORATERESPONSIBILITY
CORPORATE GOVERNANCE
FINANCIAL STATEMENTS
ANNUAL REPORT2018

Getting emissions under control with packaging design
Altia engages in continuous development work in packaging design to ensure
that materials are used as efficiently as possible and that consumer wishes
are responded to rapidly. Even on a global scale, Altia is a pioneer in packaging
design and packaging innovations.
Read more about Altia’s packaging design:
altiagroup.com/responsibility/responsibility-cases
CASE
A ltia works to be a responsi-
ble operator in developing
and recycling packaging and
improving the efficiency of
recycling. We seek to develop
more sustainable packaging.
Packaging plays a significant role in reducing
environmental impacts, as Altia bottles up
to 70 million litres of beverages per year.
Packaging design at Altia is guided by sustain-
able development: we aim at maximising the
recyclability of packaging and minimising the
amount of waste. At the Rajamäki plant, 100%
of bottles are recyclable. We are continuously
looking for new materials and testing alterna-
tives in order to improve packaging also from
the sustainability point of view throughout
product and packaging life cycles.
Practical measures implemented to achieve
these goals include reducing the weight of
glass and PET bottles, avoiding excessive pack-
aging and increasing the use of recycled ma-
terials in packaging. We have also transferred
from multi-material packaging (such as plastic
bottles with aluminium caps) to a combination
of PET bottles and plastic capsules, which are
easier to recycle. This already includes 95.5%
of PET bottles. All plastic bottles filled at Altia’s
Rajamäki plant have plastic capsules.
In addition to glass and PET bottles, products
are packaged into bags-in-boxes, pouches and
tetras (paperboard cartons) and aluminium
cans. The weight of glass bottles has been
annually decreased.
Packaging beverages in PET bottles is practi-
cal due to the light weight and easy handling
of the bottles. A PET bottle weighs only a
tenth as much as an average glass bottle and
therefore saves energy and has a smaller car-
bon footprint during its life cycle. PET bottles
take up less space than traditional glass bot-
tles. PET bottles are also easy to recycle, and
their return rate in Altia’s main market areas
is 90%, thanks to effective local bottle return
and deposit systems.
In packaging development, Altia’s long-term
goals include reducing its carbon footprint,
making all its packaging 100% recyclable and
removing all unnecessary plastic from its
packaging. In addition, the use of fossil raw
materials in plastic bottles as well as the weight
of the bottle will be reduced. The target is also
to increase the use of recycled material in glass
bottles.
Recyclability and the use of recycled materials in packaging
74BOARD REPORT
BUSINESS OVERVIEW
CORPORATERESPONSIBILITY
CORPORATE GOVERNANCE
FINANCIAL STATEMENTS
ANNUAL REPORT2018

ENVIRONMENTAL FIGURES 2018
2018 %-change from 2017
2017 2016
Use of barley (million kg) 211.68 2.8 % 205.90 192.16
Used fuels/Direct energy consumption
Natural Gas (GWh) direct, non-renewable 1.04 -18.2 % 1.27 1.32
Indirect energy consumption
Steam consumption (GWh) indirect, non-renewable 38.43 18.7 % 32.38 46.11
Steam consumption (GWh) indirect, renewable 74.46 -3.6 % 77.28 71.55
Electricity consumption (GWh) indirect, non-renewable 42.14 0.1 % 42.11 43.37
Electricity consumption (GWh) indirect, renewable 6.53 23.3 % 5.30 5.58
District heating (GWh) indirect, non-renewable 0.10 -6.7 % 0.10 0.11
District heating (GWh) indirect, renewable 1.63 1.1 % 1.62 1.67
Green house gases, direct and indirect
CO2
-equiv.emissions / non-renewable (t) direct, Scope 1 204.86 -18.2 % 250.48 259.38
CO2
-equiv.emissions / non-renewable (t) indirect, Scope 2 26 647.58 0.2 % 26 600.83 29 440.14
CO2
-equiv.emissions / renewable (t) direct, Scope 1 13 954.00 -8.1 % 15 185.00 17 078.00
CO2
-equiv.emissions / renewable (t) indirect, Scope 2 32 477.69 -1.9 % 33 116.17 31 471.39
Significant air emissions
VOC emission (t) 9.35 12.4 % 8.31 7.18
Particle emissions into air ( t) 3.59 -17.8 % 4.37 5.29
Water and Wastewater
Water consumption (1.000 m3 or Ml) 660.29 -0.5 % 663.39 1 135.98
Water consumption, groundwater (1.000 m3) 632.68
Water consumption, municipal water supply (1.000 m3) 27.61
Amount of wastewater (1.000 m3) 291.88 9.9 % 265.55 242.63
Waste amounts (t)
Hazardous waste 26.62 15.4 % 23.07 19.12
Dump waste 38.38 -62.8 % 103.30 86.16
Recycled waste
utilised as energy 15 815.83 -14.2 % 18 429.69 15 983.31
other utilisation 4 261.03 -35.2 % 6 572.75 4 598.24
About the calculation methods used in the table:
Direct energy is energy that is used in own production or own energy production e.g. burning non -renewable energy sources.
Indirect energy is bought energy produced outside the reporting organisation's organisational boundary that is con-sumed to supply energy for the organisation's intermediate energy needs.
For the office locations, only figures related to electrici-ty usage and corresponding emissions, as well as water consumption are reported, with the exception of Oslo and Copenhagen.
For the logistics centers, their electricity usage, district heating and corresponding emissions, as well as water con-sumption and the amount of waste water are reported. As to the Koskenkorva plant, the figures for wastewater include all the operators in the plant area. The energy and water consumption include all operators except A-rehu's operations.
Information on emission-related indicators include Altia’s operations and emissions arising from the production of purchased energy. Indicators concerning waste covers Altia’s own operations.
2016 figures for water consumption and amount of waste-water are restated.
75BOARD REPORT
BUSINESS OVERVIEW
CORPORATERESPONSIBILITY
CORPORATE GOVERNANCE
FINANCIAL STATEMENTS
ANNUAL REPORT2018

MATERIAL FLOW
EMISSIONS
EMISSIONS
GRAIN SPIRIT
DISTILLATES
EMISSIONS
BIOMASS(Mainly barley husk)
EAU-DE-VIE(twice distilledFrench wine)
FUSEL OIL
STARCH SEWAGE WASTEENERGY
UTILISATION
WASTEMATERIAL
UTILISATION
LANDFILLWASTE
GROUNDWATER
(Rajamäki)
WATER
CO2
STEAM ENERGY
ELECTRIC ENERGY
FEEDCOMPONENTS
ELECTRIC AND STEAM
ENERGY
BARLEY
WATER
OTHER RAW MATERIALS
ALCOHOLICBEVERAGES
ALCOHOLICBEVERAGES
ALCOHOLICBEVERAGES,
IMPORTED ETHANOL, OTHER RAW
MATERIALS ANDSUPPLIERS
ALCOHOLICBEVERAGES
TECHNICALETHANOL
TECHNICAL ETHANOLS
Bioenergypower plant of theKoskenkorva plant
Aquavitdistillery
Cognac
Tabasalu
RajamäkiKoskenkorva plant
OTHER RAWMATERIALS
Material flows
76BOARD REPORT
BUSINESS OVERVIEW
CORPORATERESPONSIBILITY
CORPORATE GOVERNANCE
FINANCIAL STATEMENTS
ANNUAL REPORT2018

Objective 2018–2020 Actions 2018 Progress in 2018
Reducing energy consumption and carbon dioxide emissions
• In 2017, Altia joined the voluntary Energy Efficiency Agreement for the period 2017–2025. Altia aims to reduce its energy consumption by 10% by 2025 compared with 2014.
• Altia and Koskenkorva distillery awarded as the Green Company of the Year.• Energy consumption relative to production increased at the Rajamäki plant and
remained unchanged at the Koskenkorva plant.• Energy consumption increased by 3.6% year-on-year. • Thanks to its bioenergy power plant, the Koskenkorva plant's self-sufficiency in fuel for
steam production was 60%. Its carbon dioxide emissions have decreased by 54% since 2014.
Reducing water consumption and improving wastewater quality
• Altia will continue to implement measures to reduce water consumption and improve wastewater quality.
• Water consumption relative to production decreased at Tabasalu and Rajamäki. • At Koskenkorva, water consumption per tonne of barley remained unchanged. • Altia’s absolute water consumption decreased year-on-year. • Organic loading of wastewater increased both at Rajamäki and Koskenkorva during
the reporting period. • The average monthly biological oxygen demand (BOD) in wastewater at Rajamäki
exceeded the permit limit in July and August 2018. The daily BOD limit was exceeded six times during 2018.
Continuing the work to protect groundwater at Rajamäki
• Altia protects water quality by monitoring groundwater quality and surface levels, owning land in groundwater areas and affecting land use, and by means of conservation areas.
• In 2018, an extensive investment in chemical protective basins was completed at the Rajamäki plant, involving the replacement of protective basins in the field tank area.
Reducing waste and improving recycling
• Altia seeks to reduce packaging material waste. • During the reporting period, the average waste utilisation rate at Rajamäki, Tabasalu and Koskenkorva increased to 99.7% (99.5%).
• Relative to production, waste volume increased at Rajamäki and decreased at Tabasalu in 2018 year-on-year.
Promoting sustainable agriculture • Altia will continue to cooperate with farmers and the Baltic Sea Action Group. • In 2018, Altia made a new Baltic Sea commitment to promote the sustainability of the farming methods used in its beverage production.
Developing more sustainable packaging
• Altia is continuously exploring new opportunities to improve the recyclability of packaging, reduce its carbon footprint, increase its use of recycled materials and use lighter packaging.
• Altia’s recycled glass usage rate was up to 50% in certain product categories for coloured glass, depending on the colour.
• Altia replaced glass bottles with lighter PET bottles for an increasing number of products. In 2018, 4 different products were transferred from heavier glass bottles to light-weight PET bottles totalling over 90 000 bottles.
• To increase the recyclability, Altia replaced aluminium bottle capsules with a combination of PET bottles and plastic capsules. 95.5% of PET bottle capsules are made from plastic.
Altia & Environment – Objectives and progress
77BOARD REPORT
BUSINESS OVERVIEW
CORPORATERESPONSIBILITY
CORPORATE GOVERNANCE
FINANCIAL STATEMENTS
ANNUAL REPORT2018
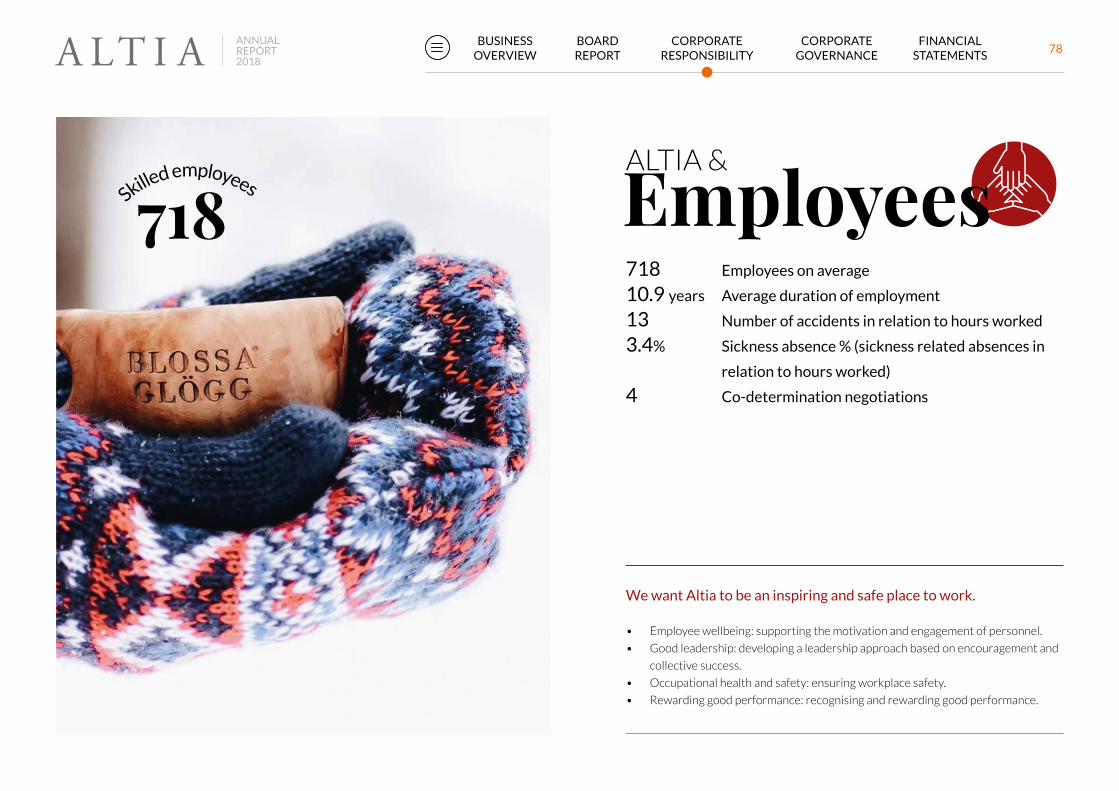
Skilled employees
718 EmployeesALTIA &
718 Employees on average
10.9 years Average duration of employment
13 Number of accidents in relation to hours worked
3.4% Sickness absence % (sickness related absences in
relation to hours worked)
4 Co-determination negotiations
• Employee wellbeing: supporting the motivation and engagement of personnel.
• Good leadership: developing a leadership approach based on encouragement and
collective success.
• Occupational health and safety: ensuring workplace safety.
• Rewarding good performance: recognising and rewarding good performance.
We want Altia to be an inspiring and safe place to work.
78BOARD REPORT
BUSINESS OVERVIEW
CORPORATERESPONSIBILITY
CORPORATE GOVERNANCE
FINANCIAL STATEMENTS
ANNUAL REPORT2018

CASE
Occupational safety development together, as part of day-to-day work
Safety is a top priority at Altia. Automation, inductions and everyday routines enable
the development and maintenance of high safety standards, also at the Rajamäki
plant. Every Altia employee is responsible for taking care of occupational safety.
Continuous development and openness prevent hazardous situations and aim to
eliminate the occurrence of even the smallest accidents.
Read more about our safety work:
altiagroup.com/responsibility/responsibility-casesR ecognising that each em-
ployee contributes to the
atmosphere of the working
community, we take pride in
our relaxed company culture,
which allows everyone to be
themselves. Personnel development planning
is an essential part of Altia’s strategy process.
Implementing Altia’s strategy through people developmentThe Let’s Lead Better training, which was
initiated in 2017, continued throughout 2018.
The training is based on Altia Behaviours and
consists of short practical training sessions.
The sessions covered, for example, labour
law, the roles of managers and employees, the
role of managers as communicators between
management and employees, performance
management, and the creation of the trust
and security that promote open interaction.
In 2018, the creation of e-learning courses on
important topics such as Altia’s Code of Con-
duct and IT security was emphasised. In the
Rajamäki plant, a leadership programme was
undertaken with a focus on building its safety
At Altia, we want to build a working community in which our personnel feel well and can perform their work safely. We believe the success of our personnel leads to the success of the company, and the other way around.
culture. Safety workshops for each team were
organised. A training programme for sales and
marketing people, initiated in 2016, has also
continued annually.
The Altia Tasting personnel survey was
conducted in January 2018. The new survey
provided managers with more accurate tools
to develop their leadership. The key develop-
ment areas based on the survey were making
development opportunities more visible,
improving leadership skills and increasing top
management visibility. Several actions were im-
plemented during the year on how to improve
these areas, e.g. in the content of Let’s Lead
Better training and the Altia Leaders’ Forum,
which was established in 2018.
All Altia employees participate in performance
discussions regularly. During the performance
discussions, a personal development plan is
prepared for each employee defining the most
significant measures to develop competence
and motivation. In 2018, the performance
discussions focused especially on creating
comprehensive development plans.
Altia & Employees
79BOARD REPORT
BUSINESS OVERVIEW
CORPORATERESPONSIBILITY
CORPORATE GOVERNANCE
FINANCIAL STATEMENTS
ANNUAL REPORT2018

CASE
Promoting Altia employees’ well-being at work
The annually conducted Altia Tasting survey measures the well-being of Altia’s
employees and charts their development wishes. Listening to development
proposals and advancing initiatives together with all Altia employees is important.
The theme brought up in 2018 focused on the openness of in-house development
and training opportunities.
Read more about the training opportunities offered to Altia’s employees:
https://altiagroup.com/responsibility/responsibility-cases
Enhancing equal opportunities and wellbeingThe basis for promoting the equal treatment
and wellbeing of employees is part of Altia’s
Business Principles and Altia Behaviours.
The goal of the work towards equality and
equal opportunities is to identify and prevent
discrimination, and to promote gender equality
and equal opportunities. Altia’s equality and
equal opportunities plans and policies describe
principles and measures intended to enhance
gender equality and equal opportunities
among personnel.
Taking care of one’s own and colleagues’ safety
and wellbeing is part of daily operations, and
it is included in the company’s local action
plans. Altia offers occupational healthcare to
employees in all operating countries through
healthcare services, medical expenses insur-
ance or health checks in accordance with local
agreements and legislation.
Remuneration and incentivesAltia’s short-term incentives form part of
employees’ total compensation and benefits
package. The purpose of the incentives is to
support the implementation of Altia’s strategy,
reward people for excellent personal perfor-
mance and achieve the financial objectives of
the Altia Group and its business units. Altia’s
salaried employees, senior salaried employees
and management participate in this annual
performance bonus programme. The potential
annual bonus is based on the targets of both
the Group and its business units, as well as on
personal targets. Bonuses are paid either once
a year or more frequently as an annual bonus
or sales bonus. Workers participate in a pro-
duction bonus system. The production bonuses
are based on each production unit’s targets.
Altia’s CEO, the members of the Executive
Management Team and selected key employ-
ees are part of the long-term incentive scheme
for 2017–2019. The long-term incentive
scheme complements the annual bonus to
create a balanced incentive structure. With the
incentive schemes, management is encouraged
to promote the long-term financial success of
the company and development of the share-
holder value. The company’s strategy and
development phases are considered when
determining the remuneration.
In connection with the IPO in 2018, the top
management were paid a one-off reward for
investing the net sum of the received award
in the company by subscribing shares in the
personnel offering. Additionally, a 130-year
celebration bonus was paid to Altia employees,
excluding top management.
In addition to financial rewards, Altia strives
to develop other forms of incentive. These
include thanking and giving positive feedback,
celebrating accomplishments, sharing best
80BOARD REPORT
BUSINESS OVERVIEW
CORPORATERESPONSIBILITY
CORPORATE GOVERNANCE
FINANCIAL STATEMENTS
ANNUAL REPORT2018

practices, involving key talents in strategy
and development work, as well as offering
small tokens of appreciation in recognition of
good work.
More information about Altia’s remuneration
policies, including paid remuneration, can be
found in the Remuneration Statement,
page 101.
Actions to prevent sickness absences and accidentsAltia’s occupational health and safety system
has been certified in accordance with the
OHSAS 18001:2007 standard. The certificate
covers the Koskenkorva plant, the operations
at Rajamäki and the head office functions in
Helsinki.
The objectives of the occupational health and
safety system include the reduction of sickness
absences and accidents and the absences the
latter cause. To highlight the importance of
occupational health and safety, action plans
have also been created for those Altia operat-
ing locations that are not in the scope of the
certification (Tabasalu plant, the Cognac plant
and the Brunna logistics centre). To achieve the
objectives, key performance indicators have
been set. A total of 85 actions were deter-
mined during the reporting year for the various
Altia locations. Of these, 70 actions (82%)
were fully implemented in 2018. Implemen-
tation of the other actions is ongoing. Actions
completed at various sites include, for example,
the implementation of a work safety e-learning
course, the implementation of a new tool for
near-miss reports, the updating of the occupa-
tional and health risk evaluation process and
the management of safety walks. Many other
improvements concerning production facilities
and equipment were also made during the
reporting year.
Accident frequency and sickness absences are
monitored in all Altia’s operating countries.
Since 2018, the key performance indicators
monitored have also included the number of
accidents and near-miss cases. In 2018, the
sickness absence percentage* was 3.4 percent
(3.3% in 2017). The Swedish logistics centre
in Brunna had the highest rates at 6.9 (5.4),
and the Copenhagen office had the lowest rate
at 0.7 (0.4). The accident absence rate** for
accidents requiring at least one day of absence
was 13 (11 in 2017). Like the previous year, the
Rajamäki plant had the highest number of
accidents. The Rajamäki plant continued to
develop the identification of hazards and
risks, and to implement immediate corrective
measures. Occasional accidents occurred
at other locations (Cognac, Koskenkorva,
Stockholm and Tabasalu). There were no fatal
work-related accidents in 2018.
Changes in personnelDuring 2018, operations and services were re-
organised in the Scandinavian segment Finland
sales and in Latvia. The decrease in personnel
was primarily due to non-replacement or other
internal arrangements in Finland, and to the
continued reorganisation of operations in
Latvia. Negotiations on the reorganisation of
Altia’s Scandinavia segment and on operation-
al changes in Finland sales were completed
towards the end of the year. The personnel
reductions in Finland totalled 5 persons.
Negotiations on the reorganisation of Altia’s
Scandinavian segment were completed at the
end of the year, and they affected 5 employees
in Sweden and 2 in Norway. Altia supported
the affected employees by offering outplace-
ment or training support. These arrangements
aimed at renewing ways of working as well as
simplifying organisational structure, and will
affect the number of personnel in 2019. The
reorganisation of operations in Latvia contin-
ued in 2018 and resulted in 5 terminations of
employment.
* The number of sickness-related absence hours per working hours x 100%** The number of accidents leading to at least one day’s absence per million working hour
81BOARD REPORT
BUSINESS OVERVIEW
CORPORATERESPONSIBILITY
CORPORATE GOVERNANCE
FINANCIAL STATEMENTS
ANNUAL REPORT2018
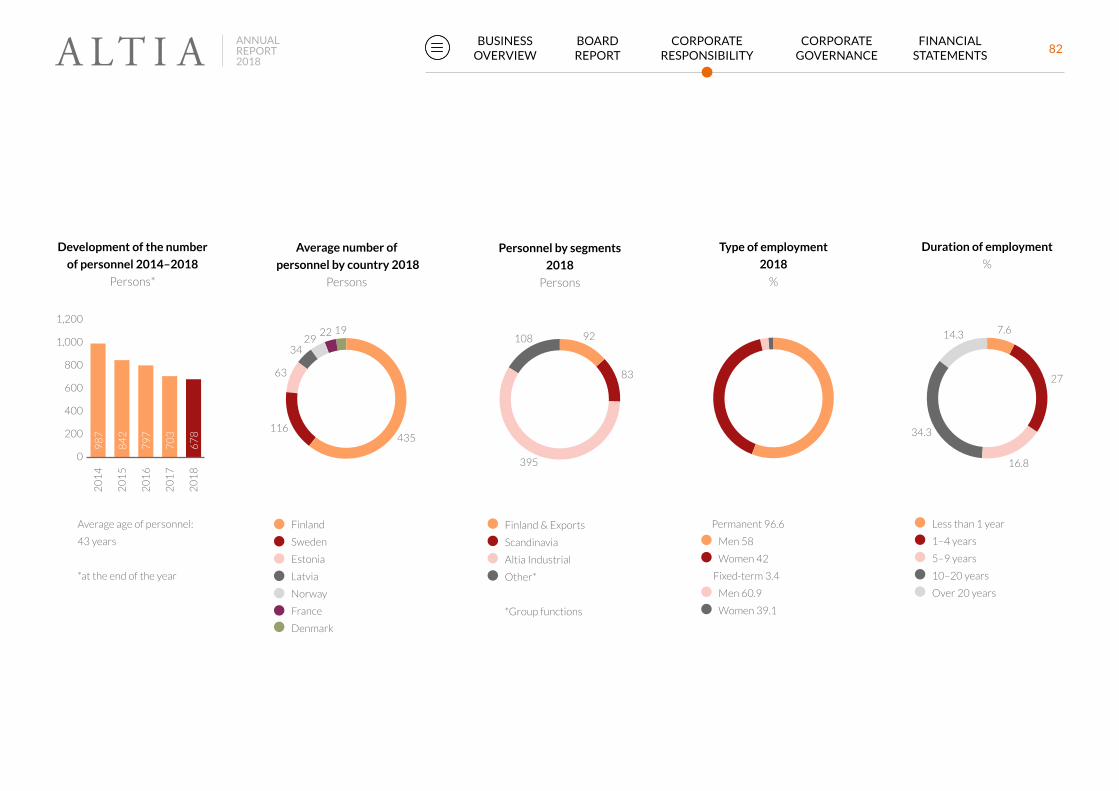
20
18
20
17
20
16
20
15
20
14
Työnumero: 2
Development of the number
of personnel 2014–2018
Persons*
Average age of personnel:
43 years
*at the end of the year
1,200
1,000
800
600
400
200
0
98
7
84
2
79
7
70
3
67
8 435116
63
3429
22 19
Average number of
personnel by country 2018
Persons
Finland
Sweden
Estonia
Latvia
Norway
France
Denmark
92
83
395
108
Personnel by segments
2018
Persons
Finland & Exports
Scandinavia
Altia Industrial
Other*
*Group functions
Type of employment
2018
%
Men 58
Women 42
Men 60.9
Women 39.1
Permanent 96.6
Fixed-term 3.4
Duration of employment
%
Less than 1 year
1–4 years
5–9 years
10–20 years
Over 20 years
7.6
16.8
34.3
14.3
27
82BOARD REPORT
BUSINESS OVERVIEW
CORPORATERESPONSIBILITY
CORPORATE GOVERNANCE
FINANCIAL STATEMENTS
ANNUAL REPORT2018

Personnel by group 2018
%
Workers
Salaried and
senior-salaried
employees
63.3
36.7
100
80
60
40
20
0
10
0
10
0
10
0
10
0
36
64
Percentage of employees
covered by collective
agreements, %
Covered by collective
agreements
Not covered by collective
agreements
Estonia and Latvia are not
included because in these
countries, there are no
collective agreements
*Excluding CEO
France
Norway
Denmark
Sweden
Finland*
100
80
60
40
20
0
Gender distribution
%
Women
Men
Situation on
December 31, 2018
* Does not include EMT
members
Board of
directo
rs
Executive m
an-
agement t
eamCleric
al
employees*
Work
ers
26
.7
51
.2
33
.3 42
.9
73
.3
48
.8
66
.7 57
.1
20
15
10
5
0201820172016
Sickness absences
%
The number of sickness
related absence hours per
working hours x 100 %
3.2 3.3
3.4 8 1
7
19
20
16
20
15
10
5
0
20
17
20
18
13
Accident absence rate
Accident absence rate
meaning the ratio of number
of accidents resulting in at
least one day absence to
million working hours
Total registered injury
frequency, reported from
2018 onwards
83BOARD REPORT
BUSINESS OVERVIEW
CORPORATERESPONSIBILITY
CORPORATE GOVERNANCE
FINANCIAL STATEMENTS
ANNUAL REPORT2018

Objective 2018–2020 Actions 2018 Progress 2018
Continue the wide and versatile occupational health and safety work to enhance safety culture towards zero accidents. Safety culture and good safety practices should be more visible and known to all employees.
• Enhancing the safety culture at Altia sites, with a focus on the Rajamäki plant.
• In the Rajamäki plant, a leadership programme was undertaken with a focus on building its safety culture. Safety workshops for each team were organised.
• First aid trainings were organised in Finland and in Sweden.
Enhance leadership and organisa-tional culture(authentic, open dialogue, self-leadership)
• Leadership training for managers continued• Discussions in teams based on Altia Tasting personnel survey
• Let’s Lead Better trainings with new topics continued in 2018 for Finnish, Danish, Swedish and Norwegian managers.
• In the Rajamäki plant, a leadership programme was undertaken with a focus on building its safety culture.
• Actions were agreed in teams based on Altia Tasting results.
Enhance employee health and wellbeing through concrete initia-tives, for example, relating to work ergonomics and a happy produc-tive work place
• Focus on work ergonomics• Reintroduce health checks• Non-smoking plant concept
• Ergonomic improvements were sought based on sites’ needs.• A health survey was run in Finland and continued with targeted actions.• First aid training was organised in Finland and Sweden.• Smart work workshops were conducted.• A non-smoking plant concept was operationalised in the Koskenkorva plant,
and a decision was made in Rajamäki.
Developing the equal treatment of employees
• Clarifying managerial roles• Employee wellbeing actions according to equality plans
• Managerial roles were clarified and managers’ responsibilities emphasised e.g. in Let’s Lead Better trainings.
Altia & Employees – Objectives and progress
84BOARD REPORT
BUSINESS OVERVIEW
CORPORATERESPONSIBILITY
CORPORATE GOVERNANCE
FINANCIAL STATEMENTS
ANNUAL REPORT2018
Reporting framework
Description of the reportingAltia is publishing its corporate responsibility
report for 2018 as part of the 2018 Annual
Report, contained in the section on Corpo-
rate Responsibility. The 2018 responsibility
report is the company’s eleventh annual
responsibility review. The report is published
online once every calendar year in both Finn-
ish and English.
As part of the Report by the Board of
Directors, Altia is also publishing for the
second time a non-financial statement, which
provides an overview of the company’s
approach to environmental, social, employee
and human rights, as well as anti-corruption
and bribery matters in accordance with the
EU Directive1 regarding the disclosure of
non-financial and diversity information.
The 2017 report was published on 12 March
2018.
Scope of corporate responsibility reportingThe 2018 Corporate Responsibility section
of the Annual Report contains general and
material information about the economic, so-
cial and environmental impact of Altia’s op-
erations between 1.1.2018 and 31.12.2018.
Altia reports on its corporate responsibility
in accordance with the Core option of the
Global Reporting Initiative (GRI) Sustainabil-
ity reporting standards for 2016. The report-
ing contains the GRI-standard sections on
general disclosure, management approach
and Altia’s material environmental, social and
economic standard clauses. For environmen-
tal matters and responsibility matters in the
supply chain, indicators are presented more
extensively than the GRI Core option. The
GRI Index illustrates the correspondence
between the responsibility section contents
and GRI standards.
Information on corporate responsibility and
related material indicators are disclosed,
if not otherwise stated, for the whole Altia
Group.
Altia & EnvironmentRegarding environmental responsibility, the
reported targets and indicators focus on the
environmental impact of Altia’s own opera-
tions at the Koskenkorva, Rajamäki, Tabasalu
and Cognac plants, as these plants generate
most of Altia’s environmental impact. An
assessment of the relevance of the reported
indicators for the operations at Altia’s dis-
tillery in Sundsvall, which is operated by an
external partner, was made in 2018.
Altia reports Scope 1 and Scope 2 green-
house gas emissions. Altia calculates the an-
nual CO2 emission reduction compared with
the previous reporting year, as well as with
the base year, 2014. The base year has been
chosen in accordance with the Koskenkorva
bioenergy power plant operating schedule.
Scope 1 emissions are direct emissions
generated by Altia’s own production. Scope
2 emissions are indirect emissions derived
from energy bought outside the reporting
organisation’s organisational boundary and
consumed by the supply of energy for the
organisation’s intermediate energy needs.
Altia generates no other direct greenhouse
gas emissions other than CO2
emissions. CO2
emissions from purchased energy have been
calculated by multiplying energy consump-
tion by the emission factor corresponding
with its production (kg CO2/MWh). The
following sources for emission factors have
been used in calculations:
• Electricity: Finland’s Energy Authority
• District heating: local district heating
suppliers
• Natural gas: 55.04 CO2 t/TJ
In addition to GHG emissions, Altia reports
VOC emissions and particle emissions into air.
Altia’s own operations generate no other air
emissions.
Altia & EmployeesAll indicators relating to employees were
extended in 2017 to also cover operations in
Cognac, France. Figures for accident rates,
sickness absence and the type and duration
of employment in 2018 and 2017 therefore
do not correspond with those reported in
2016. Employee data sources are generated
from Altia’s global HR, local payroll and re-
porting systems, with no assumptions made.
Calculation methods applied, and any differ-
ences and restatements compared with the
corporate responsibility reporting of previ-
ous years are described as part of specific
charts and tables where relevant.
AssuranceNo external assurance has been applied to
the corporate responsibility report.
1 Directive 2014/95/EU of the European Parliament and of the Council of 22 October 2014 amending Directive 2013/34/EU concerning the disclosure of non-financial and diversity information by certain large undertakings and groups
85BOARD REPORT
BUSINESS OVERVIEW
CORPORATERESPONSIBILITY
CORPORATE GOVERNANCE
FINANCIAL STATEMENTS
ANNUAL REPORT2018

Code GRI content Location Reported fully partly
Comments
General Disclosures
Organisational profile
102-1 Name of the organisation Altia in brief, p. 2
102-2 Activities, brands, products and services Altia in brief,p. 2, Value created, p. 13, Segments, pp. 15–17, Brands, pp. 20-21
102-3 Location of headquarters Altia in brief, p. 2
102-4 Location of operations Altia in brief, p. 2
102-5 Ownership and legal form Corporate Governance Statement 2018, p. 94
102-6 Markets served Altia in brief, p. 2, Segments, pp. 15–17, Operating environment, p. 18
102-7 Scale of the organisation Altia in brief, p. 2, Financial key ratios 2018, pp. 4–5, Responsibility key figures 2018, p. 6, Key ratios of the Group, pp. 45–46
102-8 Information on employees and other workers Altia & Employees, p. 82, GRI index No substantial work is undertaken by self-employed workers or contractors. There are no significant seasonal variations in employment numbers.
102-9 Supply chain Material flows, p. 76, Altia’s role in society, p. 65, Responsible sourcing
102-10 Significant changes to the organisation and its supply chain Board report, p. 27
102-11 Precautionary Principle or approach Altia & the environment, pp. 69–77, Board report, p. 37
102-12 External initiatives Non-financial statement, pp. 40–44, Steering of Altia’s responsibility work, p. 50
102-13 Membership of associations GRI index Altia companies in Finland, Sweden, Norway, Denmark, Estonia and Latvia are members of local alcohol industry associations. Altia is also a member of BNIC, the Cognac producers’ association.
Strategy
102-14 Statement by senior decision maker CEO’s review, pp. 7–8
GRI content index
This report contains Standard Disclosures from the GRI Sustainability Reporting Guidelines.
86BOARD REPORT
BUSINESS OVERVIEW
CORPORATERESPONSIBILITY
CORPORATE GOVERNANCE
FINANCIAL STATEMENTS
ANNUAL REPORT2018

Code GRI content Location Reported fully partly
Comments
102-15 Key impacts, risks and opportunities CEO’s review, pp. 7–8, Value created, p. 13Board report, pp. 36–39Non-financial statement, pp. 40–44 Materiality assessment, p. 56Responsibility cornerstones, pp. 58–84
Ethics and integrity
102-16 Values, principles, standards and norms of behaviour Non-financial statement, pp. 40–44
102-17 Mechanisms for advice and ethical concerns Non-financial statement, pp. 43–44
Governance
102-18 Governance structure Corporate Governance Statement 2018, pp. 94–96
102-20 Executive-level responsibility for economic, environmental and social issues
Steering of Altia’s responsibility work, p. 50
102-22 Composition of the highest governance body and its commit-tees
Board of Directors, pp. 104-105
102-23 Chair of the highest governance body Board of Directors, p. 104
102-24 Nominating and selecting the highest governance body Corporate Governance Statement 2018, pp. 94–96
102-26 Role of highest governance body in setting aims, values and strategy
Corporate Governance Statement 2018, pp. 94–96
102-32 Highest governance body’s role in sustainability reporting GRI index Report is approved by the Board.
102-35 Remuneration policies Remuneration statement, pp. 101–103 Occupational safety-related targets have been included in the Altia management incentive scheme for the operations and sites where occupational safety plays a significant role.
Stakeholder engagement
102-40 List of stakeholder groups Stakeholder interaction, pp. 53–54
102-41 Collective bargaining agreements Altia & Employees, p. 83
102-42 Identifying and selecting stakeholders GRI index, Stakeholder dialogue, p. 52 Altia has defined the company stakeholder groups which the company impacts and/or the stakeholder groups that may impact Altia’s operations. These are explained in more detail in the stakeholder section of this report.
102-43 Approach to stakeholder engagement Stakeholder dialogue, p. 52, Altia’s stakeholder interaction, pp. 53–54
102-44 Key topics and concerns raised Stakeholder dialogue, p. 52, Altia’s stakeholder interaction, pp. 53–54
87BOARD REPORT
BUSINESS OVERVIEW
CORPORATERESPONSIBILITY
CORPORATE GOVERNANCE
FINANCIAL STATEMENTS
ANNUAL REPORT2018

Code GRI content Location Reported fully partly
Comments
Reporting practice
102-45 Entities included in the consolidated financial statements Consolidation, pp. 152–155
102-46 Defining report content and topic boundaries Materiality analysis, p. 57, Reporting framework, p. 85
102-47 List of material topics Materiality analysis, p. 57
102-48 Restatements of information Environmental figures 2018, p. 75 The restatement related to environmental figures is explained as part of the environmental figures (p. 75). No other restatements in 2018.
102-49 Changes in reporting Materiality analysis, pp. 55–57
102-50 Reporting period Reporting framework, p. 85
102-51 Date of most recent report Reporting framework, p. 85
102-52 Reporting cycle Reporting framework, p. 85
102-53 Contact point for questions regarding the report Contact information, back cover
102-54 Claims of reporting in accordance with GRI Standards GRI index, Reporting framework, p. 85 This report has been prepared in accordance with GRI standards: core option.
102-55 GRI content index GRI index, pp. 86-92
Management Approach
103-1 Explanation of the material topic and its boundary Materiality analysis, pp. 55–57
103-2 The management approach and its components Steering of corporate responsibility work, p. 50, Altia’s responsibility programme 2018–2020, p. 51, Materiality analysis, pp. 55–57, Altia & Customers, pp. 59–62, Altia & Society, pp. 63–68, Altia & Environment, pp. 69–77, Altia & Employees, pp. 78–84
A comprehensive Management Approach table will be included in the corporate responsibility section of Altia’s annual report next year.
103-3 Evaluation of the management approach Steering of corporate responsibility work, p. 50, Stakeholder dialogue, p. 52, Materiality analysis, pp. 55–57, Altia & Customers, pp. 59–62, Altia & Society, pp. 63–68, Altia & Environment, pp. 69–77, Altia & Employees, pp. 78–84
A comprehensive Management Approach table will be included in the corporate responsibility section of Altia’s annual report next year.
Economic Standards
GRI 201: Economic performance
201-1 Direct economic value generated and distributed Altia’s role in society, p. 65, Altia's tax footprint, p. 67Financial statements pp. 119–120, 144, 157–159, 161
88BOARD REPORT
BUSINESS OVERVIEW
CORPORATERESPONSIBILITY
CORPORATE GOVERNANCE
FINANCIAL STATEMENTS
ANNUAL REPORT2018

Code GRI content Location Reported fully partly
Comments
GRI 205: Anti-corruption
205-2 Communication and training concerning anti-corruption policies and procedures
Non-financial statement, p. 44 All Altia business partners sign the Altia Supplier Code of conduct and the amfori BSCI Code of Conduct as part of their agreement. Both include anti-corruption clauses. Altia expects its representa-tives, consultants, agents, subcontractors and other business partners to unconditionally refrain from corrupt behaviour while undertaking services for Altia or on its behalf.
205-3 Confirmed incidents of corruption and actions taken Non-financial statement, p. 44
Environmental Standards
GRI 301: Materials
301-1 Materials used by weight or volume Use of materials and raw materials-table, p. 70 We are currently drafting our packaging strategy and will soon be communicating the share of used renewable and non-renewable materials.
GRI 302: Energy
302-1 Energy consumption within the organisation Environmental figures 2018, p. 75
302-4 Reduction of energy consumption Energy efficiency, p. 72, Environmental figures 2018, p. 75
GRI 303: Water and effluents
303-1 Interactions with water as a shared resource Altia & Environment, pp. 70–73, Altia & Environment – Objectives and progress, p. 77
303-2 Management of water discharge-related impacts Altia & Environment, p. 73
303-4 Water discharge Environmental figures 2018, p. 75, Wastewater quality management, p. 73
Altia’s water supply is sourced from groundwater and the municipal water supply. The breakdown is presented as part of Altia environmental figures.
303-5 Water consumption Environmental figures 2018, p. 75, GRI index Altia has no impact on water storage, nor does it take in water in water stress areas. Altia complies with the water intake amounts set by the authorities and regularly measures and follows up groundwater surface levels.
GRI 305: Emissions
305-1 Direct (Scope 1) GHG emissions Environmental figures 2018, p. 75, Reporting framework, p. 85
Altia reports Scope 1 and Scope 2 GHG emissions. We plan to start communicating our Scope 3 emissions in the near future.
89BOARD REPORT
BUSINESS OVERVIEW
CORPORATERESPONSIBILITY
CORPORATE GOVERNANCE
FINANCIAL STATEMENTS
ANNUAL REPORT2018

Code GRI content Location Reported fully partly
Comments
305-2 Energy indirect (Scope 2) GHG emissions Environmental figures 2018, p. 75, Reporting framework, p. 85
Altia reports Scope 1 and Scope 2 GHG emissions. We plan to start communicating our Scope 3 emissions in the near future.
305-7 Nitrogen oxides (NOX), sulphur oxides (SOX) and other significant air emissions
Environmental figures 2018, p. 75 In addition to GHG emissions, Altia reports VOC emissions and particle emissions. Altia operations generate no other air emissions.
GRI 306: Effluents and waste
306-2 Waste by type and disposal method Environmental figures 2018, p. 75
306-3 Significant spills GRI index No spills during the reporting year 2018.
306-4 Transport of hazardous waste Environmental figures 2018, p. 75 Altia reports its hazardous waste volumes. Altia’s hazardous waste is transported according to applicable national legislative requirements to local hazardous waste handling companies with the required permits for processing hazardous waste.
GRI 307: Environmental compliance
307-1 Non-compliance with environmental laws and regulations Environmental performance, p. 73
GRI 308: Supplier environmental assessment
308-2 Negative environmental impacts in the supply chain and actions taken
Altia & Society, p. 63, GRI index
Altia discloses information related to the annual number of amfori BSCI audits conducted in the Altia supply chain. All audit results and implementation of remediation plans are carefully monitored. Altia carefully monitors the share of purchases from amfori BSCI classified risk countries. Altia frequently monitors the responsibility policies and practices of its supply chain by sending out a CSR questionnaire to its own suppliers. These include an environmental assessment. The questionnaire was last sent out in 2017; the next will be sent out in the near future. No significant negative impacts have been identified based on the results.
Social Standards
GRI 403: Occupational health and safety
403-1 Occupational health and safety management system Altia & Employees, p. 81, Non-financial statement, p. 42 Altia has certified the voluntary OHSAS management system at its main production sites in Finland to highlight the importance of safety within the com-pany. Other production sites follow the same safety requirements. The management system covers all on-site employees and workers.
90BOARD REPORT
BUSINESS OVERVIEW
CORPORATERESPONSIBILITY
CORPORATE GOVERNANCE
FINANCIAL STATEMENTS
ANNUAL REPORT2018

Code GRI content Location Reported fully partly
Comments
403-2 Hazard identification, risk assessment and incidentinvestigation
Altia & Employees, p. 81, Non-financial statement, p. 42
Altia has a process, procedures and frequent training for employees and workers to identify work-related hazards and assess risks in order to minimise them.
403-3 Occupational health services Altia & Employees, p. 80 All Altia employees are covered by health services.
403-4 Worker participation, consultation and communication con-cerning occupational health and safety
GRI index Workers frequently participate in consultation and communication concerning occupational health and safety through health and safety committees, surveys, observation and near-miss reporting systems, as well as frequent occupational health and safety meetings.
The health and safety committee meets at Altia-level biannually, and at plant level quarterly. The plant manager participates in meetings to ensure decisions are implemented.
403-5 Worker training on occupational health and safety Altia & Employees, p. 80, GRI index
Altia injury reporting covers all employees, workers and those working on Altia premises who are not Altia employees.
403-6 Promotion of worker health Altia & Society, p. 64
403-7 Prevention and mitigation of occupational health and safety impacts directly linked to business relationships
Non-financial statement, p. 43
403-9 Work-related injuries Altia & Employees, p. 81, GRI index
The most common work-related injuries include slipping, wounds and contusions.
GRI 404: Training and education
404-1 Average hours of training per year per employee GRI index Systematic gathering of information for the whole group has been in place since 2017. Based on employees’ own reports, average training amounted to 4.2 hours per employee in 2018.
404-2 Programmes for upgrading employee skills and transition assistance programmes
Altia & Employees, p. 79
91BOARD REPORT
BUSINESS OVERVIEW
CORPORATERESPONSIBILITY
CORPORATE GOVERNANCE
FINANCIAL STATEMENTS
ANNUAL REPORT2018

Code GRI content Location Reported fully partly
Comments
404-3 Percentage of employees receiving regular performance and career development reviews
Altia & Employees, p. 79
GRI 405: Diversity and equal opportunity
405-1 Diversity of governance bodies and employees Corporate Governance Statement 2018, pp. 94-95, p. 98, Altia & Employees, p. 83
GRI 414: Supplier social assessment
414-2 Negative social impacts in the supply chain and actions taken Altia & Customers, p. 62Altia & Society, p. 68
Altia discloses information related to the annual number of amfori BSCI audits conducted in the Altia supply chain. All audit results and the implementa-tion of remediation plans are carefully monitored. Altia carefully monitors the share of purchases from amfori BSCI classified risk countries. Altia frequently monitors the responsibility policies and practices of its supply chain by sending out a CSR questionnaire for its own suppliers. The questionnaire was last sent out in 2017; the next will be sent out in the near future. No significant negative impacts have been identified based on the results.
GRI 415: Public policy
415-1 Political contributions GRI index Altia does not support, whether directly or indirectly, political parties, organisations or individual candidates.
GRI 416: Customer health and safety
416-2 Incidents of non-compliance concerning the health and safety impacts of products and services
GRI index There were three recalls during the reporting period. There were no incidents of non-compliance regard-ing the health and safety impacts of products.
GRI 417: Marketing and labelling
417-3 Incidents of non-compliance concerning marketing communications
GRI index None in 2018.
92BOARD REPORT
BUSINESS OVERVIEW
CORPORATERESPONSIBILITY
CORPORATE GOVERNANCE
FINANCIAL STATEMENTS
ANNUAL REPORT2018

Corporate Governance
93BOARD REPORT
BUSINESS OVERVIEW
CORPORATERESPONSIBILITY
CORPORATE GOVERNANCE
FINANCIAL STATEMENTS
ANNUAL REPORT2018

This Corporate Governance Statement of Altia
Plc is issued for the financial year 2018.
The duties and responsibilities of Altia Plc’s
(“Altia” or the “company”) governing bodies are
determined by Finnish law as well as Altia’s Ar-
ticles of Association approved by the General
Meeting of Shareholders and Altia’s Govern-
ance Principles approved by Altia’s Board of
Directors.
Altia is listed on the Official List of Nasdaq
Helsinki. Altia’s head office is located in
Helsinki, Finland.
This Corporate Governance Statement has
been prepared in accordance with the Finnish
Corporate Governance Code 2015 published
by the Securities Market Association (the
“Governance Code”). This Statement is not
part of the Board of Directors’ Report. Altia
complies with all Recommendations of the
Governance Code.
The information required by the Finnish Cor-
porate Governance Code is also available on
the company’s website www.altiagroup.com.
An unofficial English translation of the Finnish
Corporate Governance Code 2015 is available
at www.cgfinland.fi.
Corporate Governance Statement 2018
Governing BodiesThe management of the company is the
responsibility of the General Meeting of
Shareholders, the Board of Directors and the
CEO. The management and administration of
the company are also based on the decisions of
the General Meeting of Shareholders and the
company.
General Meeting of Shareholders
The General Meeting of Shareholders is the
ultimate decision-making authority of the
company. At the General Meeting of Share-
holders, the shareholder exercises its powers
in accordance with the Companies Act and the
Articles of Association. The General Meet-
ing of Shareholders decides on matters that
under the Companies Act and the Articles of
Association are within its purview. A General
Meeting of Shareholders is convened by the
Board of Directors annually within six months
from the end of the previous financial year. An
Extraordinary Meeting of Shareholders may
be convened in the manner provided for in the
Companies Act. Matters on which the Annual
General Meeting decides include the adoption
of the financial statements, distribution of prof-
its, discharge from liability, and election of the
chairman, vice chairman and other members
of the Board of Directors and the auditor, as
well as their remuneration. Decisions to amend
the Articles of Association are also taken by a
General Meeting of Shareholders.
The Board of Directors
The Board of Directors is responsible for the
administration of the company and the appro-
priate organisation of its operations. The Board
of Directors is responsible for the appropriate
arrangement of the control of the company’s
accounts and finances. The Board of Directors
also ensures that good corporate governance
is complied with throughout the Altia Group.
The Board of Directors has approved the
Corporate Governance principles of the Altia
Group. The members of the Board of Directors
are elected by the General Meeting of Share-
holders. According to the Articles of Associa-
tion, the Board of Directors consists of no less
than one and no more than five members in
addition to the chairman and vice chairman.
The General Meeting of Shareholders elects
the chairman, the vice chairman and the other
members of the Board of Directors for a term
expiring at the end of the next Annual General
Meeting following their election. The bio-
graphical details of the members of the Board
of Directors are presented on the company’s
website at www.altiagroup.com.
The Board of Directors have adopted the
charter of the Board of Directors, which sets
fort the procedures and working principles
of the Board of Directors, as well as the most
important tasks and issues considered and ap-
proved by the Board of Directors. Accordingly,
the Board of Directors approves the compa-
ny’s strategy, financial targets, budgets, major
investments and risk management principles.
The Board of Directors appoints and dismisses
the company’s CEO. The Board of Directors
considers and decides on all significant matters
concerning the operations of the Altia Group
and the business areas. The Board of Directors
has also approved the charters of the Audit
Committee and Human Resources Committee.
The Board of Directors convenes in accord-
ance with a schedule agreed in advance and
also as required. The Board of Directors also
receives in its meetings current information on
the operations, finances and risks of the Group.
Board meetings are attended by the CEO, the
CFO and the General Counsel (who acts as
secretary to the Board). Members of the Exec-
utive Management Team and other represent-
atives of the company attend Board meetings
at the invitation of the Board of Directors.
Minutes are kept of all meetings. The Board of
Directors conducts annually a self-assessment
of its activities and working practices.
94BOARD REPORT
BUSINESS OVERVIEW
CORPORATERESPONSIBILITY
CORPORATE GOVERNANCE
FINANCIAL STATEMENTS
ANNUAL REPORT2018

Diversity of the Board of Directors
In Altia, the election and composition of the
Board of Directors is also guided by the principle
of diversity to ensure that the company has a
skilled, competent, experienced and effective
Board of Directors. Diversity is an essential
quality of a well-functioning Board of Directors.
The Board must at all times be able to react to
the requirements of Altia’s business and strategic
objectives, and support and challenge manage-
ment in a proactive and constructive manner. A
diverse composition of the Board of Directors
supports and caters to the current and future
needs in the successful development and growth
of the company.
A diverse composition of the Board of Di-
rectors includes complementary education,
competence and experience of its members in
different professional fields and management
of business in different development phases
as well as the personal qualities of each board
member, all of which add to the diversity of the
Board of Directors. Diversity is also supported
by relevant experience in fields and markets that
are strategically significant for the company, now
and in the future, by strong and relevant acumen
in international environments and businesses,
and by a diverse age, term of office and gender
distribution.
Shareholders’ Nomination Board
The Shareholders’ Nomination Board prepares
annually proposals concerning the composition,
election and remuneration of the members of
the Board of Directors.
Pursuant to the charter of the Nomination
Board approved by the General Meeting of
Shareholders, the Nomination Board consists
of three physical persons nominated by the
three largest shareholders. The Chairman of
the Board acts as an expert member in the
Nomination Board. The Chairman of the Board
is not a member of the Nomination Board and
does not have voting rights. The term of the
members of the Nomination Board ends on
the appointment of the following Nomination
Board. The members of the Nomination Board
are not entitled to remuneration from the
company based on their membership unless
otherwise decided by the General Meeting of
Shareholders.
The main duty of the Nomination Board is to
ensure that the Board and its members repre-
sent a sufficient level of expertise, knowledge
and competence for the needs of the Company
and have the possibility to devote sufficient
amount of time to attend their duties as mem-
bers of the Board. The Nomination Board shall
pay attention to achieving a good and balanced
gender distribution and diversity balance on
the Board considering the competence of the
Board as a whole. The Nomination Board shall
in its work consider the diversity principles of
the Company.
The Nomination Board has the power and
authority to prepare and to present a propos-
al to the General Meeting of Shareholders
concerning the number of members and
composition of the Board of Directors; and the
remuneration of the members of the Board of
Directors and the Board committees as well as
seek prospective successor candidates for the
members of the Board of Directors.
The Nomination Board shall submit its pro-
posals to the Board of Directors at the latest
on 31 January each year. The Proposals of
the Nomination Board will be disclosed by a
release by the company and included in the
notice to the General Meeting of Sharehold-
ers. The Chairman of the Nomination Board
presents the proposals at the General Meeting
of Shareholders.
Board Committees
The Board of Directors of Altia has two
Committees, the Audit Committee and the
Human Resources Committee. The Commit-
tees do not have independent decision-making
powers in relation to matters falling within the
competence of the Board of Directors. The
Committees are preparatory bodies that assist
the Board of Directors by preparing and sub-
mitting proposals to the Board of Directors on
matters within their purview. Minutes are kept
of Committee meetings. The Board of Direc-
tors has approved the charters of the Commit-
tees. In its constitutive meeting, the Board of
Directors appoints annually, from among its
members, the members and the chairman of
the Audit Committee and the Human Re-
sources Committee.
In addition to the Audit Committee and Human
Resources Committee, the Board of Directors
may appoint ad hoc committees for preparing
specific matters. Such committees do not have
Board-approved charters and the Board of
Directors do not release information on their
term, composition, number of meetings or the
members’ attendance rates.
Audit Committee
The task of the Audit Committee is to assist the
Board of Directors by reviewing and preparing
topics relating to control of the company’s op-
erations and financial reporting and submitting
resolution proposals to the Board of Directors
on such topics. The Audit Committee’s duties
include monitoring the financial affairs and
financial reporting of the company, monitoring
the process for the reporting of the financial
statements, reviewing the interim reports and
financial statements and present them for ap-
proval by the Board of Directors, monitor the
audit proper of the financial statements and
consolidated financial statements, and monitor
the effectiveness of internal controls, internal
audit and risk management systems.
In addition, the duties of the Audit Commit-
tee include preparatory work on the decision
95BOARD REPORT
BUSINESS OVERVIEW
CORPORATERESPONSIBILITY
CORPORATE GOVERNANCE
FINANCIAL STATEMENTS
ANNUAL REPORT2018

on electing the auditor, the evaluation of the
independence of the auditor, particularly the
provision of related services to the company
and carrying out other tasks assigned to it by
the Board of Directors. The Audit Committee
consist of at least three members.
Human Resources Committee
The Human Resources Committee assists the
Board of Directors by reviewing and preparing
management and personnel remuneration poli-
cies and issues related to management appoint-
ments, and making proposals on such matters
to the Board of Directors. The Committee’s
responsibilities include reviewing, evaluating and
making proposals on the remuneration structure
and incentive schemes of management and the
personnel of the Altia Group; monitoring the
effectiveness of these schemes to ensure that
they promote achievement of the company’s
short term and long term goals and are based on
personal performance; reviewing and preparing
other matters relating to the remuneration of
management and personnel, and submitting
proposals on these to the Board of Directors;
and considering and preparing appointments of
top management to be decided by the Board of
Directors.
In addition, based on the proposal of the CEO, the
Human Resources Committee proposes to the
Board of Directors the appointment of members
of the Executive Management Team and their
remuneration, and the Committee evaluates the
performance of the CEO and the members of
the Executive Management Team and proposes
to the Board of Directors their annual remu-
neration and other incentives. The Human Re-
sources Committee has at least three members.
Chief Executive Officer
The Board of Directors of Altia appoints
and dismisses the Chief Executive Officer
(CEO), and decides on the terms of the CEO’s
employment. The terms and conditions of the
CEO’s employment are specified in a written
service contract. The CEO of the company
is responsible for managing, supervising and
controlling the business operations of the
company. The CEO is responsible for the day-
to-day executive management of the company
in accordance with the instructions and orders
given by the Board of Directors. In addition,
the CEO also ensures that the accounts of the
company comply with Finnish law and that
its financial affairs have been arranged in a
reliable manner. The CEO shall provide the
Board of Directors and its members with the
information necessary for the performance of
the duties of the Board of Directors. The CEO
prepares issues for decision by the Board of
Directors, develops the company in line with
the targets agreed upon with the Board of
Directors and ensures proper implementation
of the decisions of the Board of Directors. The
CEO is also responsible for ensuring that the
company is managed in compliance with appli-
cable laws and regulations. The CEO is not a
member of the Board of Directors, but attends
the meetings of the Board of Directors and
has the right to speak at the meeting, unless
the Board of Directors decides otherwise with
regard to a particular subject matter.
Executive Management Team
The Executive Management Team is chaired
by the CEO of Altia and comprises other
senior management appointed by the Board of
Directors. The Executive Management Team
meets regularly to address matters concerning
the entire Group. The Executive Management
Team is not a decision-making body of the com-
pany. It assists the CEO in the implementation
of Group strategy and in operational manage-
ment. The Executive Management Team is
responsible for managing the company’s core
business operations as a whole, which requires
planning of various development processes,
Group principles and Group practices, as well
as monitoring the development of financial
matters and Group business plans. The Execu-
tive Management Team convenes monthly and
minutes are kept of the meetings. The Board
of Directors have approved the charter of the
Executive Management Team.
ControlInternal Audit
The Board of Directors appointed BDO as
Internal Auditor of Altia as of the beginning
of 2018. The internal auditor reports to the
chairman of the Audit Committee. Internal
audit monitors and evaluates the operation of
processes as well as the appropriateness and
effectiveness of the internal controls and the
financial reporting of the company in an inde-
pendent manner. The audit areas and audit plan
of the internal audit are decided annually by the
Audit Committee. Internal audit is implemented
in accordance with the charter of the internal
audit approved by the Board of Directors.
External Audit
According to the Articles of Association, the
company has one auditor. The auditor must be
a firm of authorised public accountants. The
auditor is elected annually by the Annual Gen-
eral Meeting for a term that expires at the end
of the next Annual General Meeting following
the election. The task of the auditor is to audit
the consolidated financial statements, the
financial statements of the parent company,
the accounting of the Group and the parent
company and the administration of the parent
company. The company’s auditor submits the
auditors’ report to the shareholders in connec-
tion with the annual financial statements, as
required by law, and submits regular reports
on its findings to the Audit Committee of the
Board of Directors.
Related Party TransactionsIn accordance with the Governance Code, the
Company evaluates and monitors transactions
concluded between the company and its related
parties and ensures that any conflicts of interest
96BOARD REPORT
BUSINESS OVERVIEW
CORPORATERESPONSIBILITY
CORPORATE GOVERNANCE
FINANCIAL STATEMENTS
ANNUAL REPORT2018

are taken into account appropriately in the
decision-making process of the company. The
Company keeps a list of parties that are related
to the company.
Transactions with related parties are entered
into on market terms and relevant decisions
are taken in compliance with the company’s
approval policy and established decision-
making limits. The company’s finance function
monitors related party transactions as a part
of the company’s normal reporting and control
procedures, and reports related party transac-
tions on a quarterly basis to the Audit Commit-
tee. The company reports the decision-making
procedure applied in connection with related
party transactions that are material to the
company and that either deviate from the
company’s normal business operations or are
not made on market or market equivalent
terms. Information on transactions concluded
between the company and its related parties is
disclosed annually in the notes to the compa-
ny’s consolidated financial statements.
Internal control procedures and main features of risk management systemsInternal Control
Internal control ensures that the company’s
business objectives can be achieved. Through
efficient control, deviations from objectives
can be prevented or detected as early as
possible, so that corrective measures can be
taken. The purpose of internal control is to
ensure the profitability, efficiency, continuity
and freedom from disruptions of operations
and that the Group’s financial and operat-
ing reporting both externally and internally
is reliable and compliant, and that internal
principles, policies and guidelines are followed.
Further, the internal control ensures com-
pliance with laws and agreements. Internal
control measures cover all Group levels and
functions. Information systems are of vital
importance for effective internal control. The
planning of the control measures begins with
the definition of business objectives and the
identification and assessment of the risks that
threaten the objectives. Control measures are
targeted based on risks, and control measures
are selected as appropriate so as to keep the
risks under control.
The Board and the CEO are responsible for
organising internal control. The financial per-
formance of the Group is monitored monthly
in the Executive Management Team and in the
management teams of the business areas. Each
business area must ensure effective control of
its own operations. The business areas and the
Group Finance organisation are responsible
for the financial reporting processes. The Audit
Committee assesses the financial reporting
processes. In addition, the financial situation
of the Group is also monitored in the meet-
ings of the Audit Committee and the Board of
Directors.
Risk Management
The objective of risk management in the Altia
Group is to support the implementation of the
strategy, the identification of risks and meth-
ods for reducing the probability and impacts
of risks, as well as ensuring business continu-
ity. Risks may arise from internal or external
events. The Board has approved the Group
Risk Management Policy, which describes the
objectives, principles and responsibilities of
risk management in the Group and also the
principles of reporting. Accordingly, the Risk
Steering Group supports and co-ordinates risk
management as part of the Group’s planning
and steering processes. It also regularly
reports the key risks to the management and
the Audit Committee. The Board regularly dis-
cusses the Group’s most significant risks and
uncertainties and reports them to the market
annually in the Board of Directors’ Report. The
business areas are responsible for risks related
to their operations and their identification,
prevention and key mitigation means. The
Group Treasury manages the financial risks
according to the hedging principles defined in
the Treasury Policy. The company’s Internal
Audit evaluates the efficiency of the company’s
risk management system.
Insider AdministrationIn its insider administration, the company
follows the Guidelines for Insiders issued
by Nasdaq Helsinki complemented by the
Company’s own Insider Policy adopted by the
Board. The Company maintains its own insider
registers. The Company does not have perma-
nent insiders.
Persons in managerial positions are prohibited
to conduct transactions (on their own account
or for the account of a third party), directly or
indirectly, in the financial instruments of the
Company during a closed period of 30 calen-
dar days before the announcement of each
of the quarterly financial reports or the year-
end report (financial statement release). The
Company applies the closed period after the end
of each calendar quarter until the day after the
announcement of the interim report or financial
statements release, as the case may be (the
”Closed Window”). The Closed Window shall,
however, always include at least 30 calendar
days immediately preceding the announcement
of the interim report or financial statements
release, as the case may be, and the day of publi-
cation of such report. The prohibition is in force
regardless of whether such a person holds any
inside information at that time. A project-
specific insider register is also maintained when
required by law or regulations. Project-
specific insiders are prohibited from trading in
the Company’s securities until the termination
of the project. Persons in managerial positions
(and their closely associated persons) are obli-
gated to report transactions in the Company’s
financial instruments in line with applicable EU
and domestic laws and regulations. The Board,
the CEO and the members of the Executive
97BOARD REPORT
BUSINESS OVERVIEW
CORPORATERESPONSIBILITY
CORPORATE GOVERNANCE
FINANCIAL STATEMENTS
ANNUAL REPORT2018

Management Team are designated as persons
with an obligation to disclose their transactions
Corporate Governance in 2018 Altia’s Listing on Nasdaq Helsinki
On 12 March 2018 Altia announced that it will
apply for its shares to be listed on the official list
on Nasdaq Helsinki Ltd. The Initial Public Of-
fering was completed on 23 March 2018 with
an oversubscription of the offered shares. In ad-
dition, the company issued 180 485 new shares
in the Company for the permanent employees
of Altia in Finland and Sweden and for the mem-
bers of the Executive Management Team.
The subscription price for the sale shares was
set at EUR 7.50 per share and EUR 6.75 per
share in the personnel offering. 6 000 000
shares were allocated to private individuals and
entities in Finland, and 17 000 000 shares were
allocated to institutional investors. Approxi-
mately 16 500 investors submitted a subscrip-
tion commitment in the public share sale.
Trading in Altia’s shares commenced on the
prelist of Nasdaq Helsinki Ltd on 23 March
2018 and on the official list of the Helsinki
Stock Exchange on 27 March 2018. The per-
sonnel shares were admitted for trading on 28
March 2018.
Extraordinary General Meeting
The extraordinary General Meeting of Altia
Plc held on 22 February 2018 elected Mr Juk-
ka Ohtola to the Board of Directors of Altia.
Annual General Meeting
The 2018 Annual General Meeting of Altia
adopted the financial statements for the fi-
nancial year 2017. The members of the Board
of Directors and the CEO were discharged
from liability for the financial year 2017. The
Annual General meeting elected the members
of the Board of Directors and the auditor.
As proposed by the Board of Directors, the
Annual General Meeting decided that no
dividend is distributed for the financial year
2017.
The Board of Directors
The Annual General Meeting of Altia elected
the following seven members to the Board of
Directors of Altia:
• Ms Sanna Suvanto-Harsaae, chairman,
b. 1966, B.Sc. (Business Administration)
• Mr Kai Telanne, vice chairman b. 1964,
M.Sc. (Econ.), President and CEO
• Mr Kim Henriksson, b. 1968, M.Sc.
(Econ.), CFO
• Ms Annikka Hurme, b. 1964, M.Sc.
(Food Sciences), CEO
• Ms Tiina Lencioni, b. 1971, Master of
Laws (LL.M.) 2.Staatsexamen/Assessor
iuris. (Germany), General Counsel
• Mr Jukka Ohtola, b.1967, M.Sc. (Econ.),
CEFA, Ministerial Adviser
• Mr Torsten Steenholt, b. 1969, M.Sc.
(Pharmacy), M.Sc. (Chemical Research),
Master Brewer, EVP
The Board of Directors have assessed the
independence of its members. All members
of the Board of Directors are independent of
the company. Board member Jukka Ohtola
holds an office with the Ownership Steering
Department of the Prime Minister’s Office. All
other members of the Board of Directors are
independent of the shareholders of the com-
pany. The Board of Directors of Altia convened
fifteen times in 2018, with an average attend-
ance rate of 94.1%.
Diversity of the Board of Directors
In 2018, the Board of Directors of Altia
consisted of six to seven members, of whom all
hold university-level degrees. The members of
the Board of Directors have international work
experience in different managerial positions or
have worked or are working in the boards of
directors or in the management of listed or un-
listed companies. Two members have worked
or work in managerial positions in FMCG
companies. In 2018, the gender distribution
in the Board of Directors was well balanced
with three women and four men. In terms of
age, the members of the Board of Directors are
between 47 and 54 years of age. With regard to
the terms of office of the members of the Board
of Directors, the members have been appointed
in 2010, 2013, 2015, 2016, 2017 and 2018.
Audit Committee
The members of the Audit Committee of the
Board of Directors are Mr Kim Henriksson
(chairman), Ms Tiina Lencioni and Ms Sanna
Suvanto-Harsaae. In 2018, the Audit Com-
mittee convened seven times, with an average
attendance rate of 100%.
Human Resources Committee
The members of the Human Resources Com-
mittee of the Board of Directors are Ms Sanna
Suvanto-Harsaae (chairman), Ms Annikka
Hurme, Mr Jukka Ohtola and Mr Kai Telanne. In
2018, the Human Resources Committee con-
vened eight times and the average attendance
rate of the Committee’s members was 92.9%.
98BOARD REPORT
BUSINESS OVERVIEW
CORPORATERESPONSIBILITY
CORPORATE GOVERNANCE
FINANCIAL STATEMENTS
ANNUAL REPORT2018
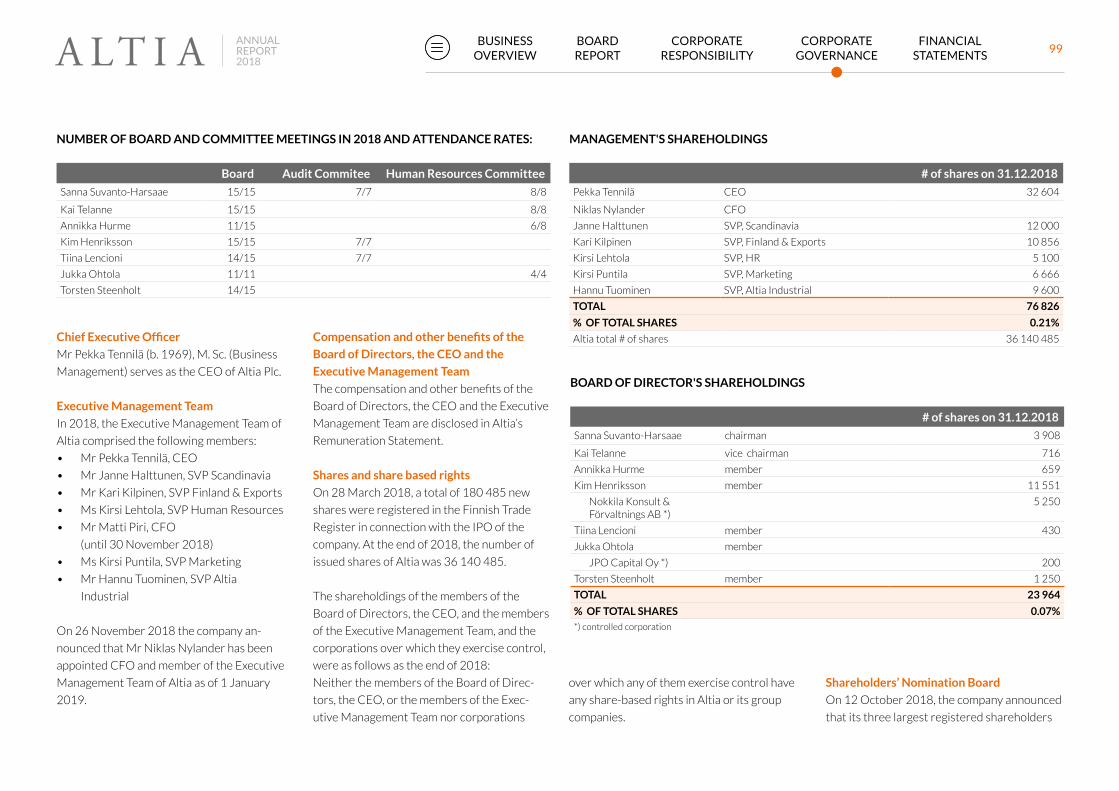
NUMBER OF BOARD AND COMMITTEE MEETINGS IN 2018 AND ATTENDANCE RATES:
Board Audit Commitee Human Resources Committee
Sanna Suvanto-Harsaae 15/15 7/7 8/8
Kai Telanne 15/15 8/8
Annikka Hurme 11/15 6/8
Kim Henriksson 15/15 7/7
Tiina Lencioni 14/15 7/7
Jukka Ohtola 11/11 4/4
Torsten Steenholt 14/15
MANAGEMENT'S SHAREHOLDINGS
# of shares on 31.12.2018
Pekka Tennilä CEO 32 604
Niklas Nylander CFO
Janne Halttunen SVP, Scandinavia 12 000
Kari Kilpinen SVP, Finland & Exports 10 856
Kirsi Lehtola SVP, HR 5 100
Kirsi Puntila SVP, Marketing 6 666
Hannu Tuominen SVP, Altia Industrial 9 600
TOTAL 76 826
% OF TOTAL SHARES 0.21%
Altia total # of shares 36 140 485
BOARD OF DIRECTOR'S SHAREHOLDINGS
# of shares on 31.12.2018
Sanna Suvanto-Harsaae chairman 3 908
Kai Telanne vice chairman 716
Annikka Hurme member 659
Kim Henriksson member 11 551
Nokkila Konsult & Förvaltnings AB *)
5 250
Tiina Lencioni member 430
Jukka Ohtola member
JPO Capital Oy *) 200
Torsten Steenholt member 1 250
TOTAL 23 964
% OF TOTAL SHARES 0.07%
*) controlled corporation
Chief Executive Officer
Mr Pekka Tennilä (b. 1969), M. Sc. (Business
Management) serves as the CEO of Altia Plc.
Executive Management Team
In 2018, the Executive Management Team of
Altia comprised the following members:
• Mr Pekka Tennilä, CEO
• Mr Janne Halttunen, SVP Scandinavia
• Mr Kari Kilpinen, SVP Finland & Exports
• Ms Kirsi Lehtola, SVP Human Resources
• Mr Matti Piri, CFO
(until 30 November 2018)
• Ms Kirsi Puntila, SVP Marketing
• Mr Hannu Tuominen, SVP Altia
Industrial
On 26 November 2018 the company an-
nounced that Mr Niklas Nylander has been
appointed CFO and member of the Executive
Management Team of Altia as of 1 January
2019.
Compensation and other benefits of the
Board of Directors, the CEO and the
Executive Management Team
The compensation and other benefits of the
Board of Directors, the CEO and the Executive
Management Team are disclosed in Altia’s
Remuneration Statement.
Shares and share based rights
On 28 March 2018, a total of 180 485 new
shares were registered in the Finnish Trade
Register in connection with the IPO of the
company. At the end of 2018, the number of
issued shares of Altia was 36 140 485.
The shareholdings of the members of the
Board of Directors, the CEO, and the members
of the Executive Management Team, and the
corporations over which they exercise control,
were as follows as the end of 2018:
Neither the members of the Board of Direc-
tors, the CEO, or the members of the Exec-
utive Management Team nor corporations
over which any of them exercise control have
any share-based rights in Altia or its group
companies.
Shareholders’ Nomination Board
On 12 October 2018, the company announced
that its three largest registered shareholders
99BOARD REPORT
BUSINESS OVERVIEW
CORPORATERESPONSIBILITY
CORPORATE GOVERNANCE
FINANCIAL STATEMENTS
ANNUAL REPORT2018

(shareholder register maintained by Euroclear
Finland Ltd as per 3 September 2018) have
nominated the following representatives to the
Shareholders’ Nomination Board:
• Mr Jarmo Väisänen, the Ownership Steer-
ing Department in the Prime Minister’s
Office
• Ms Hanna Kaskela, Varma Mutual Pension
Insurance Company
• Ms Annika Ekman, Ilmarinen Mutual Pen-
sion Insurance Company
The Nomination Board elected Mr Jar-
mo Väisänen as its Chairman. The Chair-
man of Altia’s Board of Directors, Sanna
Suvanto-Harsaae acts as an expert member in
the Nomination Board.
External Audit
PricewaterhouseCoopers Oy, a firm of Author-
ised Public Accountants, is Altia’s auditor, with
Ylva Eriksson, Authorised Public Accountants,
as the principal auditor. The fees for the audit
proper paid to PwC in 2018 totaled EUR 0.3
million. In addition, EUR 0.6 million was paid
for other consultation provided to Group
companies.
100BOARD REPORT
BUSINESS OVERVIEW
CORPORATERESPONSIBILITY
CORPORATE GOVERNANCE
FINANCIAL STATEMENTS
ANNUAL REPORT2018
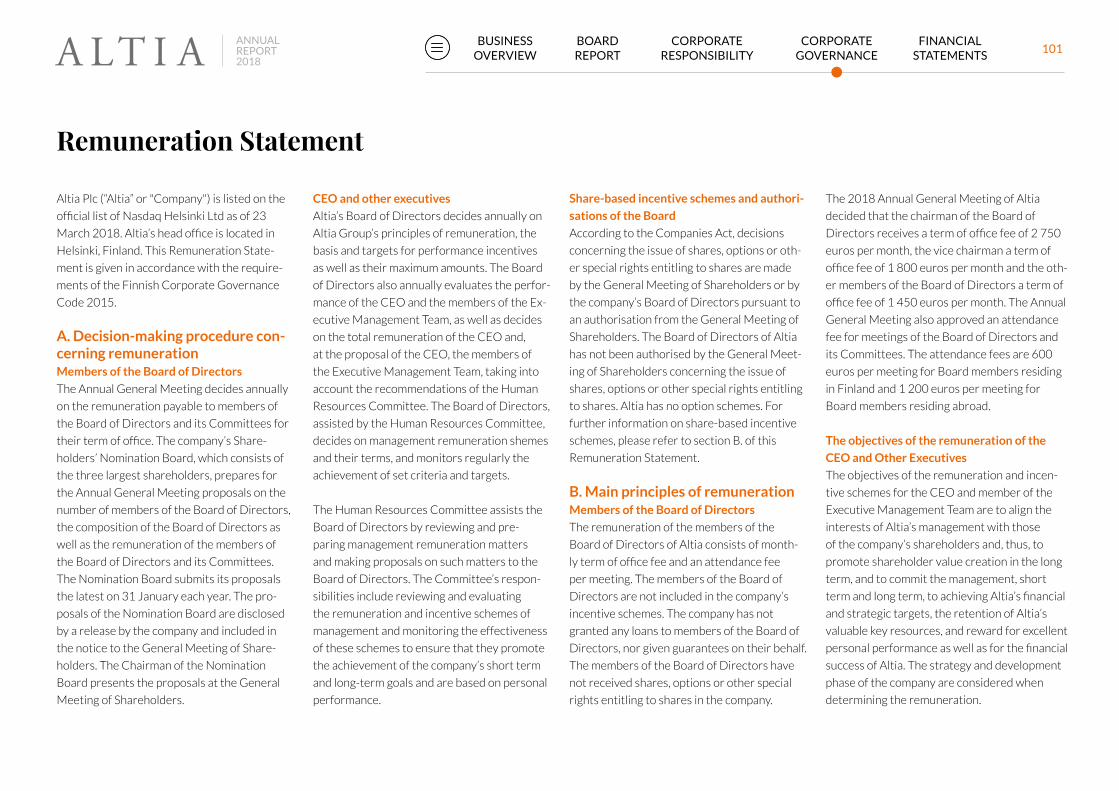
Altia Plc (“Altia” or "Company") is listed on the
official list of Nasdaq Helsinki Ltd as of 23
March 2018. Altia’s head office is located in
Helsinki, Finland. This Remuneration State-
ment is given in accordance with the require-
ments of the Finnish Corporate Governance
Code 2015.
A. Decision-making procedure con-cerning remunerationMembers of the Board of Directors
The Annual General Meeting decides annually
on the remuneration payable to members of
the Board of Directors and its Committees for
their term of office. The company’s Share-
holders’ Nomination Board, which consists of
the three largest shareholders, prepares for
the Annual General Meeting proposals on the
number of members of the Board of Directors,
the composition of the Board of Directors as
well as the remuneration of the members of
the Board of Directors and its Committees.
The Nomination Board submits its proposals
the latest on 31 January each year. The pro-
posals of the Nomination Board are disclosed
by a release by the company and included in
the notice to the General Meeting of Share-
holders. The Chairman of the Nomination
Board presents the proposals at the General
Meeting of Shareholders.
Remuneration Statement
CEO and other executives
Altia’s Board of Directors decides annually on
Altia Group’s principles of remuneration, the
basis and targets for performance incentives
as well as their maximum amounts. The Board
of Directors also annually evaluates the perfor-
mance of the CEO and the members of the Ex-
ecutive Management Team, as well as decides
on the total remuneration of the CEO and,
at the proposal of the CEO, the members of
the Executive Management Team, taking into
account the recommendations of the Human
Resources Committee. The Board of Directors,
assisted by the Human Resources Committee,
decides on management remuneration shemes
and their terms, and monitors regularly the
achievement of set criteria and targets.
The Human Resources Committee assists the
Board of Directors by reviewing and pre-
paring management remuneration matters
and making proposals on such matters to the
Board of Directors. The Committee’s respon-
sibilities include reviewing and evaluating
the remuneration and incentive schemes of
management and monitoring the effectiveness
of these schemes to ensure that they promote
the achievement of the company’s short term
and long-term goals and are based on personal
performance.
Share-based incentive schemes and authori-
sations of the Board
According to the Companies Act, decisions
concerning the issue of shares, options or oth-
er special rights entitling to shares are made
by the General Meeting of Shareholders or by
the company’s Board of Directors pursuant to
an authorisation from the General Meeting of
Shareholders. The Board of Directors of Altia
has not been authorised by the General Meet-
ing of Shareholders concerning the issue of
shares, options or other special rights entitling
to shares. Altia has no option schemes. For
further information on share-based incentive
schemes, please refer to section B. of this
Remuneration Statement.
B. Main principles of remunerationMembers of the Board of Directors
The remuneration of the members of the
Board of Directors of Altia consists of month-
ly term of office fee and an attendance fee
per meeting. The members of the Board of
Directors are not included in the company’s
incentive schemes. The company has not
granted any loans to members of the Board of
Directors, nor given guarantees on their behalf.
The members of the Board of Directors have
not received shares, options or other special
rights entitling to shares in the company.
The 2018 Annual General Meeting of Altia
decided that the chairman of the Board of
Directors receives a term of office fee of 2 750
euros per month, the vice chairman a term of
office fee of 1 800 euros per month and the oth-
er members of the Board of Directors a term of
office fee of 1 450 euros per month. The Annual
General Meeting also approved an attendance
fee for meetings of the Board of Directors and
its Committees. The attendance fees are 600
euros per meeting for Board members residing
in Finland and 1 200 euros per meeting for
Board members residing abroad.
The objectives of the remuneration of the
CEO and Other Executives
The objectives of the remuneration and incen-
tive schemes for the CEO and member of the
Executive Management Team are to align the
interests of Altia’s management with those
of the company’s shareholders and, thus, to
promote shareholder value creation in the long
term, and to commit the management, short
term and long term, to achieving Altia’s financial
and strategic targets, the retention of Altia’s
valuable key resources, and reward for excellent
personal performance as well as for the financial
success of Altia. The strategy and development
phase of the company are considered when
determining the remuneration.
101BOARD REPORT
BUSINESS OVERVIEW
CORPORATERESPONSIBILITY
CORPORATE GOVERNANCE
FINANCIAL STATEMENTS
ANNUAL REPORT2018

Remuneration of the CEO
The remuneration of the CEO of Altia con-
sists of a fixed base salary, fringe benefits,
an annual incentive and long-term incen-
tive schemes. The yearly fixed base salary
of CEO Pekka Tennilä is 314 612 euros.
The retirement age of the CEO is 63 years
and his pension is in accordance with the
Employees’ Pensions Act. The CEO does not
have a supplementary pension insurance
paid by the company. No signing bonus has
been paid to the CEO, nor does he have
a stay bonus. The CEO has a six months
period of notice. If the service contract is
terminated by Altia, the CEO is entitled to
a severance payment corresponding to six
months’ salary, in addition to the salary for
the notice period.
Remuneration of Other Executives
The remuneration of the members of Altia’s
Executive Management Team consists of a
fixed base salary, fringe benefits, an annual
incentive and long-term incentive schemes.
The retirement age and pension of the
executives are in accordance with the Em-
ployees’ Pensions Act. No signing bonus has
been paid to the Executive Team Members,
nor does they have a stay bonus. If the em-
ployment contract is terminated by Altia, the
executive is entitled to a severance payment
corresponding to six months’ salary, in addi-
tion to the salary for the notice period.
Neither the CEO nor any of the members of
the Executive Management Team have received
shares, options or other special rights entitling
to shares in the company as remuneration.
Altia’s Incentive SchemesAnnual incentive
Altia’s CEO and the members of the Execu-
tive Management Team are part of an annual
incentive plan. The potential annual incentive is
based on operational targets of the Group with
a weight of 70% and on personal targets with
a weight of 30%. The targets are approved an-
nually by the Board of Directors. The potential
incentive award is paid annually. The target level
of the CEO’s and the Executive Management
Team members’ incentive for 2019 is 30% of
the annual salary and the maximum level is 60%
of the annual salary. The operational target for
the 2019 annual incentive plan is the improve-
ment of comparable EBITDA.
Long-term incentive schemes
Altia’s long-term incentive schemes comple-
ment the annual incentive to create a balanced
incentive structure.
Long-term incentive scheme 2017–2019
Altia’s CEO and the members of the Executive
Management Team are part of a long-term in-
centive scheme for 2017–2019, which has been
approved by the Board of Directors. According
to the plan, possible awards are paid during
2020–2022 in cash. The target reward level
is 20% of the annual salary and the maximum
level is 40% of the annual salary. The target of
the long-term incentive scheme is to increase
shareholder value and favorable development
of net sales.
New share-based long-term
incentive scheme
The Board of Directors of Altia Plc has in Feb-
ruary 2019 decided on the establishment of a
new share-based long-term incentive scheme
for the management and key employees of
Altia Group. The incentive scheme consists of
annually commencing individual performance
share plans (PSP), each with a three-year per-
formance period, followed by the payment of
the potentially earned share reward. The com-
mencement of each individual plan is subject to
a separate Board approval.
The First Plan 2019–2021
The first plan within the structure, PSP 2019–
2021, commences as of the beginning of 2019.
Eligible to participate in PSP 2019–2021 are
approximately 20 individuals, including the
CEO and other members of the Executive
Management Team. Potential rewards under
the plan will be paid in the spring of 2022, pro-
vided that the performance targets set by the
Board of Directors are achieved. The potential
reward will be paid in listed shares of Altia Plc.
The performance targets based on which the
potential share reward under PSP 2019–2021
will be paid are the relative total shareholder
return of Altia’s share and earnings per share
(EPS). If all the performance targets set for PSP
2019–2021 are fully achieved, the aggregate
maximum number of shares to be paid based
on this first plan is approximately 250 000
shares. This number of shares represents a
gross earning, from which the applicable payroll
tax is withheld and the remaining net value is
paid to the participants in shares. The Board of
Directors anticipates that no new shares will
be issued based on the share-based incentive
scheme and that the scheme will, therefore, not
have a dilutive effect on the registered number
of the Company's shares. According to the
terms of the incentive scheme, the combined
amount of variable compensation paid to an in-
dividual participant in any given year, including
the long-term incentive scheme and the short-
term incentive scheme, may not exceed 120% of
the individual' annual gross base salary.
Share ownership recommendation
Altia applies a share ownership recommenda-
tion to the members of its Executive Manage-
ment Team. According to this recommendation
each member of the Executive Management
Team is expected to retain in his/her ownership
at least half of the net shares received under
the share-based incentive schemes of Altia until
the value of his/her share ownership in Altia
corresponds to at least his/her annual gross
base salary.
102BOARD REPORT
BUSINESS OVERVIEW
CORPORATERESPONSIBILITY
CORPORATE GOVERNANCE
FINANCIAL STATEMENTS
ANNUAL REPORT2018
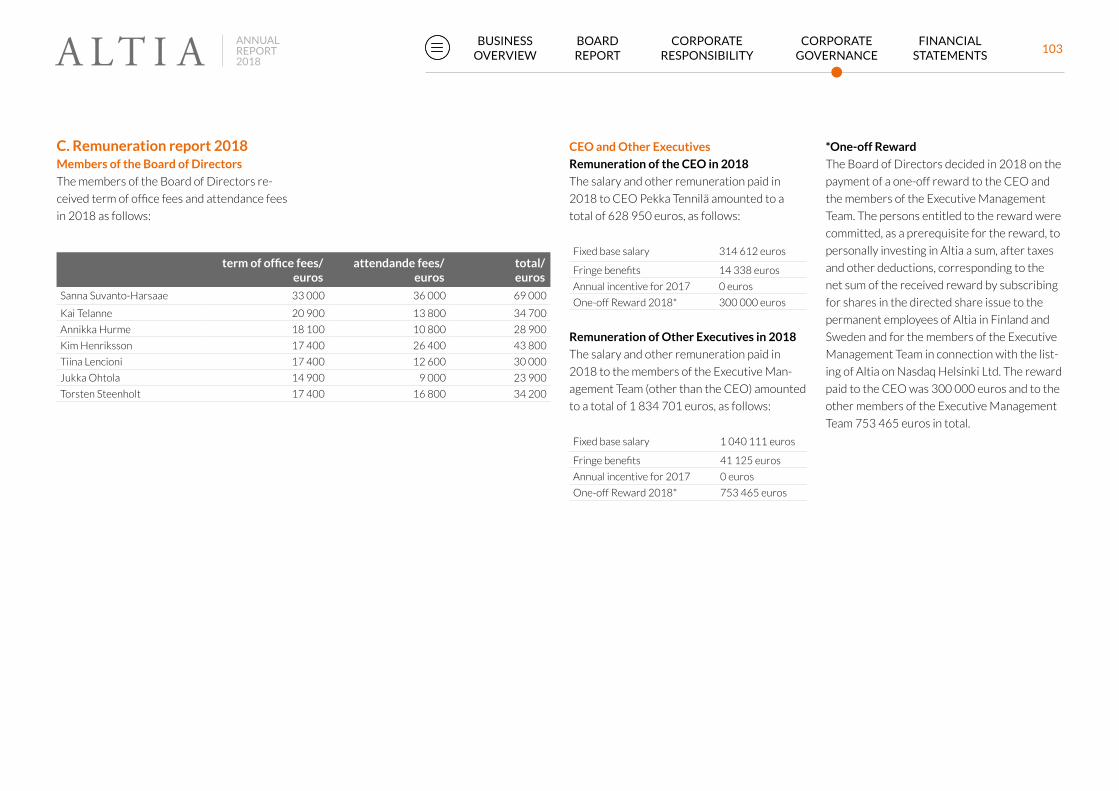
C. Remuneration report 2018Members of the Board of Directors
The members of the Board of Directors re-
ceived term of office fees and attendance fees
in 2018 as follows:
term of office fees/ euros
attendande fees/ euros
total/ euros
Sanna Suvanto-Harsaae 33 000 36 000 69 000
Kai Telanne 20 900 13 800 34 700
Annikka Hurme 18 100 10 800 28 900
Kim Henriksson 17 400 26 400 43 800
Tiina Lencioni 17 400 12 600 30 000
Jukka Ohtola 14 900 9 000 23 900
Torsten Steenholt 17 400 16 800 34 200
CEO and Other Executives
Remuneration of the CEO in 2018
The salary and other remuneration paid in
2018 to CEO Pekka Tennilä amounted to a
total of 628 950 euros, as follows:
Fixed base salary 314 612 euros
Fringe benefits 14 338 euros
Annual incentive for 2017 0 euros
One-off Reward 2018* 300 000 euros
Remuneration of Other Executives in 2018
The salary and other remuneration paid in
2018 to the members of the Executive Man-
agement Team (other than the CEO) amounted
to a total of 1 834 701 euros, as follows:
Fixed base salary 1 040 111 euros
Fringe benefits 41 125 euros
Annual incentive for 2017 0 euros
One-off Reward 2018* 753 465 euros
*One-off Reward
The Board of Directors decided in 2018 on the
payment of a one-off reward to the CEO and
the members of the Executive Management
Team. The persons entitled to the reward were
committed, as a prerequisite for the reward, to
personally investing in Altia a sum, after taxes
and other deductions, corresponding to the
net sum of the received reward by subscribing
for shares in the directed share issue to the
permanent employees of Altia in Finland and
Sweden and for the members of the Executive
Management Team in connection with the list-
ing of Altia on Nasdaq Helsinki Ltd. The reward
paid to the CEO was 300 000 euros and to the
other members of the Executive Management
Team 753 465 euros in total.
103BOARD REPORT
BUSINESS OVERVIEW
CORPORATERESPONSIBILITY
CORPORATE GOVERNANCE
FINANCIAL STATEMENTS
ANNUAL REPORT2018

Sanna Suvanto-HarsaaeCHAIRMAN OF THE BOARD OF DIRECTORS
b. 1966, B.Sc. (Business Administration)
Kai TelanneVICE CHAIRMAN OF THE BOARD OF DIRECTORS
b. 1964, M.Sc. (Econ.)
Kim HenrikssonMEMBER OF THE BOARD OF DIRECTORS
b. 1968, M.Sc. (Econ.)
Annikka HurmeMEMBER OF THE BOARD OF DIRECTORS
b. 1964, M.Sc. (Food Sciences)
Board of DirectorsAt year-end unless otherwise stated
Independent of the company and the shareholders
Chairman of the Board of Directors since 2015, Member of the Board of Directors since 2013 Chairman of the HR Committee, Member of the Audit Committee
Key positions of trust:
• BoConcept AB, Chairman of the Board
• Babysam AS, Chairman of the Board
• TCM AS, Chairman of the Board
• Nordic Pet Care Group AS, Chairman of the Board
• Workz AS, Chairman of the Board
• Footway AB, Chairman of the Board
• Paulig Oy, Vice chairman of the Board
• SAS AB, Member of the Board
• Broman Group Oy, Member of the Board
Alma Media Corporation , President and CEO
Independent of the company and the shareholders
Vice chairman of the Board of Directors since 2018, Member of the Board of Directors since 2016 Member of the HR Committee
Key positions of trust:
• Varma Mutual Pension Insurance Company, Deputy Chairman of the Board
• Teleste Corporation, Member of the Board of Directors
• Tampere Chamber of Commerce and Industry, Member of the Board
EQT AB, Chief Financial Officer
Independent of the company and the shareholders
Member of the Board of Directors since 2015. Chairman of the Audit Committee
Valio Oy, CEO
Independent of the company and the shareholders
Member of the Board of Directors since 2010, Vice-chairman of the Board of Directors 2015–2018 Member of the HR Committee
Key positions of trust:
• Apetit Group, Member of the Board
• Finnish Food and Drink Industries’ Federation, Chairman of the Board and Member of the Executive Committee
• Valion Eläkekassa, Valion Keskinäinen vakuutusyhtiö, Member of the Board
• East Office of Finnish Industries, Member of the Board
• Suomen Messut Osuuskunta, Member of the Supervisory Board
• TAF Technology Academy Finland, Member of the Board
• Finnish Foundation of Cardiovascular Research, Member of the Board
104BOARD REPORT
BUSINESS OVERVIEW
CORPORATERESPONSIBILITY
CORPORATE GOVERNANCE
FINANCIAL STATEMENTS
ANNUAL REPORT2018

Tiina LencioniMEMBER OF THE BOARD OF DIRECTORS
b. 1971, Master of Laws (LL.M.) 2.Staatsexamen/Assessor iuris. (Germany)
Jukka OhtolaMEMBER OF THE BOARD OF DIRECTORS
b. 1967, M.Sc. (Econ.), CEFA
Torsten SteenholtMEMBER OF THE BOARD OF DIRECTORS
b. 1969, M.Sc. (Pharmacy), M.Sc. (Chemical Research), Master Brewer
Prime Minister’s Office, Ministerial Adviser
Independent of the company. Holds an office with the Ownership Steering Department of the Prime Minister’s Office, Finland.
Member of the Board of Directors since 2018 Member of the HR Committee
Key positions of trust:
• Kemijoki Oy, member of the Board
• Motiva Oy, member of the Board
Chr. Hansen, EVP, Global Operations
Independent of the company and the shareholders
Member of the Board of Directors since 2017
Key positions of trust:
• CO-RO A/S, Member of the Board
Marimekko Corporation, General Counsel
Independent of the company and the shareholders
Member of the Board of Directors since 2017 Member of the Audit Committee
Key positions of trust:
• Business Practice of Helsinki Chamber of Commerce, Member
105BOARD REPORT
BUSINESS OVERVIEW
CORPORATERESPONSIBILITY
CORPORATE GOVERNANCE
FINANCIAL STATEMENTS
ANNUAL REPORT2018

Pekka TenniläCEO
b. 1969, M.Sc. (Business Management)
Janne HalttunenSVP, SCANDINAVIA
b. 1970, M.Sc. (Business Administration)
Kari KilpinenSVP, FINLAND & EXPORTS
b. 1963, MBA, Bachelor of Hospitality Management
Kirsi LehtolaSVP, HR
b. 1963, Master of Laws
Executive Management Team
Pekka Tennilä has been the Chief Executive Officer of Altia since 2014 and a member of the Executive Management Team since 2014. He joined Altia in 2014. Previously, he served as the Chief Executive Officer, Baltics at Carlsberg Group, and has also held other managerial positions at Carlsberg Group. He is a Board member of Finnish Food and Drink Industries' Federation (ETL) and a Board member of The Association of Finnish Advertisers.
Janne Halttunen has been the Senior Vice President, Scandinavia since 2017 and a member of the Executive Management Team since 2015. He joined Altia in 2009 as the Managing Director of Oy Wennerco Ab. Previously, he served as Altia’s Senior Vice President, Partner Business and Export; as the Director, Business Development; Managing Director, Partner Brands, as well as a member of the Board of Directors of Craft & Cask Ltd. In addition, he has held several managerial positions at British American Tobacco.
Kari Kilpinen has been the Senior Vice President, Finland & Exports since 2017 and a member of the Executive Management Team since 2017. He joined Altia in 1997 and has served as a Director of Altia Finland since 2009. He is a Board member of The Association of Finnish Alcoholic Beverage Suppliers (SAJK).
Kirsi Lehtola has been the Senior Vice President, HR since 2016 and a member of the Executive Management Team since 2016. She joined Altia in 2016. Previously, she served as HR Director, Insurance and Wealth Management at OP Financial Group as well as Head of HR, Group HR Services, and Senior Vice President, HR, Publication Paper and Finland at Stora Enso Oyj. She has also been a member in the Advisory Committee of Forest Industry Federation.
At year-end unless otherwise stated
106BOARD REPORT
BUSINESS OVERVIEW
CORPORATERESPONSIBILITY
CORPORATE GOVERNANCE
FINANCIAL STATEMENTS
ANNUAL REPORT2018
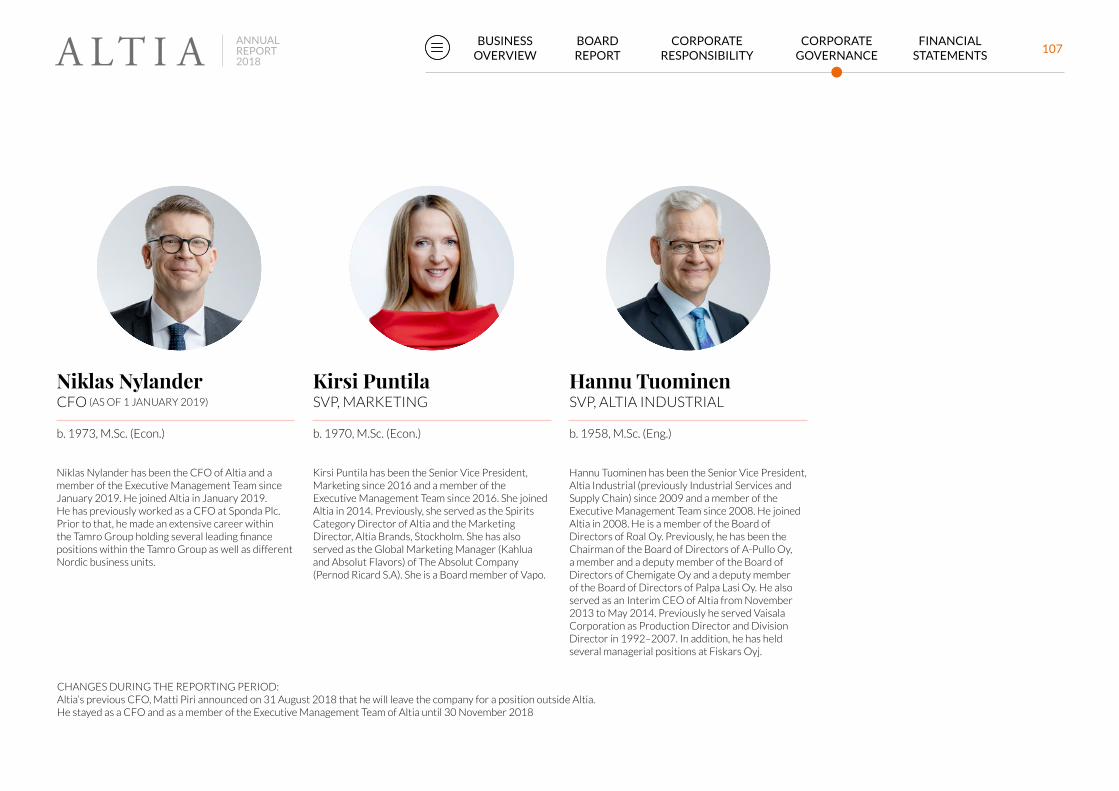
Niklas NylanderCFO (AS OF 1 JANUARY 2019)
b. 1973, M.Sc. (Econ.)
Kirsi PuntilaSVP, MARKETING
b. 1970, M.Sc. (Econ.)
Hannu TuominenSVP, ALTIA INDUSTRIAL
b. 1958, M.Sc. (Eng.)
Niklas Nylander has been the CFO of Altia and a member of the Executive Management Team since January 2019. He joined Altia in January 2019. He has previously worked as a CFO at Sponda Plc. Prior to that, he made an extensive career within the Tamro Group holding several leading finance positions within the Tamro Group as well as different Nordic business units.
Kirsi Puntila has been the Senior Vice President, Marketing since 2016 and a member of the Executive Management Team since 2016. She joined Altia in 2014. Previously, she served as the Spirits Category Director of Altia and the Marketing Director, Altia Brands, Stockholm. She has also served as the Global Marketing Manager (Kahlua and Absolut Flavors) of The Absolut Company (Pernod Ricard S.A). She is a Board member of Vapo.
Hannu Tuominen has been the Senior Vice President, Altia Industrial (previously Industrial Services and Supply Chain) since 2009 and a member of the Executive Management Team since 2008. He joined Altia in 2008. He is a member of the Board of Directors of Roal Oy. Previously, he has been the Chairman of the Board of Directors of A-Pullo Oy, a member and a deputy member of the Board of Directors of Chemigate Oy and a deputy member of the Board of Directors of Palpa Lasi Oy. He also served as an Interim CEO of Altia from November 2013 to May 2014. Previously he served Vaisala Corporation as Production Director and Division Director in 1992–2007. In addition, he has held several managerial positions at Fiskars Oyj.
CHANGES DURING THE REPORTING PERIOD: Altia’s previous CFO, Matti Piri announced on 31 August 2018 that he will leave the company for a position outside Altia. He stayed as a CFO and as a member of the Executive Management Team of Altia until 30 November 2018
107BOARD REPORT
BUSINESS OVERVIEW
CORPORATERESPONSIBILITY
CORPORATE GOVERNANCE
FINANCIAL STATEMENTS
ANNUAL REPORT2018

Financial Statements
108BOARD REPORT
BUSINESS OVERVIEW
CORPORATERESPONSIBILITY
CORPORATE GOVERNANCE
FINANCIAL STATEMENTS
ANNUAL REPORT2018
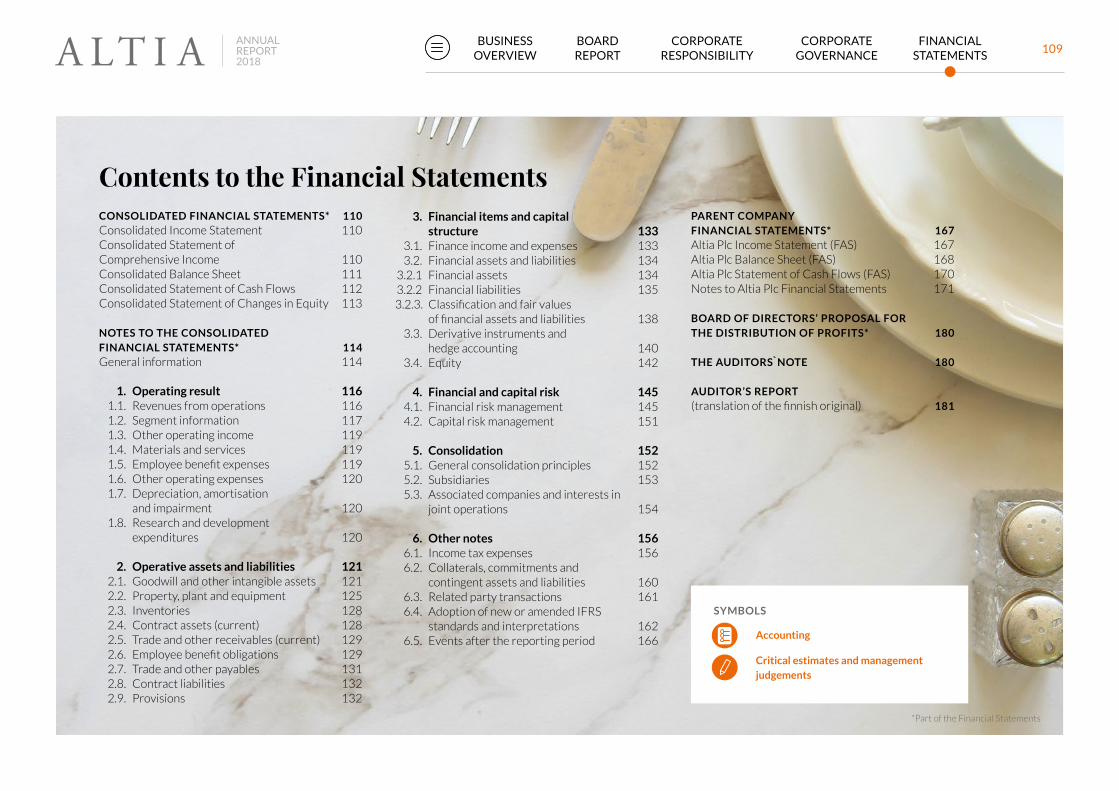
Contents to the Financial Statements
*Part of the Financial Statements
SYMBOLS
Accounting
Critical estimates and management judgements
CONSOLIDATED FINANCIAL STATEMENTS* 110Consolidated Income Statement 110Consolidated Statement of Comprehensive Income 110Consolidated Balance Sheet 111Consolidated Statement of Cash Flows 112Consolidated Statement of Changes in Equity 113
NOTES TO THE CONSOLIDATED FINANCIAL STATEMENTS* 114General information 114
1. Operating result 116 1.1. Revenues from operations 116 1.2. Segment information 117 1.3. Other operating income 119 1.4. Materials and services 119 1.5. Employee benefit expenses 119 1.6. Other operating expenses 120 1.7. Depreciation, amortisation and impairment 120 1.8. Research and development expenditures 120
2. Operative assets and liabilities 121 2.1. Goodwill and other intangible assets 121 2.2. Property, plant and equipment 125 2.3. Inventories 128 2.4. Contract assets (current) 128 2.5. Trade and other receivables (current) 129 2.6. Employee benefit obligations 129 2.7. Trade and other payables 131 2.8. Contract liabilities 132 2.9. Provisions 132
3. Financial items and capital structure 133 3.1. Finance income and expenses 133 3.2. Financial assets and liabilities 134 3.2.1 Financial assets 134 3.2.2 Financial liabilities 135 3.2.3. Classification and fair values of financial assets and liabilities 138 3.3. Derivative instruments and hedge accounting 140 3.4. Equity 142
4. Financial and capital risk 145 4.1. Financial risk management 145 4.2. Capital risk management 151
5. Consolidation 152 5.1. General consolidation principles 152 5.2. Subsidiaries 153 5.3. Associated companies and interests in joint operations 154
6. Other notes 156 6.1. Income tax expenses 156 6.2. Collaterals, commitments and contingent assets and liabilities 160 6.3. Related party transactions 161 6.4. Adoption of new or amended IFRS standards and interpretations 162 6.5. Events after the reporting period 166
PARENT COMPANY FINANCIAL STATEMENTS* 167Altia Plc Income Statement (FAS) 167Altia Plc Balance Sheet (FAS) 168Altia Plc Statement of Cash Flows (FAS) 170Notes to Altia Plc Financial Statements 171
BOARD OF DIRECTORS’ PROPOSAL FOR THE DISTRIBUTION OF PROFITS* 180
THE AUDITORS`NOTE 180
AUDITOR’S REPORT (translation of the finnish original) 181
109BOARD REPORT
BUSINESS OVERVIEW
CORPORATERESPONSIBILITY
CORPORATE GOVERNANCE
FINANCIAL STATEMENTS
ANNUAL REPORT2018

CONSOLIDATED INCOME STATEMENT
EUR million Note1 Jan–31 Dec
20181 Jan–31 Dec
2017NET SALES 1.1. 357.3 359.0
Other operating income 1.3. 7.4 8.3
Materials and services 1.4. -206.8 -202.0
Employee benefit expenses 1.5. -49.9 -52.0
Other operating expenses 1.6. -73.9 -72.9
Depreciation, amortisation and impairment 1.7. -14.4 -14.2
OPERATING RESULT 19.7 26.1
Finance income 3.1. 3.5 4.5
Finance expenses 3.1. -5.8 -6.4
Share of profit in associates and income from interests in joint operations
1.2 0.9
RESULT BEFORE TAXES 18.6 25.0
Income tax expense 6.1. -3.6 -6.7
RESULT FOR THE PERIOD 15.1 18.3
Result for the period attributable to:
Owners of the parent 15.1 18.3
Earnings per share for the result attributable to owners of the parent, EUR
Basic and diluted 3.4. 0.42 0.51
CONSOLIDATED STATEMENT OF COMPREHENSIVE INCOME
EUR million Note1 Jan–31 Dec
20181 Jan–31 Dec
2017Result for the period 15.1 18.3
OTHER COMPREHENSIVE INCOME
Items that will not be reclassified to profit or loss
Remeasurements of post-employment benefit obliga-tions
2.6. 0.0 -0.0
Related income tax 6.1. -0.0 0.0
Total -0.0 -0.0
Items that may be reclassified to profit or loss
Cash flow hedges 0.4 1.4
Available-for-sale financial assets - 0.6
Translation differences 3.4. -3.5 -4.0
Income tax related to these items 6.1. -0.1 -0.3
Total -3.2 -2.3
Other comprehensive income for the period, net of tax -3.2 -2.3
TOTAL COMPREHENSIVE INCOME FOR THE PERIOD 11.9 16.0
Total comprehensive income attributable to:
Owners of the parent 11.9 16.0
The notes are an integral part of the consolidated financial statements.
110BOARD REPORT
BUSINESS OVERVIEW
CORPORATERESPONSIBILITY
CORPORATE GOVERNANCE
FINANCIAL STATEMENTS
ANNUAL REPORT2018
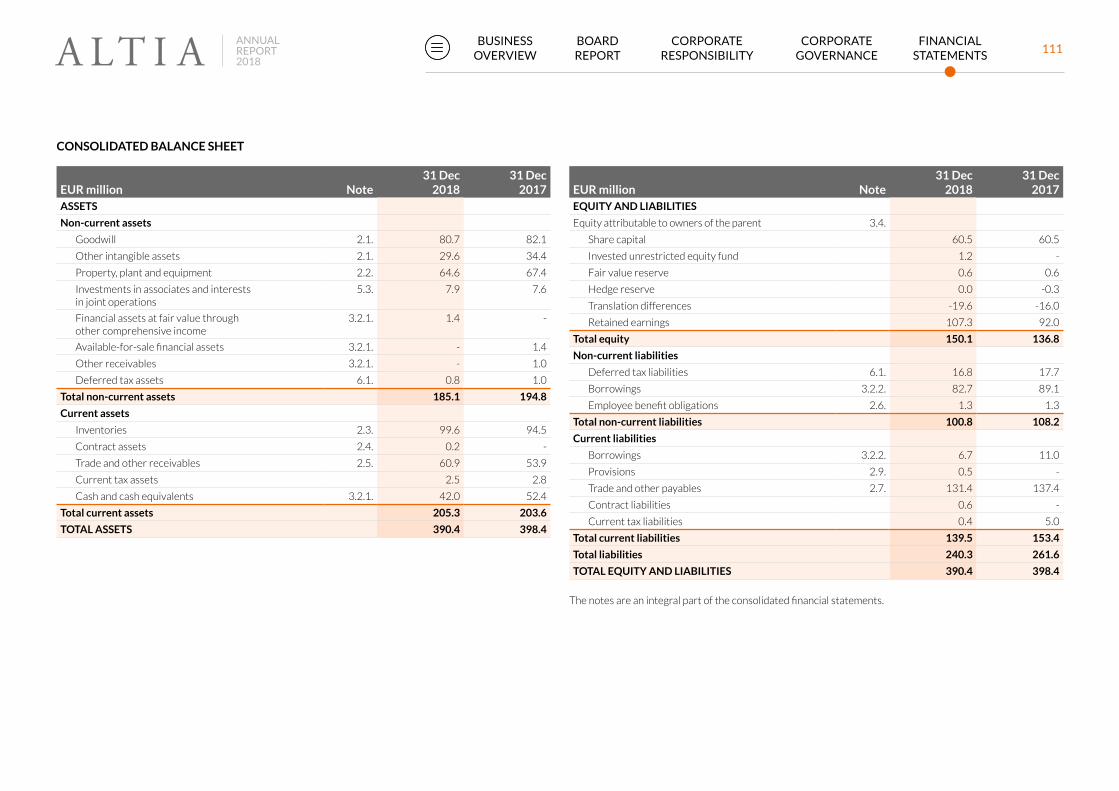
CONSOLIDATED BALANCE SHEET
EUR million Note31 Dec
201831 Dec
2017ASSETS
Non-current assets
Goodwill 2.1. 80.7 82.1
Other intangible assets 2.1. 29.6 34.4
Property, plant and equipment 2.2. 64.6 67.4
Investments in associates and interests in joint operations
5.3. 7.9 7.6
Financial assets at fair value through other comprehensive income
3.2.1. 1.4 -
Available-for-sale financial assets 3.2.1. - 1.4
Other receivables 3.2.1. - 1.0
Deferred tax assets 6.1. 0.8 1.0
Total non-current assets 185.1 194.8
Current assets
Inventories 2.3. 99.6 94.5
Contract assets 2.4. 0.2 -
Trade and other receivables 2.5. 60.9 53.9
Current tax assets 2.5 2.8
Cash and cash equivalents 3.2.1. 42.0 52.4
Total current assets 205.3 203.6
TOTAL ASSETS 390.4 398.4
EUR million Note31 Dec
201831 Dec
2017EQUITY AND LIABILITIES
Equity attributable to owners of the parent 3.4.
Share capital 60.5 60.5
Invested unrestricted equity fund 1.2 -
Fair value reserve 0.6 0.6
Hedge reserve 0.0 -0.3
Translation differences -19.6 -16.0
Retained earnings 107.3 92.0
Total equity 150.1 136.8
Non-current liabilities
Deferred tax liabilities 6.1. 16.8 17.7
Borrowings 3.2.2. 82.7 89.1
Employee benefit obligations 2.6. 1.3 1.3
Total non-current liabilities 100.8 108.2
Current liabilities
Borrowings 3.2.2. 6.7 11.0
Provisions 2.9. 0.5 -
Trade and other payables 2.7. 131.4 137.4
Contract liabilities 0.6 -
Current tax liabilities 0.4 5.0
Total current liabilities 139.5 153.4
Total liabilities 240.3 261.6
TOTAL EQUITY AND LIABILITIES 390.4 398.4
The notes are an integral part of the consolidated financial statements.
111BOARD REPORT
BUSINESS OVERVIEW
CORPORATERESPONSIBILITY
CORPORATE GOVERNANCE
FINANCIAL STATEMENTS
ANNUAL REPORT2018

CONSOLIDATED STATEMENT OF CASH FLOWS
EUR million Note1 Jan–31 Dec
20181 Jan–31 Dec
2017CASH FLOW FROM OPERATING ACTIVITIES
Result before taxes 18.6 25.0
Adjustments
Depreciation, amortisation and impairment 1.7. 14.4 14.2
Share of profit in associates and income from investments in joint operations
5.3. -1.2 -0.9
Net gain on sale of non-current assets 1.3. -0.5 -1.6
Finance income and costs 3.1. 2.3 1.9
Other adjustments 0.8 0.5
15.7 14.1
Change in working capital
Change in inventories, increase (-) / decrease (+) -5.5 1.2
Change in contract assets, trade and other receivables, increase (-) / decrease (+)
-7.4 9.4
Change in contract liabilities, trade and other payables, increase (+) / decrease (-)
-4.3 -2.6
Change in provisions, increase (+) / decrease (-) - -1.3
Change in working capital -17.2 6.7
Interest paid 3.1. -1.4 -1.7
Interest received 3.1. 0.1 0.3
Other finance income and expenses paid 3.1. -1.4 -2.2
Income taxes paid 6.1. -8.0 -4.6
Financial items and taxes -10.6 -8.2
NET CASH FLOW FROM OPERATING ACTIVITIES 6.5 37.6
EUR million Note1 Jan–31 Dec
20181 Jan–31 Dec
2017CASH FLOW FROM INVESTING ACTIVITIES
Payments for property, plant and equipment and intangible assets
2.1.,2.2. -7.7 -11.9
Proceeds from sale of property, plant and equipment and intangible assets
1.3. 0.6 2.6
Proceeds from sale of available-for-sale financial assets
- 0.0
Repayment of loan receivables 3.2. 0.9 0.3
Interest received from investments in joint operations 5.3. 0.9 0.9
Dividends received 3.1. 0.1 0.2
NET CASH FLOW FROM INVESTING ACTIVITIES -5.2 -7.8
CASH FLOW FROM FINANCING ACTIVITIES
Proceeds from borrowings 3.3.2. 20.0 100.0
Repayment of borrowings 3.3.2. -30.7 -72.5
Dividends paid and other distributions of profits 3.6. - -70.5
Share issue, personnel offering 1.2 -
NET CASH FLOW FROM FINANCING ACTIVITIES -9.5 -43.0
CHANGE IN CASH AND CASH EQUIVALENTS -8.2 -13.2
Cash and cash equivalents at the beginning of the period 52.4 68.0
Translation differences on cash and cash equivalents -2.2 -2.5
Change in cash and cash equivalents -8.2 -13.2
CASH AND CASH EQUIVALENTS AT THE END OF THE PERIOD
3.2.3. 42.0 52.4
The notes are an integral part of the consolidated financial statements.
112BOARD REPORT
BUSINESS OVERVIEW
CORPORATERESPONSIBILITY
CORPORATE GOVERNANCE
FINANCIAL STATEMENTS
ANNUAL REPORT2018

CONSOLIDATED STATEMENT OF CHANGES IN EQUITY
Equity attributable to owners of the parent
EUR million NoteShare
capital
Invested unrestricted
equity fundFair value
reserveHedge
reserveTranslation differences
Retained earnings
Total equity
Equity at 1 January 2017Total comprehensive income
60.5 - - -1.4 -12.3 144.5 191.3
Result for the period - - - - - 18.3 18.3
Other comprehensive income (net of tax)
Cash flow hedges - - - 1.1 - - 1.1
Available-for-sale financial assets 3.2.1. - - 0.6 - - - 0.6
Translation differences 3.4. - - - - -3.8 -0.2 -4.0
Remeasurements of post-employment benefit obligations 2.6. - - - - - -0.0 -0.0
Total comprehensive income for the period - - 0.6 1.1 -3.8 18.0 16.0
Transactions with owners
Dividend distribution - - - - - -70.5 -70.5
Total transactions with owners - - - - - -70.5 -70.5
EQUITY AT 31 DECEMBER 2017 60.5 - 0.6 -0.3 -16.0 92.0 136.8
Equity at 1 January 2018 60.5 - 0.6 -0.3 -16.0 92.0 136.8
Change in accounting principle - - - - - 0.1 0.1
Equity at 1 January 2018, restated 60.5 - 0.6 -0.3 -16.0 92.1 136.9
Total comprehensive income
Result for the period - - - - - 15.1 15.1
Other comprehensive income (net of tax)
Cash flow hedges - - - 0.3 - - 0.3
Translation differences 3.4. - - - - -3.5 0.0 -3.5
Remeasurements of post-employment benefit obligations 2.6. - - - - - -0.0 -0.0
Total comprehensive income for the period - - - 0.3 -3.5 15.1 11.9
Transactions with owners
Share issue - 1.2 - - - - 1.2
Share based payment, personnel offering - - - - - 0.1 0.1
Total transactions with owners - 1.2 - - - 0.1 1.4
EQUITY AT 31 DECEMBER 2018 60.5 1.2 0.6 0.0 -19.6 107.3 150.1
The notes are an integral part of the consolidated financial statements.
113BOARD REPORT
BUSINESS OVERVIEW
CORPORATERESPONSIBILITY
CORPORATE GOVERNANCE
FINANCIAL STATEMENTS
ANNUAL REPORT2018

Information on AltiaAltia Plc (the "Company") together with its' subsidiaries (the "Group", "Altia Group" or "Altia")
is an international alcoholic beverage service Group, which operates in the Nordic countries,
Estonia, Latvia and France producing, marketing, selling and distributing both own and partner
brands. Altia distils barley spirit from domestic barley for the basis of its beverages. The produc-
tion plants are located in Finland and Estonia, and aging and production of cognac in France. Altia
has high-quality brands of its own and international brands. In addition, the company represents
international brands from all over the world. Altia’s business also includes industrial products such
as starch and feed, technical ethanol and contract services.
Altia’s customers include alcohol retail monopolies, alcoholic beverage wholesale outlets, restau-
rants, grocery stores, travel trade and importers in the export markets.
Altia Plc, the parent company of Altia Group, is domiciled in Helsinki, Finland. Altia Plc is a Finnish
publicly listed company. Altia’s shares are listed in Nasdaq Helsinki Ltd. The registered address of
the Company is Kaapeliaukio 1, FI-00180 Helsinki, Finland. Copies of the consolidated financial
statements are available online at www.altiagroup.com or at the Group's headquarters at Kaape-
liaukio 1, FI-00180 Helsinki, Finland.
Altia Plc’s Board of Directors has approved these financial statements for publication in its meet-
ing on 6 February 2019. According to the Finnish Limited Liability Companies Act, shareholders
have the right to approve or reject the financial statements in the Annual General Meeting held
after the publication of the financial statements. The Annual General Meeting also has the right to
make a decision to amend the financial statements.
Notes to the consolidated financial statementsGENERAL INFORMATION
Basis of preparationThe consolidated financial statements for the year ended 31 December 2018 are prepared in
accordance with International Financial Reporting Standards (IFRSs) complying with the SIC and
IFRIC interpretations in force and approved by EU on 31 December 2018. Notes to the consoli-
dated financial statements also comply with the requirements of the Finnish Accounting Act and
Limited Liability Companies Act.
New and amended standards applied in 2018 and future periods are described in Note 6.4
(p. 162).
The consolidated financial statements for the year ended 31 December 2018 has been prepared
on a historical cost basis, except equity investments and derivatives. The consolidated financial
statements are presented in thousands of euros (Annual Reports in millions of euros). The figures
are rounded to the nearest thousand, and therefore the sum of individual figures may deviate
from the total presented. If the figure is EUR 0, it is shown as a hyphen.
114BOARD REPORT
BUSINESS OVERVIEW
CORPORATERESPONSIBILITY
CORPORATE GOVERNANCE
FINANCIAL STATEMENTS
ANNUAL REPORT2018

Refer to the table below to see which notes and accounting principles are related.
Nr. Note Accounting principle1. Operating result Revenue recognition, operating result
1.2. Segment information Operating segments
2.9. Provisions Provisions
2.6. Employee benefit obligations Employee benefits
2.2. Property, plant and equipment Property, plant and equipment
2.3. Inventories Inventories
1.6. Other operating expenses Leases
2.2. Property, plant and equipment
2.1. Goodwill and other intangible assets Goodwill
2.1. Goodwill and other intangible assets Intangible assets
3.2.1. Financial assets Financial assets
3.2.3. Financial assets and liabilities- classification and fair value
3.2.2. Financial liabilities Financial liabilities
3.2.3. Financial assets and liabilities- classification and fair value
3.3. Derivative instruments and hedge accounting Derivative contracts and hedge accounting
5.2. Subsidiaries Consolidation principles of subsidiaries
5.2. Subsidiaries Non-controlling interest and transactions with non-controlling interest
5.3. Investments in associates and interests in joint operations Associates and joint ventures
6.1. Income tax expense Income and deferred taxes
Accounting policies requiring management judgement and key sources of estimation uncertainty The preparation of financial statements requires the use of accounting estimates, which by defi-
nition, seldom equal the actual results. In addition, management makes judgements in applying
Altia’s accounting policies.
Estimates made in the preparation of the financial statements, and related assumptions, are based
on the management’s best knowledge at the reporting date. Consequently, the realised results
can differ from the estimates. Any changes in estimates and assumptions are recognised when
estimates and assumptions are corrected.
The Group’s most significant area in which the management has exercised judgement is related
to the revenue recognition (Note 1.1, p. 116) and impairment provision of trade receivables, and
useful lives of intangible assets and parameters used in impairment testing (Note 2.1., p. 121).
Other critical future assumptions and anticipated uncertainties at the reporting date, which pose
a significant risk of resulting in material changes in the carrying amounts of assets and liabilities
within the next financial year, are related to employee benefits (Note 2.6., p. 129) and deferred
taxes (Note 6.1., p. 156).
115BOARD REPORT
BUSINESS OVERVIEW
CORPORATERESPONSIBILITY
CORPORATE GOVERNANCE
FINANCIAL STATEMENTS
ANNUAL REPORT2018

1. Operating result1.1. REVENUES FROM OPERATIONS
Revenue recognitionThe revenue is recognised at an amount of consideration to which the Group expects to
be entitled in exchange for transferring promised goods or services to a customer. The
transaction price may include variable considerations such as volume discounts, bonus-
es, marketing support, product returns etc. The variable considerations are estimated
using the most likely value method if not yet realised in the end of reporting period. The
revenue is further adjusted with indirect sales taxes, excise taxes, deposit and recycling
fees and exchange rate differences relating to sales.
Typical contracts with customers include a sale of goods to a customer with only one
performance obligation. In contract services the contracts essentially include of a single
performance obligation, being a series of distinct services such as contract manufactur-
ing, customer services and logistics. The revenue recognition occurs at a point in time,
when the control of the goods is transferred to the customer according to the delivery
terms. Revenue from the sale of services is recognised at the time of delivery of services.
The most significant revenue flows are generated by the sale of own products and partner
brands. In addition, revenues are generated by contract manufacturing, as well as the sale
of industrial products, such as starch, feed and technical ethanol. Adjustments to sales and
obligations to repurchase certain products are taken into account in the revenue recognition
phase.
In partner supplier agreements, which entitle Group to distribute partners’ products, Altia
acts as a principal towards the end customer having control over the product, discretion in
establishing prices and owning the inventory. Accordingly, revenue recognised is the gross
amount to which Altia is entitled to in these product sales.
357.3 MEUR
Net sales
116BOARD REPORT
BUSINESS OVERVIEW
CORPORATERESPONSIBILITY
CORPORATE GOVERNANCE
FINANCIAL STATEMENTS
ANNUAL REPORT2018
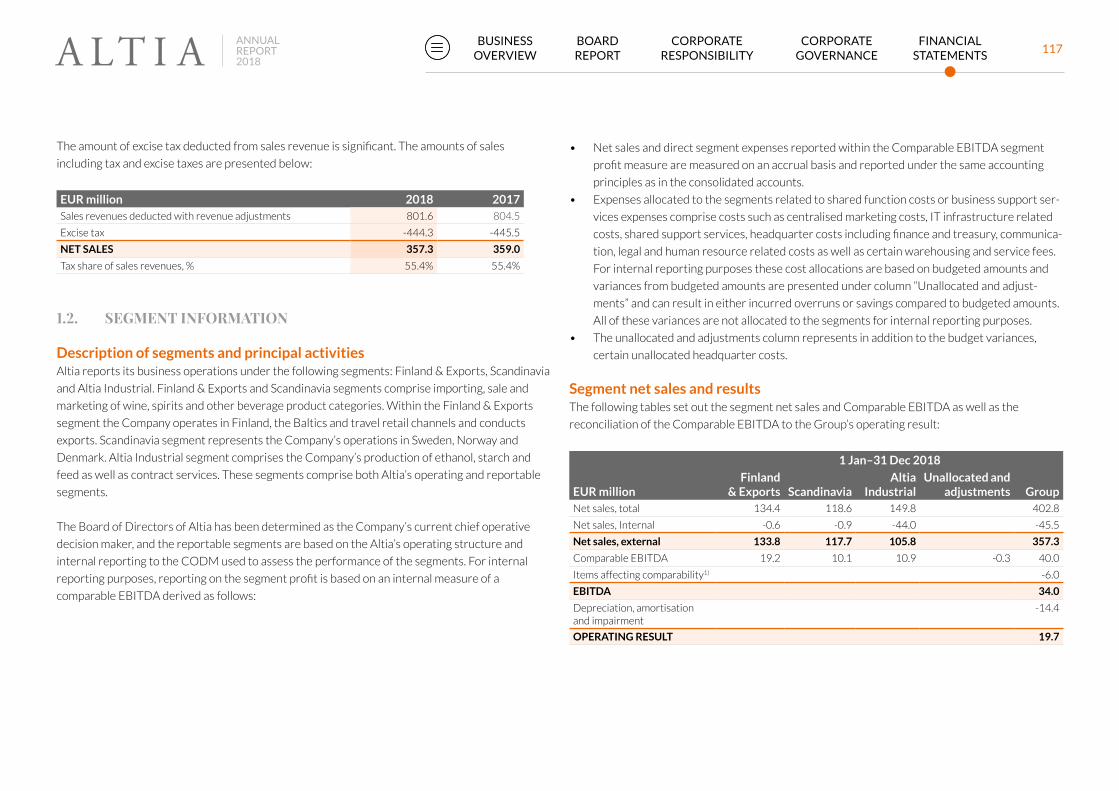
1.2. SEGMENT INFORMATION
Description of segments and principal activitiesAltia reports its business operations under the following segments: Finland & Exports, Scandinavia
and Altia Industrial. Finland & Exports and Scandinavia segments comprise importing, sale and
marketing of wine, spirits and other beverage product categories. Within the Finland & Exports
segment the Company operates in Finland, the Baltics and travel retail channels and conducts
exports. Scandinavia segment represents the Company’s operations in Sweden, Norway and
Denmark. Altia Industrial segment comprises the Company’s production of ethanol, starch and
feed as well as contract services. These segments comprise both Altia’s operating and reportable
segments.
The Board of Directors of Altia has been determined as the Company’s current chief operative
decision maker, and the reportable segments are based on the Altia’s operating structure and
internal reporting to the CODM used to assess the performance of the segments. For internal
reporting purposes, reporting on the segment profit is based on an internal measure of a
comparable EBITDA derived as follows:
The amount of excise tax deducted from sales revenue is significant. The amounts of sales
including tax and excise taxes are presented below:
EUR million 2018 2017Sales revenues deducted with revenue adjustments 801.6 804.5
Excise tax -444.3 -445.5
NET SALES 357.3 359.0
Tax share of sales revenues, % 55.4% 55.4%
• Net sales and direct segment expenses reported within the Comparable EBITDA segment
profit measure are measured on an accrual basis and reported under the same accounting
principles as in the consolidated accounts.
• Expenses allocated to the segments related to shared function costs or business support ser-
vices expenses comprise costs such as centralised marketing costs, IT infrastructure related
costs, shared support services, headquarter costs including finance and treasury, communica-
tion, legal and human resource related costs as well as certain warehousing and service fees.
For internal reporting purposes these cost allocations are based on budgeted amounts and
variances from budgeted amounts are presented under column “Unallocated and adjust-
ments” and can result in either incurred overruns or savings compared to budgeted amounts.
All of these variances are not allocated to the segments for internal reporting purposes.
• The unallocated and adjustments column represents in addition to the budget variances,
certain unallocated headquarter costs.
Segment net sales and results The following tables set out the segment net sales and Comparable EBITDA as well as the
reconciliation of the Comparable EBITDA to the Group’s operating result:
1 Jan–31 Dec 2018
EUR millionFinland
& Exports ScandinaviaAltia
IndustrialUnallocated and
adjustments GroupNet sales, total 134.4 118.6 149.8 402.8
Net sales, Internal -0.6 -0.9 -44.0 -45.5
Net sales, external 133.8 117.7 105.8 357.3
Comparable EBITDA 19.2 10.1 10.9 -0.3 40.0
Items affecting comparability1) -6.0
EBITDA 34.0
Depreciation, amortisation and impairment
-14.4
OPERATING RESULT 19.7
117BOARD REPORT
BUSINESS OVERVIEW
CORPORATERESPONSIBILITY
CORPORATE GOVERNANCE
FINANCIAL STATEMENTS
ANNUAL REPORT2018
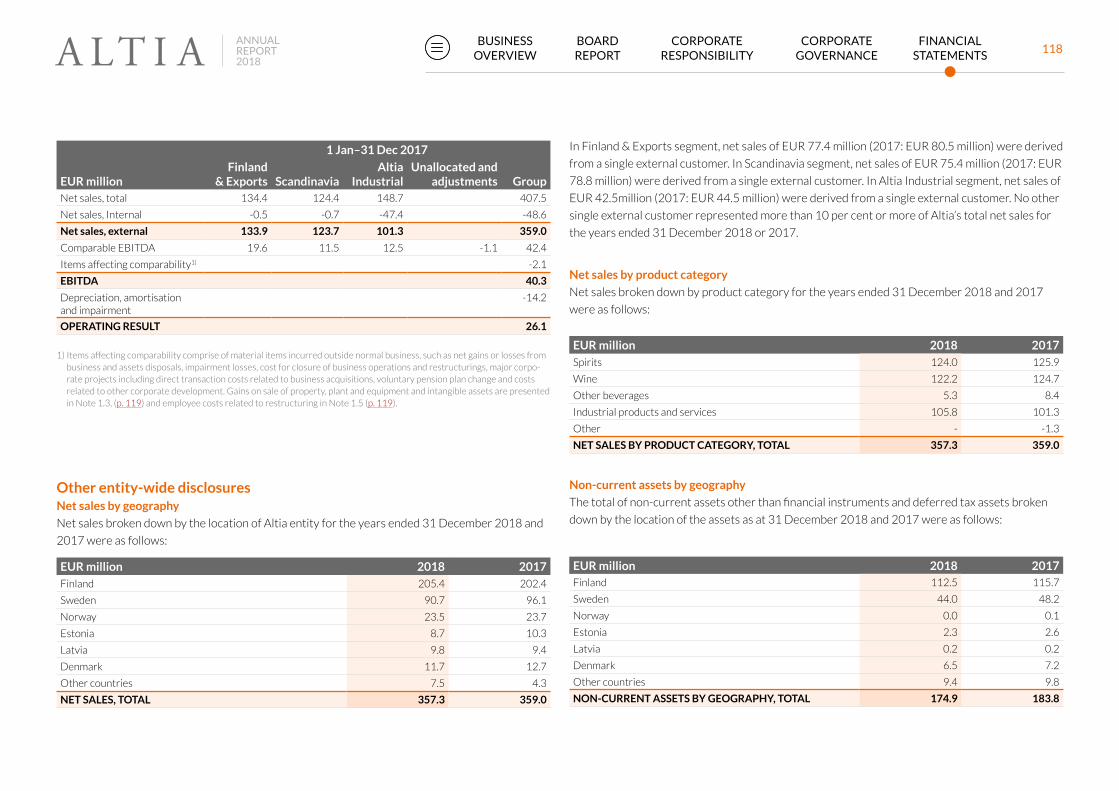
1 Jan–31 Dec 2017
EUR millionFinland
& Exports ScandinaviaAltia
IndustrialUnallocated and
adjustments GroupNet sales, total 134.4 124.4 148.7 407.5
Net sales, Internal -0.5 -0.7 -47.4 -48.6
Net sales, external 133.9 123.7 101.3 359.0
Comparable EBITDA 19.6 11.5 12.5 -1.1 42.4
Items affecting comparability1) -2.1
EBITDA 40.3
Depreciation, amortisation and impairment
-14.2
OPERATING RESULT 26.1
1) Items affecting comparability comprise of material items incurred outside normal business, such as net gains or losses from business and assets disposals, impairment losses, cost for closure of business operations and restructurings, major corpo-rate projects including direct transaction costs related to business acquisitions, voluntary pension plan change and costs related to other corporate development. Gains on sale of property, plant and equipment and intangible assets are presented in Note 1.3, (p. 119) and employee costs related to restructuring in Note 1.5 (p. 119).
Other entity-wide disclosuresNet sales by geography
Net sales broken down by the location of Altia entity for the years ended 31 December 2018 and
2017 were as follows:
EUR million 2018 2017Finland 205.4 202.4
Sweden 90.7 96.1
Norway 23.5 23.7
Estonia 8.7 10.3
Latvia 9.8 9.4
Denmark 11.7 12.7
Other countries 7.5 4.3
NET SALES, TOTAL 357.3 359.0
In Finland & Exports segment, net sales of EUR 77.4 million (2017: EUR 80.5 million) were derived
from a single external customer. In Scandinavia segment, net sales of EUR 75.4 million (2017: EUR
78.8 million) were derived from a single external customer. In Altia Industrial segment, net sales of
EUR 42.5million (2017: EUR 44.5 million) were derived from a single external customer. No other
single external customer represented more than 10 per cent or more of Altia’s total net sales for
the years ended 31 December 2018 or 2017.
Net sales by product category
Net sales broken down by product category for the years ended 31 December 2018 and 2017
were as follows:
EUR million 2018 2017Spirits 124.0 125.9
Wine 122.2 124.7
Other beverages 5.3 8.4
Industrial products and services 105.8 101.3
Other - -1.3
NET SALES BY PRODUCT CATEGORY, TOTAL 357.3 359.0
Non-current assets by geography
The total of non-current assets other than financial instruments and deferred tax assets broken
down by the location of the assets as at 31 December 2018 and 2017 were as follows:
EUR million 2018 2017Finland 112.5 115.7
Sweden 44.0 48.2
Norway 0.0 0.1
Estonia 2.3 2.6
Latvia 0.2 0.2
Denmark 6.5 7.2
Other countries 9.4 9.8
NON-CURRENT ASSETS BY GEOGRAPHY, TOTAL 174.9 183.8
118BOARD REPORT
BUSINESS OVERVIEW
CORPORATERESPONSIBILITY
CORPORATE GOVERNANCE
FINANCIAL STATEMENTS
ANNUAL REPORT2018

1.3. OTHER OPERATING INCOME
Other operating income mainly includes gains on the disposal of non-current assets, income from
sale of energy, water, steam and carbon dioxide, rental income and related non-core business
service income and contract termination fees.
EUR million 2018 2017Gains on sale of property, plant and equipment and intangible assets
0.5 1.6
Gains on sale of emission allowances 0.4 -
Rental income 1.4 1.0
Income from sale of energy, water, steam and carbon dioxide 3.4 3.4
Other income 1.6 2.3
TOTAL 7.4 8.3
1.4. MATERIALS AND SERVICES
EUR million 2018 2017Raw materials, consumables and goods
Purchases during the period 210.1 196.6
Change in inventories -5.1 1.9
Scrapping and obsolescence 0.0 2.0
External services 1.8 1.6
TOTAL 206.8 202.0
Materials and services consist of cost of material, such as barley, wine, different spirit, liquids,
ground water as well as other ingredients needed for a variety of different drinks, packaging
materials, production costs, changes in inventories, scrapping and obsolescence costs and external
services such as logistics and warehousing.
1.5. EMPLOYEE BENEFIT EXPENSES
EUR million 2018 2017Wages and salaries 37.9 40.4
Pension expenses
Defined contribution plans 7.1 5.9
Other social expenses 4.9 5.8
TOTAL 49.9 52.0
In Altia, the total wages and salaries of personnel consists of fixed and variable pay, allowances,
short and long-term incentives and fringe benefits.
The Group has recognised the total amount of incentives EUR 1.6 million (2017: EUR 3.3 million)
in the form of cash bonuses. Employee benefit expenses include personnel related restructuring
costs of EUR 1.0 million (2017: EUR 1.1 million). The group has recognised the total amount of
EUR 0.7 million (2017: -) of closed voluntary pension scheme.
Average number of personnel during the period 2018 2017Workers 274 294
Clerical employees 444 468
TOTAL 718 762
More information on the Group’s pension plans is presented in Note 2.6 (p. 129).
Information of management remuneration is presented in Note 6.3. (p. 161) related party
transactions.
119BOARD REPORT
BUSINESS OVERVIEW
CORPORATERESPONSIBILITY
CORPORATE GOVERNANCE
FINANCIAL STATEMENTS
ANNUAL REPORT2018

1.6. OTHER OPERATING EXPENSES
EUR million 2018 2017Losses on sales and disposals of property, plant and equipment and intangible assets
0.2 0.2
Rental expenses 5.7 6.0
Marketing expenses 13.7 15.1
Travel and representation expenses 3.0 2.8
Outsourcing services 10.5 8.9
Repair and maintenance expenses 6.9 6.8
Energy expenses 7.4 7.2
IT expenses 6.9 6.5
Variable sales expenses 12.6 11.3
Other expenses 7.1 8.1
TOTAL 73.9 72.9
Auditor's fees included in other operating expenses 2018 2017Audit fees 0.3 0.3
Tax consultation 0.0 0.0
Other fees 0.5 0.4
TOTAL 0.8 0.7
The table above presents fees to PricewaterhouseCoopers globally during the year. Non-audit
fees to PricewaterhouseCoopers Oy in 2018 amounted to EUR 0.6 million, of which major part
relating to the IPO in spring 2018.
Rental expenses include leases treated as operating lease, when the lessor retains the risks and
rewards of ownership for the leased asset. Payments made under operating lease are recognised
as expenses on a straight-line basis over the lease term. Altia leases office space, cars and forklifts
under operating lease.
1.7. DEPRECIATION, AMORTISATION AND IMPAIRMENT
Depreciation and amortisation by asset categories is as follows:
EUR million 2018 2017Amortisation on intangible assets
Trademarks 4.3 4.4
Software and other intangible assets 1.5 1.1
Total amortisation 5.8 5.5
Depreciation on property, plant and equipment
Buildings 3.3 3.2
Machinery and equipment 5.0 5.2
Machinery and equipment, acquired through finance leases 0.2 0.3
Other tangible assets 0.0 0.0
Total depreciation 8.6 8.7
TOTAL DEPRECIATION AND AMORTISATION 14.4 14.2
Group’s depreciation and amortisation methods and periods are described in Note 2.1. (p. 121)
Goodwill and other intangible assets and in Note 2.2. (p. 125) Property, plant and equipment.
1.8. RESEARCH AND DEVELOPMENT EXPENDITURES
Operating result includes research and development expenditures amounting to EUR 3.3 million
(2017: EUR 3.4 million). The R&D expenditures represents 0.9% of net sales in 2018
(2017: 0.9%).
120BOARD REPORT
BUSINESS OVERVIEW
CORPORATERESPONSIBILITY
CORPORATE GOVERNANCE
FINANCIAL STATEMENTS
ANNUAL REPORT2018

2. Operative assets and liabilities2.1. GOODWILL AND OTHER INTANGIBLE ASSETS
Intangible assets other than goodwill are recorded at historical costs and depreciated
over their useful lives. Intangible assets include goodwill, trademarks, software and
other intangible assets and prepayments.
GoodwillGoodwill arising on the business acquisition is recognised as the excess of the aggre-
gate of the consideration transferred, the amount of non-controlling interests and any
previously held equity interest in the acquiree, over the fair value of the net assets
acquired. Goodwill is measured at cost less accumulated impairment losses. Goodwill is
not amortised but is tested annually for impairment.
For the purpose of impairment testing, goodwill is allocated to the groups of cash-gen-
erating units (CGU) that are expected to benefit from the business combinations in
which the goodwill was generated. Impairment testing is described in more detail later in
this note.
Other intangible assets Other intangible assets include intangible rights, other intangible assets and prepay-
ments for intangible assets. Intangible assets such as patents and IT-software, with
finite useful lives, are recognised in the balance sheet at the original acquisition cost less
accumulated amortisation and possible impairment.
Altia's trademarks have been acquired in connection with business acquisitions and rec-
ognised originally at fair value and are subsequently amortised on a straight-line basis
over the estimated useful lives.
99.6 MEUR
Inventories
121BOARD REPORT
BUSINESS OVERVIEW
CORPORATERESPONSIBILITY
CORPORATE GOVERNANCE
FINANCIAL STATEMENTS
ANNUAL REPORT2018

The estimated useful lives of intangible assets are as follows:
Trademarks 10–15 years
IT-development and software 3–5 years
The costs related to the intangible assets are capitalised if it can be demonstrated that the
asset will generate the future economic benefits, the entity controls the asset and the cost
of the asset can be measured reliably. All other expenditure is recognised as an expense as
incurred.
Expenditure on research activities is recognised in profit or loss in the period in which it is
incurred. The Group has no projects related to the development activities of new products
or processes qualifying for the identifiability and other criteria regarding capitalisation
under IFRS.
Accounting for emission allowances is described in Note 6.2. (p. 160). Emission allowances
are presented as off-balance sheet items.
Critical estimates and management judgements – Useful lives of trademarksAltia’s trademarks have been acquired in connection with business acquisitions and recog-
nised originally at fair value and are subsequently amortised on a straight-line basis over the
estimated useful lives. Management has estimated the useful lives of trademarks to be in a
range from 10 to 15 years. However, the actual useful life may be shorter or longer than the
estimated range depending on the market trends and customer behavior.
GOODWILL AND OTHER INTANGIBLE ASSETS
EUR million Goodwill TrademarksSoftware and other
intangible assets PrepaymentsOther intangible
assets totalAcquisition cost at 1 January 2018 133.3 126.7 19.3 2.8 148.7
Additions - - 0.0 1.5 1.5
Disposals - - -0.0 - -0.0
Effect of movement in exchange rates -5.3 -2.9 -0.0 - -2.9
Transfers between items - 0.1 2.5 -2.6 0.0
Acquisition cost at 31 December 2018 128.0 123.8 21.8 1.7 147.3
Accumulated amortisation and impairment losses at 1 January 2018 -51.3 -99.3 -15.1 - -114.4
Amortisation - -4.3 -1.5 - -5.8
Accumulated amortisation on disposals and transfers - - 0.0 - 0.0
Effect of movement in exchange rates 4.0 2.4 0.0 - 2.4
Accumulated amortisation and impairment losses at 31 December 2018 -47.3 -101.2 -16.5 - -117.8
Carrying amount at 1 January 2018 82.1 27.4 4.2 2.8 34.4
CARRYING AMOUNT AT 31 DECEMBER 2018 80.7 22.6 5.3 1.7 29.6
122BOARD REPORT
BUSINESS OVERVIEW
CORPORATERESPONSIBILITY
CORPORATE GOVERNANCE
FINANCIAL STATEMENTS
ANNUAL REPORT2018

EUR million Goodwill TrademarksSoftware and other
intangible assets PrepaymentsOther intangible
assets totalAcquisition cost at 1 January 2017 144.7 129.9 18.8 1.7 150.4
Additions - - - 3.8 3.8
Disposals - - -2.2 - -2.2
Effect of movement in exchange rates -11.4 -3.2 -0.0 - -3.3
Transfers between items - - 2.7 -2.7 -0.0
Acquisition cost at 31 December 2017 133.3 126.7 19.3 2.8 148.7
Accumulated amortisation and impairment losses at 1 January 2017 -61.6 -97.7 -16.0 - -113.7
Amortisation - -4.4 -1.1 - -5.5
Accumulated amortisation on disposals and transfers - - 2.0 - 2.0
Effect of movement in exchange rates 10.4 2.8 0.0 - 2.9
Accumulated amortisation and impairment losses at 31 December 2017 -51.3 -99.3 -15.1 - -114.4
Carrying amount at 1 January 2017 83.1 32.2 2.9 1.7 36.7
CARRYING AMOUNT AT 31 DECEMBER 2017 82.1 27.4 4.2 2.8 34.4
The most significant trademarks include Renault, Larsen, Xanté, Blossa, Chill Out, Explorer,
Grönstedts, Bröndums, 1-Enkelt and Arsenitch. Software and other intangible assets are mainly
computer software.
123BOARD REPORT
BUSINESS OVERVIEW
CORPORATERESPONSIBILITY
CORPORATE GOVERNANCE
FINANCIAL STATEMENTS
ANNUAL REPORT2018

Impairment testingBook value of assets are assessed to determine whether there is any impairment at least at
the end of each financial year. If any evidence of impairment emerges (a triggering event), the
assets’ recoverable amount is estimated. The recoverable amount is determined on the basis
of value in use. An impairment loss is recognised if the carrying amount of an asset exceeds its
recoverable amount. The impairment loss is immediately recognised in profit or loss and the
estimated useful life of the asset in question is reassessed when an impairment loss is recog-
nised. The recoverable amounts of goodwill and intangible assets not yet available for use are
estimated annually. The need for recognising an impairment loss is assessed at cash-generat-
ing unit level. This level is essentially independent from other units with separate cash flows.
The impairment loss is reversed if there has been such a positive change in the estimates used
to determine the recoverable amount of the asset or cash-generating unit that recoverable
amount of the asset will increase the book value of asset. Impairment losses are only reversed
to the extent that the asset’s carrying amount does not exceed the carrying amount that
would have been determined if no impairment loss had been recognised. An impairment loss
on goodwill is never reversed.
Critical estimates and management judgements – Impairment testing:The preparation of calculations for the impairment testing of goodwill requires estimates re-
garding the future. The management’s estimates and related critical uncertainties are related
to the components of the recoverable amount calculation, including the discount rate, the ter-
minal growth rate and development of the net sales and operating result, including estimated
cost levels of main raw materials and energy. The discount rates reflect current assessments
of the time value of money and relevant market risk premiums reflecting risks and uncertain-
ties for which the future cash flow estimates have not been adjusted. The discount rates used,
expected net sales growth rates and profitability levels, including sensitivity analyses, are
stated below.
Impairment testing of goodwillAllocation of goodwill
Goodwill is allocated to groups of cash-generating units (CGU) that represent the level on which
the management monitors the goodwill.
Altia reports its business operations under the following segments: Finland & Exports, Scandinavia
and Altia Industrial. Finland & Exports and Scandinavia segments comprise importing, sale and
marketing of wine, spirits and other beverage product categories. Within the Finland & Exports
segment the Company operates in Finland, the Baltics and travel retail channels and conducts
exports. Scandinavia segment represents the Company’s operations in Sweden, Norway and
Denmark. Altia Industrial segment comprises the Company’s production of ethanol, starch and
feed as well as contract services. These segments comprise both Altia’s operating and reportable
segments. Goodwill is monitored by management at the level of the operating segments.
A segment-level allocation of the goodwill at 31 December 2018 and 2017 is presented below:
EUR million 2018 % 2017 %Finland & Exports 46.8 58.0% 46.5 56.6%
Scandinavia 33.9 42.0% 35.6 43.4%
TOTAL 80.7 100.0% 82.1 100.0%
124BOARD REPORT
BUSINESS OVERVIEW
CORPORATERESPONSIBILITY
CORPORATE GOVERNANCE
FINANCIAL STATEMENTS
ANNUAL REPORT2018

Impairment testing
The key assumptions in impairment testing are operating result and discount rate.
The goodwill allocated to the Group’s cash-generating units is tested for impairment annually or
when there is reason to assume that the carrying amount has exceeded the recoverable amount,
with the carrying amount compared to the recoverable amount in the testing. The annual impair-
ment tests have been carried out on 31 October 2018 and 31 October 2017. At the time of test-
ing, the companies did not have intangible assets with indefinite useful lives other than goodwill.
The cash flow estimates used are based on CGU-specific financial plans for the following year
approved by the Group’s management. The forecast period applied for the calculations covers five
years, beyond which the cash flow projections are extrapolated using a constant market-specific
growth rate estimate. The forecasted cash flows for a longer term than this have been estimated
by using an annual growth rate estimate of 1.0%. In the view of the management, these growth
estimates represent the development of business operations in the longer term pursuant to the
forecasts.
The market-specific WACC estimates are based on external market-specific references. Manage-
ment makes judgements regarding the development of assumptions other than WACC based on
internal and external views of the industry’s history and future.
The weighted average costs of capital used as discount rates for the cash flow estimates are pre-
sented in the enclosed table:
Used pre-tax discount rate % 2018 2017Finland & Exports 7.1% 7.0%
Scandinavia 6.8% 6.8%
2.2. PROPERTY, PLANT AND EQUIPMENT
Property, plant and equipmentProperty, plant and equipment mainly consist of manufacturing and warehouse buildings,
land, and machinery and equipment used in alcoholic beverage industry. Property, plant
and equipment are measured at historical cost less accumulated depreciation and possible
impairment losses. If parts of an item of property, plant and equipment have different useful
lives, they are accounted for as separate items. The subsequent costs related to the items
of property, plant and equipment are capitalised only if the future economic benefits exceed
the originally assessed standard of performance. All other expenditure, for example ordinary
maintenance and repair costs, is recognised as an expense as incurred. Depreciation is rec-
ognised on a straight-line basis over the estimated useful lives of items of property, plant and
equipment. Land is not depreciated.
Government grants, for example grants received from the State, are recognised in profit or
loss in the same period in which the related expenses are recognised. Grants that compensate
the Group for the acquisition of property, plant and equipment are deducted from the carry-
ing amount adjusted with the grant received.
The estimated average operating margins used in the calculations are presented in the
enclosed table:
Projected average operating result % 2018 2017Finland & Exports 13.1% 14.5%
Scandinavia 8.7% 9.3%
Based on the analyses prepared by the company, no reasonably possible change in any of the key
assumptions would cause any of the tested unit's recoverable amount to decrease to be equal to
its carrying amount.
125BOARD REPORT
BUSINESS OVERVIEW
CORPORATERESPONSIBILITY
CORPORATE GOVERNANCE
FINANCIAL STATEMENTS
ANNUAL REPORT2018

Investment properties are properties held by the Group in order to earn rental income or for
capital appreciation. Investment properties are measured at cost less accumulated deprecia-
tion and impairment losses. Fair values of investment properties are determined based on a
valuation carried out by an external property valuator.
The estimated useful lives of property, plant and equipment are as follows:
Buildings and structures 10–40 years
Machinery and equipment 10 years
Other tangible assets 3–10 years
The estimated useful lives and residual values are reviewed at each financial year-end, and if
they differ substantially from the previous estimates, the depreciation periods are adjusted
accordingly. Impairment loss is recognised in profit or loss to the extent the assets carrying
value exceeds its recoverable amount.
Gains and losses on the disposals of property, plant and equipment are included in other
operating income or expenses.
Financial leasingLease contracts of property, plant and equipment, in which Altia assumes substantially all
the risks and rewards of ownership are classified as finance leases. Altia leases laptops and
copying machines under finance leases. An asset leased through a finance lease is recognised
in property, plant and equipment based on its nature and measured at the lower of its fair
value and present value of the minimum lease payments at the inception of the lease term.
The respective finance lease liabilities, less finance charges, are included in other non-current
borrowings.
An asset acquired through a finance lease is depreciated over the shorter of the asset´s useful
life and the lease term.
126BOARD REPORT
BUSINESS OVERVIEW
CORPORATERESPONSIBILITY
CORPORATE GOVERNANCE
FINANCIAL STATEMENTS
ANNUAL REPORT2018

PROPERTY, PLANT AND EQUIPMENT
EUR millionLand and water
areasBuildings and
structuresMachinery and
equipmentOther tangible
assets
Prepayments and assets under
construction TotalAcquisition cost at 1 January 2018 3.0 108.2 124.0 0.8 4.7 240.7
Additions - 0.1 0.7 0.0 5.4 6.2
Disposals -0.0 -0.5 -1.6 - - -2.1
Effect of movement in exchange rates - -0.0 -0.2 -0.0 - -0.3
Transfers between items - 1.7 6.9 - -8.6 0.0
Acquisition cost at 31 December 2018 3.0 109.5 129.8 0.8 1.5 244.6
Accumulated depreciation and impairment losses at 1 January 2018 0.0 -79.5 -93.7 -0.1 - -173.3
Depreciation - -3.3 -5.3 -0.0 - -8.6
Accumulated depreciation on disposals and transfers - 0.5 1.4 - - 1.9
Effect of movement in exchange rates - 0.0 0.1 - - 0.2
Accumulated depreciation and impairment losses at 31 December 2018 0.0 -82.4 -97.4 -0.2 - -179.9
Carrying amount at 1 January 2018 3.0 28.7 30.3 0.6 4.7 67.4
CARRYING AMOUNT AT 31 DECEMBER 2018 3.0 27.1 32.4 0.6 1.5 64.6
Acquisition cost at 1 January 2017 4.8 116.4 120.9 0.8 2.5 245.4
Additions - 0.0 0.6 - 7.4 8.1
Disposals -1.8 -10.4 -0.3 - - -12.5
Effect of movement in exchange rates -0.0 -0.0 -0.2 0.0 -0.0 -0.3
Transfers between items - 2.2 3.1 - -5.2 0.0
Acquisition cost at 31 December 2017 3.0 108.2 124.0 0.8 4.7 240.7
Accumulated depreciation and impairment losses at 1 January 2017 -1.8 -84.7 -88.8 -0.1 - -175.4
Depreciation - -3.2 -5.5 -0.0 - -8.7
Accumulated depreciation on disposals and transfers 1.8 8.4 0.4 - - 10.5
Effect of movement in exchange rates 0.0 0.0 0.2 - - 0.2
Accumulated depreciation and impairment losses at 31 December 2017 0.0 -79.5 -93.7 -0.1 - -173.3
Carrying amount at 1 January 2017 3.0 31.8 32.1 0.6 2.5 70.0
CARRYING AMOUNT AT 31 DECEMBER 2017 3.0 28.7 30.3 0.6 4.7 67.4
Land and water areas includes investment properties with book value of EUR 0.0 million in 2018
(2017: EUR 0.0 million). Investment properties are measured based on the cost model. At 31 De-
cember 2018 the fair value of investment properties was EUR 2.8 million (2017: EUR 2.8 million).
127BOARD REPORT
BUSINESS OVERVIEW
CORPORATERESPONSIBILITY
CORPORATE GOVERNANCE
FINANCIAL STATEMENTS
ANNUAL REPORT2018

2.3. INVENTORIES
InventoriesInventories are measured at the lower of cost and net realisable value. Self-manufactured
products are measured at standard prices, except cognac products, which are measured at
weighted average cost. Fixed production costs are allocated to the cost of own production.
Raw materials, supplies and trading goods are measured at weighted average cost. Semi-fin-
ished products are measured at weighted average cost, except semi-finished products
produced in Estonia, which are measured at standard prices. Repacked trading goods are
measured at standard cost in repacking plant.
The cost of finished products and work in progress includes raw materials, direct labour costs,
other direct costs as well as an allocable proportion of variable procurement and production
costs and fixed overheads in case of finished products, determined based on normal operating
capacity.
Net realisable value is the estimated selling price in the ordinary course of business, less the
estimated costs of completion and the estimated costs necessary to make the sale.
INVENTORIES
EUR million 2018 2017Materials and supplies 53.8 50.1
Work in progress 10.5 12.7
Finished goods 15.9 13.8
Goods 19.3 17.9
Advance payments 0.2 0.1
TOTAL 99.6 94.5
Altia recognised write-downs of inventories amounting to EUR 1.3 million in 2018
(2017: EUR 1.8 million).
2.4. CONTRACT ASSETS (CURRENT)
Contract assets represent the amount which Altia has right to receive goods expected to be
returned to inventory with respect to return clauses in the contracts. Contract assets are
measured at the former carrying amount of the inventory less any expected costs to recover
the goods and less any impairment losses.
EUR million 2018 2017Contract assets 0.2 -
TOTAL 0.2 -
Property, plant and equipment include assets acquired under finance lease as follows:
FINANCE LEASES
EUR million 2018 2017Machinery and equipment
Acquisition cost at 31 December 1.2 1.4
Accumulated depreciation at 31 December -0.8 -1.1
CARRYING AMOUNT AT 31 DECEMBER 0.4 0.3
128BOARD REPORT
BUSINESS OVERVIEW
CORPORATERESPONSIBILITY
CORPORATE GOVERNANCE
FINANCIAL STATEMENTS
ANNUAL REPORT2018
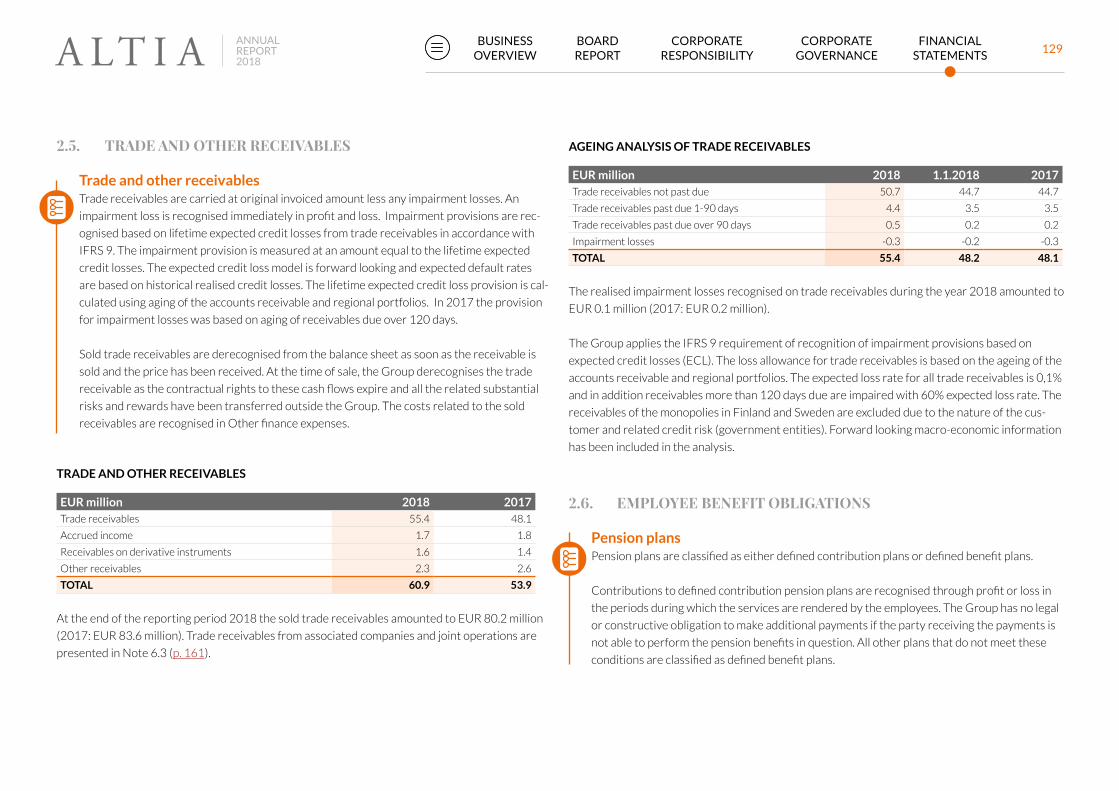
2.5. TRADE AND OTHER RECEIVABLES
Trade and other receivablesTrade receivables are carried at original invoiced amount less any impairment losses. An
impairment loss is recognised immediately in profit and loss. Impairment provisions are rec-
ognised based on lifetime expected credit losses from trade receivables in accordance with
IFRS 9. The impairment provision is measured at an amount equal to the lifetime expected
credit losses. The expected credit loss model is forward looking and expected default rates
are based on historical realised credit losses. The lifetime expected credit loss provision is cal-
culated using aging of the accounts receivable and regional portfolios. In 2017 the provision
for impairment losses was based on aging of receivables due over 120 days.
Sold trade receivables are derecognised from the balance sheet as soon as the receivable is
sold and the price has been received. At the time of sale, the Group derecognises the trade
receivable as the contractual rights to these cash flows expire and all the related substantial
risks and rewards have been transferred outside the Group. The costs related to the sold
receivables are recognised in Other finance expenses.
TRADE AND OTHER RECEIVABLES
EUR million 2018 2017Trade receivables 55.4 48.1
Accrued income 1.7 1.8
Receivables on derivative instruments 1.6 1.4
Other receivables 2.3 2.6
TOTAL 60.9 53.9
At the end of the reporting period 2018 the sold trade receivables amounted to EUR 80.2 million
(2017: EUR 83.6 million). Trade receivables from associated companies and joint operations are
presented in Note 6.3 (p. 161).
AGEING ANALYSIS OF TRADE RECEIVABLES
EUR million 2018 1.1.2018 2017Trade receivables not past due 50.7 44.7 44.7
Trade receivables past due 1-90 days 4.4 3.5 3.5
Trade receivables past due over 90 days 0.5 0.2 0.2
Impairment losses -0.3 -0.2 -0.3
TOTAL 55.4 48.2 48.1
The realised impairment losses recognised on trade receivables during the year 2018 amounted to
EUR 0.1 million (2017: EUR 0.2 million).
The Group applies the IFRS 9 requirement of recognition of impairment provisions based on
expected credit losses (ECL). The loss allowance for trade receivables is based on the ageing of the
accounts receivable and regional portfolios. The expected loss rate for all trade receivables is 0,1%
and in addition receivables more than 120 days due are impaired with 60% expected loss rate. The
receivables of the monopolies in Finland and Sweden are excluded due to the nature of the cus-
tomer and related credit risk (government entities). Forward looking macro-economic information
has been included in the analysis.
2.6. EMPLOYEE BENEFIT OBLIGATIONS
Pension plansPension plans are classified as either defined contribution plans or defined benefit plans.
Contributions to defined contribution pension plans are recognised through profit or loss in
the periods during which the services are rendered by the employees. The Group has no legal
or constructive obligation to make additional payments if the party receiving the payments is
not able to perform the pension benefits in question. All other plans that do not meet these
conditions are classified as defined benefit plans.
129BOARD REPORT
BUSINESS OVERVIEW
CORPORATERESPONSIBILITY
CORPORATE GOVERNANCE
FINANCIAL STATEMENTS
ANNUAL REPORT2018

Defined benefit plans are financed with payments to pension insurance companies. The obli-
gation in respect of defined benefit pension plans is calculated using the projected unit credit
method separately for each plan. Pension expenses are recognised in periods during which
services are rendered by employees participating the plan according to actuarial calculations
prepared by qualified actuaries. The amount recognised as a defined benefit liability or asset
comprises the net total of the following items: the present value of the defined benefit obli-
gation and the fair value of the plan assets. The discount rate used to determine the present
value of the defined benefit obligation is the yield on high quality corporate or government
bonds with a similar maturity to that of the pension obligation.
Current service cost and the net interest on net defined benefit liability is recognised in
profit or loss. The pension expense is disclosed under the employee benefit expenses and the
net interest is disclosed under financial items. Items arising from the remeasurement of net
defined benefit liability are recognised in other comprehensive income during the period in
which they occur.
Past service cost is expensed at the earlier of the following dates: when the plan amendment
or curtailment occurs or when the entity recognises related restructuring costs or termina-
tion benefits.
Critical estimates and management judgements – Defined benefit pension obligations:Measurement of defined benefit pension obligation and plan assets is based on the actuarial
assumptions made by management. These include e.g. the discount rate used in calculating
the present value of the obligation, future salary and pension level, expected return on plan
assets and the turnover of personnel included in the plan. Changes in the actuarial assump-
tions, as well as differences between expected and realised values result in actuarial gains
and losses.
Group’s pension arrangementsThe Group operates various pension plans in accordance with local conditions and practices in
different countries. In the Finnish companies, statutory pension obligations (TyEL) are arranged
through insurance companies, when the TyEL plan is a defined contribution plan. The defined
contribution plans are applied also in other countries and the foreign subsidiaries manage their
pension plans in accordance with local legislation and established practice.
The Group has defined benefit pension plans for supplementary pension in Norway and France.
In defined benefit pension plans, the amount of the pension benefit at retirement is calculated on
the basis of salary, years of service and life expectancy. The Norwegian and French pension plans
cover only few employees, thus the related pension liabilities are not material for the Group.
DEFINED BENEFIT PENSION LIABILITY IN THE BALANCE SHEET
EUR million 2018 2017Present value of unfunded obligations 1.1 1.2
Taxes, Norway 0.2 0.2
NET PENSION LIABILITY IN THE BALANCE SHEET 1.3 1.3
DEFINED BENEFIT PENSION EXPENSE IN PROFIT OR LOSS
EUR million 2018 2017Current service cost - 0.0
Net interest -0.0 -0.0
Tax effect, Norway -0.0 -0.0
PENSION EXPENSES RECOGNISED IN PROFIT OR LOSS, PROFIT (+), LOSS(-)
-0.0 -0.0
130BOARD REPORT
BUSINESS OVERVIEW
CORPORATERESPONSIBILITY
CORPORATE GOVERNANCE
FINANCIAL STATEMENTS
ANNUAL REPORT2018

ITEMS OF OTHER COMPREHENSIVE INCOME
EUR million 2018 2017Remeasurements
Return on plan assets, excluding interest income and interest expense
- 0.0
Gain (loss) related to changes in demographic assumptions 0.0 -
Gain (loss) related to changes in financial assumptions -0.0 -0.0
Experience adjustment - gain (loss) - -0.0
Tax effect, Norway 0.0 -0.0
TOTAL COMPREHENSIVE INCOME 0.0 -0.0
CHANGES IN PENSION OBLIGATION AND FAIR VALUE OF PLAN ASSETS IN THE BALANCE SHEET
EUR million 2018 2017Present value of the obligation:
Obligation at 1 January 1.3 1.8
Service cost - 0.0
Interest cost 0.0 0.0
Benefits paid -0.2 -0.3
Exchange differences -0.0 -0.3
Remeasurement gains (-) and losses (+) -0.0 -0.0
Tax effect, Norway 0.2 0.2
OBLIGATION AT 31 DECEMBER 1.3 1.3
EUR million 2018 2017Fair value of plan assets:
Contributions paid by employer to the plan -0.2 -0.1
Benefits paid 0.2 0.1
FAIR VALUE OF PLAN ASSETS AT 31 DECEMBER - -
SIGNIFICANT ACTUARIAL ASSUMPTIONS
2018 2017Norway
Discount rate 2.0% 1.9%
Future pension growth 2.0% 2.0%
2.7. TRADE AND OTHER PAYABLES
EUR million 2018 2017Current
Trade payables 25.8 29.2
Accruals for wages and salaries and social security contributions
1.1 3.6
Interest liabilities 0.3 0.1
Other accrued expenses 19.2 18.0
Derivative liabilities 1.5 1.5
Excise tax 48.8 50.1
VAT liability 27.6 26.9
Other liabilities 7.0 7.9
TOTAL 131.4 137.4
131BOARD REPORT
BUSINESS OVERVIEW
CORPORATERESPONSIBILITY
CORPORATE GOVERNANCE
FINANCIAL STATEMENTS
ANNUAL REPORT2018

2.8. CONTRACT LIABILITIES
Contract liabilities represent the amount received or receivable that is expected to be
returned as a refund liability.
EUR million 2018 2017Current
Contract liabilities 0.6 -
TOTAL 0.6 -
2.9. PROVISIONS
A provision is recognised when the Group has a present legal or constructive obligation as a
result of a past event, and it is probable that an outflow of economic benefits will be required
to settle the obligation and the amount of the obligation can be reliably estimated. The
amount recognised as provision is the management’s best estimate of the costs required to
settle the existing obligation at the end of the reporting period. If part of the obligation may
potentially be compensated by a third party, the compensation is recognised as a separate
asset when it is virtually certain that the compensation will be received.
A provision for restructuring is recognised when a detailed restructuring plan has been pre-
pared, and the implementation of the plan has either been commenced or the plan has been
announced to those who are affected.
Other provisions relate to the cost on excise tax class revision of two products based on a prelimi-
nary outcome of a tax audit In Finland. Altia is taking measures to contest the outcome.
Restructuring provisions included mainly costs for various projects to streamline operations and
consists of employee termination benefits.
PROVISIONS
EUR million Other provisions Total Provisions at 31 December 2017 - -
Provisions made during the year 0.5 0.5
Provisions used during the year - -
PROVISION AT 31 DECEMBER 2018 0.5 0.5
Current 0.5 0.5
Non-Current - -
EUR million Restructuring Restoration Total Provision at 31 December 2016 0.7 0.6 1.3
Provisions made during the year - - -
Provisions used during the year -0.7 -0.6 -1.3
PROVISION AT 31 DECEMBER 2017 - - -
Currrent - - -
Non-Current - - -
132BOARD REPORT
BUSINESS OVERVIEW
CORPORATERESPONSIBILITY
CORPORATE GOVERNANCE
FINANCIAL STATEMENTS
ANNUAL REPORT2018

3. Financial items and capital structure3.1. FINANCE INCOME AND EXPENSES
FINANCE INCOME
EUR million 2018 2017Interest income
Forward points on FX-forwards - 0.2
Loans, receivables and cash and cash equivalents 0.1 0.1
Total interest income 0.1 0.3
Foreign exchange gains
Foreign exchange gains on FX-derivatives 1.2 1.7
Foreign exchange gains on I/C loans and cash pool accounts
2.1 2.4
Total foreign exchange gains 3.3 4.0
Dividend income
Fair value through other comprehensive income 0.1 -
Available-for-sale financial assets - 0.2
Total dividend income 0.1 0.2
TOTAL FINANCE INCOME 3.5 4.5
Foreign exchange differences arising from trade receivables and trade payables amounting
to EUR 0.2 million (2017: EUR -0.1 million) and from currency derivatives amounting to
EUR 1.7 million (2017: EUR 0.1 million) are included in operating result.
89.4 MEUR
Borrowings
133BOARD REPORT
BUSINESS OVERVIEW
CORPORATERESPONSIBILITY
CORPORATE GOVERNANCE
FINANCIAL STATEMENTS
ANNUAL REPORT2018

FINANCE EXPENSES
EUR million 2018 2017Interest expenses
Forward points on FX-forwards 0.0 0.1
Financial liabilities at amortised cost 1.3 1.1
Derivatives under hedge accounting (Interest rate risk) 0.4 0.4
Other interest expenses, pension liability 0.0 0.0
Total interest expenses 1.7 1.6
Foreign exchange losses
Foreign exchange losses on FX-derivatives 2.0 3.2
Foreign exchange losses on I/C loans and cash pool accounts
1.4 1.0
Total foreign exchange losses 3.4 4.1
Other finance expenses
Other financial expenses 0.8 0.7
Ineffective portion of commodity derivatives under hedge accounting
- -0.0
Total other finance expenses 0.8 0.7
TOTAL FINANCE EXPENSES 5.8 6.4
Interest expenses include finance lease related interest expenses amounting to EUR 0.0 million in
2018 (2017: EUR 0.0 million).
3.2. FINANCIAL ASSETS AND LIABILITIES3.2.1 FINANCIAL ASSETS
The Group’s financial assets were classified according to IAS 39 as financial assets at fair
value through profit or loss, loans and receivables and available-for-sale financial assets.
According to IFRS 9 the classification is business model driven and there are three classes:
fair value through profit and loss, amortised cost (replaces Loans and receivables) and fair
value through other comprehensive income (replaces Available-for-sale). Classification is
made upon initial recognition based on the purpose of use of the asset. The basis of classifica-
tion is reassessed at each reporting date.
Application of IFRS 9 did not have any impact on the recognition or measurement of the
Group’s financial assets. All purchases and sales of financial instruments are recognised on the
trade date, which is the date when the Group commits to purchase or sell a financial instru-
ment. Financial assets are recognised in the balance sheet at original cost which equals their
fair value at the acquisition date. If the asset in question is not measured at fair value through
profit or loss, transaction costs are included in the original cost of the financial asset.
The Group derecognises a financial asset when the contractual rights to the cash flows from
the asset expire, or the Group transfers all the substantial risks and rewards related to the
financial asset outside the Group. Financial assets are included in non-current items of the
balance sheet when their maturity is over 12 months.
Impairment of financial assets The new impairment model requires the recognition of impairment provision based on
expected credit losses rather than only incurred credit losses as in IAS 39. The impairment
provision is recognised based on lifetime expected credit losses from trade receivables and
contract assets. More information on the impairment provision on trade receivables can be
found in note 2.5. (p. 129). Trade and other receivables.
The impairment model does not apply to financial assets measured at fair value and invest-
ments in associates and interests in joint operations since those are measured at fair value
under IFRS 9 which already takes into account expected credit losses.
Financial assets recognised at fair value through profit or lossThis category includes financial assets held for trading purposes or otherwise designated
as financial assets recognised at fair value through profit or loss by Altia Group. Derivative
instruments held for hedging purposes, but not qualifying for the criteria of hedge account-
ing, are classified in this category. Items in this category are initially recognised at fair value
and subsequently measured at the fair value of each reporting date, which is the market bid
134BOARD REPORT
BUSINESS OVERVIEW
CORPORATERESPONSIBILITY
CORPORATE GOVERNANCE
FINANCIAL STATEMENTS
ANNUAL REPORT2018

price at the end of the reporting period determined based on public price quotations in active
markets. Realised and unrealised gains and losses arising from changes in fair values are rec-
ognised in profit or loss in financial items in the period in which they are incurred if they relate
to hedging of financial items. If derivative instruments relate to hedging of commercial items
(foreign currency denominated purchases and sales) and hedge accounting is applied, the
realised and unrealised gains and losses are recognised in income statement as adjustments
to purchases and sales and included in operating result.
Amortised cost Loans and receivables arise when money, goods or services are delivered to a debtor, and they
are included in current or non-current financial assets in accordance with their maturity. The
assets in this category are held according to a business model of which objective is to collect
contractual cash flows. In Altia, non-current receivables include loan receivables and other
receivables with the maturity of over one year. Current receivables include trade receivables
as well as cash and cash equivalents presented under current financial assets. Receivables
are measured at amortised cost when the related payments are fixed or determinable and the
instruments are not quoted in financial markets. The exchange rate differences of intra-group
foreign currency denominated loan receivables are presented within financial items as for-
eign exchange differences related to loans. The exchange rate differences of foreign currency
denominated trade receivables are presented in income statement as adjustments to sales.
Fair value through other comprehensive income These assets are non-derivative financial assets which are either designated in this category
or not classified in any other category of financial assets. These are included in non-current
assets, unless they are intended to be held less than 12 months from the end of the reporting
period, in which case they are included in current assets.
Financial assets measured at fair value through other comprehensive income consist of
unquoted shares. Unquoted shares are measured at fair value based on market approach val-
uation techniques using information from market transactions involving comparable assets.
Fair value through other comprehensive incomeFair value through other comprehensive income assets consisted of unquoted shares, amounting
to EUR 1.4 million (2017: EUR 1.4 million).
Other receivablesOther receivables consisted of deferred purchase consideration receivable from the sale of
Svendborg real-estate amounting to EUR 1.0 million in 2017.
3.2.2 FINANCIAL LIABILITIES
Financial liabilities are classified as financial liabilities at fair value through profit or loss and
financial liabilities at amortised cost. Financial liabilities are initially measured at fair value
and recognised net of transaction costs, with the exception of items measured at fair value
through profit or loss.
A financial liability (or a part of it) is not derecognised until the obligation specified in the con-
tract is discharged or cancelled or expires. A financial liability is classified as current, unless
the Group has an unconditional right to defer the settlement of the liability for at least 12
months after the end of the reporting period.
Adoption of IFRS 9 had no impact on classification and measurement of financial liabilities.
The new requirements affected only the accounting financial liabilities that are designated at
fair value through profit or loss and Altia does not have such liabilities.
Financial liabilities at fair value through profit or lossFinancial liabilities at fair value through profit or loss include derivatives held for hedging
purposes but not qualifying for hedge accounting. Financial liabilities in this category are
measured at fair value, which is determined based on price quotations in active markets at the
reporting date. Realised and unrealised gains or losses arising from the changes in fair values
are recognised through profit or loss in the financial items as incurred.
135BOARD REPORT
BUSINESS OVERVIEW
CORPORATERESPONSIBILITY
CORPORATE GOVERNANCE
FINANCIAL STATEMENTS
ANNUAL REPORT2018

Financial liabilities at amortised costThis category includes the Group’s external loans from financial institutions, loans from pen-
sion institutions, commercial paper loans as well as trade payables. These financial liabilities
are measured at amortised cost using the effective interest method. When loans are paid
off or refinanced, the related unamortised costs are recognised in finance expenses. Group
overdrafts in use are included in current borrowings. In addition, Altia has a revolving credit
facility and the related fee is amortised on a straight-line basis in other finance expenses
during the term of the facility.
The exchange rate differences arising from foreign currency denominated loans from financial
institutions are disclosed under financial items. The exchange rate differences of intra-group
foreign currency denominated loans are presented within financial items in the foreign ex-
change differences of the category financial liabilities at amortised cost.
The fair values of loans from financial institutions and commercial paper loans are deter-
mined based on future cash flows discounted with market interest rate at the reporting date
adjusted with Altia’s credit risk premium. At the reporting date, the carrying amounts of the
loans are considered to equal their fair values because of the exceptionally low level of market
interest rates. The fair values of finance lease liabilities are based on discounted future cash
flows. The discount rate is the corresponding interest rate on similar lease contracts.
BORROWINGS
EUR million 2018 2017Non-current
Loans from financial institutions 69.8 74.7
Loans from pension institutions 12.8 14.3
Finance lease liabilities 0.2 0.2
TOTAL 82.7 89.1
Current
Loans from financial institutions 5.0 10.0
Loans from pension institutions 1.5 0.8
Finance lease liabilities 0.2 0.2
TOTAL 6.7 11.0
Interest-bearing non-current loans from financial and pension institutions are measured at amor-
tised cost using the effective interest method.
All of the Group’s non-current and current loans from financial and pension institutions were
nominated in Euros as at 31 December 2018 and 31 December 2017.
The weighted average effective interest rate (p.a.) of the Group’s loans from financial and pension
institutions as at 31 December 2018 was 1.6% (2017: 1.6%).
The weighted average interest rate (p.a.) of the Group’s finance lease liabilities as at 31 December
2018 was 1.2% (2017: 1.5%).
136BOARD REPORT
BUSINESS OVERVIEW
CORPORATERESPONSIBILITY
CORPORATE GOVERNANCE
FINANCIAL STATEMENTS
ANNUAL REPORT2018
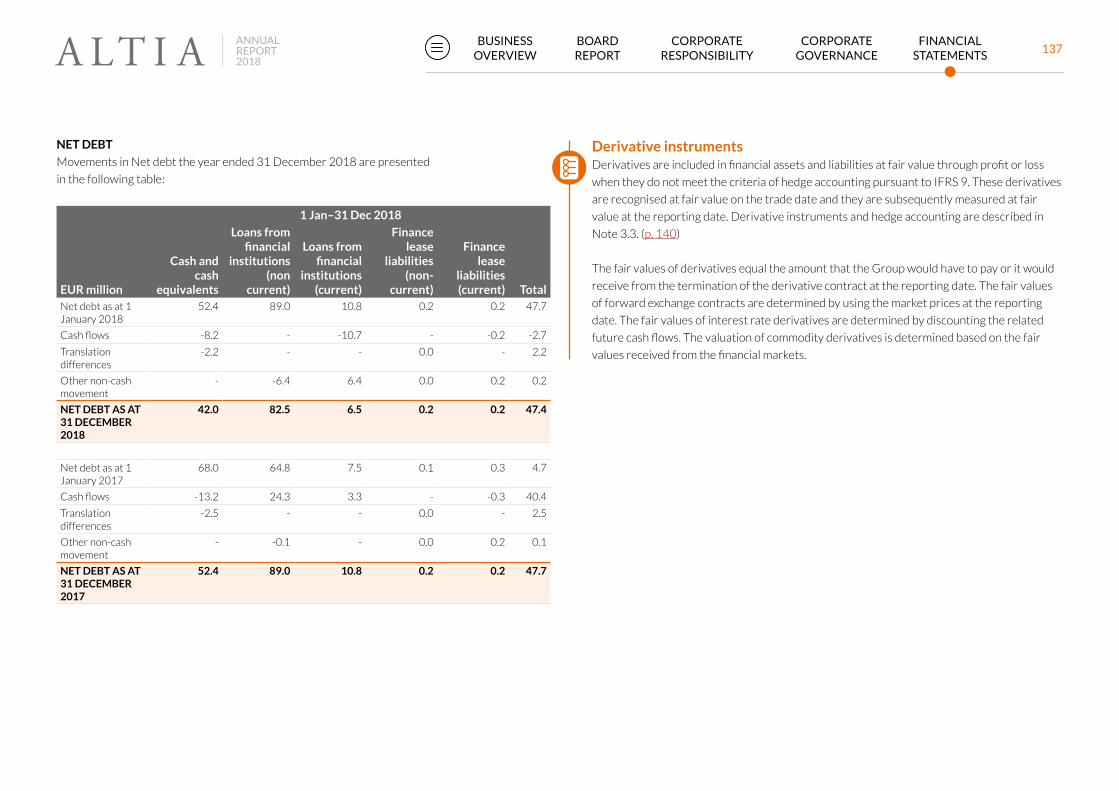
NET DEBT
Movements in Net debt the year ended 31 December 2018 are presented
in the following table:
1 Jan–31 Dec 2018
EUR million
Cash and cash
equivalents
Loans from financial
institutions (non
current)
Loans from financial
institutions (current)
Finance lease
liabilities (non-
current)
Finance lease
liabilities (current) Total
Net debt as at 1 January 2018
52.4 89.0 10.8 0.2 0.2 47.7
Cash flows -8.2 - -10.7 - -0.2 -2.7
Translation differences
-2.2 - - 0.0 - 2.2
Other non-cash movement
- -6.4 6.4 0.0 0.2 0.2
NET DEBT AS AT 31 DECEMBER 2018
42.0 82.5 6.5 0.2 0.2 47.4
Net debt as at 1 January 2017
68.0 64.8 7.5 0.1 0.3 4.7
Cash flows -13.2 24.3 3.3 - -0.3 40.4
Translation differences
-2.5 - - 0.0 - 2.5
Other non-cash movement
- -0.1 - 0.0 0.2 0.1
NET DEBT AS AT 31 DECEMBER 2017
52.4 89.0 10.8 0.2 0.2 47.7
Derivative instrumentsDerivatives are included in financial assets and liabilities at fair value through profit or loss
when they do not meet the criteria of hedge accounting pursuant to IFRS 9. These derivatives
are recognised at fair value on the trade date and they are subsequently measured at fair
value at the reporting date. Derivative instruments and hedge accounting are described in
Note 3.3. (p. 140)
The fair values of derivatives equal the amount that the Group would have to pay or it would
receive from the termination of the derivative contract at the reporting date. The fair values
of forward exchange contracts are determined by using the market prices at the reporting
date. The fair values of interest rate derivatives are determined by discounting the related
future cash flows. The valuation of commodity derivatives is determined based on the fair
values received from the financial markets.
137BOARD REPORT
BUSINESS OVERVIEW
CORPORATERESPONSIBILITY
CORPORATE GOVERNANCE
FINANCIAL STATEMENTS
ANNUAL REPORT2018
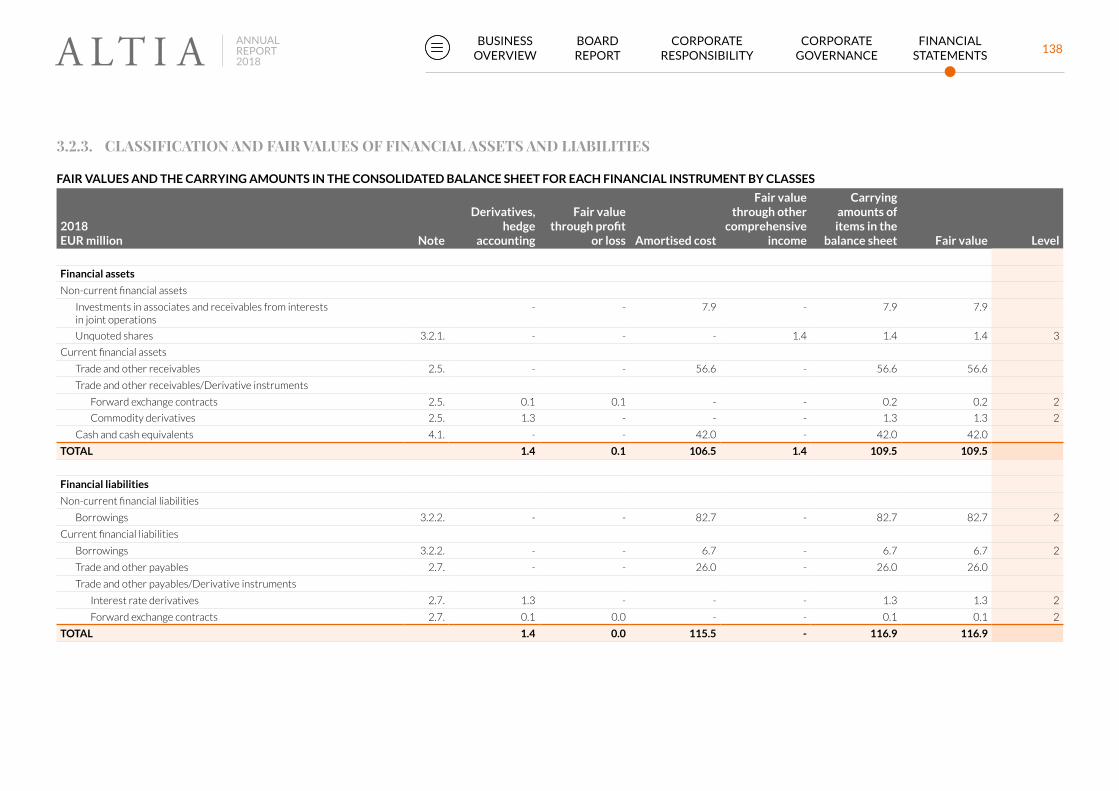
3.2.3. CLASSIFICATION AND FAIR VALUES OF FINANCIAL ASSETS AND LIABILITIES
FAIR VALUES AND THE CARRYING AMOUNTS IN THE CONSOLIDATED BALANCE SHEET FOR EACH FINANCIAL INSTRUMENT BY CLASSES
2018 EUR million Note
Derivatives, hedge
accounting
Fair value through profit
or loss Amortised cost
Fair value through other
comprehensive income
Carrying amounts of items in the
balance sheet Fair value Level
Financial assets
Non-current financial assets
Investments in associates and receivables from interests in joint operations
- - 7.9 - 7.9 7.9
Unquoted shares 3.2.1. - - - 1.4 1.4 1.4 3
Current financial assets
Trade and other receivables 2.5. - - 56.6 - 56.6 56.6
Trade and other receivables/Derivative instruments
Forward exchange contracts 2.5. 0.1 0.1 - - 0.2 0.2 2
Commodity derivatives 2.5. 1.3 - - - 1.3 1.3 2
Cash and cash equivalents 4.1. - - 42.0 - 42.0 42.0
TOTAL 1.4 0.1 106.5 1.4 109.5 109.5
Financial liabilities
Non-current financial liabilities
Borrowings 3.2.2. - - 82.7 - 82.7 82.7 2
Current financial liabilities
Borrowings 3.2.2. - - 6.7 - 6.7 6.7 2
Trade and other payables 2.7. - - 26.0 - 26.0 26.0
Trade and other payables/Derivative instruments
Interest rate derivatives 2.7. 1.3 - - - 1.3 1.3 2
Forward exchange contracts 2.7. 0.1 0.0 - - 0.1 0.1 2
TOTAL 1.4 0.0 115.5 - 116.9 116.9
138BOARD REPORT
BUSINESS OVERVIEW
CORPORATERESPONSIBILITY
CORPORATE GOVERNANCE
FINANCIAL STATEMENTS
ANNUAL REPORT2018
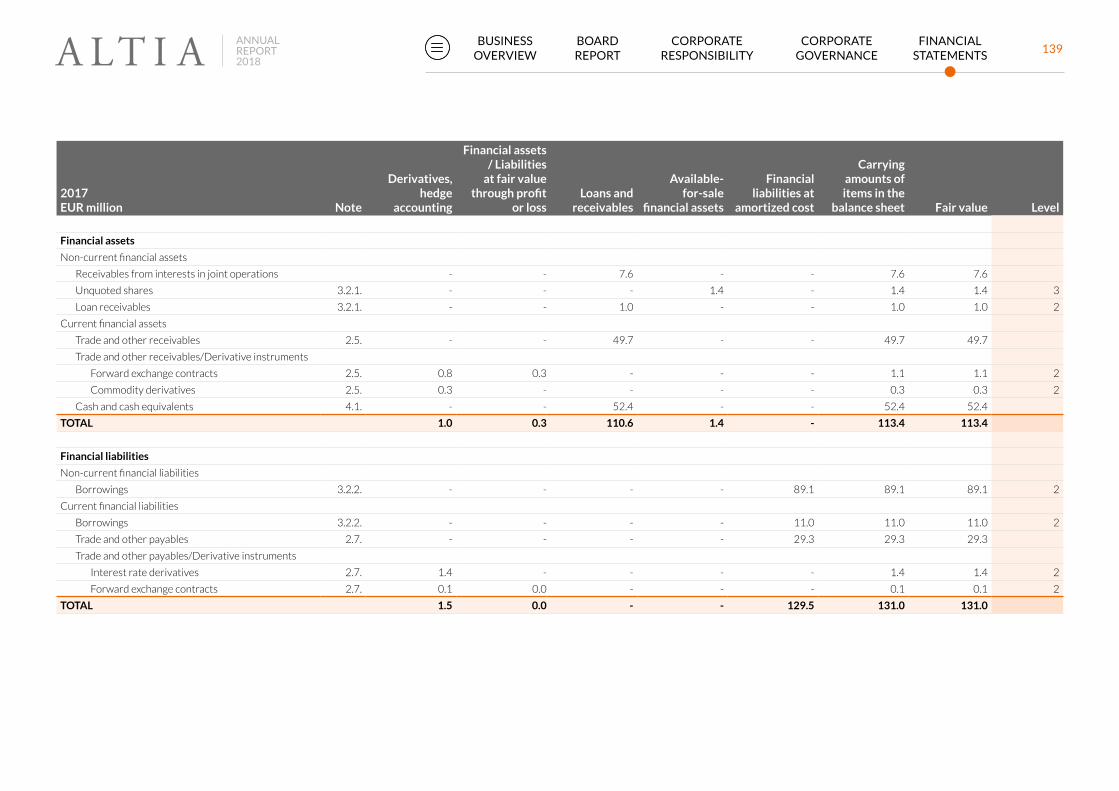
2017EUR million Note
Derivatives, hedge
accounting
Financial assets / Liabilities
at fair value through profit
or lossLoans and
receivables
Available- for-sale
financial assets
Financial liabilities at
amortized cost
Carrying amounts of items in the
balance sheet Fair value Level
Financial assets
Non-current financial assets
Receivables from interests in joint operations - - 7.6 - - 7.6 7.6
Unquoted shares 3.2.1. - - - 1.4 - 1.4 1.4 3
Loan receivables 3.2.1. - - 1.0 - - 1.0 1.0 2
Current financial assets
Trade and other receivables 2.5. - - 49.7 - - 49.7 49.7
Trade and other receivables/Derivative instruments
Forward exchange contracts 2.5. 0.8 0.3 - - - 1.1 1.1 2
Commodity derivatives 2.5. 0.3 - - - - 0.3 0.3 2
Cash and cash equivalents 4.1. - - 52.4 - - 52.4 52.4
TOTAL 1.0 0.3 110.6 1.4 - 113.4 113.4
Financial liabilities
Non-current financial liabilities
Borrowings 3.2.2. - - - - 89.1 89.1 89.1 2
Current financial liabilities
Borrowings 3.2.2. - - - - 11.0 11.0 11.0 2
Trade and other payables 2.7. - - - - 29.3 29.3 29.3
Trade and other payables/Derivative instruments
Interest rate derivatives 2.7. 1.4 - - - - 1.4 1.4 2
Forward exchange contracts 2.7. 0.1 0.0 - - - 0.1 0.1 2
TOTAL 1.5 0.0 - - 129.5 131.0 131.0
139BOARD REPORT
BUSINESS OVERVIEW
CORPORATERESPONSIBILITY
CORPORATE GOVERNANCE
FINANCIAL STATEMENTS
ANNUAL REPORT2018

At the reporting date due to short maturity fair value of trade receivables and other short-term
receivables and liabilities equal to their value in the balance sheet.
The table above presents the classification of financial instruments. The levels 1–3 of fair value
hierarchy reflect the significance of inputs used in determining the fair values. In level one, fair val-
ues are based on public quotations of identical financial instruments. In level two, the inputs used
in determining the fair values are based on quoted market rates and prices observable for the
asset or liability in question directly (i.e. price) or indirectly on discounted future cash flows. Fair
values of other financial assets and liabilities in level two reflect their carrying value. In level three,
the fair values of assets and liabilities are based on inputs that are not based on observable market
data for all significant variables, and instead are, to a significant extent, based on management
estimates and their use in generally accepted valuation techniques. The reported fair value level is
based on the lowest level of input information that is significant in determining the fair value.
3.3. DERIVATIVE INSTRUMENTS AND HEDGE ACCOUNTING
When the Group applies IFRS 9 hedge accounting to foreign currency, interest rate and electricity
derivatives, the effective portion of the fair value change is recognised in other comprehensive
income and presented within equity in the hedge reserve.
When hedge accounting is appliedIn Altia, cash flow hedging is applied to part of the interest rate, foreign currency and electric-
ity derivatives based on case-by-case assessment. In cash flow hedging, the Group is hedging
against changes in cash flows related to a specific asset or liability recognised in the balance
sheet or to a highly probable future business transaction. Hedge accounting is a method of
accounting with the purpose to allocate one or several hedging instruments so that their fair
value changes offset in full or partly the changes in fair value or cash flow arising from the
hedged risk in profit or loss during the period, for which the hedge is designated. In the be-
ginning of the hedging arrangement, Altia documents the relationship between each hedging
instrument and hedged item, as well as the objectives of risk management and the strategy in
engaging in hedging. IFRS 9 requires that the effectiveness of hedging instruments is tested
prospectively. Effectiveness means the ability of a hedging instrument to offset the changes
in the fair value of the hedged item or changes in the cash flows of the hedged transaction at-
tributable to the hedged risk. Under IFRS 9 the hedging relationship is regarded to be highly
effective when there is an economic relationship between the hedged item and the hedging
instrument. Hedging ratio is defined as a relationship between the quantity of the hedging
instrument and the quantity of the hedged item. Hedge accounting is discontinued when the
criteria for hedge accounting is no longer met.
The gains and losses arising from fair value changes of derivative contracts, to which hedge
accounting is applied, are presented in congruence with the hedged item. After implementa-
tion of IFRS 9, the forward points are included to hedging relationship. The effective portion
of the unrealised changes in the fair value of derivatives designated and qualifying as cash
flow hedges are recognised in other comprehensive income and presented in the hedge
reserve in equity. The ineffective portion is immediately recognised in finance income or ex-
penses in profit or loss. The cumulative gain or loss in equity on derivative instruments related
to commercial items is recognised in profit or loss as an adjustment to purchases or sales
simultaneously with the hedged item in the period in which the hedged item affects profit or
loss. Realised gain or loss on electricity derivatives is included in operating result in electricity
procurement expenses. When a hedging instrument designated as a cash flow hedge expires,
is sold or no longer meets the criteria of hedge accounting, the gain or loss accumulated in
equity is recognised through finance income or expenses.
When hedge accounting is not appliedThe accounting for gains and losses arising from fair value measurement is dependent on
the purpose of use of the derivative. In Altia, the changes in the fair values of derivative
instruments are immediately recognised in profit or loss in finance income or expense if the
derivative in question is related to hedging of commercial cash flows (purchases and sales)
and hedge accounting is not applied. The fair value changes of other derivative instruments
are immediately recognised in profit or loss in finance income or expense items if hedge ac-
counting is not applied. Derivatives, to which hedge accounting is not applied, are acquired to
minimise the profit and/or cash flow effects related to business operations or financing.
140BOARD REPORT
BUSINESS OVERVIEW
CORPORATERESPONSIBILITY
CORPORATE GOVERNANCE
FINANCIAL STATEMENTS
ANNUAL REPORT2018
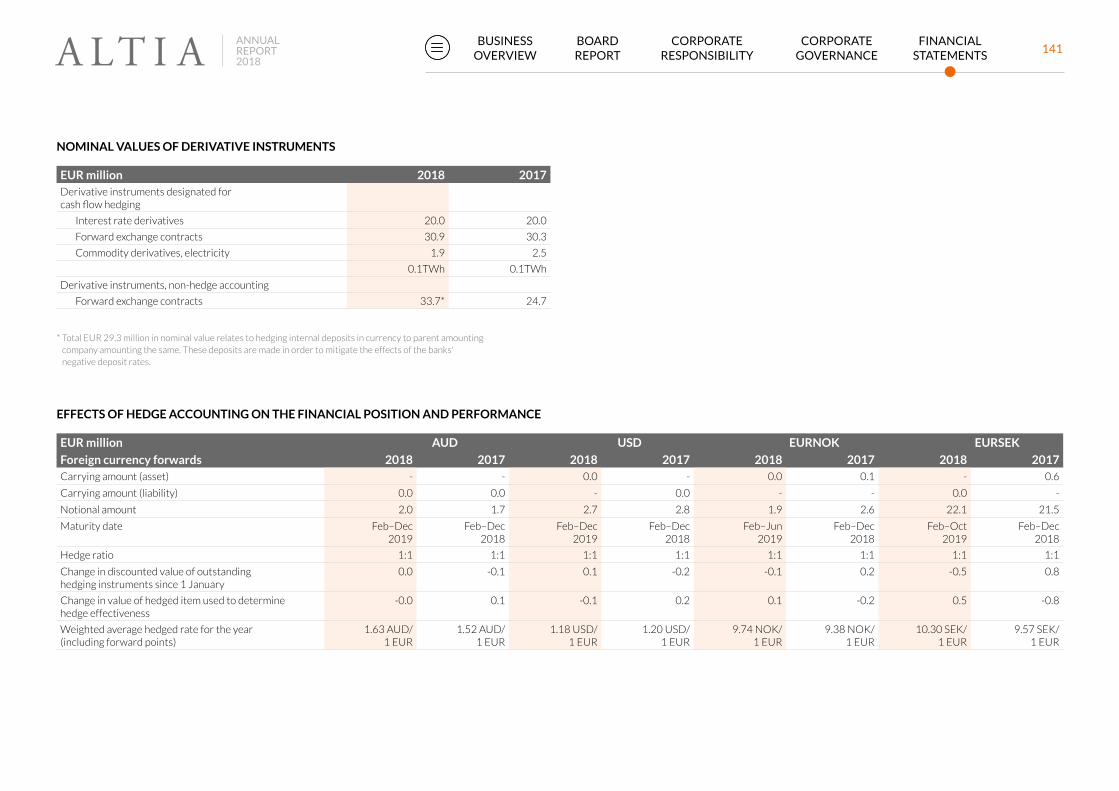
NOMINAL VALUES OF DERIVATIVE INSTRUMENTS
EUR million 2018 2017Derivative instruments designated for cash flow hedging
Interest rate derivatives 20.0 20.0
Forward exchange contracts 30.9 30.3
Commodity derivatives, electricity 1.9 2.5
0.1TWh 0.1TWh
Derivative instruments, non-hedge accounting
Forward exchange contracts 33.7* 24.7
* Total EUR 29.3 million in nominal value relates to hedging internal deposits in currency to parent amounting company amounting the same. These deposits are made in order to mitigate the effects of the banks' negative deposit rates.
EFFECTS OF HEDGE ACCOUNTING ON THE FINANCIAL POSITION AND PERFORMANCE
EUR million AUD USD EURNOK EURSEK
Foreign currency forwards 2018 2017 2018 2017 2018 2017 2018 2017Carrying amount (asset) - - 0.0 - 0.0 0.1 - 0.6
Carrying amount (liability) 0.0 0.0 - 0.0 - - 0.0 -
Notional amount 2.0 1.7 2.7 2.8 1.9 2.6 22.1 21.5
Maturity date Feb–Dec 2019
Feb–Dec 2018
Feb–Dec 2019
Feb–Dec 2018
Feb–Jun 2019
Feb–Dec 2018
Feb–Oct 2019
Feb–Dec 2018
Hedge ratio 1:1 1:1 1:1 1:1 1:1 1:1 1:1 1:1
Change in discounted value of outstanding hedging instruments since 1 January
0.0 -0.1 0.1 -0.2 -0.1 0.2 -0.5 0.8
Change in value of hedged item used to determine hedge effectiveness
-0.0 0.1 -0.1 0.2 0.1 -0.2 0.5 -0.8
Weighted average hedged rate for the year (including forward points)
1.63 AUD/ 1 EUR
1.52 AUD/ 1 EUR
1.18 USD/ 1 EUR
1.20 USD/ 1 EUR
9.74 NOK/ 1 EUR
9.38 NOK/ 1 EUR
10.30 SEK/ 1 EUR
9.57 SEK/ 1 EUR
141BOARD REPORT
BUSINESS OVERVIEW
CORPORATERESPONSIBILITY
CORPORATE GOVERNANCE
FINANCIAL STATEMENTS
ANNUAL REPORT2018

EUR million
Interest rate swap 2018 2017Carrying amount (liability) 1.3 1.4
Notional amount 20.0 20.0
Maturity date 04/2023 04/2023
Hedge ratio 1:1 1:1
Change in discounted value of outstanding hedging instruments since 1 January
-0.1 -0.5
Change in value of hedged item used to determine hedge effectiveness
0.1 0.5
Weighted average hedged rate for the year 1.88% 1.89%
EUR million
Commodities – Electricity 2018 2017Carrying amount (asset) 1.3 0.3
Notional amount 1.9 2.5
TWh 0.1 0.1
Maturity date 2019–2021 2018–2020
Hedge ratio 1:1 1:1
Change in discounted value of outstanding hedging instruments since 1 January
1.1 0.2
Change in value of hedged item used to determine hedge effectiveness
-1.1 -0.2
Weighted average hedged price EUR/MWh 15.43 24.75
Positive and negative fair values of unrealised derivatives and their net amount are presented
below. Interest and currency derivatives are under netting agreements. The master netting agree-
ments in respect of derivatives do not meet the criteria for offsetting in the balance sheet owing to
legally enforceable right not existing currently.
OFFSETTING FINANCIAL ASSETS AND LIABILITIES
EUR million 2018 2017Derivative assets:
Fair value, gross 1.6 1.1
Fair value, under netting agreements -0.1 -0.2
Fair value, net 1.5 1.0
Derivative liabilities:
Fair value, gross 1.5 1.5
Fair value, under netting agreements -0.1 -0.2
Fair value, net 1.4 1.3
3.4. EQUITY
Share capital Altia Plc’s share capital, paid in its entirety and registered in the trade register, was 60,480,378.36
euros at the end of 2018 and 2017. At 31 December 2016, the Company had two class of shares,
series A and series L shares. The Board of Directors of the Company has on 13 December 2017
resolved to cancel all 25 003 series L shares, which were held in treasury by the Company and
upon registration of such cancellation the Company had no series L shares at 31 December 2017.
On 15 December 2017, the sole shareholder of the Company resolved to combine the Company’s
series A and L shares to single share series and incorporate the shares in the book-entry securities
system and amend the company’s Articles of Association accordingly on 19 January 2018. At the
end of the financial period 2018 there were 36,140,485 shares outstanding and in 2017 there
were 35,960,000 A series shares.
Altia Plc together with the State of Finland resolved on the completion of the initial public offering
of Altia as a Share sale on 22 March 2018. Public trading on Altia’s share started in Nasdaq
Helsinki pre -list on 23 March 2018 and in main list on 27 March 2018.
142BOARD REPORT
BUSINESS OVERVIEW
CORPORATERESPONSIBILITY
CORPORATE GOVERNANCE
FINANCIAL STATEMENTS
ANNUAL REPORT2018

All shares issued have been paid in full. The shares have no nominal value. Each share has one
vote at the Annual General meeting and equal rights to dividend and other distribution of assets.
The company does not hold its own shares.
NUMBER OF SHARES
2018 2017Number of outstanding shares in the beginning of the financial year
35,960,000 35,960,000
Personnel offering 180,485 -
Number of outstanding shares at the end of the financial year
36,140,485 35,960,000
Share issuesIn Altia’s initial public offering Altia issued 180,485 personnel shares to permanent employees of
Altia in Finland and Sweden (Personnel Offering). The subscription price was ten per cent lower
than the subscription price in the Institutional Share Sale and Public Share Sale, i.e. EUR 6.75
Invested unrestricted equity fund The amounts paid for issued Personnel Shares in Altia’s listing have been recorded as invested
unrestricted equity fund.
Fair value reserveThe fair value reserve represents the change in the fair value of financial assets measured at fair
value through other comprehensive income.
Hedge reserve The hedge reserve includes the fair value changes of derivative instruments used for cash flow
hedging for effective hedges.
CASH FLOW HEDGE RESERVE
EUR million Currency forwards
Interest rate swaps Commodities
Total hedge reserves
Opening balance 1 January 2017 -0.1 -1.5 0.1 -1.4
Change in fair value of hedging instrument recognised in OCI
0.6 1.1 0.4 2.0
Reclassified from OCI to profit or loss - included in purchases/ sales adjustments
0.1 - - 0.1
Reclassified from OCI to financial income / expenses.
- -0.4 - -0.4
Reclassified from OCI to electricity purhases
- - -0.1 -0.1
Deferred tax -0.1 -0.3 -0.1 -0.5
Closing balance 31 December 2017 0.5 -1.1 0.3 -0.3
Change in fair value of hedging instrument recognised in OCI
-0.0 0.7 0.5 1.2
Reclassified from OCI to profit or loss - included in purchases/ sales adjustments
-0.5 - - -0.5
Reclassified from OCI to financial income / expenses.
- -0.4 - -0.4
Reclassified from OCI to electricity purhases
- - 0.6 0.6
Deferred tax 0.0 -0.3 -0.3 -0.5
Closing balance 31 December 2018 -0.0 -1.0 1.1 0.0
143BOARD REPORT
BUSINESS OVERVIEW
CORPORATERESPONSIBILITY
CORPORATE GOVERNANCE
FINANCIAL STATEMENTS
ANNUAL REPORT2018

Translation differences Translation differences comprise all foreign exchange differences arising from the translation
of the foreign subsidiaries’ financial statements. The Group’s accumulated translation differ-
ences amounted to negative EUR 19.6 million at 31 December 2018 (31.12.2017: negative
EUR 16.0 million).
Earnings per share Basic earnings per share is calculated by dividing the result for the period attributable to owners
of the parent company by the weighted average number of shares outstanding during the report-
ing period.
Diluted earnings per share has been calculated on the same basis as basic earnings per share ex-
cept that it reflects the impact of any potential commitments the Group has to issue shares in the
future. Altia has not issued any dilutive instruments during the periods presented.
EARNINGS PER SHARE
2018 2017Result attributable to the shareholders of the parent company, EUR million
15.1 18.3
Weighted average number of shares outstanding (1.000 pcs) 36 140 35 960
Basic and diluted earnings per share (EUR) 0.42 0.51
Dividend The Board of Directors proposes to the Annual General Meeting that dividend of EUR 0.38 per
share be distributed for 2018. No dividend was distributed for the financial year 2017.
ALTIA PLC'S DISTRIBUTABLE FUNDS
EUR million 31 Dec 2018 31 Dec 2017Invested unrestricted equity fund 1.2 -
Retained earnings 56.8 100.7
Distribution of dividends - -70.5
Profit for the period 14.1 26.5
TOTAL DISTRIBUTABLE FUNDS 72.1 56.8
144BOARD REPORT
BUSINESS OVERVIEW
CORPORATERESPONSIBILITY
CORPORATE GOVERNANCE
FINANCIAL STATEMENTS
ANNUAL REPORT2018

4. Financial and capital risk4.1. FINANCIAL RISK MANAGEMENT
Financial risk management principlesThe aim of Altia's financial risk management is to ensure the Group’s financial stability and
availability of sufficient financing options in different market situations. In addition, the aim
is to support the business operations to identify business-related financial risks and their
management, and to hedge against material financial risks.
The Group is exposed to various market risks. Changes in these risks affect the company’s
assets, liabilities and anticipated transactions. The risks are caused by changes in interest
rates, currencies and commodity market prices. Selected derivative instruments can be
used to manage the risks resulting from these market risks. Altia mainly hedges against risks
that impact the Group’s cash flow, and, if deemed appropriate, also certain foreign currency
denominated items in the balance sheet. Derivatives are solely used to hedging against the
above-mentioned risks. The principles of IFRS 9 hedge accounting are applied to certain
interest rate, foreign exchange as well as electricity derivatives. Financial risk management
is executed as part of the Group’s risk management, according to the Risk Management
Principles approved by the Board of Directors. Altia’s principles aiming towards financial,
credit and operational continuity form the basis for financial risk management.
Risk management processSpecial process features related to financing are described below in connection with the
descriptions of market, liquidity and credit risks. The financial risk exposure is regularly re-
ported to the Audit Committee and Altia’s Board of Directors. The most significant principle
decisions concerning risk management are made by the company’s Board of Directors.
As part of the financial risk management principles, Altia’s Board of Directors has approved a
list of financial instruments, in which the accepted instruments, their purpose and the person
who decides on their use have been specified for different types of financial risks.
31.6 %
Gearing
145BOARD REPORT
BUSINESS OVERVIEW
CORPORATERESPONSIBILITY
CORPORATE GOVERNANCE
FINANCIAL STATEMENTS
ANNUAL REPORT2018
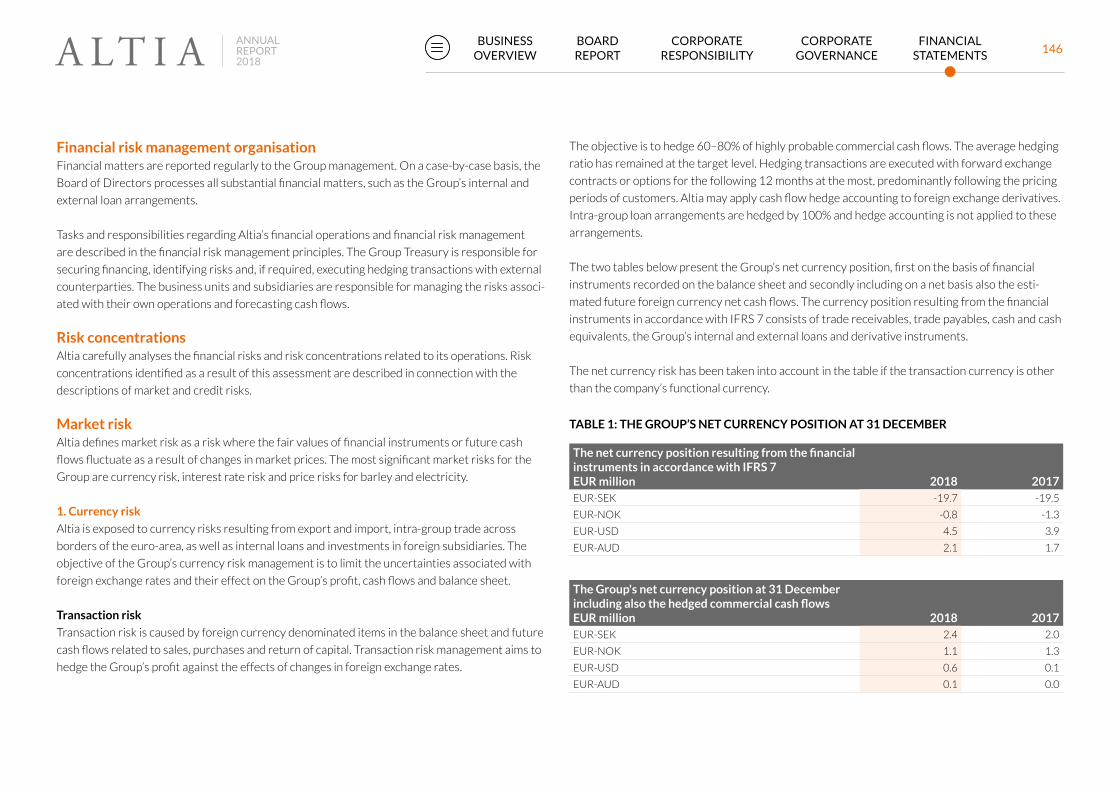
Financial risk management organisation Financial matters are reported regularly to the Group management. On a case-by-case basis, the
Board of Directors processes all substantial financial matters, such as the Group’s internal and
external loan arrangements.
Tasks and responsibilities regarding Altia’s financial operations and financial risk management
are described in the financial risk management principles. The Group Treasury is responsible for
securing financing, identifying risks and, if required, executing hedging transactions with external
counterparties. The business units and subsidiaries are responsible for managing the risks associ-
ated with their own operations and forecasting cash flows.
Risk concentrationsAltia carefully analyses the financial risks and risk concentrations related to its operations. Risk
concentrations identified as a result of this assessment are described in connection with the
descriptions of market and credit risks.
Market riskAltia defines market risk as a risk where the fair values of financial instruments or future cash
flows fluctuate as a result of changes in market prices. The most significant market risks for the
Group are currency risk, interest rate risk and price risks for barley and electricity.
1. Currency risk
Altia is exposed to currency risks resulting from export and import, intra-group trade across
borders of the euro-area, as well as internal loans and investments in foreign subsidiaries. The
objective of the Group’s currency risk management is to limit the uncertainties associated with
foreign exchange rates and their effect on the Group’s profit, cash flows and balance sheet.
Transaction risk
Transaction risk is caused by foreign currency denominated items in the balance sheet and future
cash flows related to sales, purchases and return of capital. Transaction risk management aims to
hedge the Group’s profit against the effects of changes in foreign exchange rates.
The objective is to hedge 60–80% of highly probable commercial cash flows. The average hedging
ratio has remained at the target level. Hedging transactions are executed with forward exchange
contracts or options for the following 12 months at the most, predominantly following the pricing
periods of customers. Altia may apply cash flow hedge accounting to foreign exchange derivatives.
Intra-group loan arrangements are hedged by 100% and hedge accounting is not applied to these
arrangements.
The two tables below present the Group’s net currency position, first on the basis of financial
instruments recorded on the balance sheet and secondly including on a net basis also the esti-
mated future foreign currency net cash flows. The currency position resulting from the financial
instruments in accordance with IFRS 7 consists of trade receivables, trade payables, cash and cash
equivalents, the Group’s internal and external loans and derivative instruments.
The net currency risk has been taken into account in the table if the transaction currency is other
than the company’s functional currency.
TABLE 1: THE GROUP’S NET CURRENCY POSITION AT 31 DECEMBER
The net currency position resulting from the financial instruments in accordance with IFRS 7EUR million 2018 2017EUR-SEK -19.7 -19.5
EUR-NOK -0.8 -1.3
EUR-USD 4.5 3.9
EUR-AUD 2.1 1.7
The Group's net currency position at 31 December including also the hedged commercial cash flowsEUR million 2018 2017EUR-SEK 2.4 2.0
EUR-NOK 1.1 1.3
EUR-USD 0.6 0.1
EUR-AUD 0.1 0.0
146BOARD REPORT
BUSINESS OVERVIEW
CORPORATERESPONSIBILITY
CORPORATE GOVERNANCE
FINANCIAL STATEMENTS
ANNUAL REPORT2018

Translation risk
Translation risk is mainly caused by the parent company’s foreign currency denominated net
investments in foreign subsidiaries, which cause a translation difference in equity in the Group’s
balance sheet upon consolidation. The Group Treasury regularly analyses the translation risk and
reports any material issues to the management. The most significant net investments are denomi-
nated in the Swedish and Norwegian kroner. The translation risk has not been hedged.
2. Interest rate risk
The objective of interest rate risk management is to minimise the impact of fluctuations arising
from interest rate changes on the Group’s profit. At 31 December 2018 the total nominal amount
of loans was EUR 89.3 million (2017: 100.0) and was divided as follows:
• The EUR 20.0 million loan matures in January 2022 with annual EUR 5 million instalments.
The interest rate on the loan is based on three –month market rate. Currently these interest
payments are not hedged.
• The EUR 55.0 million portion of the loan matures in January 2023. The interest rate on the
loan is based on three-month market rate. Altia has hedged these interest payments to fixed
interest rate by using an interest rate derivative amounting to EUR 20 million. Hedge ac-
counting principles are applied to this interest rate derivative. The hedge has been regarded
as effective.
• The EUR 14.3 million pension loan matures in January 2028. The interest rate is fixed for the
whole loan period.
The maximum amount under Altia’s domestic commercial paper program is EUR 100 million.
There were no issued commercial papers at 31 December 2018 and 2017.
Altia’s maximum limit for sale of trade receivables amounts to EUR 145 million and is approved
by Board of Directors. The sold trade receivables are derecognised at the time of trade with no
obligation to repurchase. The related costs are recognised in other financial expenses. The trade
receivables are current receivables and the related interest rate risk is not hedged. The amount of
the sold trade receivables was EUR 80.2 million at 31 December 2018 (2017: 83.6 million).
3. Price risk associated with commodities
Barley
In 2018, Altia used approximately 212 (206) million kilos of Finnish barley to produce ethanol and
starch. The availability of high-quality domestic barley is ensured with contract cultivation and co-
operation with grain growers and grain handling companies. The market price of barley fluctuates
significantly year by year as a result of various factors that affect the Finnish barley supply and
demand and is therefore considered a significant risk for Altia. The price risk has not been hedged
with derivative instruments.
Electricity
Strong increase in the market price of electricity is a significant risk for Altia. The risk is managed
by following Altia’s principles for electricity procurement. These principles determine the hedging
limits, within which the electricity price risk is hedged. The hedges are done with OTC-derivatives
of Nasdaq OMX Oslo ASA. The hedging service for electricity procurement has been outsourced.
Cash flow hedge accounting in accordance with IFRS 9 is applied to the hedges against electric-
ity price risk, and hedge effectiveness is tested quarterly. The hedged risk is the euro dominated
sourcing of electricity in Finland. To hedge the risk system priced, Finnish price area and price area
derivative is used. With system priced derivatives is hedged Nordic electricity price and with price
area derivative is hedged the price difference between Finnish price area and system price.
At the end of 2018, the hedging ratio for deliveries for the next 12 months was 64.1% (2017:
67.6%), in line with the set targets. In 2018 the average hedging ratio was 68.0% (70.0%). All
hedging was effective in 2018 (ineffective portion 2017, EUR -0.1 million).
Altia purchases its electricity straight from the Nord Pool Spot markets as a delivery tied to the
spot price of the Finnish price area.
147BOARD REPORT
BUSINESS OVERVIEW
CORPORATERESPONSIBILITY
CORPORATE GOVERNANCE
FINANCIAL STATEMENTS
ANNUAL REPORT2018

Liquidity riskIn order to manage the liquidity risk, Altia continuously maintains sufficient liquidity reserves,
which at the end of 2018 comprised Group’s EUR 10 million overdraft facility and a EUR 60
million revolving credit facility. At the end of December 2018, no revolving credit facility was in
use (2017: EUR 10.0 million). The revolving credit facility matures in January 2023. More detailed
information on the Group’s external loans is provided in the interest rate risk section.
TABLE 3: LIQUIDITY RESERVES
Cash and cash equivalents and unused committed credit limitsEUR million 2018 2017Cash and cash equivalents 42.0 52.4
Overdraft facilities 10.0 10.0
Revolving credit line 60.0 50.0
TOTAL 112.0 112.4
4. Sensitivity to market risks
The following table describes the sensitivity of the Group’s profit and equity (before taxes) to
changes in electricity prices, interest and foreign exchange rates. When Altia applies hedge ac-
counting, the sensitivity is directed at equity. When hedge accounting is not applied, the sensitivity
is recognised as a potential impact on profit or loss.
The sensitivity to foreign exchange rate changes is calculated from the net currency position
resulting from financial instruments.
TABLE 2: SENSITIVITY ANALYSES
Sensitivity of financial instruments to market risks (before taxes) in accordance with IFRS 7EUR million
2018 2017
Income statement Equity
Income statement Equity
+/-10% electricity - +/-0.3 - +/-0.3
+/-10% change in EUR/NOK exchange rate +/-0.1 +/-0.1 -
+/-10% change in EUR/SEK exchange rate +/-2.0 +/-2.0 -
+/-10% change in EUR/USD exchange rate -/+0.5 -/+0.4 -
+/-10% change in EUR/AUD exchange rate -/+0.2 -/+0.2 -
+1%-points parallel shift in interest rates -0.5 +0.6 -0.7 0.8
+10 % increase in EUR/SEK exchange rate would have an EUR + 2.0 million effect in income statement. Other risks with same principle.
At the end of 2018 the total group floating rate liability position consists of floating rate liabilities
EUR 75.0 million (2017: EUR 85.0 million) and floating leg of interest rate swap EUR 20 million
(2017: EUR 20.0 million) which is netting the interest rate risk.
148BOARD REPORT
BUSINESS OVERVIEW
CORPORATERESPONSIBILITY
CORPORATE GOVERNANCE
FINANCIAL STATEMENTS
ANNUAL REPORT2018

TABLE 4: MATURITIES OF FINANCIAL LIABILITIES
Contractual payments on financial liabilities2018 EUR million
Cash flows 2019 Cash flows 2020 Cash flows 2021–
Total contractual
cash flowsFixed
rateVariable
rateRe-
paymentFixed
rateVariable
rateRe-
paymentFixed
rateVariable
rateRe-
paymentNon-derivative:
Loans from financial institutions1) -77.9 - -0.8 -5.0 - -0.7 -5.0 - -1.4 -65.0
Loans from pension institutions2) -15.1 -0.2 - -1.5 -0.1 - -1.5 -0.5 - -11.3
Finance lease liabilities 0.4 - - 0.2 - - 0.2 - - 0.0
Trade payables -25.8 - - -25.8 - - - - - -
Derivative:
Currency derivatives, hedge accounting
Inflow 30.9 - - 30.9 - - - - - -
Outflow -30.8 - - -30.8 - - - - - -
Currency derivatives, non-hedge accounting
Inflow 33.7 - - 33.7 - - - - - -
Outflow -33.6 - - -33.6 - - - - - -
Interest rate derivatives, hedge accounting -1.3 -0.3 - - -0.3 - - -0.7 - -
Commodity derivatives, hedge accounting -1.3 - - -0.9 - - -0.4 - - -0.1
TOTAL -120.9 -0.5 -0.8 -32.8 -0.5 -0.7 -6.7 -1.2 -1.4 -76.4
1) Loans from financial institutions mature 2022 and 20232) Loans from pension institutions mature 2028
149BOARD REPORT
BUSINESS OVERVIEW
CORPORATERESPONSIBILITY
CORPORATE GOVERNANCE
FINANCIAL STATEMENTS
ANNUAL REPORT2018

TABLE 4: MATURITIES OF FINANCIAL LIABILITIES
Contractual payments on financial liabilities2017 EUR million
Cash flows 2018 Cash flows 2019 Cash flows 2020–
Total contractual
cash flowsFixed
rateVariable
rateRe-
paymentFixed
rateVariable
rateRe-
paymentFixed
rateVariable
rateRe-
paymentNon-derivative:
Loans from financial institutions1) -88.6 - -0.7 -10.0 - -0.8 -5.0 - -2.2 -70.0
Loans from pension institutions2) -16.0 -0.1 - -0.8 -0.2 - -1.5 -0.7 - -12.8
Finance lease liabilities 0.4 - - 0.1 - - 0.1 - - 0.2
Trade payables -29.2 - - -29.2 - - - - - -
Derivative:
Currency derivatives, hedge accounting
Inflow 30.9 - - 30.9 - - - - - -
Outflow -30.2 - - -30.2 - - - - - -
Currency derivatives, non-hedge accounting
Inflow 24.8 - - 24.8 - - - - - -
Outflow -24.5 - - -24.5 - - - - - -
Interest rate derivatives, hedge accounting -1.4 -0.3 - - -0.3 - - -0.8 - -
Commodity derivatives, hedge accounting -0.3 - - 0.0 - - -0.1 - - -0.1
TOTAL -133.9 -0.4 -0.7 -38.8 -0.5 -0.8 -6.6 -1.5 -2.2 -82.61) Loans from financial institutions mature 2022 and 20232) Loans from pension institutions mature 2028
Credit riskThe objective of Altia’s credit risk management is to minimise the losses if one of the Group’s
counterparties fails to meet its obligations. The principles of credit risk management are described
in the Group’s credit policy.
Credit risks are caused by a counterparty not fulfilling its contractual payment obligations or the
counterparty’s credit rating changing in a manner that affects the market value of the financial
instruments it has issued.
The maximum amount of credit risk is equal to the carrying amount of the Group’s financial assets.
No significant risk concentrations relate to trade receivables. The aim is to minimise credit risks by
active credit management and by taking into account customers’ credit rating when determining
the payment term of invoices.
150BOARD REPORT
BUSINESS OVERVIEW
CORPORATERESPONSIBILITY
CORPORATE GOVERNANCE
FINANCIAL STATEMENTS
ANNUAL REPORT2018

4.2. CAPITAL RISK MANAGEMENT
The target of Altia’s capital management is to secure an effective capital structure that supports
the profitable growth of the operations. The Board of Directors monitors the Group’s capital
structure regularly.
Altia monitors its capital based on gearing (the ratio of interest-bearing net liabilities to equity).
Interest-bearing net liabilities consist of the loans less cash and cash equivalents. The current level
of gearing is distinctly lower than the limit determined in the Group’s loan terms.
During the business cycle, the company’s net gearing is likely to fluctuate, and the objective is to
retain a sufficiently strong capital structure to secure the Group’s financing needs. At 31 Decem-
ber 2018 and 31 December 2017, the gearing ratio was as follows:
TABLE 5: GEARING
Gearing as of 31 DecemberEUR million
2018 2017
Borrowings 89.4 100.1
Cash and cash equivalents 42.0 52.4
Net debt 47.4 47.7
Total equity 150.1 136.8
GEARING AT 31 DECEMBER 31.6% 34.9%
151BOARD REPORT
BUSINESS OVERVIEW
CORPORATERESPONSIBILITY
CORPORATE GOVERNANCE
FINANCIAL STATEMENTS
ANNUAL REPORT2018

5. Consolidation5.1. GENERAL CONSOLIDATION PRINCIPLES
ConsolidationConsolidation, consolidation method and classification of ownership interests depends
on whether the Group has power to control or jointly control the entity or have signifi-
cant influence or other interests in the entity. When the Group has power to control the
entity, it is consolidated as a subsidiary according to principles described in Note 5.2.
(p. 153) Subsidiaries. When the Group has joint control or significant influence over an
entity but does not have power to control, entity is accounted for by using the principles
set in Note 5.3. (p. 154). Associated companies and interests in joint operations. If the
Group does not have power to control nor significant influence in the entity, its owner-
ship interests are classified as Financial assets at fair value through other comprehen-
sive income and accounted for according to principles described in Note 3.2.1. (p. 134).
Foreign currency itemsThe consolidated financial statements are presented in euro, which is the functional and
presentation currency of the parent company. Transactions in foreign currencies are
translated to euro at average foreign exchange rates published by the European Central
Bank on banking days. Monetary assets and liabilities denominated in foreign currencies
at the reporting date are translated to euro at the average exchange rates prevailing at
that date. Foreign currency differences arising on translation are recognised in profit or
loss. Foreign exchange gains and losses related to purchases and sales are recognised in
the respective items and included in operating result. Foreign currency gains and losses
arising from loans denominated in foreign currencies are recognised in finance income
and expenses.
Income and expenses for the statements of comprehensive income of foreign subsid-
iaries that operate outside the eurozone are translated using the average rates of the
European Central Bank’s exchange rates at the end of the month. The statements of
financial position of foreign subsidiaries are translated using the average exchange rates
ruling at the reporting date. Foreign currency differences arising on the translation of
152BOARD REPORT
BUSINESS OVERVIEW
CORPORATERESPONSIBILITY
CORPORATE GOVERNANCE
FINANCIAL STATEMENTS
ANNUAL REPORT2018

profit or loss for the period with different exchange rates in the statement of comprehensive
income and in the balance sheet are recognised in other comprehensive income and included
in translation differences in equity. Changes in translation differences are recognised in other
comprehensive income.
In the consolidated financial statements, exchange rate differences arising from the trans-
lation of foreign currency denominated loans to foreign subsidiaries, which form a part of
net investments in foreign companies, are recognised in other comprehensive income and
included in translation differences within equity.
Translation differences arising from elimination of the cost of foreign subsidiaries and from
translation of the foreign subsidiaries’ post-acquisition profits and losses are recognised in
other comprehensive income and presented as a separate item within equity. Goodwill and
the fair value adjustments to the carrying amounts of assets and liabilities of foreign units are
accounted for as assets and liabilities of the respective foreign units, which are translated to
euro at the exchange rates prevailing at the reporting date. If these foreign units are entirely
or partly disposed of, related exchange rate differences are recognised in profit or loss as part
of the gain or loss on disposal.
5.2. SUBSIDIARIES
Subsidiaries consolidation principles Consolidated financial statements of Altia include the parent company, Altia Plc, and all
subsidiaries. Subsidiaries are all those in which the parent company exercises control. The
Group controls an entity when it is exposed, or has rights, to variable returns from its involve-
ment with the investee and has the ability to affect those returns through its power over the
investee. The financial statements of acquired subsidiaries are included in the consolidated
financial statements from the date that control commences until the date that control ceases.
All business combinations are accounted for by using the acquisition method. The consider-
ation transferred and the identifiable assets acquired and liabilities assumed in the acquired
company are measured at fair value at the acquisition date. The amount exceeding the
aggregate of the consideration transferred, the amount of non-controlling interests and any
previously held equity interest in the acquiree, over the fair value of the net assets acquired is
recorded as goodwill.
All acquisition-related costs, with the exception of costs to issue debt or equity securities, are
expensed. The consideration transferred does not include any transactions accounted for
separately from the acquisition. Any contingent consideration is recognised at fair value at
the acquisition date and it is classified as either liability or equity. Contingent consideration
classified as a liability is measured at fair value at each reporting date and any resulting gain or
loss is recognised in profit or loss.
Intra-group transactions, receivables, liabilities and unrealised gains, as well as the distribu-
tion of profits within the Group are eliminated in preparing the consolidated financial state-
ments. Unrealised losses are not eliminated if the loss in question results from impairment.
The Group had no non-controlling interests at 31 December 2018 or 31 December 2017.
153BOARD REPORT
BUSINESS OVERVIEW
CORPORATERESPONSIBILITY
CORPORATE GOVERNANCE
FINANCIAL STATEMENTS
ANNUAL REPORT2018

Altia Plc had 23 subsidiaries at the end of the reporting period
(23 subsidiaries at 31 December 2017).
Parent company's share of
ownership (%)
Group's share of
ownership (%)Country of
incorporationA-Beverages Oy 100.00 100.00 Finland
Altia Eesti AS 100.00 100.00 Estonia
Altia Denmark A/S 100.00 100.00 Denmark
Altia Holding Sweden AB 100.00 100.00 Sweden
SIA Altia Latvia 100.00 100.00 Latvia
Altia Norway AS 100.00 100.00 Norway
Altia Sweden AB - 100.00 Sweden
Altia Sweden Services AB - 100.00 Sweden
Alpha Beverages Oy 100.00 100.00 Finland
Best Buys International AS 100.00 100.00 Norway
BevCo AB - 100.00 Sweden
Bibendum AB - 100.00 Sweden
Bibendum AS 100.00 100.00 Norway
ExCellar Oy 100.00 100.00 Finland
Harald Zetterström oy/ab 100.00 100.00 Finland
Interbev AS 100.00 100.00 Norway
Larsen SAS 100.00 100.00 France
Philipson & Söderberg AB - 100.00 Sweden
Prime Wines Oy 100.00 100.00 Finland
Premium Wines AS 100.00 100.00 Norway
Ström AS 100.00 100.00 Norway
Vinuversum AB - 100.00 Sweden
Oy Wennerco Ab 100.00 100.00 Finland
5.3. ASSOCIATED COMPANIES AND INTERESTS IN JOINT OPERATIONS
Associated companiesAssociated companies are all entities over which the Group accompanies a shareholding of
over 20% of voting rights or otherwise has significant influence, but not control. Altia has an
investment in an associated company Palpa Lasi Oy.
Associated companies are consolidated by using the equity method. Under the equity meth-
od, the investment is initially recognised at cost and subsequently adjusted with the change in
the net assets of the investee after the acquisition date, consistent with the ownership inter-
est of the Group. After the acquisition the Group’s share in the associated company’s profit
and loss for the period is separately disclosed after operating result. If the Group’s share in
the associated company’s loss exceeds the carrying amount of the investment, the invest-
ment is recognised at zero value in the consolidated balance sheet and the loss exceeding the
carrying amount is not consolidated, unless the Group has committed to fulfil the company’s
obligations. An investment in an associated company includes goodwill arisen on acquisition.
The Group’s share in changes in the associated company’s other comprehensive income is
recognised in consolidated other comprehensive income.
Results from the transactions between the Group and its associates are recognised only to
the extent of unrelated investor’s interests in the associates. The Group determines at each
reporting date whether there is any objective evidence that the investment in the associate
is impaired. In case of such indications, the Group calculates the amount of impairment as
the difference between the recoverable amount of the associate and its’ carrying value. The
impairment is recognised in share of results in associated companies.
Financial statements of associated companies have been changed where necessary to corre-
spond with the accounting policies adopted by the Group. If financial statements for the peri-
od are not available, the share of the profit is included in the consolidated financial statements
based on the preliminary financial statements or latest available information.
154BOARD REPORT
BUSINESS OVERVIEW
CORPORATERESPONSIBILITY
CORPORATE GOVERNANCE
FINANCIAL STATEMENTS
ANNUAL REPORT2018

Interests in joint operationsA joint arrangement is an arrangement of which two or more parties have contractually
agreed joint control which exists only when decisions about the relevant activities require
the unanimous consent of the parties sharing control. A joint arrangement is either a joint
operation or a joint venture. Altia has an interest through a receivable in Roal Oy based on the
contractual relationship with the other party to the joint operation. The interest in Roal Oy is
accounted for as a joint operation.
ASSOCIATED COMPANIES AND JOINT OPERATIONS
2018Share of
ownership %
2017Share of
ownership %Roal Oy, Finland 50.00 50.00
Palpa Lasi Oy, Finland 25.53 25.53
Roal Oy engages enzyme business. The joint operation’s other owner is ABF Overseas Ltd.
Palpa Lasi Oy engages in the recycling and re-use of glass beverage packages.
Altia has joint control over Roal but the option right held by the other shareholder represents in
substance a receivable with a fixed rate of return and Altia does not have a right to 50% of the net
assets until the option lapses. Accordingly, the interest is classified as a joint operation with Altia
accounting for its share of assets as a receivable with the annual minimum dividend accounted
for as interest income. The receivable amounted to EUR 7.6 million as at 31 December 2018 and
31 December 2017.
FINANCIAL SUMMARY OF ASSOCIATED COMPANIES
EUR million 2018 2017Assets 7.6 5.9
Liabilities 6.3 7.3
Net assets 1.3 -1.5
Net sales 18.3 17.5
Result for the period 2.8 1.2
Related party transactions with associated companies and joint operations are
presented in Note 6.3. (p. 161).
155BOARD REPORT
BUSINESS OVERVIEW
CORPORATERESPONSIBILITY
CORPORATE GOVERNANCE
FINANCIAL STATEMENTS
ANNUAL REPORT2018

6. Other notes6.1. INCOME TAX EXPENSES
Income tax expensesThe Group’s income tax expense recognised through profit or loss comprises current
tax based on taxable income for the period, any adjustments to tax payable in respect
of previous periods and deferred taxes. Current income tax based on taxable income is
calculated according to the local tax regulations of each Group company.
Tax effects related to transactions or other events recognised in profit or loss are
recognised in profit or loss. If the taxes relate to items of other comprehensive income
or transactions or other events recognised directly in equity, income tax expense is
recognised within the respective items. The Group’s share of profit or loss in associated
companies is reported as calculated from the net profit and thus including the income
tax effect.
Deferred tax assets and liabilities are principally recognised for all temporary differenc-
es between the carrying amounts of assets and liabilities for financial reporting purposes
and the amounts used for taxation purposes. The most significant temporary differences
arise from property, plant and equipment and intangible assets, carry forward of unused
tax losses and fair value allocations on business combinations. Deferred tax assets
are recognised only to the extent that it is probable that future taxable profits will be
available against which they can be utilised. Deferred tax liabilities are recognised in full.
Deferred taxes are calculated using tax rates enacted or substantively enacted at the
end of the reporting period. Deferred tax is recognised for foreign subsidiaries undis-
tributed earnings only when related tax effects are probable.
Deferred tax assets and liabilities are set off when they are levied by same taxing au-
thority and Altia has legally enforceable right to set off the balances.
156BOARD REPORT
BUSINESS OVERVIEW
CORPORATERESPONSIBILITY
CORPORATE GOVERNANCE
FINANCIAL STATEMENTS
ANNUAL REPORT2018

Critical estimates and management judgements – Deferred tax assets:Judgment is required in assessing whether deferred tax assets are recognised on the balance
sheet. Deferred tax assets are recognised only where it is considered more likely than not
that they will be recovered, which is dependent on the generation of sufficient future taxable
profits. Assumptions about the generation of future taxable profits depend on management’s
estimates of future cash flows. These future cash flow estimates depend on estimates of future
sales volumes, price levels of main raw materials, capital expenditure and other components
affecting profitability of the operations. These estimates and assumptions are subject to risk
and uncertainty, hence it is possible that changes in circumstances will alter expectations, which
may impact the amount of deferred tax assets recognised on the balance sheet and the amount
of any other tax losses and temporary differences not yet recognised. Altia’s ability to generate
taxable profit is also subject to general economic, financial, competitive, legislative and regula-
tory factors that are beyond its control. If Altia generates lower future taxable profits than what
management has assumed in determining the amounts of the recognised deferred tax assets,
the assets would become impaired, either partly or in full. Accordingly, amounts recognised in
balance sheet could potentially be reversed through profit and loss. Changes in circumstances
may also result in recognition of deferred tax assets for tax losses not yet recognised as an asset.
INCOME TAX EXPENSE
EUR million 2018 2017Current income tax expense 3.8 6.3
Adjustments to taxes for prior periods 0.2 -0.2
Deferred taxes:
Origination and reversal of temporary differences 0.0 0.6
Impact of changes in tax rates -0.4 0.0
TOTAL 3.6 6.7
The reconciliation of the tax expense recognised in profit and loss and the tax expense calculated
using Altia Group's domestic corporate tax rate (20.0%):
EUR million 2018 2017Result before taxes 18.6 25.0
Income tax using the parent company’s tax rate 3.7 5.0
Effect of tax rates of subsidiaries in foreign jurisdictions 0.3 0.4
Tax-exempt income -0.3 -0.2
Non-deductible expenses 0.1 0.1
Utilisation of previously unrecognised tax losses -0.0 -0.4
Adjustments to taxes for prior periods 0.2 -0.2
Share of profit in associated companies, net of tax -0.1 -
Effect of changes in tax rates -0.4 0.0
Tax arising on dividends - 0.6
Tax on undistributed earnings -0.0 1.7
Other items 0.0 -0.3
TAX EXPENSE IN PROFIT OR LOSS 3.6 6.7
The year 2017 recognised tax expense on undistributed earnings, EUR 1.7 million, was due to the
reassessment of deferred tax liabilities of retained earnings in Estonia.
INCOME TAX RECOGNISED IN OTHER COMPREHENSIVE INCOME
2018EUR million
BeforeTax Tax
Net of Tax
Cash flow hedges 0.4 -0.1 0.3
Translation differences -3.5 - -3.5
Remeasurements of post-employment benefit obligations 0.0 -0.0 -0.0
TOTAL -3.1 -0.1 -3.2
2017EUR million
BeforeTax Tax
Net of Tax
Cash flow hedges 1.4 -0.3 1.1
Available-for-sale financial assets 0.6 - 0.6
Translation differences -4.0 - -4.0
Remeasurements of post-employment benefit obligations -0.0 0.0 -0.0
TOTAL -2.0 -0.3 -2.3
157BOARD REPORT
BUSINESS OVERVIEW
CORPORATERESPONSIBILITY
CORPORATE GOVERNANCE
FINANCIAL STATEMENTS
ANNUAL REPORT2018

DEFERRED TAX ASSETS AND LIABILITIES
Change in deferred tax assets and liabilities during 2018: EUR million 1 Jan 2018
Recognised in profit or loss
Recognised in other
comprehensive income
Exchange rate differences 31 Dec 2018
Deferred tax assets:
Tax losses 0.3 -0.2 - -0.0 0.1
Fixed assets 2.4 -0.4 - -0.0 2.0
Pension benefits 0.3 0.0 -0.0 -0.0 0.3
Provisions - 0.1 - - 0.1
Internal margin of inventories 0.1 0.0 - -0.0 0.1
Recognised in hedge reserve 0.1 - -0.1 - 0.0
Other temporary differences 0.2 -0.0 - -0.0 0.1
Total deferred tax assets 3.3 -0.4 -0.1 -0.0 2.7
Offset against deferred tax liabilities -2.3 -1.9
Net deferred tax assets 1.0 0.8
Deferred tax liabilities:
Fixed assets 5.2 -0.0 - -0.0 5.2
Recognised in hedge reserve 0.0 - 0.0 -0.0 0.0
Fair value allocation on acquisitions 2.7 -0.5 - -0.1 2.1
Deductable goodwill depreciation 10.4 -0.4 - -0.3 9.7
Undistributed profits of foreign subsidiaries 1.7 -0.0 - - 1.7
Other temporary differences 0.0 -0.0 - - 0.0
Total deferred tax liabilities 20.0 -0.9 0.0 -0.4 18.8
Offset against deferred tax assets -2.3 -1.9
Net deferred tax liabilities 17.7 16.8
158BOARD REPORT
BUSINESS OVERVIEW
CORPORATERESPONSIBILITY
CORPORATE GOVERNANCE
FINANCIAL STATEMENTS
ANNUAL REPORT2018

DEFERRED TAX ASSETS AND LIABILITIES
Change in deferred tax assets and liabilities during 2017: EUR million 1 Jan 2017
Recognised in profit or loss
Recognised in other
comprehensive income
Exchange rate differences 31 Dec 2017
Deferred tax assets:
Tax losses 0.2 0.1 - -0.0 0.3
Fixed assets 3.4 -1.1 - -0.0 2.4
Pension benefits 0.3 0.0 0.0 -0.0 0.3
Internal margin of inventories 0.1 0.0 - -0.0 0.1
Recognised in hedge reserve 0.4 - -0.3 -0.0 0.1
Other temporary differences 0.2 -0.0 - -0.0 0.2
Total deferred tax assets 4.6 -1.0 -0.3 -0.0 3.3
Offset against deferred tax liabilities -2.3
Net deferred tax assets 1.0
Deferred tax liabilities:
Fixed assets 5.2 -0.0 - -0.0 5.2
Recognised in hedge reserve 0.0 - 0.0 0.0 0.0
Fair value allocation on acquisitions 3.2 -0.4 - -0.1 2.7
Deductable goodwill depreciation 10.5 0.0 - -0.2 10.4
Undistributed profits of foreign subsidiaries - 1.7 - - 1.7
Other temporary differences 1.7 -1.6 - -0.0 0.0
Total deferred tax liabilities 20.7 -0.4 0.0 -0.3 20.0
Offset against deferred tax assets -2.3
Net deferred tax liabilities 17.7
At 31 December 2018, the Group had EUR 1.0 million (2017: EUR 5.6 million) of tax loss carry
forwards for which no deferred tax was recognised. EUR 1.0 million of these temporary differ-
ences expire in 4 years. Altia management estimates these losses arise in subsidiaries which have
neither indication of future taxable income nor other convincing evidence that tax losses can be
utilised and deferred tax asset be recognised in balance sheet.
159BOARD REPORT
BUSINESS OVERVIEW
CORPORATERESPONSIBILITY
CORPORATE GOVERNANCE
FINANCIAL STATEMENTS
ANNUAL REPORT2018

6.2. COLLATERALS, COMMITMENTS AND CONTINGENT ASSETS AND LIABILITIES
EUR million 2018 2017Collaterals and commitments
Collaterals given on behalf of Group companies
Mortgages 18.5 18.5
Guarantees 5.3 6.4
TOTAL COLLATERALS 23.8 24.9
Other commitments
Operating lease obligations
Less than one year 3.9 4.8
Between one and five years 9.3 11.5
More than five years 0.5 0.9
Total operating lease obligations 13.6 17.1
Other commitments 15.5 19.7
TOTAL COMMITMENTS 29.1 36.8
Collaterals given on behalf of Group companies all relate to commitments to authorities.
Operating lease obligations consists of office, cars and forklift rental commitments.
Other commitments include mainly purchase obligations of wine and cognac.
Assets not recognised in the balance sheet, emission allowancesThe Group participates in the European Union emission trading scheme, where it has been
granted a certain number of carbon dioxide emission allowances for a certain period of time,
free of charge. Altia Plc discloses its carbon dioxide emission allowances granted free of
charge on net basis. Following from this, the Group does not recognise in the balance sheet
the granted emission allowances, nor the obligation to deliver allowances corresponding to
the realised emissions. The Group does not recognise income or expenses arising from emis-
sion allowances through profit or loss when the emission allowances granted are sufficient to
cover the obligation to deliver allowances corresponding to the amount of emissions made.
If the realised emissions exceed the granted emission allowances, the obligation arising from
the excess emissions is recognised at fair value as a liability in the balance sheet at the report-
ing date. If the realised emissions fall below the granted emission allowances, the difference is
not recognised in the balance sheet but it is disclosed in the notes to the financial statements,
measured at fair value.
Altia´s actual emissions are below the emission allowances granted. The following table presents
changes in allowances for financial years 2018 and 2017, as well as their fair values:
Emission allowances, kilotons 2018 2017
Emission allowances received 26.9 27.4
Excess emission allowances from the previous period 45.6 39.2
Adjustments related to prior year's estimates 0.0 -0.0
Sold emission allowances -20.0 -
Realised emissions -21.9 -21.0
EMISSION ALLOWANCES AT 31 DECEMBER 30.6 45.6
Fair value of emission allowances at 31 December, EUR million 0.7 0.4
The emission allowances received during year 2018 and the realised emissions are estimates,
which will be adjusted during the spring 2019. Altia continues to operate within the emission
trading system for the trading period 2013–2020.
160BOARD REPORT
BUSINESS OVERVIEW
CORPORATERESPONSIBILITY
CORPORATE GOVERNANCE
FINANCIAL STATEMENTS
ANNUAL REPORT2018

6.3. RELATED PARTY TRANSACTIONS
The Company's related parties include the subsidiaries, associated companies and joint opera-
tions. The subsidiaries are presented in Note 5.2. (p. 153) and associated companies and joint
operations in Note 5.3. (p. 154). Related party transactions include such operations that are not
eliminated in the Group´s consolidated financial statements.
Related party also include the Board of Directors, the CEO, the members of the Executive
Management Team and their family members as well as entities controlled or jointly controlled
by these persons. Also entities that are controlled or jointly controlled by, or are associates of the
State, are related parties of Altia. Altia has applied the exemption to report only material transac-
tions with the government related entities. Transactions with related parties are entered into on
market terms. Altia has related party transactions on a continuous basis with its major customer
Alko. Transactions with Alko have been presented below under Other companies considered
related parties.
THE FOLLOWING TRANSACTIONS HAVE TAKEN PLACE WITH RELATED PARTIES
EUR million 2018 2017Sales of goods and services
Associates and joint operations 0.9 1.0
Other companies considered related parties 79.2 82.8
TOTAL 80.1 83.8
Purchases of goods and services
Associates and joint operations 2.8 2.1
Other companies considered related parties 1.3 4.1
TOTAL 4.1 6.2
Outstanding balances from sales and purchases of goods and services
Trade receivables
Associates and joint operations 0.1 0.2
Other companies considered related parties 3.2 2.8
Trade payables
Associates and joint operations 0.3 0.0
Other companies considered related parties 0.0 0.1
MANAGEMENT REMUNERATION
EUR million 2018 2017CEO
Salaries and other short-term employee benefits 0.3 0.3
Performance bonus and the bonuses from long-term incentive plan
0.3 0.3
Pension benefits 0.1 0.1
TOTAL 0.7 0.7
Members of the Executive Management Team (CEO not included)
Salaries and other short-term employee benefits 1.9 1.9
Pension benefits 0.3 0.3
TOTAL 2.2 2.2
Members and deputy members of the Board of Directors 0.3 0.2
No monetary loans have been granted to the CEO or the members of the Board of Directors, nor
any collaterals or commitments granted on their behalf.
The retirement age of the CEO of the parent company is 63 years.
161BOARD REPORT
BUSINESS OVERVIEW
CORPORATERESPONSIBILITY
CORPORATE GOVERNANCE
FINANCIAL STATEMENTS
ANNUAL REPORT2018

6.4. ADOPTION OF NEW OR AMENDED IFRS STANDARDS AND INTERPRETATIONS
Altia has adopted new accounting standards issued by the International Accounting Standards
Board, IFRS 15, Revenue from Contracts with Customers, and IFRS 9, Financial Instruments,
effective on January 1, 2018.
IFRS 15 Revenue Recognition Altia adopted the standard on January 1, 2018. The new standard replaced IAS 18 and IAS 11
standards and the related interpretations. The IABS has also issued clarifications to IFRS 15.
The amendments comprise clarifications of the guidance on identifying performance obligations,
accounting for licenses of intellectual property and the principal versus agent assessment (gross
versus net revenue presentation). The new standard is based on the principle that revenue is
recognised when control of a good or service transfers to a customer – so the notion of control
replaces the existing notion of risks and rewards. The new standard includes a five-step process
that Altia applies for contracts with customers before revenue is recognised.
The steps that are required to be followed for revenue recognition are the following:
1. identifying the contract
2. identifying the performance obligations
3. determining the transaction price
4. allocation of the transaction price to each performance obligation
(to each distinct good or service promised to the client) on a relative
stand-alone selling price basis
5. recognising the revenue when (or as) the performance obligation is
satisfied by transferring the good or service to the client.
Altia’s revenue comprises mainly sales of alcoholic products, which consists of a portfolio of Altia’s
own brands and international partner brands. Altia imports, sells and distributes wine, spirits and
other beverage products to monopolies, hotels, restaurants, catering business, retail business,
whole sale customers and export, border traffic and sea traffic customers. Altia also provides its in-
dustrial partners with solutions and services. Altia sells industrial products such as ethanol, starch
and feed components and offers contract manufacturing services from distillation to bottling and
customer services & logistics to its industrial customers.
Altia adopted the standard using the modified retrospective method which means that the com-
paratives are not restated and regarding Altia there were no material cumulative impact of the
adoption recognised in retained earnings as of 1 January 2018.
Identifying performance obligations:
In the alcoholic products and industrial product sales each delivered product or batches of
products are distinct performance obligations and the customer contracts do not typically contain
a separate promise for transportation service. Accordingly, even when the control of the goods
transfers to the customer before shipment, Altia does not arrange for the goods to be shipped and
does not offer any other transportation or handling service to its customers. If control does not
transfer to the customer before shipment, the transportation service is a fulfilment activity and
not a distinct service. Accordingly, the transportation service is not a separate performance obli-
gation to be accounted for separately from the sale of goods. In its partner supplier agreements,
which entitle Altia to distribute partners’ products, Altia acts as a principal towards the end cus-
tomer having control over the product, discretion in establishing prices and owning the inventory.
Accordingly, revenue recognised is the gross amount to which Altia is entitled to in these product
sales.
In the contract services to Altia’s industrial customers the contracts essentially include of a single
performance obligation, being a series of distinct services such as contract manufacturing servic-
es, customer services, logistics and warehousing. In these arrangements Altia does not have any
control over the product or inventory risk.
Determining the transaction price:
Contracts with customers typically include several variable considerations (volume discounts,
bonuses, marketing support such as slotting fees, sanctions relating to certain predetermined
KPIs or Altia’s failure to timely perform its obligations, product returns, differences between a
standard cost price and actual costs etc.). Under IFRS 15, an entity needs to estimate the variable
consideration and include in the transaction price an amount that fulfils the highly probable crite-
rion. However, Altia has already under the previous revenue recognition standards estimated the
162BOARD REPORT
BUSINESS OVERVIEW
CORPORATERESPONSIBILITY
CORPORATE GOVERNANCE
FINANCIAL STATEMENTS
ANNUAL REPORT2018
variable considerations as part of its revenue recognition process. In addition, Altia has been able
to reliably estimate the outcome and therefore, management’s view is that the highly probable
criterion is typically met. Further, the amount of realised sanctions is immaterial and therefore, no
adjustments to the transaction price were needed at transition.
With respect to right of return clauses Altia has previously recognised revenue for the transferred
products in the amount of consideration to which it expects to be entitled and a refund liability
related to the products that are expected to be returned, Under IFRS 15 Altia need to recognise
a separate asset on its balance sheet reflecting the right to receive the goods. Previously Altia has
recognised refund liability and inventory balances as a net amount but under IFRS 15 the amount
is shown as gross amount meaning a separate contract asset and corresponding liability. The
presentation would have increased the total assets and total liabilities by EUR 2.1 million on 31
December 2017. Under IFRS 15, slotting fees are recognised as a reduction of revenue. Previous-
ly the amounts were recognised as expenses. The identified classification differences in regard to
returns and slotting fees are not material for Altia.
Allocation of the transaction price:
In general, the prices represent the stand-alone selling prices and accordingly there is no need to
allocate standalone selling price. Further, management view is that the allocation of discounts to
each element in the contract would not result any differences in the amount or timing of revenue
recognised because the control of all ordered goods transfers at the same time. In the contract
services requirements to allocate variable consideration to a distinct service within the series are
met and therefore Altia allocates and recognises variable consideration in the period it has the
contractual right to the fee.
Recognising revenue:
There were no significant changes to the timing of revenue recognition as a result of adopting
IFRS 15. Altia does not have any incremental costs of obtaining a contract (e.g. sales bonuses) or
contract costs to fulfill a contract which would be eligible for capitalisation under IFRS 15.
IFRS 9 Financial Instruments Altia adopted the standard on January 1, 2018. In accordance with transitional provisions, com-
parative figures have not been restated. All financial assets are subsequently measured at amor-
tised cost, FVOCI or FVPL based on the business model for managing the financial assets and their
contractual cash flow characteristics. The IFRS 9 classification did not cause relevant changes in
handling these items. Financial assets are derecognized once the group has lost the contractual
right to their cash flows or when it has substantially transferred their risks and rewards to a party
outside the Group.
The derecognition rules under IFRS 9 are a continuum of the provisions of IAS 39 Financial In-
struments: Recognition and Measurement. Altia’s factoring process is on a non-recourse basis i.e.
all rights related to the sold account receivables are transferred to the buyer. The derecognition
criterias of IAS 39 continue to be fulfilled under IFRS 9.
163BOARD REPORT
BUSINESS OVERVIEW
CORPORATERESPONSIBILITY
CORPORATE GOVERNANCE
FINANCIAL STATEMENTS
ANNUAL REPORT2018
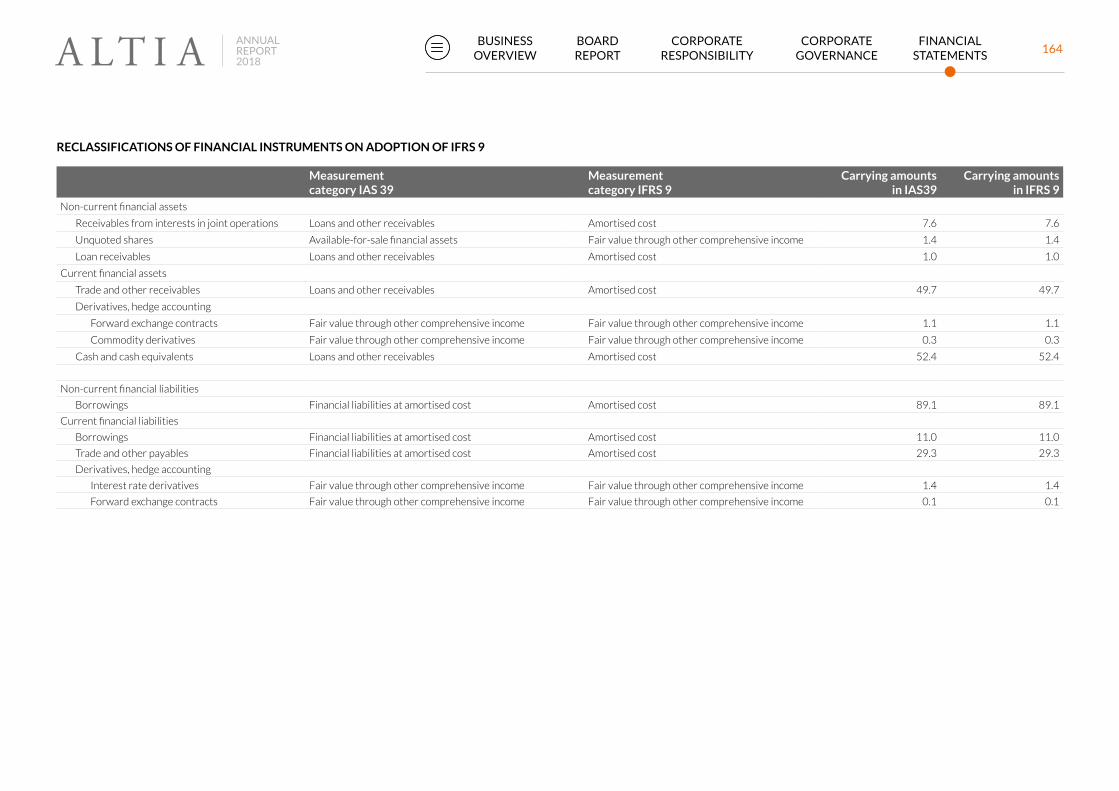
RECLASSIFICATIONS OF FINANCIAL INSTRUMENTS ON ADOPTION OF IFRS 9
Measurement category IAS 39
Measurement category IFRS 9
Carrying amounts in IAS39
Carrying amounts in IFRS 9
Non-current financial assets
Receivables from interests in joint operations Loans and other receivables Amortised cost 7.6 7.6
Unquoted shares Available-for-sale financial assets Fair value through other comprehensive income 1.4 1.4
Loan receivables Loans and other receivables Amortised cost 1.0 1.0
Current financial assets
Trade and other receivables Loans and other receivables Amortised cost 49.7 49.7
Derivatives, hedge accounting
Forward exchange contracts Fair value through other comprehensive income Fair value through other comprehensive income 1.1 1.1
Commodity derivatives Fair value through other comprehensive income Fair value through other comprehensive income 0.3 0.3
Cash and cash equivalents Loans and other receivables Amortised cost 52.4 52.4
Non-current financial liabilities
Borrowings Financial liabilities at amortised cost Amortised cost 89.1 89.1
Current financial liabilities
Borrowings Financial liabilities at amortised cost Amortised cost 11.0 11.0
Trade and other payables Financial liabilities at amortised cost Amortised cost 29.3 29.3
Derivatives, hedge accounting
Interest rate derivatives Fair value through other comprehensive income Fair value through other comprehensive income 1.4 1.4
Forward exchange contracts Fair value through other comprehensive income Fair value through other comprehensive income 0.1 0.1
164BOARD REPORT
BUSINESS OVERVIEW
CORPORATERESPONSIBILITY
CORPORATE GOVERNANCE
FINANCIAL STATEMENTS
ANNUAL REPORT2018

Impairment
The new impairment model requires the recognition of impairment provisions based on expected
credit losses (ECL) rather than on an incurred credit loss basis as was the case under IAS 39.
The new impairment model requirement applies to financial assets classified at amortised cost,
debt instruments measured at FVOCI, contract assets under IFRS 15 Revenue from Contracts
with Customers, lease receivables, loan commitments and certain financial guarantee contracts.
The loss allowance for account receivables is based on the aging of the accounts receivable re-
gional portfolios. The expected loss rate for all trade receivables is 0,1% and in addition receiv-
ables more than 120 days due are impaired with 60% expected loss rate. The receivables of the
monopolies in Finland and Sweden are excluded due to the nature of the customer and related
credit risk. Forward looking macro-economic information has been included in the analysis.
Adoption of the ECL model resulted decrease in loss provision as 1.1.2018 and Altia adjusted the
opening balance of its retained earnings of EUR 0.1 million.
Financial liabilities
Adoption of IFRS 9 had no impact on Altia’s classification and measurement of financial liabilities,
as the new requirements only affect the accounting for financial liabilities that are designated at
fair value through profit or loss and Altia does not have such liabilities.
Debt modification
Under IFRS 9 when a financial liability measured at amortised cost is modified without the
transaction resulting in a derecognition event, a gain or loss should be recognised directly in profit
or loss. These modified rules do not have an impact for Altia as it has not changed the terms and
conditions for any existing borrowings that would have resulted in modification accounting under
IAS 39.
Hedge accounting
The new hedge accounting rules align the accounting for the hedging instruments more closely
with the entity’s risk management practices. As a general rule, more hedge relationships might be
eligible for hedge accounting, as the standard introduces a more principles-based approach.
The Group applies hedge accounting for certain interest rate, foreign currency and electricity
derivatives. The group has confirmed that its previous hedge relationships qualify as continuing
hedges upon the adoption of IFRS 9.
For cash flow foreign currency hedges under IFRS 9, Altia designates the full fair value of the
forward contract to the hedge relationship and accordingly, no longer bifurcate the forward points
for separate recognition through the P/L. This is a change Altia has selected at the adoption date,
however, the effect is considered to be insignificant and not adjusted in the opening balance of
retained earnings.
IFRS 9 allows hedging a component of the risk. This change increases the effectiveness of the
electricity hedges and all hedging is classified as effective.
The interest rate swaps hedge the floating rate borrowings and the current hedge relationships
continue under IFRS 9 with no change.
Disclosures
The new standard also introduces expanded disclosure requirements and changes in presentation.
New standards
Altia has not yet adopted the following new and amended standards and interpretations already
issued by the IASB. The Group will adopt them as of the effective date of each standard and inter-
pretation or, if the date is other than the first day of the reporting period, from the beginning of
the subsequent reporting period.
IFRS 16 Leases(effective for annual periods beginning on or after 1 January 2019):
IFRS 16 Leases is effective on 1 January 2019 and the new standard will affect primarily the
accounting by lessees and will result in the recognition of almost all leases on the balance sheet.
The new lease standard removes the current distinction between operating and finance leases
and requires recognition of an asset (the right to use the leased item) and a financial liability to pay
rentals for the majority of Altia’s lease contracts. An optional exemption exists for short-term and
165BOARD REPORT
BUSINESS OVERVIEW
CORPORATERESPONSIBILITY
CORPORATE GOVERNANCE
FINANCIAL STATEMENTS
ANNUAL REPORT2018

low-value leases. The income statement will also be affected because the total expense is typically
higher in the earlier years of a lease and lower in later years. Additionally, operating expense will
be replaced with interest cost and depreciation, so Altia’s key metrics like EBITDA will change.
Operating cash flows presented in the cash flow statement will be higher as cash payments for the
principal portion of the lease liability are classified within financing activities. Only the part of the
payments that reflect interest cost will continue to be presented as operating cash flows.
Based on Altia’s preliminary impact assessment which is subject to changes, the implementation of
IFRS 16 will increase the property, plant and equipment in its balance sheet, mainly due to current
operating leases of premises, warehouses, cars and forklifts. In the opening balance of January
2019 when implementing IFRS 16 and calculated according the standard the Group’s right of use
assets and corresponding interest-bearing liabilities are estimated to be EUR 10.5 million. In the
consolidated income statement, the operating expense will decrease approximately EUR 3-4 mil-
lion, while depreciation and interest costs will reflect an increase as the lease expense is no longer
classified as an operating expense. This will lead to an improvement in EBITDA. The analysis will be
completed during the first quarter of 2019.
Altia implements the standard by using a simplified approach (modified retrospective approach),
where comparative figures will not be restated. Altia will recognise the accumulated effect of
adopting IFRS 16 as an adjustment to equity at the beginning of 2019. Furthermore, Altia uses the
other available reliefs to the widest possible extent, including the exclusion of leases with a term to
maturity of less than 12 months and low-value leases.
Other forthcoming amendments to IFRS standards and IFRIC interpretations that the Group is
aware of are not assessed to have a material impact on Altia’s consolidated financial statements.
6.5. EVENTS AFTER THE REPORTING PERIOD
On 30 January, the proposals by the Shareholders’ Nomination Board to the Annual General
Meeting were announced. The Nomination Board proposes that the number of members of the
Board of Directors be seven and that the present members Kim Henriksson, Tiina Lencioni, Jukka
Ohtola, Torsten Steenholt, Sanna Suvanto-Harsaae and Kai Telanne be re-elected and Anette
Rosengren be elected as a new member.
Further, the Nomination Board proposes that the remuneration to be paid to the members of the
Board of Directors during the next term consist of a monthly term of office fee as follows: EUR 4
000 per month, Chairman; EUR 2 500 per month, Vice Chairman; EUR 2 000 per month, member.
In addition to the monthly fee, the Board members would receive a meeting fee for the Board of
Directors and Board Committee meetings of EUR 600 per meeting for Board members residing
in Finland and EUR 1 200 per meeting for Board members residing abroad. Travel expenses would
be reimbursed in accordance with the company’s travel policy.
166BOARD REPORT
BUSINESS OVERVIEW
CORPORATERESPONSIBILITY
CORPORATE GOVERNANCE
FINANCIAL STATEMENTS
ANNUAL REPORT2018
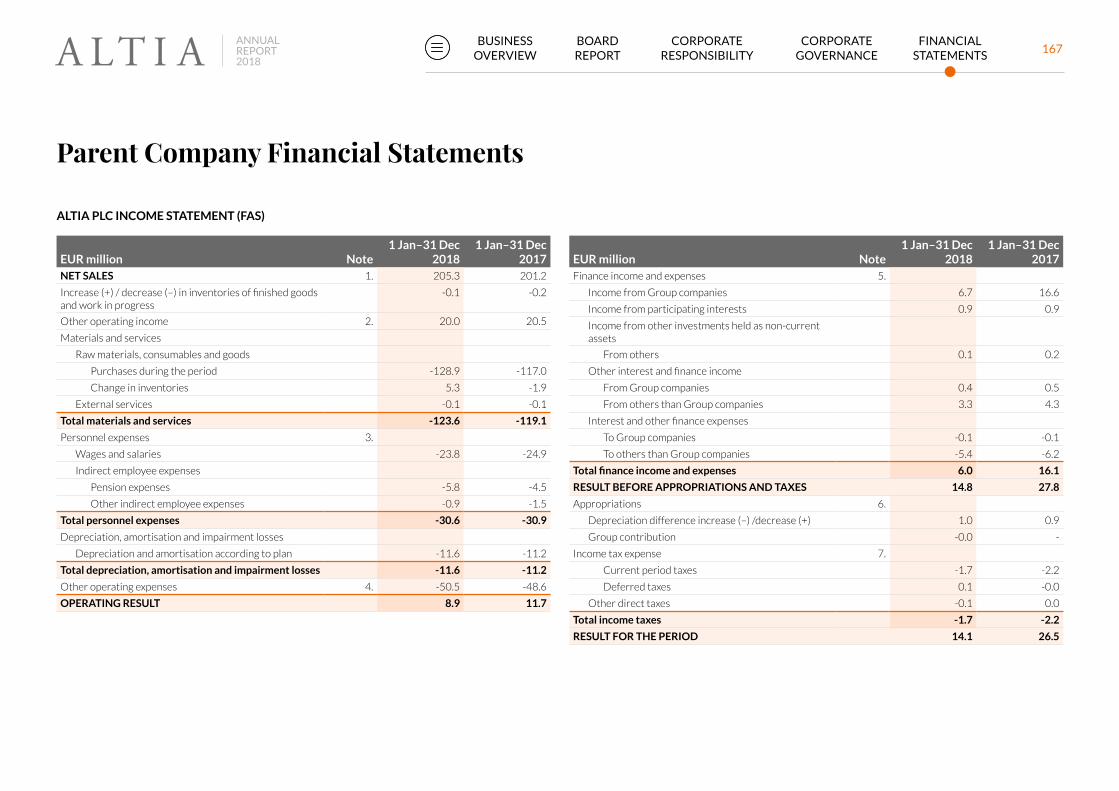
Parent Company Financial Statements
ALTIA PLC INCOME STATEMENT (FAS)
EUR million Note1 Jan–31 Dec
20181 Jan–31 Dec
2017NET SALES 1. 205.3 201.2
Increase (+) / decrease (–) in inventories of finished goods and work in progress
-0.1 -0.2
Other operating income 2. 20.0 20.5
Materials and services
Raw materials, consumables and goods
Purchases during the period -128.9 -117.0
Change in inventories 5.3 -1.9
External services -0.1 -0.1
Total materials and services -123.6 -119.1
Personnel expenses 3.
Wages and salaries -23.8 -24.9
Indirect employee expenses
Pension expenses -5.8 -4.5
Other indirect employee expenses -0.9 -1.5
Total personnel expenses -30.6 -30.9
Depreciation, amortisation and impairment losses
Depreciation and amortisation according to plan -11.6 -11.2
Total depreciation, amortisation and impairment losses -11.6 -11.2
Other operating expenses 4. -50.5 -48.6
OPERATING RESULT 8.9 11.7
EUR million Note1 Jan–31 Dec
20181 Jan–31 Dec
2017Finance income and expenses 5.
Income from Group companies 6.7 16.6
Income from participating interests 0.9 0.9
Income from other investments held as non-current assets
From others 0.1 0.2
Other interest and finance income
From Group companies 0.4 0.5
From others than Group companies 3.3 4.3
Interest and other finance expenses
To Group companies -0.1 -0.1
To others than Group companies -5.4 -6.2
Total finance income and expenses 6.0 16.1
RESULT BEFORE APPROPRIATIONS AND TAXES 14.8 27.8
Appropriations 6.
Depreciation difference increase (–) /decrease (+) 1.0 0.9
Group contribution -0.0 -
Income tax expense 7.
Current period taxes -1.7 -2.2
Deferred taxes 0.1 -0.0
Other direct taxes -0.1 0.0
Total income taxes -1.7 -2.2
RESULT FOR THE PERIOD 14.1 26.5
167BOARD REPORT
BUSINESS OVERVIEW
CORPORATERESPONSIBILITY
CORPORATE GOVERNANCE
FINANCIAL STATEMENTS
ANNUAL REPORT2018

ALTIA PLC BALANCE SHEET (FAS)
EUR million Note31 Dec
201831 Dec
2017ASSETS
NON-CURRENT ASSETS 8.
Intangible assets
Intangible rights 12.0 12.6
Other capitalised long-term expenditure 7.7 9.3
Prepayments 1.7 2.8
Intangible assets total 21.4 24.7
Tangible assets
Land and water areas 2.4 2.5
Buildings and structures 21.9 23.0
Machinery and equipment 27.8 25.0
Other tangible assets 0.5 0.5
Prepayments and assets under construction 1.5 4.7
Tangible assets total 54.2 55.6
Investments
Holdings in Group companies 206.8 206.8
Participating interests 8.0 8.0
Other shares and investments 0.8 0.8
Investments total 215.7 215.7
TOTAL NON-CURRENT ASSETS 291.3 296.0
EUR million Note31 Dec
201831 Dec
2017CURRENT ASSETS
Inventories 9.
Materials and supplies 21.8 16.5
Work in progress 10.3 12.5
Finished goods 11.6 9.5
Inventories total 43.7 38.5
Non-current receivables 10.
Receivables from Group companies 15.8 17.8
Deferred tax assets 0.5 0.5
Non-current receivables total 16.3 18.3
Current receivables 11.
Trade receivables 25.3 20.1
Receivables from Group companies 12.2 9.8
Receivables from participating interest undertakings 0.1 0.2
Other receivables 0.0 -
Accrued income and prepaid expenses 3.6 2.8
Current receivables total 41.3 32.9
Cash at hand and in banks 40.6 49.4
TOTAL CURRENT ASSETS 141.9 139.1
TOTAL ASSETS 433.2 435.1
168BOARD REPORT
BUSINESS OVERVIEW
CORPORATERESPONSIBILITY
CORPORATE GOVERNANCE
FINANCIAL STATEMENTS
ANNUAL REPORT2018
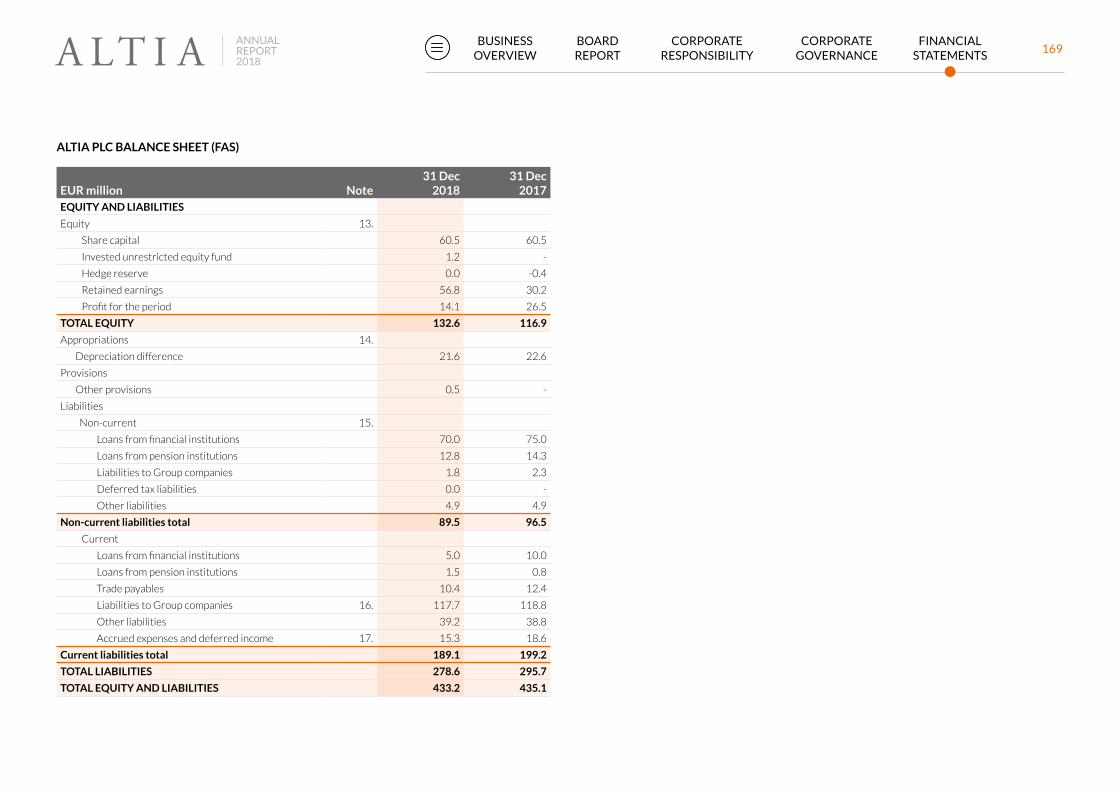
ALTIA PLC BALANCE SHEET (FAS)
EUR million Note31 Dec
201831 Dec
2017EQUITY AND LIABILITIES
Equity 13.
Share capital 60.5 60.5
Invested unrestricted equity fund 1.2 -
Hedge reserve 0.0 -0.4
Retained earnings 56.8 30.2
Profit for the period 14.1 26.5
TOTAL EQUITY 132.6 116.9
Appropriations 14.
Depreciation difference 21.6 22.6
Provisions
Other provisions 0.5 -
Liabilities
Non-current 15.
Loans from financial institutions 70.0 75.0
Loans from pension institutions 12.8 14.3
Liabilities to Group companies 1.8 2.3
Deferred tax liabilities 0.0 -
Other liabilities 4.9 4.9
Non-current liabilities total 89.5 96.5
Current
Loans from financial institutions 5.0 10.0
Loans from pension institutions 1.5 0.8
Trade payables 10.4 12.4
Liabilities to Group companies 16. 117.7 118.8
Other liabilities 39.2 38.8
Accrued expenses and deferred income 17. 15.3 18.6
Current liabilities total 189.1 199.2
TOTAL LIABILITIES 278.6 295.7
TOTAL EQUITY AND LIABILITIES 433.2 435.1
169BOARD REPORT
BUSINESS OVERVIEW
CORPORATERESPONSIBILITY
CORPORATE GOVERNANCE
FINANCIAL STATEMENTS
ANNUAL REPORT2018
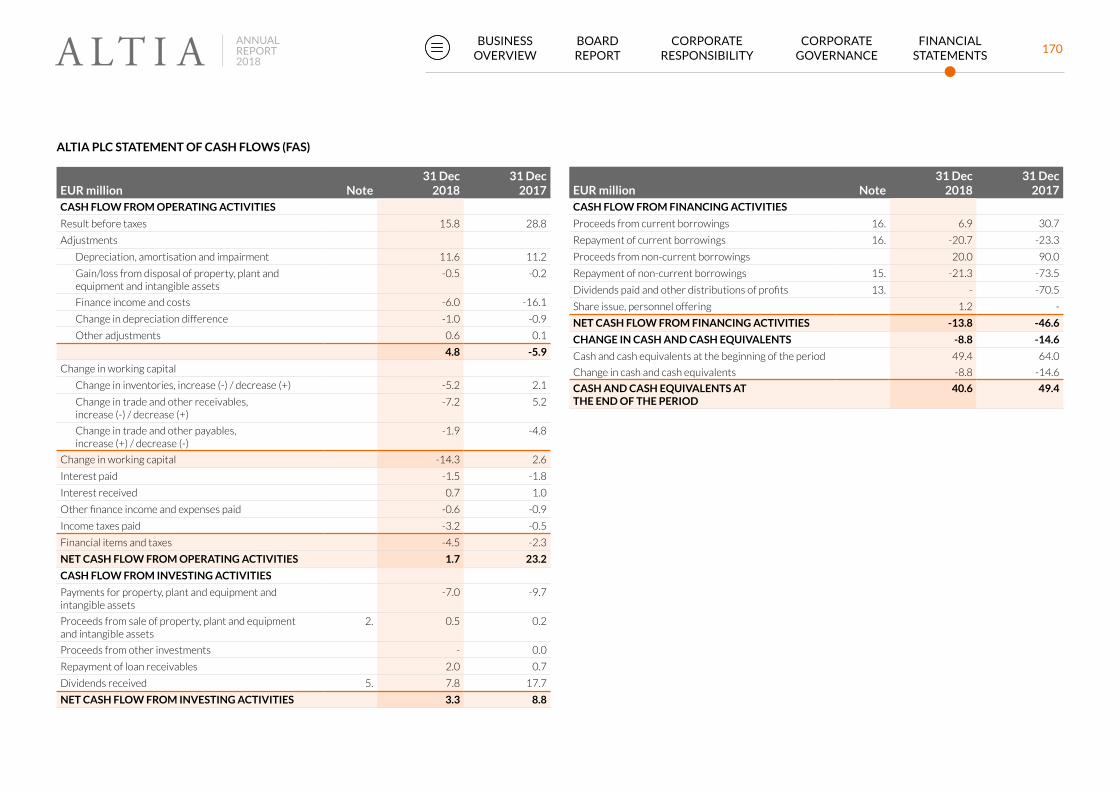
ALTIA PLC STATEMENT OF CASH FLOWS (FAS)
EUR million Note31 Dec
201831 Dec
2017CASH FLOW FROM OPERATING ACTIVITIES
Result before taxes 15.8 28.8
Adjustments
Depreciation, amortisation and impairment 11.6 11.2
Gain/loss from disposal of property, plant and equipment and intangible assets
-0.5 -0.2
Finance income and costs -6.0 -16.1
Change in depreciation difference -1.0 -0.9
Other adjustments 0.6 0.1
4.8 -5.9
Change in working capital
Change in inventories, increase (-) / decrease (+) -5.2 2.1
Change in trade and other receivables, increase (-) / decrease (+)
-7.2 5.2
Change in trade and other payables, increase (+) / decrease (-)
-1.9 -4.8
Change in working capital -14.3 2.6
Interest paid -1.5 -1.8
Interest received 0.7 1.0
Other finance income and expenses paid -0.6 -0.9
Income taxes paid -3.2 -0.5
Financial items and taxes -4.5 -2.3
NET CASH FLOW FROM OPERATING ACTIVITIES 1.7 23.2
CASH FLOW FROM INVESTING ACTIVITIES
Payments for property, plant and equipment and intangible assets
-7.0 -9.7
Proceeds from sale of property, plant and equipment and intangible assets
2. 0.5 0.2
Proceeds from other investments - 0.0
Repayment of loan receivables 2.0 0.7
Dividends received 5. 7.8 17.7
NET CASH FLOW FROM INVESTING ACTIVITIES 3.3 8.8
EUR million Note31 Dec
201831 Dec
2017CASH FLOW FROM FINANCING ACTIVITIES
Proceeds from current borrowings 16. 6.9 30.7
Repayment of current borrowings 16. -20.7 -23.3
Proceeds from non-current borrowings 20.0 90.0
Repayment of non-current borrowings 15. -21.3 -73.5
Dividends paid and other distributions of profits 13. - -70.5
Share issue, personnel offering 1.2 -
NET CASH FLOW FROM FINANCING ACTIVITIES -13.8 -46.6
CHANGE IN CASH AND CASH EQUIVALENTS -8.8 -14.6
Cash and cash equivalents at the beginning of the period 49.4 64.0
Change in cash and cash equivalents -8.8 -14.6
CASH AND CASH EQUIVALENTS AT THE END OF THE PERIOD
40.6 49.4
170BOARD REPORT
BUSINESS OVERVIEW
CORPORATERESPONSIBILITY
CORPORATE GOVERNANCE
FINANCIAL STATEMENTS
ANNUAL REPORT2018

Notes to Altia Plc financial statementsAccounting policies for financial statements
The financial statements of the parent company are prepared in accordance with the Finnish
accounting legislation.
Non-current assets and depreciations
Non-current assets are recognised in the balance sheet at acquisition cost less depreciations.
The depreciation periods for non-current assets are:
Trademarks 10–15 years
IT- development and software 3–5 years
Buildings and structures 10–40 years
Machinery and equipment 10 years
Other tangible assets 3–10 years
Inventories
Inventories are measured at the lower of cost and net realisable value. Self-manufactured prod-
ucts are measured at standard prices, except cognac products, which are measured at weighted
average cost. Fixed production costs are allocated to the cost of own production. Raw materials,
supplies and trading goods are measured at weighted average cost. Repacked trading goods are
measured at standard cost in repacking plant.
The cost of finished products and work in progress includes raw materials, direct labour costs,
other direct costs as well as an allocable proportion of variable procurement and production costs
and fixed overheads in case of finished products, determined based on normal operating capacity.
Net realisable value is the estimated selling price in the ordinary course of business, less the esti-
mated costs of completion and the estimated costs necessary to make the sale.
Pension plans
The pension plans of the parent company are arranged through pension insurance companies.
Pension expenses are accrued to correspond to the performance-based salaries in the financial
statements.
Cash Pool
The Group has applied the so called cash pool arrangement, which enables efficient management
of the parent company's and subsidiaries' cash and cash equivalents.
Leases
All lease payments are recognised as rental expenses.
Financial Derivatives
Fair value measurement compliant with Chapter 5, section 2a of the Accounting Act is applied to
the accounting treatment of financial derivatives.
Derivatives are included in financial assets and liabilities at fair value through profit or loss when
they do not meet the criteria of hedge accounting. These derivatives are recognised at fair value
on the trade date and they are subsequently measured at fair value at the reporting date. The
fair values of derivatives equal the amount that Altia Plc would have to pay or it would receive
from the termination of the derivative contract at the reporting date. The fair values of forward
exchange contracts are determined by using the market prices at the reporting date. The fair
values of interest rate derivatives are determined by discounting the related future cash flows.
The valuation of commodity derivatives is determined based on the fair values received from the
financial markets.
All derivatives for which fair value is measured or disclosed in the financial statements are cate-
gorised within the fair value hierarchy level 1–3. The levels of fair value hierarchy reflect the signif-
icance of inputs used in determining the fair values. In level one, fair values are based on public
quotations of identical financial instruments. In level two, the inputs used in determining the fair
values are based on quoted market rates and prices observable for the asset or liability in question
directly (i.e. price) or indirectly on discounted future cash flows. Fair values of other financial
assets and liabilities in level two reflect their carrying value. In level three, the fair values of assets
and liabilities are based on inputs that are not based on observable market data for all significant
variables, and instead are, to a significant extent, based on management estimates and their use in
generally accepted valuation techniques.
The fair values of the financial instruments are determined by using the market prices on the
closing date of the reporting period.
171BOARD REPORT
BUSINESS OVERVIEW
CORPORATERESPONSIBILITY
CORPORATE GOVERNANCE
FINANCIAL STATEMENTS
ANNUAL REPORT2018

Hedge accounting
The parent company applies hedge accounting when the change in fair value is recognised in the
hedge reserve under equity. In Altia Plc, cash flow hedging is applied to part of the interest rate,
foreign currency and electricity derivatives based on case-by-case assessment. In cash flow hedg-
ing, Altia Plc is hedging against changes in cash flows related to a specific asset or liability recog-
nised in the balance sheet or to a highly probable future business transaction. In the beginning of
the hedging arrangement, company documents the relationship between each hedging instrument
and hedged item, as well as the objectives of risk management and the strategy in engaging in
hedging. The effectiveness of hedging instruments is tested prospectively according to IFRS 9.
Effectiveness means the ability of a hedging instrument to offset the changes in the fair value of
the hedged item or changes in the cash flows of the hedged transaction attributable to the hedged
risk. The hedging relationship is regarded to be highly effective when there is an economic rela-
tionship between the hedged item and the value of the hedging instrument and the value of the
hedged item moves to the opposite direction due to same risk. Hedge accounting is discontinued
when the criteria for hedge accounting is no longer met.
The gains and losses arising from fair value changes of derivative contracts, to which hedge
accounting is applied, are presented in congruence with the hedged item. The effective portion of
the unrealised changes in the fair value of derivatives designated and qualifying as cash flow hedg-
es are recognised in the hedge reserve in equity. The ineffective portion is immediately recognised
in profit or loss in finance income or expense.
The cumulative gain or loss in equity on derivative instruments related to commercial items is
recognised in profit or loss as an adjustment to purchases or sales simultaneously with the hedged
item in the period in which the hedged item affects profit or loss. Realised gain or loss on electrici-
ty derivatives is included in operating result in electricity procurement expenses. When a hedging
instrument designated as a cash flow hedge expires, is sold or no longer meets the criteria of
hedge accounting, the gain or loss accumulated in equity is recognised through profit or loss either
as an adjustment to purchases or sales when hedging is effective or as finance income or expense
when hedge accounting criteria is not met.
Research and development expenditure
Research and development expenditure is recognised as an annual expense as incurred.
Financial securities
Financial securities are recognised at acquisition cost or lower.
Receivables
Receivables are measured at acquisition cost or probable value, if lower.
Sale of trade receivables
The sold receivables are derecognised when the receivable has been sold and the sales price for it
has been received. The related costs are recognised in other financial expenses.
Non-current financial liabilities
Non-current financial liabilities are recognised at acquisition cost.
Income taxes
Income taxes in the income statement include taxes calculated for the financial year based on
Finnish tax legislation, adjustments to taxes in previous financial years and the change in deferred
taxes.
Foreign currency denominated items
Foreign currency denominated receivables and liabilities are translated to Finnish currency at the
rates of the closing date of the reporting period.
172BOARD REPORT
BUSINESS OVERVIEW
CORPORATERESPONSIBILITY
CORPORATE GOVERNANCE
FINANCIAL STATEMENTS
ANNUAL REPORT2018

1. NET SALES
EUR million 2018 2017Net sales by business areas
Alcohol beverages 100.7 103.3
Industrial services 102.8 95.5
Other 1.8 2.4
TOTAL 205.3 201.2
Net sales by geographic areas
Finland 154.9 153.1
Europe 49.3 46.3
Rest of the world 1.0 1.8
TOTAL 205.3 201.2
2. OTHER OPERATING INCOME
EUR million 2018 2017Rental income 1.0 1.0
Income from energy sales 3.4 3.4
Proceeds from disposal of non-current assets 0.5 0.2
Service income 13.3 14.4
Other income 1.8 1.6
TOTAL 20.0 20.5
3. NOTES RELATED TO PERSONNEL
EUR million 2018 2017Wages and salaries 23.8 24.9
Pension expenses 5.8 4.5
Other social expenses 0.9 1.5
TOTAL 30.6 30.9
EUR million 2018 2017Fringe benefits (taxable value) 0.7 0.7
The average number of personnel during the reporting period
2018 2017
Workers 209 212
Clerical employees 218 223
TOTAL 427 435
Management remuneration, EUR million 2018 2017CEO 0.6 0.6
Board members 0.3 0.2
Pension commitments of the Board and CEO
The retirement age of the CEO of the company is 63 years.
4. OTHER OPERATING EXPENSES
EUR million 2018 2017Rental expenses 2.2 2.2
Marketing expenses 6.2 6.1
Energy expenses 7.2 6.9
Travel and representation expenses 1.3 1.1
Repair and maintenance expenses 6.2 5.9
IT expenses 6.4 6.1
Outsourcing services 6.8 5.5
Variable sales expenses 5.7 5.2
Other expenses 8.6 9.5
TOTAL 50.5 48.6
Auditor's fees
Audit fees 0.1 0.1
Tax consultation 0.0 0.0
Other fees 0.5 0.4
TOTAL 0.6 0.5
Environmental expenses
The company's environmental expenses did not have a significant impact on the profit for the period and on the financial position.
173BOARD REPORT
BUSINESS OVERVIEW
CORPORATERESPONSIBILITY
CORPORATE GOVERNANCE
FINANCIAL STATEMENTS
ANNUAL REPORT2018
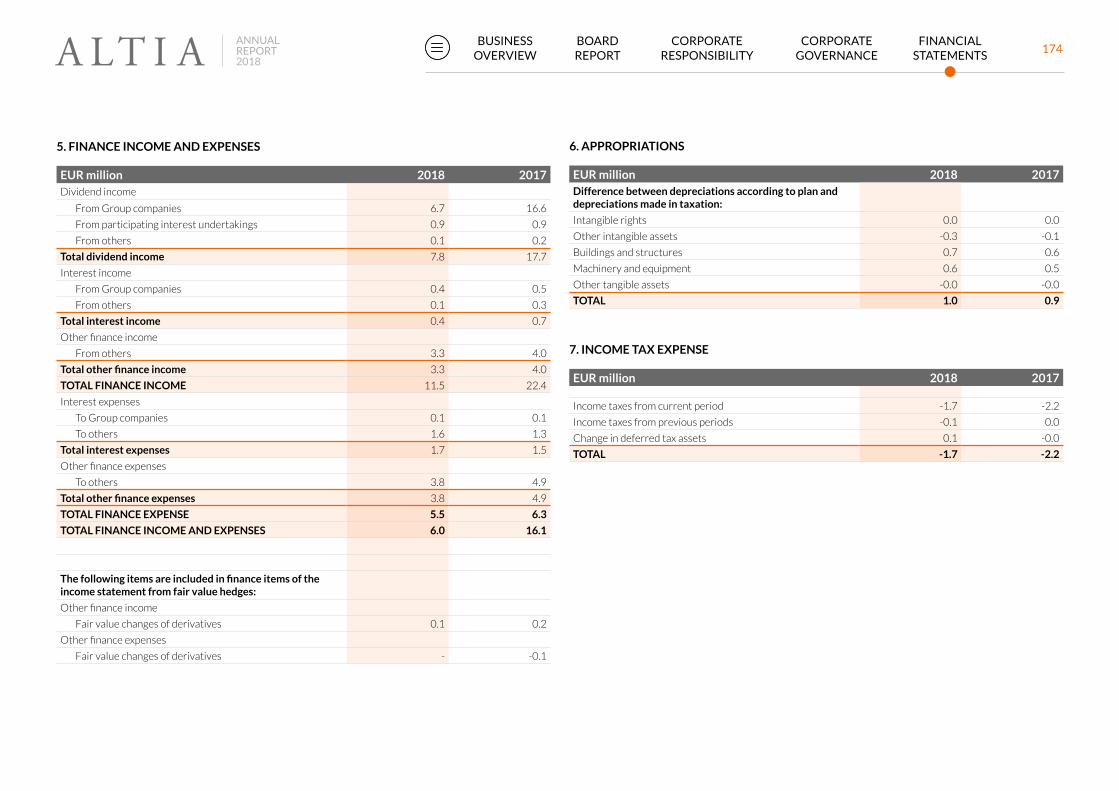
5. FINANCE INCOME AND EXPENSES
EUR million 2018 2017Dividend income
From Group companies 6.7 16.6
From participating interest undertakings 0.9 0.9
From others 0.1 0.2
Total dividend income 7.8 17.7
Interest income
From Group companies 0.4 0.5
From others 0.1 0.3
Total interest income 0.4 0.7
Other finance income
From others 3.3 4.0
Total other finance income 3.3 4.0
TOTAL FINANCE INCOME 11.5 22.4
Interest expenses
To Group companies 0.1 0.1
To others 1.6 1.3
Total interest expenses 1.7 1.5
Other finance expenses
To others 3.8 4.9
Total other finance expenses 3.8 4.9
TOTAL FINANCE EXPENSE 5.5 6.3
TOTAL FINANCE INCOME AND EXPENSES 6.0 16.1
The following items are included in finance items of the income statement from fair value hedges:
Other finance income
Fair value changes of derivatives 0.1 0.2
Other finance expenses
Fair value changes of derivatives - -0.1
6. APPROPRIATIONS
EUR million 2018 2017Difference between depreciations according to plan and depreciations made in taxation:
Intangible rights 0.0 0.0
Other intangible assets -0.3 -0.1
Buildings and structures 0.7 0.6
Machinery and equipment 0.6 0.5
Other tangible assets -0.0 -0.0
TOTAL 1.0 0.9
7. INCOME TAX EXPENSE
EUR million 2018 2017
Income taxes from current period -1.7 -2.2
Income taxes from previous periods -0.1 0.0
Change in deferred tax assets 0.1 -0.0
TOTAL -1.7 -2.2
174BOARD REPORT
BUSINESS OVERVIEW
CORPORATERESPONSIBILITY
CORPORATE GOVERNANCE
FINANCIAL STATEMENTS
ANNUAL REPORT2018
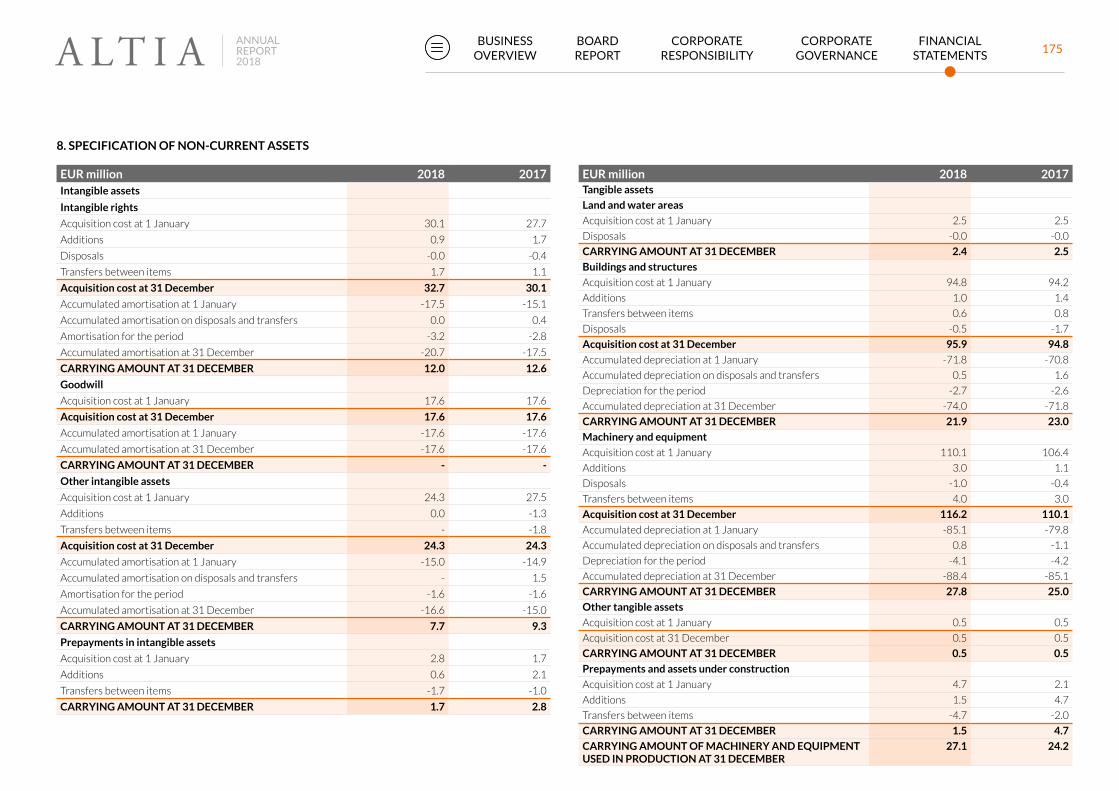
8. SPECIFICATION OF NON-CURRENT ASSETS
EUR million 2018 2017Intangible assets
Intangible rights
Acquisition cost at 1 January 30.1 27.7
Additions 0.9 1.7
Disposals -0.0 -0.4
Transfers between items 1.7 1.1
Acquisition cost at 31 December 32.7 30.1
Accumulated amortisation at 1 January -17.5 -15.1
Accumulated amortisation on disposals and transfers 0.0 0.4
Amortisation for the period -3.2 -2.8
Accumulated amortisation at 31 December -20.7 -17.5
CARRYING AMOUNT AT 31 DECEMBER 12.0 12.6
Goodwill
Acquisition cost at 1 January 17.6 17.6
Acquisition cost at 31 December 17.6 17.6
Accumulated amortisation at 1 January -17.6 -17.6
Accumulated amortisation at 31 December -17.6 -17.6
CARRYING AMOUNT AT 31 DECEMBER - -
Other intangible assets
Acquisition cost at 1 January 24.3 27.5
Additions 0.0 -1.3
Transfers between items - -1.8
Acquisition cost at 31 December 24.3 24.3
Accumulated amortisation at 1 January -15.0 -14.9
Accumulated amortisation on disposals and transfers - 1.5
Amortisation for the period -1.6 -1.6
Accumulated amortisation at 31 December -16.6 -15.0
CARRYING AMOUNT AT 31 DECEMBER 7.7 9.3
Prepayments in intangible assets
Acquisition cost at 1 January 2.8 1.7
Additions 0.6 2.1
Transfers between items -1.7 -1.0
CARRYING AMOUNT AT 31 DECEMBER 1.7 2.8
EUR million 2018 2017Tangible assets
Land and water areas
Acquisition cost at 1 January 2.5 2.5
Disposals -0.0 -0.0
CARRYING AMOUNT AT 31 DECEMBER 2.4 2.5
Buildings and structures
Acquisition cost at 1 January 94.8 94.2
Additions 1.0 1.4
Transfers between items 0.6 0.8
Disposals -0.5 -1.7
Acquisition cost at 31 December 95.9 94.8
Accumulated depreciation at 1 January -71.8 -70.8
Accumulated depreciation on disposals and transfers 0.5 1.6
Depreciation for the period -2.7 -2.6
Accumulated depreciation at 31 December -74.0 -71.8
CARRYING AMOUNT AT 31 DECEMBER 21.9 23.0
Machinery and equipment
Acquisition cost at 1 January 110.1 106.4
Additions 3.0 1.1
Disposals -1.0 -0.4
Transfers between items 4.0 3.0
Acquisition cost at 31 December 116.2 110.1
Accumulated depreciation at 1 January -85.1 -79.8
Accumulated depreciation on disposals and transfers 0.8 -1.1
Depreciation for the period -4.1 -4.2
Accumulated depreciation at 31 December -88.4 -85.1
CARRYING AMOUNT AT 31 DECEMBER 27.8 25.0
Other tangible assets
Acquisition cost at 1 January 0.5 0.5
Acquisition cost at 31 December 0.5 0.5
CARRYING AMOUNT AT 31 DECEMBER 0.5 0.5
Prepayments and assets under construction
Acquisition cost at 1 January 4.7 2.1
Additions 1.5 4.7
Transfers between items -4.7 -2.0
CARRYING AMOUNT AT 31 DECEMBER 1.5 4.7
CARRYING AMOUNT OF MACHINERY AND EQUIPMENT USED IN PRODUCTION AT 31 DECEMBER
27.1 24.2
175BOARD REPORT
BUSINESS OVERVIEW
CORPORATERESPONSIBILITY
CORPORATE GOVERNANCE
FINANCIAL STATEMENTS
ANNUAL REPORT2018

EUR million 2018 2017Investments
Holdings in Group companies
Acquisition cost at 1 January 358.3 358.3
Acquisition cost at 31 December 358.3 358.3
Accumulated impairment at 1 January -151.5 -151.5
Accumulated impairment at 31 December -151.5 -151.5
CARRYING AMOUNT AT 31 DECEMBER 206.8 206.8
Participating interests
Acquisition cost at 1 January 8.0 8.0
CARRYING AMOUNT AT 31 DECEMBER 8.0 8.0
Other shares and investments
Acquisition cost at 1 January 0.8 0.8
Disposals - -0.0
CARRYING AMOUNT AT 31 DECEMBER 0.8 0.8
9. INVENTORY
There is no significant difference between the repurchase price and cost of inventories.
10. NON-CURRENT RECEIVABLES
EUR million 2018 2017Receivables from Group companies
Loan receivables 15.8 17.8
Deferred tax assets
Recognised in hedge reserve - 0.1
Provisions 0.1 -
Fixed assets deferred depreciations 0.4 0.4
Deferred tax assets total 0.5 0.5
TOTAL NON-CURRENT RECEIVABLES 16.3 18.3
11. CURRENT RECEIVABLES
EUR million 2018 2017Receivables from Group companies
Trade receivables 3.0 3.0
Cash Pool receivables 0.4 -
Other receivables 4.8 5.0
Derivatives 0.1 0.0
Accrued income and prepaid expenses 3.9 1.8
Total 12.2 9.8
Receivables from participating interest undertakings
Trade receivables 0.1 0.2
Total 0.1 0.2
Receivables from others
Trade receivables * 25.3 20.1
Other receivables 0.0 -
Accrued income and prepaid expenses 3.6 2.8
Total 29.0 22.9
TOTAL CURRENT RECEIVABLES 41.3 32.9
Accrued income and prepaid expenses
Significant items in accrued income and prepaid expenses:
Derivatives 1.6 1.4
Taxes 0.6 -
Others 1.5 1.4
Total 3.6 2.8
* Does not include the sold trade receivables
176BOARD REPORT
BUSINESS OVERVIEW
CORPORATERESPONSIBILITY
CORPORATE GOVERNANCE
FINANCIAL STATEMENTS
ANNUAL REPORT2018
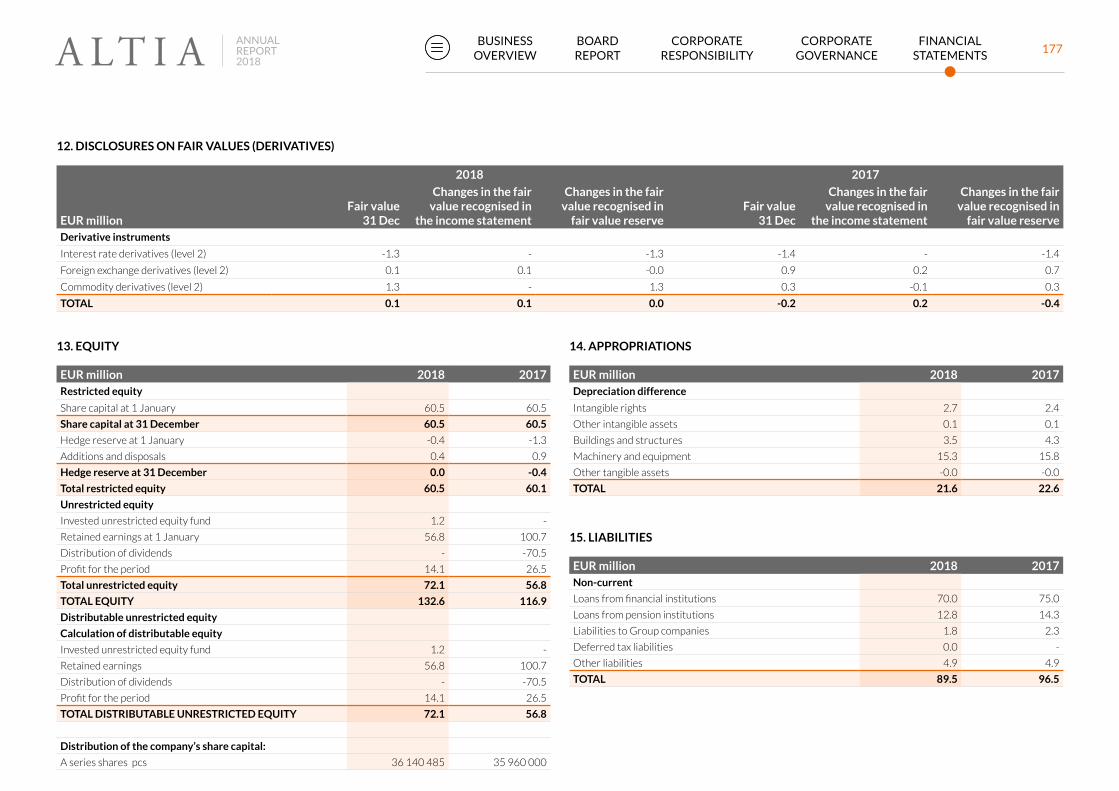
13. EQUITY
EUR million 2018 2017Restricted equity
Share capital at 1 January 60.5 60.5
Share capital at 31 December 60.5 60.5
Hedge reserve at 1 January -0.4 -1.3
Additions and disposals 0.4 0.9
Hedge reserve at 31 December 0.0 -0.4
Total restricted equity 60.5 60.1
Unrestricted equity
Invested unrestricted equity fund 1.2 -
Retained earnings at 1 January 56.8 100.7
Distribution of dividends - -70.5
Profit for the period 14.1 26.5
Total unrestricted equity 72.1 56.8
TOTAL EQUITY 132.6 116.9
Distributable unrestricted equity
Calculation of distributable equity
Invested unrestricted equity fund 1.2 -
Retained earnings 56.8 100.7
Distribution of dividends - -70.5
Profit for the period 14.1 26.5
TOTAL DISTRIBUTABLE UNRESTRICTED EQUITY 72.1 56.8
Distribution of the company’s share capital:
A series shares pcs 36 140 485 35 960 000
12. DISCLOSURES ON FAIR VALUES (DERIVATIVES)
2018 2017
EUR millionFair value
31 Dec
Changes in the fair value recognised in
the income statement
Changes in the fair value recognised in
fair value reserveFair value
31 Dec
Changes in the fair value recognised in
the income statement
Changes in the fair value recognised in
fair value reserveDerivative instruments
Interest rate derivatives (level 2) -1.3 - -1.3 -1.4 - -1.4
Foreign exchange derivatives (level 2) 0.1 0.1 -0.0 0.9 0.2 0.7
Commodity derivatives (level 2) 1.3 - 1.3 0.3 -0.1 0.3
TOTAL 0.1 0.1 0.0 -0.2 0.2 -0.4
14. APPROPRIATIONS
EUR million 2018 2017Depreciation difference
Intangible rights 2.7 2.4
Other intangible assets 0.1 0.1
Buildings and structures 3.5 4.3
Machinery and equipment 15.3 15.8
Other tangible assets -0.0 -0.0
TOTAL 21.6 22.6
15. LIABILITIES
EUR million 2018 2017Non-current
Loans from financial institutions 70.0 75.0
Loans from pension institutions 12.8 14.3
Liabilities to Group companies 1.8 2.3
Deferred tax liabilities 0.0 -
Other liabilities 4.9 4.9
TOTAL 89.5 96.5
177BOARD REPORT
BUSINESS OVERVIEW
CORPORATERESPONSIBILITY
CORPORATE GOVERNANCE
FINANCIAL STATEMENTS
ANNUAL REPORT2018

16. LIABILITIES TO GROUP COMPANIES
EUR million 2018 2017Trade payables 1.3 0.9
Liabilities to Group companies 29.3 22.3
Cash Pool liabilities 84.3 94.6
Derivative instruments 0.1 0.1
Other accrued expenses 2.8 0.8
TOTAL 117.7 118.8
17. ACCRUED EXPENSES AND DEFERRED INCOME
EUR million 2018 2017Significant items under accrued expenses:
Holiday pay and other wages and salaries 5.4 7.2
Contract discount 0.5 0.5
Procurement expenses and other accrued expenses 7.9 8.6
Taxes - 0.8
Derivative instruments 1.5 1.5
TOTAL 15.3 18.6
18. COLLATERALS AND COMMITMENTS
EUR million 2018 2017Collaterals given on behalf of the Group companies
Mortgages 18.5 18.5
Guarantees 5.3 6.4
TOTAL COLLATERALS 23.8 24.9
Commitments and other contingencies
Operating and finance lease obligations
Not later than one year 0.6 0.7
Later than one year 0.5 0.8
Total 1.1 1.5
Lease obligations
Not later than one year 0.7 0.8
Later than one year 1.4 2.6
Total 2.1 3.3
Other obligations
Not later than one year 3.6 4.7
Total 3.6 4.7
TOTAL COMMITMENTS 6.8 9.6
178BOARD REPORT
BUSINESS OVERVIEW
CORPORATERESPONSIBILITY
CORPORATE GOVERNANCE
FINANCIAL STATEMENTS
ANNUAL REPORT2018

VAT liability for real estate investments
The company is liable to review VAT deductions made for real estate investments completed in
2010–2018 if the use subject to VAT decreases during the review period. The maximum liability is
EUR 1.3 million and the last year to review is 2027.
Derivative contractsEUR million
2018 2017
Electricity derivatives
Fair value 1.3 0.3
Nominal value 1.9 2.5
Amount (TWh) 0.1 0.1
Parent company's external forward exchange contracts
Fair value 0.1 1.0
Nominal value 64.6 55.0
Parent company's internal forward exchange contracts
Fair value 0.0 -0.1
Nominal value 18.9 11.3
Interest rate derivatives
Fair value -1.3 -1.4
Nominal value 20.0 20.0
Emission allowances (kilotons)
2018 2017
Emission allowances received 26.9 27.4
Excess emission allowances from the previous year 45.6 39.2
Adjustments related to prior year's estimates 0.0 -0.0
Sold emission allowances -20.0 -
Realised emissions -21.9 -21.0
EMISSION ALLOWANCES AT 31 DECEMBER 30.6 45.6
Fair value of the remaining emission allowances, EUR million
0.7 0.4
The received emission allowances and the realised emission of the year 2018 are estimates which
will be adjusted during spring 2019 if necessary. Altia continues to operate within the emission
trading system for the trading period 2013–2020.
19. RELATED PARTY TRANSACTIONS
Related party transactions are carried out at market value. More information about related party
transactions is presented in Group Note 6.3. (p. 161). Management remuneration is presented in
Altia Plc Note 3 (p. 133).
179BOARD REPORT
BUSINESS OVERVIEW
CORPORATERESPONSIBILITY
CORPORATE GOVERNANCE
FINANCIAL STATEMENTS
ANNUAL REPORT2018

Board of Directors’ proposal for the distribution of profitsAccording to the balance sheet at 31 December 2018, Altia Plc’s distributable earnings
amount to EUR 72 084 125.87 including profit for the period of EUR 14 102 839.85.
There have been no significant changes to the parent company’s financial position at the end of the
financial year.
The Board of Directors proposes to the Annual General Meeting that a dividend of EUR 0.38 per
share be paid for the financial year 2018.
Signatures to the Board of Directors’ Report and to the financial statements
Helsinki, 6 February 2019
Sanna Suvanto-Harsaae
chairman
Annikka Hurme Kim Henriksson Tiina Lencioni
Torsten Steenholt Kai Telanne Jukka Ohtola
Pekka Tennilä
CEO
The Auditors`NoteAn auditor´s report concerning the performed audit has been given to date.
Helsinki, 11 February 2019
PricewaterhouseCoopers Oy
Authorised Public Accountants
Ylva Eriksson
Authorised Public Accountant
180BOARD REPORT
BUSINESS OVERVIEW
CORPORATERESPONSIBILITY
CORPORATE GOVERNANCE
FINANCIAL STATEMENTS
ANNUAL REPORT2018

Report on the Audit of the Financial Statements Opinion
In our opinion
• the consolidated financial statements give a true and fair view of the group’s financial position
and financial performance and cash flows in accordance with International Financial Report-
ing Standards (IFRS) as adopted by the EU
• the financial statements give a true and fair view of the parent company’s financial perfor-
mance and financial position in accordance with the laws and regulations governing the
preparation of the financial statements in Finland and comply with statutory requirements.
Our opinion is consistent with the additional report to the Audit Committee.
What we have audited
We have audited the financial statements of Altia Oyj (business identity code 1505555-7) for the
year ended 31 December 2018. The financial statements comprise:
• the consolidated balance sheet, income statement, statement of comprehensive income,
statement of changes in equity, statement of cash flows and notes, including a summary of
significant accounting policies
• the parent company’s balance sheet, income statement, statement of cash flows and notes.
Basis for Opinion
We conducted our audit in accordance with good auditing practice in Finland. Our responsibilities
under good auditing practice are further described in the Auditor’s Responsibilities for the Audit
of the Financial Statements section of our report.
We believe that the audit evidence we have obtained is sufficient and appropriate to provide a
basis for our opinion.
Independence
We are independent of the parent company and of the group companies in accordance with the
ethical requirements that are applicable in Finland and are relevant to our audit, and we have
fulfilled our other ethical responsibilities in accordance with these requirements.
To the best of our knowledge and belief, the non-audit services that we have provided to the par-
ent company and to the group companies are in accordance with the applicable law and regula-
tions in Finland and we have not provided non-audit services that are prohibited under Article 5(1)
of Regulation (EU) No 537/2014. The non-audit services that we have provided are disclosed in
note 1.6. (p. 120) to the Financial Statements.
Auditor’s Report (Translation of the Finnish Original)To the Annual General Meeting of Altia Oyj
Our Audit Approach
Overview
MATERIALITY
• Overall group materiality: € 3.5 million
GROUP SCOPING
• The group audit included the parent
company and all significant subsidiaries
covering the vast majority of net sales,
assets and liabilities.
KEY AUDIT MATTERS
• Revenue recognition
• Valuation of goodwill
• Valuation of inventories
MATERIALITY
GROUP SCOPING
KEY AUDIT MATTERS
181BOARD REPORT
BUSINESS OVERVIEW
CORPORATERESPONSIBILITY
CORPORATE GOVERNANCE
FINANCIAL STATEMENTS
ANNUAL REPORT2018

As part of designing our audit, we determined materiality and assessed the risks of material
misstatement in the financial statements. In particular, we considered where management made
subjective judgements; for example, in respect of significant accounting estimates that involved
making assumptions and considering future events that are inherently uncertain.
Materiality
The scope of our audit was influenced by our application of materiality. An audit is designed to ob-
tain reasonable assurance whether the financial statements are free from material misstatement.
Misstatements may arise due to fraud or error. They are considered material if individually or in
aggregate, they could reasonably be expected to influence the economic decisions of users taken
on the basis of the financial statements.
Based on our professional judgement, we determined certain quantitative thresholds for materi-
ality, including the overall group materiality for the consolidated financial statements as set out in
the table below. These, together with qualitative considerations, helped us to determine the scope
of our audit and the nature, timing and extent of our audit procedures and to evaluate the effect of
misstatements on the financial statements as a whole.
Overall group materiality € 3.5 million
How we determined it 1% of net sales
Rationale for the materiality
benchmark applied
We chose net sales as the benchmark because,
in our view, it reflects the volume of operations and
growth objectives of the group and it is a benchmark
against which the performance of the group is commonly
measured by users.
Net sales is a generally accepted benchmark. We chose
1 % of net sales, which is within the range of acceptable
quantitative materiality thresholds in auditing standards.
How we tailored our group audit scope
We tailored the scope of our audit, taking into account the structure of the group, the accounting
processes and controls, and the size, complexity and risks of individual subsidiaries. Altia Group
has operations in the Nordic countries, Baltics and France. The main accounting areas for subsidi-
aries in the Nordic countries are handled centrally in Finland.
We performed group audit procedures on all significant account balances covering the vast major-
ity of the group’s net sales, assets and liabilities. In addition, we performed analytical procedures
at group level of the remaining balances.
Key Audit Matters Key audit matters are those matters that, in our professional judgment, were of most significance
in our audit of the financial statements of the current period. These matters were addressed in the
context of our audit of the financial statements as a whole, and in forming our opinion thereon, and
we do not provide a separate opinion on these matters.
As in all of our audits, we also addressed the risk of management override of internal controls,
including among other matters consideration of whether there was evidence of bias that repre-
sented a risk of material misstatement due to fraud.
182BOARD REPORT
BUSINESS OVERVIEW
CORPORATERESPONSIBILITY
CORPORATE GOVERNANCE
FINANCIAL STATEMENTS
ANNUAL REPORT2018

Key audit matter in the audit of the group
How our audit addressed the key audit matter
Revenue recognition
Refer to note 1.1. (p. 116) in the consolidated
financial statements
Altia’s revenue flows are generated by the
sale of own products and partner brands,
contract manufacturing and sale of industrial
products.
The transaction price may include variable
considerations such as volume discounts,
bonuses, marketing support and product
returns.
Due to a variety of contractual terms, the
calculation of period’s variable components
is a complex accounting area that include
management judgement. We have accord-
ingly considered the risk that revenue is not
recorded in the correct period to be a key
audit matter.
Our audit procedures included e.g. the
following:
• We gained an understanding of the
nature of the revenue flows and
different contractual terms used.
• We compared the accounting treatment
of a sample of sales transactions and
variable consideration to the terms of
underlying contracts.
• We assessed the Group’s accounting
policies over revenue recognition, in
particular the appropriate applica-
tion of the new accounting standard
IFRS 15 “Revenue from contract with
customers”.
• We tested a sample of sales transactions
against incoming cash.
• We tested a sample of sales invoices
recorded in December 2018 and
January 2019 to evaluate that revenue
had been recognised in the right period.
• For selected revenue and accounts
receivable balances we obtained
customer confirmations.
Key audit matter in the audit of the group
How our audit addressed the key audit matter
Valuation of goodwill
Refer to note 2.1. (p. 121) in the consolidated
financial statements
The Group reports goodwill totaling to EUR
80,7 million as of 31 December 2018, arising
from past business acquisitions.
The company tests goodwill for potential
impairment annually and whenever there is
an indication that the carrying value may be
impaired when comparing the recoverable
amount against the carrying value of the
goodwill.
Impairment tests are performed at operating
segment level. The recoverable amounts are
determined using value in use method.
Valuation of goodwill is a key audit matter
due to the high level of management judge-
ment involved in relation to the estimates of
future cash flows.
Our audit of goodwill valuation focused on
critical estimates and management’s judge-
ment. We have assessed the appropriateness
of these through the following procedures:
• We tested the methodology applied in
the value in use calculation by compar-
ing it to the requirements of IAS 36,
“Impairment of Assets”, and we tested
the mathematical accuracy of the
calculations.
• We evaluated the process where the
future cash flow forecasts were drawn
up, including sales and profitability
forecasts and discount rates
• To corroborate the reliability of
management’s estimates, we compared
the current year actual results to the
information used in the prior year
impairment calculation.
• We considered the appropriateness
of assumptions used in the sensitivity
analysis performed by management.
• We considered the appropriateness of
the related disclosures provided in the
Group financial statements.
183BOARD REPORT
BUSINESS OVERVIEW
CORPORATERESPONSIBILITY
CORPORATE GOVERNANCE
FINANCIAL STATEMENTS
ANNUAL REPORT2018

Responsibilities of the Board of Directors and the Managing Director for the
Financial Statements
The Board of Directors and the Managing Director are responsible for the preparation of consoli-
dated financial statements that give a true and fair view in accordance with International Financial
Reporting Standards (IFRS) as adopted by the EU, and of financial statements that give a true
and fair view in accordance with the laws and regulations governing the preparation of financial
statements in Finland and comply with statutory requirements. The Board of Directors and the
Managing Director are also responsible for such internal control as they determine is necessary to
enable the preparation of financial statements that are free from material misstatement, whether
due to fraud or error.
In preparing the financial statements, the Board of Directors and the Managing Director are
responsible for assessing the parent company’s and the group’s ability to continue as a going con-
cern, disclosing, as applicable, matters relating to going concern and using the going concern basis
of accounting. The financial statements are prepared using the going concern basis of accounting
unless there is an intention to liquidate the parent company or the group or to cease operations,
or there is no realistic alternative but to do so.
Auditor’s Responsibilities for the Audit of the Financial Statements
Our objectives are to obtain reasonable assurance about whether the financial statements as a
whole are free from material misstatement, whether due to fraud or error, and to issue an audi-
tor’s report that includes our opinion. Reasonable assurance is a high level of assurance, but is not
a guarantee that an audit conducted in accordance with good auditing practice will always detect
a material misstatement when it exists. Misstatements can arise from fraud or error and are con-
sidered material if, individually or in the aggregate, they could reasonably be expected to influence
the economic decisions of users taken on the basis of these financial statements.
As part of an audit in accordance with good auditing practice, we exercise professional judgment
and maintain professional skepticism throughout the audit. We also:
• Identify and assess the risks of material misstatement of the financial statements, whether
due to fraud or error, design and perform audit procedures responsive to those risks, and
obtain audit evidence that is sufficient and appropriate to provide a basis for our opinion.
The risk of not detecting a material misstatement resulting from fraud is higher than for one
Key audit matter in the audit of the group
How our audit addressed the key audit matter
Valuation of inventory
Refer to note 2.3. (p. 128) in the consolidated
financial statements
Inventory forms a significant part of the
Group’s assets, amounting to EUR 99,6
million as of 31 December 2018.
Inventories are measured at the lower of
cost and net realisable value. Self-manufac-
tured products are measured at standard
prices or weighted average cost. Fixed
production costs are allocated to the cost of
own production.
Management exercises judgement and ap-
plies assumptions when estimating the need
for an obsolescence provision. This includes
identification of slow moving and seasonal
products, changes in product portfolio and
consideration of sales forecasts.
Given the factors described above, we have
considered valuation of inventory to be a key
audit matter.
Our audit procedures included e.g. the
following:
• We gained an understanding of the
controls established in relation to
inventory valuation.
• We assessed the adequacy of the obso-
lescence provision and checked adher-
ence to the Group’s accounting policy.
• We tested, on a sample basis, the accu-
racy of cost for self-manufactured prod-
ucts by comparing the actual production
costs to market and other price data.
• We tested a sample of inventory items
to confirm whether they are held at the
lower of cost and net realisable value,
through comparison to vendor invoices
and sales prices.
• For a sample of warehouses, we attend-
ed the physical stock-take counting or
reconciled third party confirmations
with the accounting records.
We have no key audit matters to report with respect to our audit of the parent company
financial statements.
There are no significant risks of material misstatement referred to in Article 10(2c) of
Regulation (EU) No 537/2014 with respect to the consolidated financial statements or the
parent company financial statements.
184BOARD REPORT
BUSINESS OVERVIEW
CORPORATERESPONSIBILITY
CORPORATE GOVERNANCE
FINANCIAL STATEMENTS
ANNUAL REPORT2018
resulting from error, as fraud may involve collusion, forgery, intentional omissions, misrep-
resentations, or the override of internal control.
• Obtain an understanding of internal control relevant to the audit in order to design audit
procedures that are appropriate in the circumstances, but not for the purpose of expressing
an opinion on the effectiveness of the parent company’s or the group’s internal control.
• Evaluate the appropriateness of accounting policies used and the reasonableness of account-
ing estimates and related disclosures made by management.
• Conclude on the appropriateness of the Board of Directors’ and the Managing Director’s use
of the going concern basis of accounting and based on the audit evidence obtained, whether
a material uncertainty exists related to events or conditions that may cast significant doubt
on the parent company’s or the group’s ability to continue as a going concern. If we conclude
that a material uncertainty exists, we are required to draw attention in our auditor’s report
to the related disclosures in the financial statements or, if such disclosures are inadequate, to
modify our opinion. Our conclusions are based on the audit evidence obtained up to the date
of our auditor’s report. However, future events or conditions may cause the parent company
or the group to cease to continue as a going concern.
• Evaluate the overall presentation, structure and content of the financial statements, including
the disclosures, and whether the financial statements represent the underlying transactions
and events so that the financial statements give a true and fair view.
• Obtain sufficient appropriate audit evidence regarding the financial information of the enti-
ties or business activities within the group to express an opinion on the consolidated financial
statements. We are responsible for the direction, supervision and performance of the group
audit. We remain solely responsible for our audit opinion.
We communicate with those charged with governance regarding, among other matters, the
planned scope and timing of the audit and significant audit findings, including any significant defi-
ciencies in internal control that we identify during our audit.
We also provide those charged with governance with a statement that we have complied with
relevant ethical requirements regarding independence, and to communicate with them all rela-
tionships and other matters that may reasonably be thought to bear on our independence, and
where applicable, related safeguards.
From the matters communicated with those charged with governance, we determine those
matters that were of most significance in the audit of the financial statements of the current
period and are therefore the key audit matters. We describe these matters in our auditor’s report
unless law or regulation precludes public disclosure about the matter or when, in extremely rare
circumstances, we determine that a matter should not be communicated in our report because the
adverse consequences of doing so would reasonably be expected to outweigh the public interest
benefits of such communication.
Other Reporting Requirements Appointment
We were first appointed as auditors by the annual general meeting on 29 March 2016.
Our appointment represents a total period of uninterrupted engagement of 3 years.
Other Information
The Board of Directors and the Managing Director are responsible for the other information.
The other information comprises the report of the Board of Directors and the information includ-
ed in the Annual Report, but does not include the financial statements and our auditor’s report
thereon. We have obtained the report of the Board of Directors prior to the date of this auditor’s
report and the Annual Report is expected to be made available to us after that date.
Our opinion on the financial statements does not cover the other information.
In connection with our audit of the financial statements, our responsibility is to read the other
information identified above and, in doing so, consider whether the other information is materially
inconsistent with the financial statements or our knowledge obtained in the audit, or otherwise
appears to be materially misstated. With respect to the report of the Board of Directors, our
responsibility also includes considering whether the report of the Board of Directors has been
prepared in accordance with the applicable laws and regulations.
185BOARD REPORT
BUSINESS OVERVIEW
CORPORATERESPONSIBILITY
CORPORATE GOVERNANCE
FINANCIAL STATEMENTS
ANNUAL REPORT2018

In our opinion
• the information in the report of the Board of Directors is consistent with the information in
the financial statements
• the report of the Board of Directors has been prepared in accordance with the applicable
laws and regulations.
If, based on the work we have performed on the other information that we obtained prior to
the date of this auditor’s report, we conclude that there is a material misstatement of this other
information, we are required to report that fact. We have nothing to report in this regard.
Helsinki 11 February 2019
PricewaterhouseCoopers Oy
Authorised Public Accountants
Ylva Eriksson
Authorised Public Accountant (KHT)
186BOARD REPORT
BUSINESS OVERVIEW
CORPORATERESPONSIBILITY
CORPORATE GOVERNANCE
FINANCIAL STATEMENTS
ANNUAL REPORT2018

ALTIA PLC
P.O. Box 350, FI-00101 Helsinki, Finland
+358 207 013 013
www.altiagroup.com