7 advanced ch em ical s characterization … chemical characterization and physical properties of...
TRANSCRIPT

7
(
/S
ADVANCED CH EM ICALCHARACTERIZATION AND
PHYSICAL PROPERTIES OF ELEVEN
__r LUBRICANTSINTERIM REPORT
t _4 _"AFLRL No. 166
By
u'-.
Oo
_4cO
_"!_ 0_:_
!;_1 >_ !..I
CO _,1 _ n'_ _3
e_) _-t L)
_.,,,_L_I ,-1 (li"'_ L.) _1 I
-i
David L. PresentFrank M. Newman
J. C. TylerJ. Pat Cueilar
U.S. Army Fuels and Lubricants Research LaboratorySouthwest Research Institute
San Antonio, Texas
Under Contract to
U.S. Army Mobility Equipment Researchand Development Command
Materials, Fuels, and Lubricants LaboratoryFort Belvoir, Virginia
Contract No. DAAKT0-82-C-0001and
NASA-Lewis Research Center
Contract No. C-67295-D
Contractor Report 168187
Approved for public release; distribution unlimited
March 1983
https://ntrs.nasa.gov/search.jsp?R=19830077273 2018-07-02T10:18:34+00:00Z

Disclaimers
The findings in this report are not to be construed as an official Department of the
Army position unless so designated by other authorized documents.
Trade names cited in this report do not constitute an official endorsement or appro-val of the use of such commercial hardware or software.
DTIC Availability Notice
Qualified requestors may obtain copies of this report from the Defense Technical
Information Center, Cameron Station, Alexandria, Virginia 22314.
Disposition Instructions
Destroy this report when no longer needed. Do not return it to the originator.

UNCLASSIFIED
ECURITY CLASSIFICATION OF THIS PAGE (When Data Entered)
REPORT DOCUMENTATION PAGE
1. REPORT NUMBER 2. GOVT ACCESSION NO
AFLRL No. 166 AD A131945___tA___6_6$_65
TITLE (and Subtitle)
ADVANCED CHEMICAL CHARACTERIZATION AND
PHYSICAL PROPERTIES OF ELEVEN LUBRICANTS
AUTHOR(s)
David L. Present John C. Tyler
Frank M. Newman J. Pat Cuellar
9. PERFORM NG ORGANIZATION NAME ANDADDRESSES
U.S. Army Fuels and Lubricants Research
Laboratory, Southwest Research Institute,
P.O. Drawer 28510, San Antonio TX 78284
11
14.
CONTROLLING OFFICE NAME AND ADDRESS
U.S. Army Mobility Equipment Research and
Development Command, Materials, Fuels, andLubricants Laboratory, Ft. Belvoir VA 22060
MONITORING AGENCY NAME& ADDRESS
(o dt]_ren t _om C'on tro Iling O_ce)
NASA Lewis Research Center
21000 Brookpark Road
Cleveland OH 44135
16. DISTRIBUTION STATEMENT (oftt, isReport)
READ INSTRUCTIONS
BEFORE COMPLETING FORM
3. RECIPIENT'S CATALOG NUMBER
5. TYPE OF REPORT & PERIOD COVERED
Interim Report
August, 1982 - February 19836. PERFORMING ORG. REPORTNUMBER
SWR-6800-280/1
8. CONTRACT OR GRANT NUMBER(s)
DAAK70-82-C-0001
10. PROGRAM ELEMENT, PROJECT, TASK
AREA & WORK UNIT NUMBERS
2. REPORT DATE
March 1983
13. NUMBER OF PAGES
128
15. SECURITY CLASS. (of this report)
UNCLASSIFIED
15a. DECLASSIFICATION/DOWNGRADING
SCHEDULE
Approved for public release; distribution unlimited
17. DISTRIBUTION STATEMENT (of the abstract entered in Block 20, if different from Report)
18. SUPPLEMENTARY NOTES
This program was funded by NASA Lewis Research Center under NASA LeRC
Contract No. 67295-D. Project manager Andrew M. Mitchell
19 K E Y WO R DS (Con tinue on reverse side _ necessary and identify by block number)
Lubricants Esters Transesterification
Basestock Gas Chromatography Infrared Spectroscopy
Additives Chemical Characteristics XRF Spectroscopy
20. A BS T R ACT (Con tin ue on reverse sMe _ nece_ary and Men tify by block number)
Lubricants used in the power trains of helicopter transmissions have
required "standard tests", such as ASTM-designated methods, definitizing
required physical and chemical properties. These initial properties
and their subsequent service life variations or degradations, whether
causation is internal or external, affect service performance. In order
to advance the state-of-the-art lubricant "performance" predications, tests
in the regimes of friction, wear, high-pressure viscosity, particulate
FORM 1473 EDITION OF 1 NOV 65 tS OBSOLETEDD 1JAN 73 UNCLASSIFIED
SECURITY CLASSIFICATION OF THIS PAGE (When Data Entered)

UNCLASSIFIED
SECURITY CLASSIFICATION OF THIS PAGE (When Data Entered]
20. ABSTRACT (Cont'd)
contamination and others are now part of "standard practice" techniques
available. Along with these tests, a third generation chemical
characterization technique has now been developed which is fast,
efficient, accurate, and requires only milligram sample amounts with a
minimum of processing. This technique yields accurate compositional data
of ester-type lubricants and some antioxidant additives. Other metal-
type additives are determined by spectroscopic methods while lubricant
classifications are determined by a combination of Infrared Spectroscopy
and boiling point distribution by gas chromatography.
UNCLASSIFIEDSECURITY CLASSIFICATION OF THIS PAGE (When Dam Entered

FOREWORD
The work reported herein was conducted at the U.S. Army Fuels and Lubricants
Research Laboratory (AFLRL), located at Southwest Research Institute, San
Antonio, Texas.
The initial phase covering the physical properties was conducted under NASA
Purchase Requisition No. 520047.
The high-pressure viscosity, friction and wear tests, and chemical char-
acterization work was conducted under Contract No. DAAK70-82-C-0001 during
the period August 1982 through February 1983. The contracting officer's
representative was Mr. F.W. Schaekel (DRDME-GL, MERADCOM).
The authors acknowledge the helpful suggestions and assistance provided by
AFLRL staff members and Dr. E.V. Zaretsky, Mr. A. Mitchell, and Dr. J.J. Coy
(AVRADCOM) of the NASA-Lewis Research Center.
! ,
L
i


%
TABLE OF CONTENTS
I. INTRODUCTION .................................................
II. OBJECTIVE ....................................................
III. APPROACH ......................................................
IV. EXPERIMENTAL .................................................
Ao
B.
C.
D.
Physical Data ...........................................
Friction and Wear Tests .................................
High-Pressure Viscosity .................................
Analytical Characterization .............................
i. Spectroscopic Methods ...............................
a. Infrared Spectrophotometry ......................
b. X-ray Fluorescence Spectrophotometry ............
2. Gas Chromatographic Method for Boiling Point
Distribution ........................................
3. Chemical Characterization Methods ...................
a. Ester Transesterification Technique .............
b. Polyol Silylation Technique .....................
V. DESCRIPTION OF METHODS .......................................
A. Wear Metal Tests .................... ....... ......... ....
i. X-ray Fluorescence ..................................
2. Spectroscopic Analysis for Iron .....................
B. Specific Heat by Differential Scanning Calorimetry ......1. Procedure ...........................................
2. Results .............................................
C. Gas Chromatography Methods ..............................
i. Boiling Point Distribution of Lubricants ............
2. Gas Chromatography of Lubricant Derivatives .........
Vl. DISCUSSION ...................................................
A. Physical Test Methods ...................................
i. Specific Heat .......................................
2. Friction and Wear Tests .............................
B. Spectroscopic Methods ...................................
i. Infrared Spectrophotometry (IR) .....................
2. Metals Analysis .....................................
C. Boiling Point Distribution by Gas Chromatography ........
D. Chemical Characterization ...............................
VII. CONCLUSIONS AND RECOMMENDATIONS ..............................
VIII. REFERENCES ...................................................
5
9
9
i0
Ii
12
12
14
14
15
18
18
20
20
20
20
21
21
23
24
25
25
27
27
27
27
28
28
29
29
29
35
37

TABLEOFCONTENTS(Cont'd)
APPENDICES
Ao
B.
C.
D.
E.
F.
G.
Physical Test Data ....................................... 39Friction and Wear Test Data .............................. 53
High-Pressure Viscosity Test Data ...... .................. 57
Boiling Point Distribution Data .......................... 81
Basestock Characterization Standards ..................... 97
Basestock Characterization Data with Daisy Graphs ........ 105
Infrared Spectra ......................................... 121
LIST OF TABLES
Table rage
1 Synthetic Lubricant Analysis Sample Identification ._ ........... 8
2 Synthetic Lubricant Analysis Methods Used in Analysis .......... 9
3 Boiling Point Distribution Standard ............................ 26
4 Basestock Characterization Summary ............................. 30
LIST OF ILLUSTRATIONS
Figure P_ e
1 Standard Lubricant-Type Infrared Spectra ....................... 13
2 Standard Lubricant-Type Chromatograms .......................... 16
3 TMP in Methanol ................................................ 19
4 Analytical Characterization Scheme ............................. 32
ii)

\
I. INTRODUCTION
Lubricants play a decisive role, having myriad critical operation "performance
index" parameters in helicopter power train components. However, the perfor-
mance of helicopter transmissions still requires advances in predictive anal-
ytical methods and tests so as to evaluate and compare lubrication effects on
operational life, reliability, friction, wear, service overhaul schedules,
build and operational cost effectiveness. The rapid scientific and technolo-
gical advances in power transmission technology (!)* has markedly emphasized
the need to evolve new lubrication evaluation techniques (_) at the funda-
mental molecular and chemical property levels. Also, basic research investi-
gations are required on lubricant dynamical and chemical surface interactions
including investigations under simulated field service environments
Typically, a lubricant is now chosen based on the specification by which it is
qualified. Frequently, the specification contains the performance require-
ments for the lubricant. In field applications or in performance studies, the
lubricant is thus selected based on the specification. In other cases, a
lubricant is selected because it is classified as a lubricant for a given
application. Seldom is the composition of the lubricant considered in its
overall application selection. Comparison of the composition of different
lubricants andcorrelation of lubricant performance as related to the chemical
composition is difficult because insufficient specific lubricant composition
information is available. As a result of the recent developments in lubricant
analytical chemistry at the U.S. Army Fuels and Lubricants Research Laboratory
(AFLRL)(_), lubricants can now be characterized as to their chemical composi-
tion.
Modern lubricants are complex chemical mixtures containing one or more base-
stock (major) components, and several additives that allow the finished lubri-
*Underscored numbers in parentheses refer to the list of references at the end
of this report.

cant to perform its function in an engine or other power flow system. The
lubricant basestock usually contains either:
(a) mineral oil (solvent neutrals, pale oils, bright stocks, etc.),
(b) synthetic hydrocarbon(s) (polyalphaolefins, polyalkylbenzenes,
etc.),
(c) synthetic organic compounds other than hydrocarbons (mono-, di-,
tri-, and tetra-esters, ethers, phosphate esters, polyol esters,
polyethers, silicones, etc.), or
(d) a combination of the above.
Similarly, the additive package in a finished lubricant may have several con-
stituents including detergent, dispersant, antloxidant, antiwear agent, ex-
treme pressure additive and possibly a viscosity index improver. While some
components may exhibit multifunctional properties (improve more than one func-
tion of the lubricant), the number of major constituents of a lubricant may be
large indeed. Turbine engine lubricants and transmission fluids are specially
formulated to meet these application needs.
Detailed compositional information is generally needed to define basestock
character and to correlate the basestock component type to the families of
refined lubricants, power train, and hydraulic fluids.
The compositional information needed generally takes the following form:
i)
2)
3)
4)
Physical Data - comprising those data needed for specifications,
sometimes referred to as "Standard Tests", and necessary to develop
correlations to performance.
Friction and Wear - standard test (ASTM D 2714) to aid in determin-
ing lubricating properties.
Hish-Pressure Viscosit 7 - correlates to a lubricant's performance
under actual operating conditions.
Chemical Characterization - supplies detailed information of the
lubricant's actual chemical composition.
The physical data tests, friction and wear test, and high-pressure viscosity
test methods are industry-accepted standard tests, and present no new areas

for defining or characterizing a lubricant. However, recent advances in the
analytical chemistry of lubricants at AFLRL has allowed simpler and more
accurate quantitative chemical characterization of the basestocks and some
organic additives.
This study was undertaken to define the composition of basestock materials so
that, ultimately, better correlations with the critical operational perfor-
mance index parameters can be made. In the work described in this report, the
composition of eleven lubricant basestocks has been determined.
II. OBJECTIVE
The objective of this program was to provide NASA-Lewis Research Center and
the U.S. Army Aviation Research and Development Command (USAAVRADCOM) Research
and Technology Laboratories with data concerning both the physical and chem-
ical properties of eleven lubricants selected by NASA-Lewis engineers for
performance evaluation as helicopter transmission lubricants (Table i).
III. APPROACH
To accomplish that objective, a variety of fluid types were chosen, including
MIL-L-23699, and MIL-L-7808 qualified lubricants, synthetic hydrocarbon-based
oils, and two automotive-type automatic transmission fluids. Standard phys-
ical tests and wear metal analyses were conducted on both the new and used
lubricants. In addition, boiling point distribution by gas chromatography,
infrared spectrophotometric analysis, chemical characterization of each lubri-
cant basestock by a newly applied derivatization/gas chromatographic tech-
niques, high-pressure viscosity measurements as a function of temperature
using a falling body viscosimeter, and friction-wear tests using an LFW-I test
machine were conducted. Tabulation of results and descriptions of the meth-
odology applied are contained in the following sections.

• k
TABLE i. SYNTHETIC LUBRICANT ANALYSIS
SAMPLE IDENTIFICATION
OO
NASA-Lewis
Description
A-New
A-Used
B-New
B-Used
CiNew
C-Used
D-New
D-Used
E-New
E-Used
F-New
F-Used
G-New
G-Used
H-New
H-Used
1-New
1-Used
J-New
J-Used
K-New
K-Used
SwRI
Oil Code
AL-II252-L}AL-I[253-L
AL-II268-L_AL-II269-L_
AL-11250-L_AL-I1251-L I
AL-II254-L }AL-11255-L
AL-11256-L }AL-11257-L
AL-11258-L}AL-11259-L
AL-11260-L}AL-t1261-L
AL-11262-L}AL-11263-L
AL-11264-L_AL-II265-L I
AL-o11270-L
AL-II271-L [
AL-11266-L 1AL-11267-L
Specification
Dexron II GM 6137-M
Type
Automatic Transmission Fluid
Dexron II GM 6137-M Automatic Transmission Fluid
MIL-L-23699 Turbine Engine Oil
MIL-L-23699 Type II Synthetic Gas Turbine Engine Oil
Type I Synthetic Gear Lubricant
Syn. Hydrocarbon w/Antiwear Additives
MIL-L-2104C
MIL-L-46152 Synthetic Fleet Engine Oil
MIL-L-7808 Turbine Engine Oil
MIL-L-23699 Type II Turbine Engine Oil
MIL-L-23699 Type II Turbine Engine Oil
Turbine Engine Oil

A. Physical Data
IV. EXPERIMENTAL
The physical data for each oil were obtained by standard test methods shown in
Table 2. The data are tabulated and presented in Appendix A.
TABLE 2. SYNTHETIC LUBRICANT ANALYSIS
METHODS USED IN ANALYSIS
Method Reference
Kinematic Viscosity ASTMD 445
Gravity
Specific
API
ASTM D 1481
Total Acid Number ASTM D 664
Particulate Contamination Count ARP 598 (Revised 8-i-69)
Wear Metals Tests
X-ray Fluorescence-Filter Method
Spectroscopic Analysis-WPAFB
Acid Extraction Method (Mod)
AFLRL Report No. 102"AFWAL TR-80-4022"
Specific Heat, Differential
Scanning
Calorimetric Method
Section Six, DSC and Pressure*
DSC Cells and Accessories/
Instruction Manual 990 Thermal
Analyzer and Modules
Boiling Point Distribution
Simulated Distillation
Modified ASTM 2887*
*These methods are described in detail in the text.
B. Friction and Wear Tests
In this program, it was mutually agreed that the eleven NASA-Lewis supplied
lubricating oils were to be tested in duplicate on a LFW-I friction and wear
testing machine per ASTM D 2714 (1978) and modified as follows:
9

(a) Surface speeds to be 180 ft/mln (54.9 m/min).
(b) Hertz llne contact stress to be I00,000 psi.
(c) Block and ring material to be AISI 9310 (AMS6260) steel with blackoxide finish and with Rockwell C 60 hardness and 8 microinch surface
finish.
(d) Test oll temperature to be 100°C (212°F) during testing.
(e) Test duration to be I0,000 cycles (ring revolutions) with friction
force measured and recorded at 400, 800, 1200, 9000, and I0,000
cycles.
C. Hish-Pressure Viscosity
The viscosity as a function of pressure and temperature was measured in a
falling body viscometer. The variable range for this instrument was I atmos-
phere (101.3 kPa) to 604 MPa in pressure, 20 ° to 150°C in temperature, and
about 0.4 mPa. s to i000 Pa-s in viscosity. The vlscometer consists of a mag-
netic sinker in a nonmagnetic pressure vessel which is surrounded by a linear
variable differential transformer. The viscosity measurement is made by
timing the sinker fall over a predetermined and variable fall distance. The
fall distance is varied depending upon the viscosity level. The sample is
isolated from a pressurizing medium by a floating piston. The pressurizing
medium, which is a low-viscosity diester, is pressurized by a hand-operated
hydraulic pump operating through an intensifier. The intensifier has an area
ratio of approximately 15 to i.
The viscometer is housed in an air oven to control the temperature. The temp-
erature is measured by a thermocouple inserted in a well in the pressure ves-
sel. The pressure is measured by a Bourdon gage on the low-pressure side of
the intensifier. The system pressure has been calibrated for seal friction in
the intensifier and isolating piston. The viscometer fall constant as a func-
tion of pressure and temperature has been calibrated using 2-ethyl-hexyl-
sebacate and the data obtained by P.W. Bridgman as reported in the ASME Pres-
sure Viscosity Report. (_) A minimum sample size of 2 cubic centimeters is
required. Further description of similar instruments, and data acquired with
them can be found in References 5 through 7.
i0

The data obtained by this method are shown in Appendix C.
The following definitions and conversions may be helpful:
/
_ 1 d/_ |
/_ dp [T.p=latm
l[ I-La* - /_(T,p = 1 atm) dp
/_(PlT) Tee aC for corrected values :of _*. I
_* is a more reliable measure of the viscosity-pressure response of the
material. It is determined by integration, employing all the data measure-
ments, while sOT is obtained by graphical differentiation and is very depen-
dent on a few of the low-pressure data points; hence, it is subject to more
overall error.
p/psi = p/MPax 6.894x103 =P/MPax
/_/cp _- _/mPas
I/_/Ib.___ss= M/mPas xl6.89_ x 103 = M/mPas xin.2
D. Analytical Characterization
Several analytical techniques and separation methods are referred to for the
characterization of lubricants.(_) The utility, applications, and resulting
data produced by the application of these techniques are discussed best when
II

segregated into specific analytical chemistry groups: (I) Spectroscopicmethods, (2) Gas chromatography, and (3) Chemical derivatization.
i. Sec_copic Methods
a. Infrared Spectrophotometry
When a lubricant is submitted for analysis, first an infrared (IR) spectrum is
obtained. Application of IR spectroscopy is useful because it allows one:
to retain a permanent record of a given oil formulation that will
serve as a basis for the detection of possible deviation from the
originally approved formulation;
to determine the nature of basestock (e.g., mineral oil, polyalpha-
olefin, ester, polyalkylated benzene or blends);
to detect the presence of certain additives; and
to detect the presence of oxidation products (if acrylate-type vis-
cosity index improvers are not present and/or corrected for) in used
oils.
Some characteristic (diagnostic) IR wavelengths used in oil analysis are:
-IFrequency, cm
3570-3200
3500-3300
2960-2840
1770-1650
1190-1160
1020-960
1625-1575
Structure or Vibrational Mode Producing IR Absorption
OH Stretching (e.g., glycols, phenols)
NH stretching (e.g., amines)
CH stretching (e.g., mineral oils)
C=O stretching (e.g., esters, some oxidation products)
C-O stretching (e.g., esters, ethers, alcohol)
P-O-C (e.g., dialkyldithiophosphates)
Aromatic Ring Structure
A cursory IR spectrum of an oil, therefore, provides a wealth of information
that is also used as a guide in the selection of the proper subsequent analy-
tical methods.
Figure 1 shows the spectra of a known petroleum hydrocarbon oil, a known ester
type oil, and a known synthetic hydrocarbon (PAO) oil. Appendix G shows the
spectra for the individual lubricant samples.
12

ioo
90
80
_0
g_ 60
30
2o
io
o
ti}!it!_!_;fHiiii:
......!ii
"N:
:m_at
3
!iii_ !tl_!!_ii̧ .
!!: ii11
IH :d
3S
31X10
• a, Petroleum
-, :;u
_; r !!
,,, u:
N !'-;1H
Hydrocarbon Base 0il
iooo 800
14 16
_o
ii__o_oo
z.S
I00
90
eo
_o
g_ ao
_ so
3o
2o
io
o
®Up"
i;....
N_
3
il
p*
!?; _}i '!!
iiiiilii ,i_i i!ii_iii
,;.1-._t_l
_._3OO0
Ester-Type 0il
8 9
1200 iooo
12 i,i 16
!I_i_:i_!_i_!!'°°_i__o
qt _ so <
. _o
_i_ _ _i ,o• • __ _ o
8OO _00
o40OO
i 'ii!t
a.5
.b u i i
_ i_,!!-
!!!II_i ili!
3000
C°
FIGURE i.
2OOO I800
WAVENUMBr_ CM"
Synthetic Hydrocarbon (PA0) 0il
':: .mil,,ll ..................... '" iii1ii]i_i!ti_ilitii!illii_ti}_ ill i;;;1600 i 4O0 1200
6.5 7 Y.5 8 9 to i, i_
_I_!....i ooo soo
STANDARD LUBRICANT-TYPE INFRARED SPECTRA
16
g+_ ,00
- i ¸:90
I_ tlN_A_o8
_,o _
_ _i_i'" o
600
13

b. X-Ray Fluorescence Spectrophotometry
After an initial classifying IR spectrum is obtained on an unknown lubricant,
usually a restricted elemental analysis is obtained. X-ray fluorescence
spectrometry (XRF) is a convenient, fast, and nondestructive method capable of
simultaneously detecting and quantitating elements from sodium (atomic number
II) up in the periodic system. Both metals and nonmetals, such as P and S, in
lubricant additives, and wear metals in the case of used oils, are easily
detected and measured without regard to the chemical form in which the ele-
ments are present. The minimum amount of element that XRF can measure depends
upon the element in question, but is usually in the parts-per-million (ppm)
range. A complete qualitative analysis of a lubricant may take as little as
two minutes. Since XRF analysis may take a sample in the form of a solid,
liquid, or powder, sediments in used oils may be analyzed on a homogenized
sample or as a simple filtrate.
Results of the X-ray analysis may be used to direct further investigation
toward restricted areas, i.e., toward the analysis of specific additives or
may be used as a completed answer when only wear or contaminant metals identi-
fication is desired.
As is the case for most spectroscopic analytical methods, XRF is also capable
of "fingerprinting" products. If the "fingerprint" of two products are not
identical, the products are not identical. Atomic absorption techniques also
continue to be used to supplement X-ray to provide quantitative data for
certain metals.
The XRF data obtained for the lubricants in question are tabulated in Table
A-5, and notes on the XRF analysis of the subject lubricants are listed in
Table A-6, contained in Appendix A. Figures A-I to A-II show the XRF spectra
for each lubricant sample.
2. Gas Chromatographic Method for Boilin_ Point Distribution
In the overall purpose of this program, it was desired to characterize lub-
ricants both qualitatively and quantitatively, for which gas chromatography
14

(GC) offers the greatest single instrumental-analytical capability. The
general gas chromatographic approach taken was to use a method which eluted
the sample as completely as possible (whether neat or pretreated lubricant)
and to use as high an analytical elution temperature as feasible. For this
reason, a method essentially equivalent to ASTMD 2887 (Test for Boiling Range
Distribution of Petroleum Fractions by Gas Chromatography) with a resolution
of approximately 5.0 was used for the lubricants.
Boiling point distribution of mineral oils can be done both by molecular
distillation and gas chromatography. GCnot only has higher resolution, but
is more accurate and less time-consumlng than the molecular distillation
approach. The GCapproach assumesthat the hydrogen flame ionization detector
has essentially equal response for all hydrocarbons in the lubricant samples.
Figure 2 shows the chromatograms for a knownpetroleum hydrocarbon oil, a known
ester-type oil, and a known synthetic hydrocarbon (PAO).
Initially, each oll was analyzed by infrared spectroscopy and compared to
reference spectra (Figure i) to determine its type. To confirm the type
classification, the oils were analyzed by gas chromatography to determine
their boiling point distribution (BPD) (Table D-l, Appendix D). Because the
standard ASTMtechnique (8) for BPDhas an upper temperature limit below thatexpected for the lubricants, an AFLRLmodification allowing an extension of
the upper temperature limit was used for this work.(_) The figures in Appen-dix D show typical chromatogramsobtained for each lubricant type.
The petroleum hydrocarbon-based lubricants are adequately characterized by
their boiling point distribution alone (AFLRLmodification of ASTMD 2887),and no further characterization analysis was performed.
The composition of the PAOlubricants was characterized by comparing the peaks
obtained from the BPD to hydrocarbon standards and known PAOlubricants an-
alyzed under the samechromatographic conditions.
3. Chemical Characterization Methods
Further characterizati6n of the ester-type lubricants necessitated identifying
15

48000
40000
× 3ZOOQ
24°°°
t , t , i ,
10 12 14RT in min.
-,\
"-..,,,
i , } , i , i , i , i
16 18 20 22 24 26
a. Petroleum Hydrocarbon Base Oil
60000
× 50000
u
4@000
x
g
20000 -
lORT in min.
i
12
, i , i ,
14 16
AL I' '_
{ ',
\ t \
i , i , i , i , i
18 20 22 24 26
b. Synthetic Hydrocarbon (PAO) Oil
280000.
x 210000.
:I'I4BSOB ,
X
I
15RT in min.
i i i i i i = i
16 21 24 Z7 3_ 33 36
c. Ester-Type Oil
FIGURE 2. STANDARD LUBRICANT-TYPE CHROMATOGRAMS
4
16

the acids and the alcohols used to create the esters and quantitatlng thesecomponents. Techniques for characterizing the ester-type oils and those oils
containing ester componentswere investigated to determine the most efficient
method to use. (10-13) Transesterification techniques offered the most effi-cient method for analysis of the esters. Since no specific published transes-
terification techniques could be identified for lubrlcant-type esters, it was
decided to approach this analysis with regard to the fact that the lubricants
were esters and should be amenable to transesterification.
t i _
Much work has been done by others in the characterization of triglycerides,
the triple esters of glycerol and long chain fatty acids, by transesterifica-
tion techniques.(ll-13) This transesterification involves the splitting of
the ester bond which separates the fatty acid from the alcohol with the subse-
quent formation of the methyl ester of the fatty acids. The methyl esters of
the acids are considerably more volatile than the acid themselves, allowing
for ease of analysis by gas chromatography, The reactions take place in situ,
usually at room temperature, with no additional chemistry necessary. The GC
analysis is performed on the intact reaction mixture, with no extractions or
additional treatment required. This technique works on the esters only, with
no effect on any free acids that may be present, and is reported to yield
quantitative conversions. If this technique could be applied to the analysis
of ester-type lubricants, it would greatly improve the reliability of the
attempts to characterize these lubricants, both new and used, and could aid in
determining the oil breakdown mechanism. Certainly, this technique would be a
significant improvement over the methods previously used which involved
hydrolysis by reflux with alcoholic potassium hydroxide for several hours,
then extractive separation of the alcohol from the carboxylic acid salt,
followed by acidification and extraction of the carboxylic acid. The acids,
thus recovered, were then derivatized for analysis. This older method re-
quired the use of a relatively large sample size to start with, and suffered
from probable high sample losses during workup. Transesterification tech-
niques, if successful in this application, could prove to be fast, efficient,
and yield more accurate quantitative results than the above described method.
17

a. Ester Transesterification Technique
To accomplish the ester transesterification, the following techniques were
employed:
To a capped l-mL reactivial (Pierce Chemicals) vessel containing approximately
i0 to 30 mg of ester-type lubricant was added 300 microliters (0.3 mL) of 0.2
normal methanolic (m-trifluoromethylphenyl)trimethylammonium hydroxide (METH-
PREP II, Applied Science Laboratories). The reaction mixture was allowed to
stand in a warm water bath, approximately 50°C, for 15 to 20 minutes with
occasional shaking. Completeness of reaction was determined by observing a
clear methanol layer. The polyols, pentaerythritol (PE), and dipentaerythri-
tol (DPE) are insoluble in alcohol and form a precipitant lower layer. The
trimethylolpropane (TMP) is soluble in methanol (Figure 3) so that in the case
of a 100-percent TMP ester, no layering as precipitate is observed. Care must
be exercised to keep any moisture or water from entering the reaction mixture
since water will effectively kill the reaction. Completeness of reaction may
be monitored by injecting 1 microliter of the top layer into the gas chromato-
graph at 15-minute intervals of reaction time until no further changes in peak
sizes are measured.
After the reaction has been completed, usually 15-30 minutes, the sample is
diluted to I mL with methanol and the top layer analyzed by gas chromatog-
raphy. This analysis will show the fatty acids present and TMP, if any. In
addition, two antioxidant additives may also be determined with this step,
n-phenyl-alpha-naphthylamine (PANA) and p,p'-dioctyldiphenylamine (Figures E-4
and E-5 in Appendix E).
b. _o__lyol Silylation Technique
To determine the PE and DPE polyols, the top (methanol) layer is carefully
removed and enough N,O-bis(trimethylsilyl) acetamide in silylation grade
pyridine (TRI-SIL/BSA, Formula "P", Pierce Chemicals) is added to the re-
activial to make 1 mL of sample._ The sealed vial is placed in a water bath at
60°-70°C for approximately 15-30 minutes. When a single clear solution is
observed, the reaction is complete, forming the silyl derivative of the
polyol. An aliquot is injected into the gas chromatograph and analyzed for PE
18

,0
|
TMP
A
FIGURE 3. TMP IN METHANOL
and/or DPE. A small amount (0.05-0.1 mL) of the removed top layer may be
added back to the lower layer prior to the addition of the silylating reagent
to serve as markers for the chromatography.
19

V. DESCRIPTIONOFMETHODS
A. Wear Metals Tests
i. X-ray Fluorescence (Filter Method) (14)
In this method, samples are mixed well, and a portion is poured into a 50-mL
beaker. The beaker is weighed, and most of the sample is poured into a 200-mL
beaker containing about 50 to 60 mL filtered reagent grade heptane and
stirred. The sample beaker is weighed again, and the sample weight is ob-
tained by difference. The heptane-sample mixture is poured into a filtration
apparatus designed to produce a 25-mm diameter deposit on a 0.45 _m Millipore
filter. The filter is air dried and subjected to energy-dispersive X-ray
fluorescence analysis.
With the particulate analyte on the filter separated from its fluid matrix,
sensitivity is greatly enhanced. With this technique, 0.003 mg of each ele-
ment may be detected. With sample weight of 30 grams, sensitivities of 0.i
ppm are possible. Wear metals, such as Fe, Ni, AI, and additive particulates
which filter out of the oil, such as Ca and Ba, may be detected.
2. Spectroscopic Analysis for Iron
This method, evaluated in AFWAL-TR-80-4022, February 20, 1980, was modified to
employ a visible light spectrophotometer to measure a colorimetric Fe re-
action.
One mL of the oil sample is mixed with dilute H2SO 4 and isoamyl alcohol. The
acid serves to dissolve iron wear particles and aids in extracting the com-
plexed iron from the oil. A buffer solution and a reducing solution are added
to reduce all iron to the ferrous state. Addition of an indicator, bathophe-
nanthroline disulfonic acid, forms a red-colored complex with the iron and is
measured colorimetrically.
The modification made to the method described in the report involves the final
dilution step. As described, 21 mL of iron-free distilled water is added to
20

the French square bottle used for the reaction, and the bottle is used as acuvette in a Hach DR/2 spectrophotometer. Our reaction was conducted in 30-mL
ground glass stoppered centrifuge tubes. The final dilution is performed with15 mL of iron-free deionlzed water. An aliquot of the water phase is removed
and measured in a l-cm glass cuvette at 530 nm on a BeckmanACTAC III spec-
trophotometer. Standard solutions of 5-, I0-, 50-, and lO0-ppm iron were used
for calibration purposes. Iron concentrations of 1 ppm or more were easilydetected.
B. Specific Heat by Differential Scannin$ Calorimetry
The oils were analyzed for heat capacity (Cp) values by differential scanning
calorimetry (DSC). The instrument used was a du Pont Model 990. Both new and
used oils were tested. The technique and calculations used were obtained from
the du Pont Model 990 operating instructions. Instrument calibration was
obtained using the heat of fusion of indium. Accuracy was determined using a
sapphire standard.
I. Procedure
a. Backsround
Empty sample pans (and lids) were placed on the sample pedestal and repetitive
traces made. Values for the periodic background data were plotted as a func-
tion of the time obtained. For final calculation, average or interpolated
values for background were used. Absolute values for this measurement are
arbitrary since a reference zero value is picked arbitrarily. This does not
affect the final results, since it is the difference between measurements that
is important.
b. Calibration
A sample of indium supplied with the DSC was weighed into an aluminum sample
pan. The edges of the pan were then crimped and sealed. This sample was then
run on a daily basis for most of the work. Using the known value for its heat
of fusion and by determining the area of the endotherm using a polar plani-
21

meter, an average value for the cell calibration coefficient (E) was deter-
mined, using the following equation:
where
6O ABE =
Hm
H = Heat of fusion (mcal/mg)
A = Peak area (sq in.)
qs = Y-axis range [(mcal/sec)/in.]
m = Sample mass (mg)
B = Time base setting (min./in.)
c. Accuracy
(i) Temperature--Extrapolation of the leading edge of the
above endotherm to the baseline yields the melting point of the indium sample.
This may then be compared to the x-axis markers.
(2) Heat capacity--A specimen of sapphire was weighed and
placed in a sample pan. Calculated values were compared with values deter-
mined for this material by the National Bureau of Standards.
d. Sample Introduction
Aliquots of the oil specimens were taken from the container as received.
Aluminum sample pans were tarred prior to sample weight being recorded. The
pan was then covered with an aluminum cover, and the assembly placed into the
DSC.
e. Heat Capacity Measurement
The equation for calculation of heat capacity [using the calibration coeffi-
cient as determined in Sec. (2) above] was:
22

where
_60EAqC (mcal/mg deg C) = s AYP
m
E = Cell calibration coefficient at the temperature of interest
(dimensionless).
Aq s = Y-axis range, [(mcal/sec)/in.]
H = Heating rate, (deg/min.)r
AY = Difference in Y-axis deflection between sample and blank curves at
temperature of interest (inches).
m = Sample mass, (mg).
f. Instrument Conditions
The following parameters were used to obtain the required data:
ao
b.
c.
d.
e.
f.
g.
h.
Starting temperature: 40°C (isothermal)
Ending temperature: 150°C (200°C for indium scan)
Program rate (after start): 10°C/min.
Recorder setting: 20°C/in.
Time rate (when used): 2 min./in.
Y-axis: i (mcal/sec)/in.
Average sample wt: 3 mg
Analysis temperatures: 84°C, 100°C, 140°C
2. Results
a. Instrument reproducibility
(i) Baseline--The standard deviation of 14 measurements was:
84°C 0.070 in.
100°C 0.079 in.
140°C 0.077 in.
23
H

The average deviation from the starting point was:
84°C 2.00 in.
100°C 2.00 in.
140°C 2.01 in.
(2) Indium--The standard deviations of 13 values taken at the
above temperatures were 0.038, 0.034, and 0.037 in., respectively. Relative
to the starting point, this is a variation of 1.8 percent, 1.6 percent, and
1.8 percent, respectively.
b. Calibration
The average peak area for 3.2 mg of indium over seven separate measurements
was 0.195 sq in. with a relative standard deviation of 4.6 percent.
c. Accuracy
The table below shows the calculated and literature values for sapphire at the
three temperatures of interest.
°C Cp (calc.) Cp (lit)
82 0.225 0.219 (380K)
i00 0.227 0.225 (400K)
140 0.232 0.236 (440K)
d. Sample Data
The average values for heat capacity (Cp) and the standard deviation (o) for
each sample at each study temperature are presented in Table A-8 (Appendix A).
C. Gas Chromatosraphy Methods
Two gas chromatographic methods are used for the analytical characterization
of lubricants. They are discussed below.
24

Method 1 was developed at the AFLRLand has been in use in our laboratory for
several years. It has been proposed for inclusion as an ASTMstandard test
method. Method 2 was developed in our laboratory specifically for this work.
I. Boilin$ Point Distribution of Lubricants (9)
The injection port for this system is an air-cooled 15.2 cm movable injector
with a pyrex glass wool-packed metal port with a water-jacketed cooled septum.
The sample is syringe injected into the glass wool, 6.4 cm from the septum
face while the port is in the outer air-cooled position. The port is then
pushed into a 7.6-cm heated jacket at 340°C, and after 3 minutes the port is
pulled back to the air-cooled position. The water-jacketed inlet septum
holder acts as a retainer when the port is pushed into the heated jacket.
Approximately 8 cm of the injection port is in the heated jacket when the port
is in the air-cooled position. This inlet hardware was designed to obtain the
benefits of on-column plug injection but prevent contamination of the analyti-
cal column with the nonvolatile residual fraction of the sample. The water
cooler prevents septum bleed at the elevated temperatures. Air cooling of the
injection port reduces sustained vaporization (bleed) of heavy residual ma-
terial in the sample. The movable injection port is connected to a 6 feet x
i/8-inch stainless steel coiled column in the column oven. A second column in
the oven is used to provide dual column-dual detector (hydrogen flame ioniza-
tion) operation to compensate for column bleed. The columns are packed with
10% Dexsil 300 on Chromosorb P, AW 45/60 mesh. The column oven is held at O°C
for 2 minutes and then programmed to 450°C at 15°C/min and held at 450°C for 5
minutes. An Altamont crude oil (obtained from the Bureau of Mines, Bartles-
ville, Oklahoma) diluted in carbon disulfide provides n-saturate peak identi-
fication to n-C60 (Figure D-l). Additionally, a special C4-C40 normal satu-
rate standard (Table 3) may be used for calibrating the Hewlett-Packard labor-
atory data system (Model 3354-B/C) boiling point distribution method.
2. Gas Chromatography of Lubricant Derivatives
A Hewlett-Packard Model 5880A capillary gas chromatograph equipped with a
flame ionization detector (FID) and a 50 meter x 0.2 mm ID SE-54 fused silica
capillary column was used for this work. The carrier gas was helium at a
25

J
5
(Note:
TABLE 3. BOILING POINT DISTRIBUTION STANDARD
The following solution is diluted with carbon disulfide
in the ratio 1:3.)
Carbon Amount
Number Per I00 ml
3 add to desired level
4 add to desired level
5 I0.8ml
6 2.7ml
7 5.4mi
8 5.4mi
9 10.Sml
i0 5.4mi
ii 5.4mi
12 21.6mi
14 10.Sml
15 5.4mi
16 10.Sml
17 5.4mi
18 l.Sg*
20 l.Sg
24 l.lg
28 0. Tg
32 0.7g
36 0.7g
40 0.4g
Injection volume is 2 microliters.
*C18 to C40 are solids.
nominal flow rate of 1.0 mL/min. The FID was maintained at 400°C and the
injector at 375°C. A split injection technique was used at a split ratio of
i00:i with a 1.0 microliter injection. The oven temperature was programmed
from 30 ° to 320°C at 10°C per minute with a final hold of 16 minutes. A
calibration standard of the mono-carboxylic acid methyl esters from n-C 4 to
n-Cl0 (Figure E-I), and mixed dicarboxylic acid methyl ester standard from
n-C 5 to n-Cl0 (Figure E-2) were prepared. In addition, the silyl derivatives
of TMP, PE, and DPE were prepared for calibration use (Figure E-3). Deriva-
tives of the two antioxidants PANA (Figure E-4) and p,p'-dioctyldiphenylamine
(Figure E-5) were prepared by the transesterification technique applied to the
ester-type lubricants. Response factors for all compounds analyzed using the
FID was set at 1.00. Compounds were identified by comparison of their re-
tention times to that of the standards. Figure E-6 shows the results of the
transesterification and silylation technique applied to sample AL-II250-L
(NASA C).
26

/
Vl. DISCUSSION
This report presents physical and analytical chemical characterization data
for the eleven lubricants which were used in transmission performance studies
by NASA-Lewis engineers. No field hardware performance tests were conducted
by this laboratory and, at the request of NASA-Lewis, there was no attempt to
correlate these data with the lubricants' field performance. The correlation
of the chemical and physical data to the performance of the lubricants is
outside the scope of this report but will be discussed by NASA-Lewis engineers
in a separate NASA-Lewis report.
A. _h__sicai Test Methods
i. _ecific Heat
From the data shown in Table A-8, it can be noted that the differential scan-
ning calorimetry (DSC) instrument, when run with either a blank or the stand-
ard material over again, has good precision and accuracy. However, when the
sample oils were introduced, precision became quite poor, particularly for the
"used" oils. Therefore, it is felt that the samples are probably not homo-
geneous. Thus, without prior filtering or some appropriate homogenizing
treatment being performed, multiple values must be obtained and averaged to
produce an acceptable value.
2. Friction and Wear Tests
Using the test conditions detailed in Section IV.B., the initial determination
was attempted employing lubricant AL-II250-L (NASA Code C). In less than I00
cycles of the rotating test ring, contact seizure resulted, and the test block
sustained gross asymetrical wear. The test was immediately repeated using the
same test conditions and lubricant. Contact seizure between the block and
ring again resulted at approximately 2250 cycles. It was then decided to
employ lubricant AL-II266-L (NASA Code K), which is known to have a high
load,carrying capability, and to attempt another LFW-I test using the same
test conditions as above. This lubricant successfully completed the test of
I0,000 cycles, although there was a transfer of material from the block to the
27

rotating ring specimen as evidenced by the weight change at test termination.
Based on these results, it was decided to try another lubricant under these
same test conditions. Therefore, a test using AL-II252-L (NASACodeA) was
initiated, and contact seizure resulted at approximately 1625 cycles. In view
of these happenings and also due to the fact that AL-II250-L is a qualified
MIL-L-23699 lubricant with demonstrated satisfactory performance in gas tur-
bine engines, it was concluded that a 100,000-psl stress would be too severe
in LFW-I testing. Continued evaluation at that load would essentially provide
little more than pass/fail results. This information was conveyed to theNASA-Lewisproject engineer who approved of the recommendation to utilize a
reduced machine load. Therefore, the test series was performed at a selected
load to give an initial mean Hertz compressive stress of 80,000 psi. It is
interesting that one more contact seizure was experienced employing lubricantAL-II250-L even at the reduced contact stress. It is also of interest that
all tests having contact seizures both at the original load and at the reduced
load resulted in a weight gain for the test ring, indicating a transfer of
material from the stationary block to the rotating ring during testing.
Normally, as expected, there was a weight loss for both block and ring during
tests not experiencing seizure. After the problems discussed above were dealt
with, the test series proceeded without difficulties. Appendix B presentstest summarydata for the ii lubricants tested in accordance with the modifiedprocedure.
B. Spectroscopic Methods
i. Infrared Spectrophotometry (IR)
IR offers a quick, easily interpreted method for identification of lubricant
basestocks. The spectrum (Figure i) for ester-type basestocks shows a promi--i
nent specific peak at 1730-1750 cm which is absent from the spectrum of
hydrocarbon oils. When compared to the synthetic hydrocarbon and petroleum
hydrocarbon basestocks, the basestock type is quite evident. While the syn-
thetic hydrocarbon and petroleum hydrocarbon spectra appear the same, which is
expected since they are both essentially pure hydrocarbons, there is a signi-
28

; /
-Ificant difference. The small peak at 1600 cm in the spectra for petroleum
hydrocarbons is due to aromatic hydrocarbon ring structure. This is typical
for petroleum hydrocarbon basestocks and is not found in the synthetic hydro-
carbon basestocks. The spectrum for the synthetic hydrocarbon basestock has
no absorption peak at this frequency. Appendix G shows the spectra for the
individual lubricant samples.
2. Metals Analysis
The X-ray fluorescence method for metals analysis offers a rapid, non-
destructive, sensitive, and accurate identification and measurement technique
for most metals found in lubricants. The use of the spectroscopic analysis
for iron afforded an even greater degree of sensitivity when it was required.
These data are presented in Tables A-5 through A-6. The interpretation of the
XRF data is detailed in Table A-6.
C. Boiling Point Distribution by Gas Chromatography
The BPD method used for lubricants at the AFLRL is a modification to the ASTM
D 2887 method. The modification enables the extension of the upper tempera-
ture limit as defined by the ASTM D 2887 procedure. This modification is
presently being evaluated by the ASTM as a new method for inclusion in their
list of standard methods. The chromatograms in Appendix D which this method
produces show very distinctly different "patterns" for each type of lubricant
basestock. Indeed, the patterns, especially for the ester-type lubricants,
are virtual "fingerprints" for each sample and confirm the IR results.
D. Chemical Characterization
As an integral part of the Army's overall power train lubrication research
effort, the AFLRL has been involved in developing the technology to charac-
terize lubricants. The first generation approach to the analysis of lubri-
cants was detailed in an AFLRL interim report published in March 1976.( ! )
Further developments and refinements led to a second generation analytical
approach to the characterization of lubricants.(3,10,15)
29

This report details the third generation analytical approach to the analysis
of lubricants. This approach has simplified the analysis of the lubricants by
a rapid and easily accomplished in-situ derivatization of the esters by a
transesterification technique. The GC analysis is conducted on the reaction
mixture and yields detailed information regarding the chemical composition of
the lubricants. In addition, the chromatography makes it possible to deter-
mine the presence of some organic antioxidant additives. Also, it may be
possible to determine the causes of corrosion within the engine, and the
reasons for the corrosion variability between oils, if any. The technique
utilizes very small sample amounts with a minimum of chemical treatment and
handling. The results achieved using this new, third generation
approach to the characterization of lubricants are summarized in Table 4.
The initial infrared spectroscopic examination of the lubricants provided a
preliminary chemical class identification of each lubricant, i.e. petroleum,
synthetic hydrocarbon, ester (Figure I and Appendix G). Coupled with the
boiling point distribution chromatograms (Appendix D), the class or type
identification proved to be positive in every case. Each type of lubricant
yielded a distinctive chromatographic pattern (Appendix D). The type classi-
fication was further confirmed by the detailed derivative characterization
work (Appendix F). Table 4 summarizes the basestock characterizations. The
data in Table 4 are repeated in Table F-I for convenience when referring to
Appendix F.
TABLE 4. BASESTOCK CHARACTERIZATION SUMMARY
NASA Code A B C D E F G H I J K
AFLRL Code 11252 11268 11250 11254 11256 11258 11260 11262 11264 11270 11266
Carboxyllc
Acids - %
C-4 T 9 T T
C-5 _ _ 46 18 di-63 13 22 22C-6 _ _ I0 13 di-37 T 2 14 16
C-7 _ ._ 17 16 73 50 19 21 24
lO 2, 1C-9 o o 13 16 7 4 23 29
C-10 _ _ 4 4 5 32 12 1C-12 _ _ 2 T
Alcohols
TMP I00 I00 50
PE I00 I00 50 I00 99
DPE 1
MONO- (C13)100
Basestock
Ester x x dibasic (20%) x
Petroleum x x
Synthetic x (80%)
Hydrocarbon
C30, % 43 38
C40, % 45 50
C50, % 12 12
30

The chemical composition data for the test lubricant basestocks have also been
presented graphically as a "Daisy Graph". A "Daisy Graph" is a method for
representing a large number of parameters or variables in a simple fashion for
easy comparison. The turbine engine oil "Daisy Graph" key is provided inFigure F-I. The angular position of the radial llne is characteristic for
each individual component. While not necessary, different colors have been
used to illustrate the different chemical families of compoundsfor ease in
comparing the composition of the lubricants. Red represents the mono-carboxylic acids present in polyol esters and blue represents the polyol base
for the polyol ester. Green represents the mono-alcohols of dibasic acid
esters, and black represents the base dicarboxyllc acid of the dibasic acid
ester. The length of the Daisy lines is proportional to the concentration of
each component. In summary, the daisy key is outlined as follows:
Parameter/Color
Red
Blue
Green
Black
Length
Indicates
Mono Carboxylic Acids
Polyols
Mono Alcohols
Dicarboxylic Acids
Concentration
Following the analytical characterization scheme shown in Figure 4, two lubri-
cant samples were identified as petroleum basestock types, AL-II252-L (NASA A)
and AL-II268-L (NASA B) (Tables F-2 and F-3). They were characterized by
comparison of their infrared spectra and boiling point distribution (BPD)
chromatograms to those of known basestock types. Figure la shows the IR
spectrum of a known petroleum hydrocarbon basestock lubricant. The major-i -i -i
bands at 2800-3000 cm , 1520 cm , and 1370 cm wavenumbers are due to C-H
and CH 3 and are what would be expected for this type of material. When this
spectrum is compared to the spectrum for a synthetic hydrocarbon (PAO) (Figure
Ic), they appear almost identical with one important distinction. The small
-iband at 1600 cm wavenumbers is only seen for the petroleum basestock and is
due to aromatics. The synthetic hydrocarbons (PAO) are composed of oligomers
made by polymerizing an olefin, e.g., decene (CI0), to form compounds consist-
ing of multiples of this CI0 olefin, e.g., C20's C30's , C40's , and contain no
aromatics. Therefore, the band at 1600 cm -I is not seen in the spectrum for a
PAO lubricant.
31
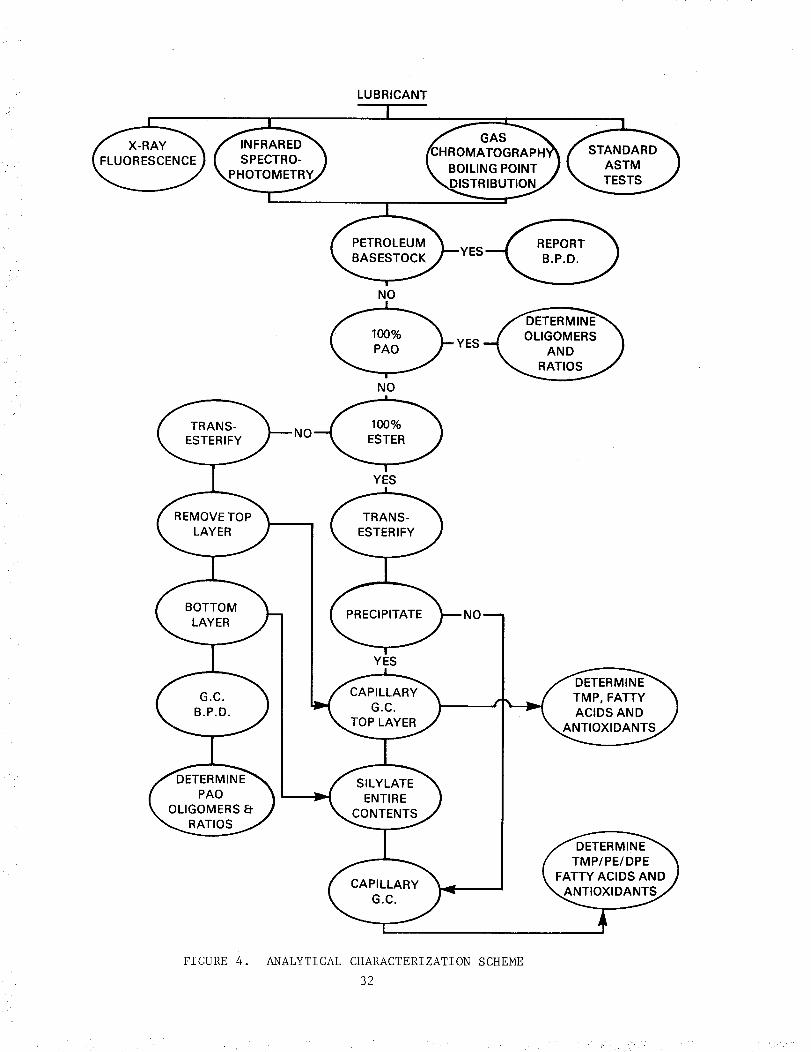
LUBRICANT
TRANS-ESTERIFY
100%
ESTER
REMOVE TOP
LAYER
BOTTOM
LAYER
G.C.
B.P.D.
YES
YES
CAPILLARY
G.C.
TOP LAYER
TMP, FATTY
ACIDS AND
ANTIOXIDANTS
PAO
OLIGOMERS Er
RATIOS
FIGURE 4.
S ILY LATE
ENTIRE
CONTENTS
CAPILLARY
G.C.
ANALYTICAL CHARACTERIZATION SCHEME
32

r
When the spectra for NASA samples A and B (Figures G-I and G-2) are examined
and compared to the known lubricant spectra (Figure I), it becomes apparent
that these samples are petroleum basestocks because of the typical C-H and CH 3
bands and the small band at 1600 cm -I typical for aromatics. The small bands
-I -iat 1700 cm and 1735 cm seen on both sample spectra are probably due to
additives such as viscosity improvers, antioxidants, etc.
When the hydrocarbon spectra are compared to the spectrum of the ester-type
lubricant (Figure Ib), the dissimilarities become apparent. The major band at-i
1740 cm in the ester lubricant is due to the ester or C=O bands and is quite
strong and specific. It is not seen in the petroleum spectra.
Figure 2 shows the chromatograms obtained for known petroleum, PAO, and ester-
type oils. Each type yields a distinctively different chromatogram. The
broad almost Gaussian-shaped hump of the petroleum oil (Figure 2a) is due to
the large number of similar compounds emerging very close together and, when
compared to the boiling point standard, its BPD may be easily determined.
The PAO chromatogram (Figure 2b) is characterized by the distinct separation
of the oligomer groups. The carbon number range of each oligomer group may be
determined by comparison to a boiling point standard (Figure D-2, Appendix D),
which consists of known compounds eluting in boiling point order.
The chromatogram of the ester-type oil is a "fingerprint" pattern (Figure 2c).
It is quite distinctive when the polyol esters cover a relatively broad range
of esterified acids, e.g., C4 to CI0 monocarboxylic acids. If the esters
should be of the dicarboxylic acid type, AFLRL experience has shown that they
usually are very narrow in molecular weight range, e.g., C 7 and C 8 dicar-
boxylic acids and yield a chromatogram showing a relatively narrow well-
resolved single peak (Figure D-6). By comparing the chromatogram and IR spec-
trum of an unknown sample to the chromatograms and IR spectra of the above
described known oils, the basestock type and whether or not it is a blend of
oil types can be determined.
NASA samples A and B were identified as petroleum basestocks by this techni-
que, and no further chemical characterization was done (Appendix D, Figures
D-4 and D-12).
33

From its IR spectrum and boiling point distribution chromatogram, one lubri-
cant sample was identified as a i00 percent synthetic hydrocarbon type (PAO),
AL-II258-L (NASAF) (Figure D-7). The very typical PAOchromatogram indicated
that this lubricant was not a blend. The molecular weight range of the oli-
gomers was identified by comparison to the calibration standard (Figure D-2)
used for the boiling point distribution and to "standard" PAOlubricants ofknown composition (Table F-7).
One lubricant sample AL-II260-L (NASAG) (Figure D-8) was identified both by
its infrared spectrum and BPD chromatogram as being a mixture of PAOand
ester-type basestocks. Following the analytical characterization scheme, the
entire sample aliquot was transesterified. This yielded two distinct layers.
The larger, upper methanol layer containing the fatty acid methyl esters
(FAME) was carefully separated from the lower layer and analyzed by capillary
GC to determine the FAMEcomposition. By comparison of the FAMEanalysis to
the methyl ester standards (Figures E-I and E-2), it was determined that the
ester portion of this lubricant was composedof C7 and C8 monocarboxylic acidsand TMP. The "Daisy Graph" (Figure F-5) shows the distribution graphically,
and Table F-8 lists the values. The lower layer was chromatographed according
to the BPDprocedure. This yielded a chromatogram typical for a PAO. The PAO
oligomers and their ratios were determined by comparison to the BP standard
and the known PAOmaterials. In addition, the lower layer was silylated and
analyzed by capillary GCfor the presence of any PE and/or DPE.
Analysis of lubricant AL-II262-L (NASAH) (Figure D-9) showed a I00 percent
TMPester-type basestock with the carboxylic acids ranging from C6 to C12.The "Daisy Graph" (Figure F-6) shows the ratio of the components, and TableF-9 lists the actual values.
The IR spectra and BPDchromatograms of lubricants AL-II250-L (NASAC) (Figure
D-3), AL-II254-L (NASAD) (Figure D-4), and AL-II270-L (NASAJ) (Figure D-13)
indicated a i00 percent ester-type basestock. The transesterification of
these lubricants produced a precipitate. The capillary GC analysis of the
supernatant layer showeda composition of FAMEranging from C4 to CI0. Fol-lowing this analysis, the entire transesterified sample was reacted with the
silylating reagents to derivatize the precipitate. Analysis by capillary GC
34

T
of this mixture showed that these lubricants were I00 percent PE ester-type
basestocks. The "Daisy Graphs" (Figures F-2, F-3, and F-8) show the ratio of
the components, and Tables F-4, F-5, and F-If list the actual values for each
lubricant, which differ for each lubricant.
Analysis of lubricant AL-II264-L (NASA I) (Figure D-10) showed it to be com-
posed of TMP and PE ester type basestocks, at a 50/50 mixture with the car-
boxylic acids ranging from C 5 to C12. The "Daisy Graph" (Figures F-7) shows
the ratio of the components, and Table F-IO lists the actual values.
Analysis of lubricant AL-II266-L (NASA K) (Figure D-II) showed a mixture of
predominantly (99 percent) PE ester basestock with a small amount (I percent)
of DPE ester basestock and carboxylic acids ranging from C 4 to CI0. The
"Daisy Graphs" (Figure F-9) show the ratio of the components, and Table F-12
lists the actual values.
VII. CONCLUSIONS AND RECOMMENDATIONS
The results of this new third generation analytical approach to the character-
ization of lubricants clearly indicate that it can be utilized as an estab-
lished technique. It provides a quick and efficient route to the qualitative
and quantitative determination of lubricant composition, not only for the
basestock, but also for some organic additives, previously not easily amenable
to analysis in fully formulated lubricants.
The application of newly developed chemical techniques plus the use of capil-
lary column gas chromatography has greatly enhanced AFLRL capability to pro-
vide reliable and accurate information on lubricant composition. It is recom-
mended that additional work continue towards reducing this technique to prac-
tical application.
With regard to the specific heat determination, it is recommended that addi-
tional testing continue on filtered lubricants, both new and used, to optimize
the results of this technique. Because of the presence of particulate matter
in a nonhomogeneous mixture, precision was poor, and multiple values had to be
obtained to produce an acceptable average value.
35

During the LFW-I friction and wear testing, some areas for improvement intesting surfaced.
Based on this work, the following additional activities are recommendedtobetter characterize the above discussed lubricants:
Perform additional LFW-I friction and wear testing to determine if
optimum test conditions such as temperature, load, wear specimen
material, etc., can be established to better characterize the fric-
tion and wear properties of the lubricants and their basestocks.i
Perform ball-on-cylinder machine (BOCM) tests for comparison with
the LFW-I test machine results. The BOCM in its present configura-
tion is primarily employed for fuel lubricity evaluations and would
need to be modified with a higher temperature capability for lubri-
cating oil evaluations. This machine is being widely used by CRC,
commercial organizations, and testing laboratories for lubricity
work both in this country and abroad.
Since considerable engineering interest is being expressed in trac-
tion drives for new helicopter power systems, the methodology
developed in this program should be applied to traction fluids.
These fluids are chemically different from the petroleum oils,
synthetic PAO's, and synthetic esters analyzed in this program.
Traction fluids have special physical properties resulting from the
unique chemical structures of the composite compounds employed. A
major type of structure reported to be used in traction fluids is
hydrogenated copolymers of _ -methyl styrene and butadiene. These
compounds exhibit reversible semi-solidification under extreme
pressure and shear. The current methodology should be applied to
compounds of this and other types to determine where it is useful
and should be expanded to provide the necessary compositioned infor-
mation in those areas where the need exists.
36

Vlll. REFERENCES
I. Fischer, G.K., Editor, NASA Conference Publication 2210, ADVARADCOM Tech-
nical Report 82-C-16. Proceedings of a symposium "Advanced Power Trans-
mission Technology," held at Lewis Research Center, Cleveland, Ohio, June
9-11, 1981.
2. Stavlnoha, L.L., Fodor, G.E., Newman, F.M., and Lestz, S.J., "Analytical
Approach to the Characterization of Military Lubricants", U.S. Army Fuels
and Lubricants Research Laboratory, Southwest Research Institute, San
Antonio, TX, Interim Report AFLRL No. 77, AD A027397, Contract No.
DAAG53-76-C-O003, March 1976.
3. Newman, F.M. and Stavinoha, L.L., "The Physical and Chemical Characteri-
zation of Ten Military Turbine Engine Lubricants", U.S. Army Fuels and
Lubricants Research Laboratory, Southwest Research Institute, San
Antonio, TX, Final Report AFLRL No. 115, AD A074073, Contract No. DAAK70-
79-C-0142, September 1979.
4. ASME Pressure Viscosity Report Vol. I and II, American Society of Mechan-
ical Engineers, New York, 1953.
5. Bair, S. and Winer, W.D., "A Rheological Model for Elastohydrodynamic
Contacts Based on Primary Laboratory Data", Transactions of the ASME,
Journal of Lubrication Technology, i01, No. 3, July 1979, pp 258-265.
6. Bair, S. and Winer, W.D., "Some Observations in High Pressure Rheology
of Lubricants", Transactions of the ASME, Journal of Lubrication Technol-
sgY, 104, No. 3, July 82, pp. 357-364.
7. Bair, S. and Winer, W.D., "Surface Temperatures and Glassy State Inves-
tigations in Tribology - Part IV", NASA Contractor Report 3368, January
1981.
8. ASTM D 2887-73, "Standard Test Method for Boiling Range Distribution of
Petroleum Fractions by Gas Chromatography", ASTM Standards on Chromatog-
raphy, First Edition, 1981.
9. Jones, K.B., "Proposed Method for Boiling Point Distribution of Lubri-
cants and Fluids by Gas Chromatography", U.S. Army Fuels and Lubricants
Research Laboratory, Southwest Research Institute, San Antonio, TX.
I0. Stavinoha, L.L., "Determination of Synthetic Hydrocarbons in Mineral Oil
Lubricants", U.S. Army Fuels and Lubricants Research Laboratory, South-
west Research Institute, San Antonio, TX, Interim Report AFLRL No. 86, AD
A039964, Contract No. DAAG53-76-C-0003, January 1977.
37
II. Ma, T.S. and Ladas, A.S., Orsanic Functional Group Analysis by Gas Chrom-
atography, Academic Press.
12. "Esterification and Acylation", Bulletin 721E, Supelco, Inc., Bellefonte,
PA.
13. Gas-Chrom Newsletter, January 1978, Applied Science Laboratories, State
College, PA.
14. Greenberg, M.K. and Newman, F.M., "Application of Energy-Dispersive
X-Ray Fluorescence Spectroscopy to the Analysis of Contaminants in Fuels
and Lubricants", Interim Report AFLRL No. 102, Contract No. DAAK70-78-C-
0001, AD A062792, November 1978.
15. Stavinoha, L.L., "A Gas Chromatographic Method for Fingerprinting Synthe-
tic Lubricants", Interim Report AFLRL No. 87, Contract No. DAAG53-76-C-
0003, January 1977.
38
..... • i: :¸_"i:i• :_

APPENDIXA
PHYSICALTESTDATA
39


_k
NASA-Lewis
Description
A-New
A-Used
B-New
B-Used
C-New
C-Used
D-New
D-Used
E-New
E-Used
F-New
F-Used
G-New
G-Used
H-New
H-Used
I-New
I-Used
J-New
J-Used
K-New
K-Used
TABLE A-I. ANALYTICAL REPORT
SYNTHETIC LUBRICANT ANALYSIS
SwRI
Oil Code
AL-II252-L
AL-II253-L
AL-II268-L
AL-II269-L
AL-II250-L
AL-II251-L
AL-II254-L
AL-II255-L
AL-II256-L
AL-11257-L
AL-II258-L
AL-II259-L
AL-II260-L
AL-II261-L
AL-II262-L
AL-II263-L
AL-II264-L
AL-II265-L
AL-II270-L
AL-II271-L
AL-II266-L
AL-II267-L
Viscosity @ Listed
Temperature, cSt40°C 82°C 100°C
37.48 10.48 7.01
34.84 9.73 6.51
33.15 9.64 6,52
31.79 9.21 6.24
26.40 7.69 5.13
26.28 7.69 7.01
26.17 7.50 5.00
26.12 7.49 4.99
33.91 8.91 5.87
33.70 8.89 5.85
28.01 8.15 5.36
27.98 8.04 5.35
56.65 15.05 9.83
51.13 13.75 8.96
13.16 4.73 3.38
13.05 4.65 3.32
24.19 7.18 4.85
23.88 7.11 4.82
24.76 7.23 4.89
24.60 7.20 4.88
26.39 7.61 5.09
25.17 7.50 5.04
41

NASA-LewisDescription
A-New
A-Used
B-New
B-Used
C-New
C-Used
D-New
D-Used
E-New
E-Used
F-New
F-Used
G-New
G-Used
H-New
H-Used
I-New
1-Used
J-New
J-Used
K-New
K-Used
TABLE A-2. ANALYTICAL REPORT
SYNTHETIC LUBRICANT ANALYSIS
SwRl
Oil Code
AL-II252-L
AL-II253-L
AL-II268-L
AL-II269-L
AL-II250-L
AL-II251-L
AL-II254-L
AL-II255-L
AL-II256-L
AL-II257-L
AL-II258-L
AL-II259-L
AL-II260-L
AL-II261-L
AL-II262-L
AL-II263-L
AL-II264-L
AL-I1265-I
AL-II270-L
AL-II271-L
AL-II266-L
AL-II267-L
Specific Gravity @ Listed40°C 82°C 100°C
0.8620 0.8558 0.8514
0.8622 0.8544 0.8533
Temperature,
API Gravity
29.8
29.8
0.8626 0.8548 0.8546 29.9
0.8625 0.8545 0.8552 29.9
0.9973 0.9862 0.9843
0.9966 0.9880 0.9844
0.9868 0.9768 0.9746
0.9867 0.9773 0.9745
0.9322 0.9211 0.9201
0.9305 0.9215 0.9205
0.8262 0.8108 0.8088
0.8244 0.8150 0.8139
0.8629 0.8536 0.8527
0.8626 0.8517 0.8532
0.9442 0.9320 0.9313
0.9438 0.9348 0.9307
0.9659 0.9568 0.9546
0.9659 0.9566 0.9544
0.9856 0.9759 0.9747
0.9856 0.9765 0.9747
0.9829 0.9721 0.9725
0.9824 0.9755 0.9718
8.2
8.2
9.7
9.7
17.7
17.9
36.0
36.3
29.6
29.7
15.7
15.8
12.8
12.8
10.1
I0. i
10.3
10.3
42

TABLEA-3. ANALYTICALREPORT
SYNTHETICLUBRICANTANALYSIS
*Strong Acid
NASA-Lewis SwRlDescription Oil Code
A-New AL-II252-L
A-Used AL-II253-L
B-New AL-II268-L
B-Used AL-11269-L
C-New AL-II250-L
C-Used AL-II251-L
D-New AL-II254-L
D-Used AL-II255-L
E-New AL-II256-L
E-Used AL-II257-L
F-New AL-II258-L
F-Used AL-II259-L
G-New AL-II260-L
G-Used AL-II261-L
H-New AL-II262-L
H-Used AL-II263-L
I-New AL-II264-L
1-Used AL-II265-L
J-New AL-II270-L
J-Used AL-II271-L
K-New AL-II266-L
K-Used AL-II267-L
Value = 7.1 on sample AL-II256-L
Total Acid Number
(mg KOH/g)
0.54
0.54
0.62
0.62
0.01
0.02
0.07
0.07
"15.8
"15.7
0.42
0.51
3.2
3.5
0.34
0.34
0.34
0.38
0.51
0.38
0.48
0.43
and AL-11257-L
43

NASA-LewisDescription
A-New
A-Used
B-New
B-Used
C-New
C-Used
D-New
D-Used
E-New
E-Used
F-New
F-Used
G-New
G-Us ed
H-New
H-Us ed
I-New
1-Used
J-New
J-Used
K-New
K-Used
SwR I
Oil Code
TABLE A-4. ANALYTICAL REPORT
SYNTHETIC LUBRICANT ANALYSIS
No. of Particles/100 mL
Particle Sizes in Micrometers
5-15 15-25 25-50 50-100 i00 Fibers
AL-II252-L 17 2 2 4 i0
AL-II253-L 4 1 6 7 ii
12
10
AL-II268-L 6800 2980 200 40 44 112
AL-II269-L 49 51 27 23 16 18
AL-I1250-L 72 36 18 12 i0
AL-II251-L 4 1 2 I 5
AL-I1254-L 685 275 35 22 15 20
AL-II255-L 200 65 38 24 21 39
AL-II256-L 120 60 23 25 22 33
AL-II257-L 44 7 10 13 12 19
AL-11258-L 60 16 30 13 7 22
AL-II259-L 475 8 2 5 6 52
AL-II260-L 49 39 45 38 34 78
AL-II261-L 4740 i0 11 9 6 34
AL-II262-L 1780 72 45 40 25
AL-II263-L 1850 118 108 60 52
32
62
AL-II264-L 54 23 17 16 4 19
AL-II265-L 840 660 450 210 80 120
AL-I1270-L 47 22 i0 7 12 18
AL-II271-L 36 18 14 8 ii 29
AL-11266-L 185 175 I00 70 35 45
AL-II267-L 105 48 35 21 20 22
44

Ln
TABLE A-5. ANALYTICAL REPORT
SYNTHETIC LUBRICANT ANALYSIS
NASA-Lewls Elements by XRF (ppm)*
DescrIptlon Oil Code H_L" A1 Cl Fe Ni Cu Pb Zn(1) p(2) S(2) Ca (2) Ba (2) " $I Mn
A-New AL-II252-L 0.48 - 2.47 - - - 0.21 - 0.18 4.71
A-Used AL-II253-L - 5.91 1.12 0.51 0.10 0.14 - 0.11 0.17 1.12
B-New AI.-II268-L 0.86 1.80 .... 0.88 0.47 10.40
B-Used AL-II269-L 0.60 4.00 1.90 0.57 - - - 0.74 0.27 7.40
0.230.12
C-New AL-II250-L 0.28 0.73 0.13 - - - 0.26 -
C-Used AL-II251-L - 2.91 1.04 2.19 0.21 0.12 - 0.15 0.19 0.20
D-New AL-II254-L 0.27 0.90 .... 0.16 - -
D-Used AL-II255-L - 12.7 2.08 1.16 0.24 0.19 0.20 0.20 0.71 0.51 -
E-New AL-II256-L 0.16 0.19 7.57 0. I0 - - 1.28 7.27 2.15 13.01 0.29
E-Used AL-II257-L 0.12 1.69 1.61 0.26 - 0. II - 3.71 0.94 4.29 -
10.16
2.43
F-New AL-II258-L O.31 0.45 ..... 0.19 7.08
F-Used AL-II259-L 5.36 - 2.49 .... 2.42 51.0
G-New AL-11260-L 1.31 4.91 .... 1.51 0.70 5.29 8.69G-Used AL-l1261-L 0.39 0.67 1.49 0.22 - - 0.39 - 0.89 2.53
H-New AL-II262-L 0.29 - 3.81 0.II - - 0.16 - 0.47 O.21 -
H-Used AL-II263-L 0.67 4.68 16.68 0.74 - 0.26 0.62 2.37 3.20 3.47
l-New AL-II264-L 0.33 - 0.56 - - - O. II - 0.58 - -
1-Used AL-II265-L 0.34 1.18 0.85 0.58 - - O. 12 O.13 0.46 0.16 -
J-New AL-II270-L 0.23 - 0.29 0.07 - - - 0.02 0.29 0.06 -
J-Used AL-II271-L 0.56 - 0.37 0. II - O.21 - 0.29 l.ll 0.31 -
K-New AL-II266-L 0.60 - 9.80 0.28 - - - 2.51 - -
K-Used AL-II267-L 1.26 0.39 7.30 0.56 - - 0.65 - 1.86 - -
(1)Zn could be due to wear when present with copper, or as an addltlve when present alone.
(2)P, S, Ca, Ba probably present as additives.
(3)Limlt of detection for sample, when - shown, element is less than thls value.
*See page __ . Notes on XRF Particulate Wear Metal Analysis.
0.33
0.90 -
- 0.10
Limit (3) of
Detection (ppm)
0.110.09
0.21
0.23
0.09
0.09
0.11
0.15
0.090.09
O. I0
0.55
0.43
0.13
0.100.25
0. I00.11
0.07
0.08
0.24
0.37

TABLE A-6. SYNTHETIC LUBRICANT ANALYSIS
NASA-Lewis
Description
A-New
A-Used
B-New
B-Used
C-New
C-Used
D-New
D-Used
E-New
E-Used
F-New
F-Used
G-New
G-Used
H-New
H-Used
1-New
1-Used
J-New
J-Used
K-New
K-Used
SwRI
Oil Code
AL-I1252
AL-I1253
AL-I1268
AL-I1269
AL-II250
AL-II251
AL-I1254
AL-I1255
AL-I1256
AL-I1257
AL-I1258
AL-I1259
AL-II260
AL-II261
AL-I1262
AL-I1263
AL-I1264
AL-I1265
AL-II270
AL-II271
AL-I1266
AL-I1267
Notes on XRF Particulate Metal Analysis
P, Ba and S present from additive package.
AI, Fe, Ni, Cu+Zn present as wear metal
particles.
High S probably from additives.
AI, Fe, Zn present as wear metal particles.
P present as additive.
AI, Fe, Ni, Cu, and Zn present as wear metal
particles.
AI, Fe, Ni, Cu, Pb, Zn present as wear metal
particles.
High Zn content and C1 content as well as P,
S, Ca, Ba, all from additive package. This
additive package more typical of reciproca-
ting piston engine oil. Strong acid proba-
bly due to free sulfonic acid from the addi-
tives.
AI, Fe, Cu present as wear metal particles.
Oil as received had tarry deposit at bottom
of jar which could not be redissolved or
suspended in oil.
A precipitate of rather large particles at
the bottom of the jar could be resuspended,but made filtration difficult and caused a
reduction in sample size used for XRF analy-sis.
Some plugging of the filter caused a reduc-
tion in sample size used in XRF analysis.
High S, Ca, Zn probably from additives.
AI, Fe present as wear metal particles.
AI, Fe, Cu, Zn present as wear metal parti-cles.
AI, Fe, Zn present as wear metal particles.
Fe, Cu present as wear metal particles.
AI, Fe, Pb present as wear meatl particles.
46

*Technical
TABLEA-7. ANALYTICALREPORT
SYNTHETICLUBRICANTANALYSIS
TOTALIRONANALYSISBY COLORIMETRICMETHOD*
NASA-Lewis SwRI Iron ContentDescription Oil Code (PPM)
A-New AL-II252-L 1
A-Used AL-II253-L 4
B-New AL-II268-L <I
B-Used AL-II269-L <I
C-New AL-II250-L 1
C-Used AL-II251-L 6
D-New AL-II254-L <I
D-Used AL-II255-L 1
E-New AL-II256-L <I
E-Used AL-II257-L 1
F-New AL-II258-L <I
F-Used AL-II259-L 2
G-New AL-II260-L 2
G-Used AL-II261-L 3
H-New AL-II262-L <i
H-Used AL-11263-L 1
I-New AL-II264-L <i
I-Used AL-II265-L <I
J-New AL-II270-L <I
J-Used AL-II271-L <I
K-New AL-II266-L <i
K-Used AL-II267-L <I
Report AFWAL-TR-80-4022
47

%
iI
TABLE A-8. ANALYTICAL REPORT
SYNTHETIC LUBRICANT ANALYSIS
Specific Heat Measurement
@ Listed Temperature
NASA-Lewis SwRl 82°C IO0°C 140oc
Description Oil Code CpT _ CpT _ CpT
A-New AL-II252-L 0.42 0.091 0.42 0.12 0.44 0.14
A-Used AL-II253-L 0.41 0.094 0.42 0.088 0.41 0.071"
B-New AL-II268-L 0.50 0.048 0.50 0.051 0.49 0.070
B-Used AL-II269-L 0.49 0.040 0.48 0.038 0.49 0.059
C-New AL-II250-L 0.33 0.097 0.32 0.097 0.32 0.091
C-Used AL-II251-L 0.42 0.026 0.40 0.024 0.40 0.044
D-New AL-II254-L 0.33 0.071 0.34 0.072 0.34 0.084*
D-Used AL-II255-L 0.51 0.048 0.52 0.09@ 0.46 0.14"
E-New AL-I1256-L 0.68 0. ii 0.73 0.13 0.76 0.20
E-Used AL-II257-L 0.60 0.063 0.59 0.069 0.58 0.066
F-New AL-II258-L 0.53 0.12 0.54 0.13 0.54 0.14
F-Used AL-II259-L 0.62 0.014 0.62 0.014 0.61 0.013"
G-New AL-I1260-L 0.50 0.091 0.47 0.058 0.42 0.059
G-Used AL-II261-L 0.53 0.13 0.49 0.12 0.47 0.15
H-New AL-II262-L 0.37 0.036 0.30 0.037 0.31 0.094
H-Used AL-I1263-L 0.45 0.026 0.35 0.037 0.32 0.040*
l-New AL-II264-L 0.53 0.060 0.47 0.039 0.44 0.075*
I-Used AL-II265-L 0.48 0.087 0,40 0.085 0.40 0. i0
J-New AL-II270-L 0.47 0.031 0.48 0.030 0.49 0.030
J-Used AL-II271-L 0.34 0.025 0.34 0.028 0.34 0.029
K-New AL-II266-L 0.44 0.073 0.38 0.076 0.34 0.075
K-Used AL-I1267-L 0.36 0.098 0.27 0.Ii 0.27 0. Ii*
*For calculation of Cp and _ (standard deviation) one value,
inordinately different from the others, was discarded. Thus,
values rather than five were used to determine these data.
tCp= (mcal/mg deg C)
four
48

/ /
IOK
COUNTS
0
23K
COUNTS
01
IOK rl
!
COUNTS i
01
ENERGY, KEV
AL- I1252-L
FIGURE A-I. NASA-A
ENERGY, KEV
AL-11258-L
FIGURE A-2. NASA-B
ENERGY, KEV
AL-II268-L
FIGURE A-3. NASA-C
49
10.9
10..9
10-.9

lOK
COUNTS
0
1
10K
ENERGY, KEV
AL-II250-L
FIGURE A-4. NASA-D
10.9
COUNTS
01
IOK
ENERGY, KEV
AL- 11254-L
FIGURE A-5. NASA-E
14.9
COUNTS
0ENERGY, KEV
AL-II262-L
FIGURE A-6. NASA-F
14.9
50

50K
COUNTS
: +
01 ENERGY, KEV
AL-II256-L
FIGURE A-7. NASA-G
14.9
25K
COUNTS
0ENERGY, KEV
AL- 11260-L
FIGURE A-8. NASA-H
14.9
51

10K
COUNTS
0
10K
COUNTS
10K
COUNTS
ENERGY, KEV
AL-II264-L
FIGURE A-9. NASA-I
ENERGY, KEV
AL-II266-L
FIGURE A-10. NASA-J
ENERGY, KEV
AL-II270-L
FIGURE A-II. NASA-K
52
14.9
1_.9
14.9

APPENDIX B
FRICTION AND WEAR TEST DATA
53

r i_¸ _

TABLE B-I. LFW-I FRICTION AND WEAR TEST RESULTS
Lo
Lal
Test Lubricant Avg Wear Mean Wear
NASA Coefficient Friction After Cycle Avg Coeff Mean Coeff Scar ScarCode SwRI Code 400 800 1200 9000 I0.000 of Friction of Friction Width, mm Width. mm
k AL-II252-L 0.047 0.047 0.059 0.065 0.059 0.055 1.120.053 1.07
A AL-II252-L 0.047 0.044 0.053 0.053 0.053 0.050 1.02
B AL-II268-L 0.026 0.024 0.024 0.029 0.029 0.026 1.020.027 0.91
B AL-XI268-L 0.026 0.026 0.026 0.029 0.029 0.027 0.79
C AL-II250-L 0.032 0.026 0.026 0.021 0.021 0.025 1.140.024 1.12
C AL-II250-L 0.026 0.021 0.018 0.029 0.018 0.022 1.09
D AL-II254-L 0.026 0.023 0.021 0.015 0.015 0.020 1.190.017 1.12
D AL-II254-L 0.018 0.015 0.015 0.012 0.012 0.014 1.04
E AL-II256-L 0.029 0.029 0.026 0.026 0.026 0.027 1.040.035 0.95
E AL-II256-L 0.044 0.041 0.041 0.041 0.041 0.042 0.86
F AL-II258-L 0.044 0.044 0.041 0.056 0.059 0.049 1.020.034 1.02
F AL-II258-L 0.024 0.021 0.018 0.015 0.015 0.019 1.02
G AL-II260-L 0.047 0.047 0.053 0.071 0.071 0.058 1.220.043 I.I0
G AL-II260-L 0.026 0.026 0.026 0.032 0.032 _.028 0.97
H AL-II262-L 0.021 0.021 0.015 0.018 0.021 0.019 0.990.022 1.11
H AL-I1262-L 0.029 0.026 0.024 0.024 0.021 0.025 1.22
I AL-II264-L 0.035 0.029 0.026 0.041 0.041 0.034 1.190.034 1.21
I AL-II264-L 0.038 0.038 0.038 0.029 0.029 0.034 1.22
J AL-II270-L 0.047 0.047 0.041 0.026 0.026 0.037 1.070.031 1.06
J AL-tI270-L 0.029 0.029 0.029 0.018 0.018 0.025 1.04
WeiBht Loss, mB
Block Ring Total Mean
0.5 1.4 1.92.0
0.4 1.7 2.1
0.5 1.6 2.12.0
0.8 1.I 1.9
0.7 1.7 2.43.3
2.7 [.4 4.1
1.4 1.5 2.92.4
0.2 1.1 1.9
1.3 0.9 2.22.0
0.2 1.6 1.8
1.4 1.7 3.12.5
0.I 1.7 1.8
I.I 1.3 2.42.0
0.2 1.4 1.6
1.4 1.8 3.22.8
0.2 2.1 2.3
I.I 1.3 2.42.6
0.3 2.5 2.8
0.3 1.0 1.31.9
1.0 1.5 2.5
K AL-II266-L 0.024 0.021 0.018 0.015 0.015 0.019 0.022 1.12 1.21 0.4 1.0 1.4 1.5K AL-II266-L 0.035 0.029 0.026 0.018 0.0[8 0.025 1.30 0. I 1.4 1.5

k •

APPENDIX C
HIGH-PRESSURE VISCOSITY TEST DATA
57


_ iI
• f l
ALPHA-STAR CORRECTED DATA
Because of an error in the computer algorithm used to calculate the pres-
sure-viscosity coefficient alpha-star, the reported alpha-star data are in
error. The table below shows the corrected values and the % change.
RECALCULATED VALUES OF ALPHA-STAR
NASA/Lewis SwRI Temp., _ -*, GPa -I %
Description Oil Code °C Corrected Former Chanse
A AL-II252-L
B AL-II268-L
C AL-II250-L
D AL-II254-L
40 15.37 13.94 i0
I00 11.72 10.73 9
150 10.22 9.33 I0
40 14.96 13.58 i0
i00 11.85 10.84 9
150 10.34 9.42 I0
40 11.63 11.58 0
i00 10.03 9.85 2
150 8.81 8.41 5
40 12.43 12.42 0
i00 9.94 9.72 2
150 8.71 8.23 6
E AL-II256-L 40 15.53 15.39 • 1
i00 11.51 11.53 0
150 9.88 9.63 3
F AL-I 1258-L 40 13.44 13.22 2
i00 11.14 10.85 3
150 9.53 9.18 4
G AL-11260-L 40 13.80 12.58 I0
i00 11.34 10.34 i0
150 10.36 9.24 12
H AL-II262-L
I AL-I 1264-L
40 11.53 11.45 i
i00 9.14 8.79 4
150 7.95 7.47 6
40 12.08 11.94 1
i00 9.24 8.95 3
150 8.34 7.88 6
J AL-II270-L
K AL-11266-L
40 11.96 11.94 0
100 9.23 8.95 3
150 8.30 7.85 6
40 11.40 10.47 9
i00 9.50 8.65 I0
150 8.32 7.47 II
58A


temperature
SWRI/NA SAAL-I 1252-L•(]16-I 1-82
NASA/LEWIS- A,J, I
I:,r- e =_.=_.ur- e viscosity
'C Kpsi MPa mPas
( I mtm)6.76
14.8531 .0347.2163.3979.57
40
100
150
(i
0.1046.62
102.40213.94325.49437.03548.58
(I
32.1072.10
184.00986.00
5460.0027000.00
too high...
atm)6.76
14.8531.0347.2163.3979.5787.66
atm)6.76
14.8531.0347.2163.3979.5787.66
0.1046.62
102.40213.94325.49437.03548.58604.35
0.1046.62
102.40213.94325.49437.03548.58604.35
5.9410.8022.7077.60
231.00671.00
171A.0026_.,.00
2.564.2437
129.00273.00392.00
Pressure-Viscosity Coefficients
GPa^-I
Temp "C _-OT _-*
40.0100.0150.0
18.3012.8711.20
13.9410.739.33
59

",0
01:_:I(3==Q
II I
,'_+x
x
+
I I I I
U") _ i:O q'q
[Sedm]6oL
+ x
X
.4.
:_' t
_j I
I'Oi?,l
Z_N"N...,-4 _
3J z_I'fj._
t_
I0
Z
tN
I
o
• i .

rn
Z _0 I _"- _ .-,_) u'n
_: "<z
mmgamm_
_,_,_.--
_0_0
e_mem
__,_
_-_,__,_
,_IL'Me:,'::_"O,._O::I
q',_,--,C'403q"
,.._E,O-.I_'RI'O..I:'KnZOLI-_
.--,C'.IC,3q'LF.r.O
v
_____
L__t
°_
u
"4-
0l:J
>..,.7U'0 _'_0 13..u C9u'|
I
v'|u'!
0...
t_.,¢._
I ,Occ_.-,
r_)
E _,_n3
F-

4
3
r_
r_
E
o
*-40 "C+- 100 "Cx- 150 "C
÷
+
x
x
+
÷
X
÷
X
X
÷
X
÷
X
-I I I I I I0 100 200 300 400
MPa
SW R I/NA SAAL-I 1268-L
NASA/Lewis-BI
500 d,08 700
62

U GL._j _--
<I: _ co ._ ,"
lEE I I <_ _'3 .J CO _ _-rf.o _ _ _ n
z
:g:
.-- _ wmBmilmw
0 _ __
U E __
wmmmm._m
_'__
_U-_-_
.- __
V V
£.
E
4-'
(JIi
_TCD
u'l
U
"4-
'-I-O_0
rJ
>.
U_0UU_
I
f_
v'|v'|
flL
<
(..9
I
I-
I
_J
E
I-
_O,Ot'c;
n303_3

,._o'
6
5
4
3
E
CD_
o
2
0
-1
*- 40 "C
+- 100 ;_.x- 150
+
+
X
X
I0 100
÷
X
X
208 300MPa
÷
X
÷
WR.I/N.A_A__ __L _-ll/_-L
NASA/LEWIS-CI l600400 500 700
64

!
<_ .JO_ I e4
Z u') I
r_ I
___
,__
illlllll
__'0
.__
,__
I
V
_-_
V
U')
@
u
..p
"t-@0
(J
I_'_ ,_0 It-u CO
I
3
rl
I 0,10, O0
I- 1_rc.4_)
I '_C_I_._
C.)
£1. _,_._
Lr__D
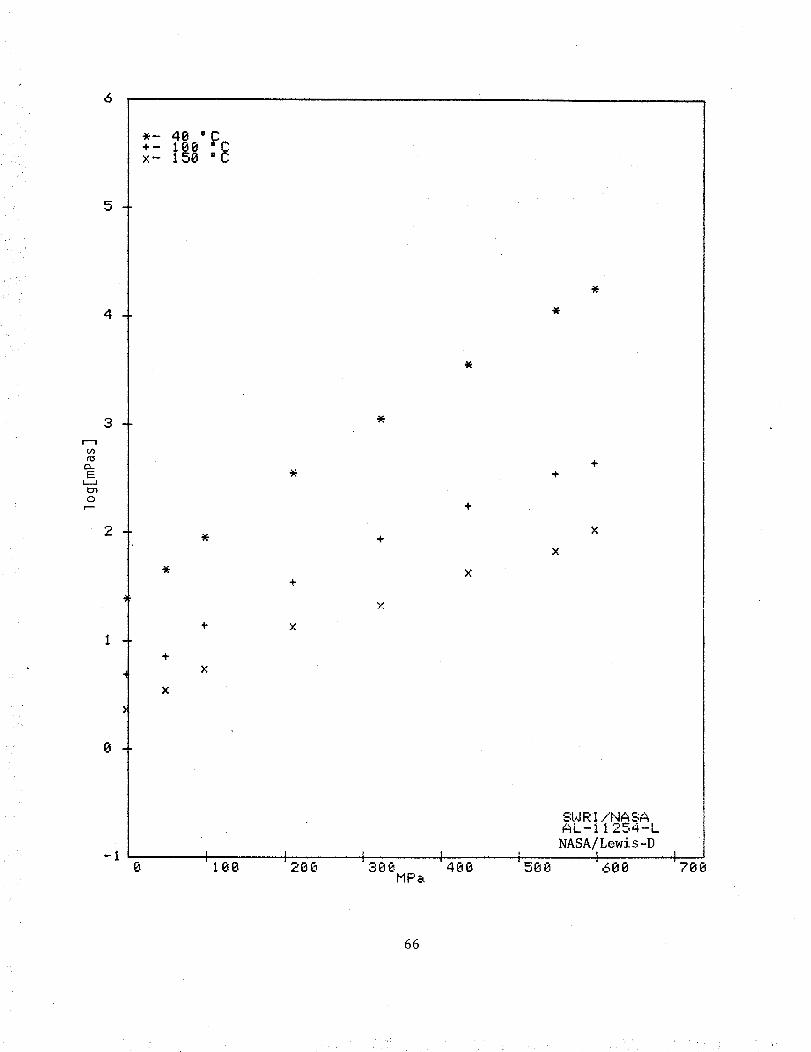
6
tn
ro
(3_
E
0
5
4
3
0
*-40 °_+- 100 Cx- 158 "C
÷
X
X
X
4-
×
X
4-
X
SW RI/NA SAAL-11254-L
NASA/Lewi s-Di600100 280 488 500 700
66

L_
I
<]: _1 ._(jr) I L'_I
O3 .J i'q<]-
=mllblm_ mll=mumm
E r,,.L'O..T_.qCr=U')".0
V
_ -(_rx-o.-._f---o
EI",._CO,_,0..103U3',O
,-,03 _I" _ l',.r3
%.."
E_co_cq_
V
_T _D
.4..I
iT_.
U
'4."-I-
0C_
>,
o_
0u
I
O_
T<
Q.
03_3,0
I U3--_E_
I-- r_,:or,-
I IJ').-_
(J
,,-,,0 ,,-,,_
I--
,.o

Uo a
i
I I I
I
U')
I
+
÷
I
x
x
+
+
[S_dW]6OL
÷
I
0,1
×
av
X
t,
x
4- I
IX.
._i
Z_ e_
3Jw_r z<
ID
,lJn5-
_0
C'4
I

_rj I L_I a
_ _ _._Z U-) I
O3 _j t_
• _ _ im_mQalw lmmlmwml
°_ _
_m_mmm_
L
_"_3_
.- __
v v v
L
o_L
E
(3a
_T
u
0(3
._
0
u
2-I
@
v_v'|
@
13.
T<
13-
_OJ(O_
I 0"_,.,'.'.'.'.'.'.'.'__
,_>U3",OF- _r,-l_l • • •

UO_Je p
m
I I I_-l-x
÷ X
+ X
I I I I
[S_dm]6o I.
+ X
÷ X
_w
÷
X
÷
_J_i _,
Z_
I_1
3-J _
I
IX-
,.Ta
(S)
O_
C9
CN
T
0

•"_ _I
Z _ I.,_
3T xL'O,_
°_ _I imml_uua imamaeal
_,_ _
,_,_'_
_.__ _.__
V
.,-..._IF_IYj_-.,@.f,,-_
_..,CO'q"._r,.k'_',"4
@
LI
"4-"-I..d_00
>. T<
0 nu C5
I
£.
(b
I C_I_
_0-- _._OC)
I _

6
5
4
bO
rO
r_
Ei i
or---
0
-I0
*- 48 °C+- 180 "Cx- 158 "C
÷
188 200 388MPa
488
+
+
X X
SWRI/NASAAL-11260-L
NASA/Lewis-GI I I588 688 7E18
72

I l'_
"\ L_I CO 6 u'l
I._ .-4 I _] I CcJ _ ,(0 I l'q c_ _
z_ "
,-- _ UoOOinul
0 _! __
meIiaQIa
--_l'Oll',,_O
,_ __ __ __CO_
._U__
•;
v
(_
a
EQ_
_.__
__0._
___
v
u
"-F-
0.,j,,.
a_
00
0y
)I
u'|u'_
n
I<
£t.C9
U'sO_
I .,....,c"Or_
_(OC"S
C)
C_

6
E
0
2
0
*- 40 JC
÷- l_e :Ex- 150
+
÷
×
X
100 28_
+
366MPa
+
X
÷
X
SLqRI/NASAAL-11262-LNASA/Lewis -H
1608488 580 1780
74

(.13 I t'_l<T _r coZ ,o i ._"... ,.-'4 ,33
O'J _J .r_l _
=mwwmla= m ww=l
_.__
v
•.-..'-0Li3¢0,[email protected]'---.0Fi',.. L"O,_ _ O"._b_-.r_
.,..,('0,_:_-,.0i,,.._0,.--4
__r_
,,-.i
@
u
'-I--
,+.
0L.)
>..
V'0 _
U L9
-%
Id_
I:-
v',V'l
CL
I ---,COl"-
I-- .-_U3E:._
I t'rjO,I]O
E _,;E)
I--
LPI

i
,0
m
I I I
I
irJ
_K
I I
÷ X
÷ X
÷ X
+ x
[s_dm]6oL
x
-I- x
_J
<Z'O "_Z,N
P'--4 ""4 _'
,-,-, m<
I
CD
CD
"0
O_
z
I

03 .-J 04_
U
_e_e_eae
U!
C_
.4--"
UI
C_u
I
L.
'*"4
I
u
E
L.l--
_n3D3
0-0._0

I
0__'-
"0
_O".i_ r--__Jm
j_t>
i,_,
I
x
,I
÷
x
log[mPas]
! I I
÷
x ÷
X ÷
x ÷
I
III
_n_
I
m oO
O_

._I n¢0 1 O,l•._ ',00_Z _ \\. _",I --,
O3 ._I co<I
U' I • • • • • • • •
U'l --..* ._J _4.",_
:>
_o}.__
__'_
__0_
__U-_
E_l_'rJ_
V
F.r.,- o3,_t'., _.r.o
,_ "0'_" ..-_r-.-o'_>.r-.-.._..T._._- .,oi-._:o
'I"4
u'l.ae.*
°_
1.0°_
'4-,.{-
00
._ ._.
0u 0L9u1
I,I,L.
i.l'l
v'|
c.13_
I
I-,'.'_Ib;
0I=
CL
'I'F-
,-j-_,--j-
'I-4
_',0_,I-.-,0,.
o._q,._O'j
-i--I.,--I
O_
:_ • _.i _ •

_0
_.31;.)
ill
II I_-I-x
I I
4.
+
÷
a_
[S_dm]6OL
x
x
-4-
-I-
I
a.N
X
.-I<£I
,.__oZCq"_._
,'.o._
qD
n
O4
0oo

APPENDIX D
BOILING POINT DISTRIBUTION DATA
81


• , •i: •
co
TABLE D-I. NEW TRANSMISSION OILS, BOILING POINT DISTRIBUTION BY GC
AFLRL No. AL-! 1252-L
Descrlptlon AWtZ Off
IBP, 0.5 304 282l 320 2995 351 336
lO 363 351
15 371 361
20 379 36925 385 375
30 391 381
35 397 387
40 402 39345 407 398
50 412 405
55 416 40960 421 416
65 426 422
70 431 428
75 437 43580 444 444
85 452 454
90 463 466
95 488 488
FBP, 99.5 (97) 518 (98) 518
% Residue 3.9 2.0
AL-II268-L AL-II250-L AL-II254-L AL-II256-L AL-11258-LB C D E F
Tempera£ure v *C
AL-II260-L AL-II262-L AL-II264-L AL-II270-L AL-lI266-LG H I J K
372 376 271 324 316376 407 271 350 332
422 426 375 412 381
433 437 416 417 407
440 445 453 421 416447 45l 459 423 421
454 457 462 426 426
457 462 464 429 434
463 468 466 432 437
470 473 468 448 438477 478 469 472 443
489 483 470 477 461
513 491 472 481 470548 502 473 483 477
(62) 568 538 475 485 481
(69) 568 476 487 485
479 489 490
518 492 501
498 527
515 (87) 568
532
(97) 568
38.9 31.9 20.7 3.1 13.2
337 360 362 385386 362 397 414
390 424 430 437391 442 443 446
392 446 447 453
393 452 454 459
412 455 460 463
436 461 466 468
438 468 469 474
439 470 475 477
440 476 481 483
441 483 487 489
442 490 494 497496 513 514 509
534 547 547
578 (68) 568 (68) 578
40.0 30.1 32.9 32.6

• . , • ,
i,,,,i@
I
X
Lf
i--
J
F.13:
70000
60000
5eeee
40000
I
30000 i
I ....... !
0RT in min,
i I I I • ! ' ' !
I
S
i'le'['hod : S_I.-"[:RIj
I ...... , .J.--- , l , I , I
18 i.=_, 20 2._=:. 38
T z_ r- ,_ ',i-t---.... 1, ..... ,_ RT I>':I"_:_."1,._.__ ON JglN 3, 1983
_' a ,, : _ ['i FiN T P r o,: • -,,-F K.C-C_!;
I
m
I
3._=;,
FIGURE D-I. BOILING POINT STANDARD

ooLn
.r-I
. .-<
U@VII
Cq
×
W
I--
_I
60000
soe_o F
40000
30000
200e0 -- .
0RT in min.
I I I i ' I
I , I , I
3 6 9
I
SAMPLE: C3-C40+BENZMethod: SD/FUL
12 15
INJECTED ATRaw: JAHCAL
I ' I " I
,, I , I ,
18 21
9:52:01 ON JAN 5, 1983Proc: *PRO03
l I
24 27
FIGURE D-2. C4-C40 AND BENZENE BOILING POINT STANDARD

ooch
_.{
uWb'lI
OJ
X
W
I-
.J
CI
35000
38080
BOILING POINT, °C
I
[
2_AA_ [ l
IZRT in min.
lllllllI II I
(J 0 t.) (Ja'- C C t-
lllllllIIIIIllrlI I I I I I I rl
0 (.J 0 0 0 0 0 0 0
illlllllil llllilJ
C C C C C e" e" C: C
I II l i l I l l | I
14 16 ]._
SAMPLE -" RL-.. 1 1_0i'iethod: SD/FUL
I m I i
Zg ZZ Z4
INJECTED RT 9:1_:20 OH JUL 2Z, I_CZRaw: T0250: Pro¢: *PRC03
I m I
Z6
FIGURE D-3.

/
oo
;t.
u
VI!
X
¢..1
(I
BOILING POINT, °C
I IIIIIII !111111 !1 II! II I I I I I I
IIIIIIIII I II II
lit !il _ !l !l _
IIIIIIIIII
360e0 r
24000
"-%.
\
\,//
j) X.,,,/
' J I . I , I . , I , I . I , I
12 J4 j_ _ 20 _? _4 26RT in min,
3RMPLE; QL-IIZ52 INJECTED @T 10;01;31 ON JUL 22_ I982Hethod: SD/FUL Raw: T02S2: Proc: *PRC03
1
FIGURE D-4.

qPI
x
UU,L,'II
LO
X
F.-I0,.,,4
. |
$4000
BOILING POINT, °C
45000
36000
27000
RT in min.
lllillllllll IIIIIIIIIIIIIII II I I i I I I I II il
I , I a I ,
12 14 _6
SRMPLE; RLII2$4LMethod: _D/FUL
IIIIIIIIIIIII
U U U U rJ U U U UE r- E c: E r- E E r-
I a I v
_8 2_I , I i l
INJECTE_ RT 17;30 "_._vON JUL _=_, 1902Raw: TO2S4R Proc: *PRC03
1FIGURE D-5.

oo_JD
I-I
X
uW¥!!
U)N
X
bJ
_J
s-
BOILING POINT, °C
5d.08_
dSBBB
06888
27BBB I IA
IZRT in min,
IIIIIIIII I II I
u u- o oC I_ C C C
IllllllllllI I I ! I
c c c c c
I I I .
SAMPLE "- AL.I 112_G14ethod: SD/FUL
, , e.._" ''--_'--._-
! | , 1
IlllI
(JI-
IIIIIIIIII
J_..,..w
k.
I i I i I
Z(! ZZ _4
INJECTF]) liT I0:45:53 ON JUL 22, 1902Raw: T0256: Proc: .PRC03
Z6
FIGURE D-6.

c)
X
uWtqI
X
_J
l-
..J
BOILING POINT, °C
35000
28800
21006
0r-
!!!11111] I! !
(J 0 0 0c" c- c- c-
12 1,4RT in mLn,
IIIIIIIIIIIIIII i I ] ] I I
f,,J (J (J (.) 0 0 (Jc *'- (- c {- c c-
IIIII IIII_II
II IIIIIIII] IC,_J J J J J JJJJ_ C ¢:: C C ¢" C ¢" I= C
Ji
36 1_
/
I , I
2B 22
I
, i , ,I , I
2"4 26
3AMPLE; AL-112S8 INJECTr'D AT I2:27;89 ON JUL ,"2, 1902iiethod: S])/FUL Raw: T0258: Proc: *PRCe3
FIGURE D-7.

t
uum
_c> Yt)
X
hi
1::i)
-Jc,
BOILING POINT, °C
IIII I
IIIIIIIIIII I IIIIIIII
J_
)RMPLE'- @L--11260 INJECTE) RT I3;13;0_ ON JUL 22_ 1982I'lethod: SDzFUL Rau: T0260: Proc: *PRC03
FIGURE D-8.

t,o
,P,-I
X
uO_
!
::L
OJ
X
bJ
I,-1",4
._1
m
BOILING POINT, °C
80000
60000
_e888
28_88
RT in min.
IIIIIIIIIIII
_IIII I Io G o u o u¢ r- ¢ r- t..- E c:
IIIIIIIIII I I I II
(J ¢J (._ _ (J (J
IIII
(Jr.
IIIII
II
IIII
I)
I , I , I
i?_ 14 _F,
3FIMPLIZ ".RL'" 11ZC,."Hethod: SD/FUL Raw: T0262:
I I, a ,I a I I I
8 ZO E'Z Z4
INJECTED AT 13;_9:11 ON JUL ?..?._ 1902Proc: *PRC03
I!!111111IIIIIII11
O U U O U U U U UE E E E E E E c E
| I
_6
iI
FIGURE D-9.

kO
BOILING POINT, °C
,i-I
uW
L_
X
Wf-_
..|
48000
40000
32080
24Bee
RT in min.
IIIIIIIII
I! o o o o o o o o i ° ¢ o:_¢o:o:o:o:o:JIiiii I I I IIIIIII II III IIII
. t!.!ii!,, I , I_
12 14 i_, ;.8 20 22 24 ?_6
3RMPLE: AL-11204 INJECTED RT 14;44:Z4 OH JUL 22_ 1907-ilethod: SD/FUL Raw: T0264: Proc: *PRCB3
FIGURE D-IO.

_a,.°,
uw
r_ I
b3
X
Ld
I-H
.I
C_
BOILING POINT, °C
4R_RR
4_
24RR_
RT in min.1Z 14 ]6 J8 ZB ZZ Z4 Z6
SRMPLE; RL...II£GG INJECTE_ RT 15;£9:30 ON JUL 22, 1902Hethod: ;D/FUL Raw: T0266 Proc: *PRC03
FIGURE D-II.

. - ,:,..
kO
Ln
U
UI
!
u)cq
X
I-
.IG.
CC
BOILING POINT, °C
488B0t_
!
48088 t
II
32880 _
24800
IZRT in min.
llllllllI Jl I
U (5 ¢.j UC C C C
111111111111I ! l I ICj CJ CJ _ _ Uc c _" c _ c
!111111111111
Il
Raw: T0268: Proc: ,PRC03
FIGURE D-12.

i
;{
w
ui11
c_ !
LOOJ
X
W
i-.i-4
_,|
q..a..
Ct
BOILING POINT, °C
I,,,ILlllll I1 ,lll,ll,.IJ , ,,,,,,,,a[i
36000
i , I , | , I , I , I ,
1 _ :;4 :; 6 _ 8 ZB 22 _.4 Z6RT in min,
SRMPLE "- AL- 117_70 INJECTED AT 1G'-4"D ;ZG ON JUL 2?. _ lgSZi4ethod: SD_FUL Raw" T0270: Proc," *PRC03
FIGURE D-13.
APPENDIXE
BASESTOCKCHARACTERIZATIONSTANDARDS
97


66
I-4
I
0Z0I
C'_
0
H
>
e4
_-3t'_
_-3
>
I
F
[7.18
i 7.52, ._
[ ,a. ?,?
_
i'.--3.23i
l qq
-i
_.-:, 3:3, _ -- .
_ _'-'4' -'r'. -
13,60
, i_ • i 9
15.401
I 15. q.4
O
[16,99
i?.60
FT
1":;i L37
i 16.3.5
i 9. iO
c_I "_. .oo_4.6i
, _-;,".54
23,9- l

o
B
_i _ "i!_ ''
ooI
T <"- _ _:,T I
u'_
1
I
i
J'L
I
iI
iJ
t;
..- ;.-, -_/
{
-(
lI
)
_._J
T c. • ..D, _--,
2
.- t w - ,.J__
i_1, r
b.t
E-t
b-t.r_<
r_b.4
o
<
_4I
i00

_j
I
[;9
t_
H
H
IOI
_L
{
id. <.:_:d
r_

HAI&VAIHNg VNVg "_-H _HNDI_
V
_-v_va ii:
V
0
k -_ • k..

i
J
I--4
>
ZH
0H
I
I
103

9.-{"Z
-.{E,"c:
Ii,......
_._"_""TAJ
c:o "o.
t8T "0
!
A
k-t
r_
v
Io
I
I
i-4
104

APPENDIXF
BASESTOCKCHARACTERIZATIONDATA
WITHDAISYGRAPHS
105
- i/J


b-aO"-d
NASA Code
AFLRL Code
CarboxylicAcids - %
C-4
C-5
C-6
C-7
C-8
C-9
C-10
C-12
Alcohols
TMP
PE
DPE
MONO-
Basestock
TypeEster
Petroleum x
Synthetic
Hydrocarbon
C30, %
C40, %
C50, %
TABLE F-I. BASESTOCK CHARACTERIZATION SUMMARY
A B C D E F G H I J K
11252 11268 11250 11254 11256 11258 11260 11262 11264 11270 11266
T 9
46 18 di-63
_ I0 13 di-37 T
17 16 73 50
35_ I0 24 27 1
o o 13 16 7
_ 4 4 5
_ 2
T T
13 22 22
2 14 16
19 21 24
3O 8 8
4 23 29
32 12 I
T
i00 I00
(C13)I00
I00 i00 5O
50 i00 99
i
x x dibasic (20%) x
x (8oz)
43 38
45 50
12 12
x x x

MONOALCOHOLS
DIBASIC ACID ESTER
Clo
POLYOL ESTER
MONOCARBOXYLIC
ACIDS
MOLECULAR
WEIGHT
,\o
MOLECULAR c
WEIGHT
C
DICARBOXYLIC
ACIDS
IIIIIIIIII DPE
POLYOLS
FIGURE F-I. DAISY GRAPH KEY

! •
Cl3
o_D
FIGURE F-2, NASA-C FIGURE F-3. NASA-D F I GURE F-4. NASA-E F I GUR E F-5. NASA-G
!,
FIGURE F-6. NASA-H FIGURE F- 7. NASA- ! FIGURE F- 8. NASA-J FIGURE F-9, NASA-K

TABLE F-2. BASESTOCK CHARACTERIZATION
L _
SAMPLE DESIGNATION: A
AFLRL No.: AL-II252-L
Polyol Ester Components
Monocarboxylic Acids
Butanoic, C4
iso Petanoic, C5
Pentanoic, C5
Hexanoic, C6
iso Heptanoic, C7
Heptanoic, C7
iso Octanoic, C8
Octanoic, C8
Nonanoic, C9
Decanoic, CI0
Dibasic Acid Ester ComponentsDicarboxylic Acids
Succinic, C4
Glutaric, C5Adipic, C
Pimelic, C6
Subaric, C 7
Azelaic, C8
Sebacic, C 9
-- C_ 0' 1
--, C12
Synthetic Hydrocarbon Components
Hydrocarbon Type
Triacontane, _30
Tetracontane, _40
Pentacontane, b50
Chemical Data
wt%Basestock Type wt%
Dibasic Acid Ester
Polyol EsterTMP Ester
PE Ester
DPE Ester
Petroleum i00
Synthetic Hydrocarbon
Polyols wt%
Trimethylolpropane,
(TMP)
Pentaerythritol,
(mE)
Dipentaerythritol,
(DPE)
Mono Alcohols
nzHeptanol
2-Ethylhexanol (C
Octanol (C
Nonanol (C
Decanol (C
Undecanol (C
Dodecanol (C
Tridecanol (C
(C.,)
)
0)i)2)3)
T = Trace
ii0

TABLEF-3. BASESTOCKCHARACTERIZATION
SAMPLEDESIGNATION:BAFLRLNo.: AL-II268-L
Chemical Data
Polyol Ester Components
Monocarboxylic Acids
Butanoic, C4
iso Petanoic, C 5
Pentanoic, C5
Hexanoic, C 6
iso Heptanoic, C7
Heptanoic, C 7
iso Octanoic, C8
Octanoic, C8
Nonanoic, C 9
Decanoic, CIO
wt%
Dibasic Acid Ester Components
Dicarboxylic Acids
Succinic, C4
Glutaric, C5
Adipic, C 6
Pimelic, C 7
Subaric, C8Azelaic, C
Sebacic, C_0
--, Cll
--, C12
Synthetic Hydrocarbon Components
Hydrocarbon Type
Triacontane, _30
Tetracontane, _40
Pentacontane, u50
Basestock Type wt___%Dibasic Acid Ester
Polyol Ester
TMP Ester
PE Ester
DPE Ester
Petroleum 100
Synthetic Hydrocarbon
Polyols
Trimethylolpropane,
(TMP)
Pentaerythritol,
(PE)
Dipentaerythritol,
(DPE)
Mono Alcohols
n-Heptanol (C v)
_-Ethylhexanol (C_)
Octanol (C_)
Nonanol (C_)
Decanol (C_^)Undecanol (C_)
Dodecanol (C_)
Tridecanol (C_)
wt%
T = Trace
iii

TABLEF-4. BASESTOCKCHARACTERIZATION
SAMPLEDESIGNATION:CAFLRLNo.: AL-II250-L
Chemical Data
Polyol Ester Components
Monocarboxylic Acids wt%
Butanoic, C4 T
iso Petanoic, C 5
Pentanoic, C5 46
Hexanoic, C6 i0
iso Heptanoic, C 7
Heptanoic, C 7 17
iso Octanoic, C8
Octanoic, C8 i0
Nonanoic, C 9 13
Decanoic, CI0 4
Dibasic Acid Ester Components
Dicarboxylic Acids
Succinic, C4
Glutaric, C5
Adipic, C6
Pimelic, C 7
Subaric, C8
Azelaic, C9
Sebacic, _i0
--' _Ii
--' _12
S_nthetic Hydrocarbon Components
Hydrocarbon Type
Triacontane, _30
Tetracontane, _40
Pentacontane, _50
Basestock TypeDibasic Acid Ester
Polyol EsterTMP Ester
PE Ester
DPE Ester
Petroleum
Synthetic Hydrocarbon
Polyols
Trimethylolpropane,
(TMP)
Pentaerythritol,
(PE)
Dipentaerythritol,
(DPE)
Mono Alcohols
_-Heptanol (Cv)
2-Ethylhexanol (C_)
Octanol (C_)Nonanol (C_)
Decanol (C_n)
Undecanol (C_)
Dodecanol (C_)
Tridecanol (Ci_)
wt%
I00
wt%
i00
T = Trace
112

TABLEF-5. BASESTOCKCHARACTERIZATION
SAMPLEDESIGNATION:DAFLRLNo.: AL-II254-L
Chemical Data
• Polyol Ester Components •
Monocarboxylic Acids wt%
Butanoic, C4 9
iso Petanoic, C5
Pentanoic, C5 18
Hexanoic, C6 13
iso Heptanoic, C 7
Heptanoic, C 7 16
iso Octanoic, C8
Octanoic, C8 24Nonanoic, C 16
Decanoic, C_O 4
Dibasic Acid Ester Components
Dicarboxylic Acids
Succinic, C4
Glutaric, C5
Adipic, C6
Pimelic, C 7
Subaric, C8
Azelaic, C 9
Sebacic, _i0
--' _Ii
--, c12
Synthetic Hydrocarbon Components
Hydrocarbon Type
Triacontane, _30
Tetracontane, _40Pentacontane, 50
Basestock TypeDibasic Acid Ester
Polyol Ester
TMP Ester
PE Ester
DPE Ester
Petroleum
Synthetic Hydrocarbon
Polyols
Trimethylolpropane,
(TMP)
Pentaerythritol,
(PE)
Dipentaerythritol,
(DPE)
Mono Alcohols
_-Heptanol (C_)
2-Ethylhexanol (C_)
Octanol (C_)
Nonanol (C_)
Decanol (C_n)
Undecanol (C_)
Dodecanol (C$_)_Z
Tridecanol (C13)
wt%
i00
wt%
i00
T = Trace
113
• / r •

TABLE F-6. BASESTOCK CHARACTERIZATION
SAMPLE DESIGNATION: E
AFLRL No.: AL-II256-L
Chemical Data
Polyol Ester Components
Monocarboxylic Acids wt%
Butanoic, C4
iso Petanoic, C5
Pentanoic, C5
Hexanoic, C6
iso Heptanoic, C7
Heptanoic, C7
iso Octanoic, C8
Octanoic, C8Nonanoic, C
Decanoic, C_0
Dibasic Acid Ester Components
Dicarboxylic Acids
Succinic, C4
Glutaric, C 5 63
Adipic, C 6 37
Pimelic, C 7
Subaric, 'C8
Azelaic, C9
Sebacic, _I0
--' _ii
--' _12
Synthetic Hydrocarbon Components
Hydrocarbon Type
Triacontane, _30
Tetracontane, _40
Pentacontane, u50
Basestock TypeDibasic Acid Ester
Polyol EsterTMP Ester
PE Ester
DPE Ester
Petroleum
Synthetic Hydrocarbon
Polyols
Trimethylolpropane,
(TMP)
Pentaerythritol,
(PE)
Dipentaerythritol,(DPE)
Mono Alcohols
_-Heptanol (C_)
2-Ethylhexanol (C_)
Octanol (C_)
Nonanol (C_)
Decanol (C_n)Undecanol (C_)
Dodecanol (C$_)
rridecanol (Ci_)
wt%
i00
aWt%
100
T = Trace
ii4

TABLEF-7. BASESTOCKCHARACTERIZATION
SAMPLEDESIGNATION:FAFLRLNo.: AL-II258-L
Chemical Data
• Polyol Ester Components
Monocarboxylic Acids wt%
Butanoic, C4
iso Petanoic, C5
Pentanoic, C5
Hexanoic, C 6
iso Heptanoic, C 7
Heptanoic, C 7
iso Octanoic, C8
Octanoic, C8
Nonanoic, C 9
Decanoic, C10
Dibasic Acid Ester Components
Dicarboxylic Acids
Succinic, C4
Glutaric, C5
Adipic, C6
Pimelic, C 7
Subaric, C 8Azelaic, C
Sebacic, C_0
--, C 1
--, CI12
Synthetic Hydrocarbon Components
Hydrocarbon Type
Triacontane, _30 43
Tetracontane, _40 45
Pentacontane, c50 12
Basestock TypeDibasic Acid Ester
Polyol EsterTMP Ester
PE Ester
DPE Ester
Petroleum
Syn. Hydrocarbon
Polyols
Tr ime thyl olpr op ane,
(TMP)
Pentaerythritol,
(PE)
Dipentaerythritol,
(DPE)
Mono Alcohols
_-Heptanol (C_)
2-Ethylhexanol (C_)
Octanol (C_)
Nonanol (C_)
Decanol (C_a)Undecanol (C_)
Dodecanol (C_;)
Tridecanol (CI;)
T = Trace
wt%
I00
wt%
115
;, • • ):.

i:;?
TABLE F-8. BASESTOCK CHARACTERIZATION
SAMPLE DESIGNATION: G
AFLRL No.: AL-II260"L
Chemical Data
Heptanoic,
iso Octanoic,
Octanoic,
Nonanoic,
Decanoic,
Polyol Ester Components
Monocarboxylic Acids wt%
Butanoic, C4
iso Petanoic, C 5
Pentanoic, C5
Hexanoic, C6
iso Heptanoic, C7
C7 73
C8
C8 27C
Dibasic Acid Ester Components
Dicarboxylic Acids
Succinic, C4
Glutaric, C 5
Adipic, C6
Pimelic, C7
Subaric, C8
Azelaic, C9
Sebacic, #I0
--' _ii
--, c12
Synthetic Hydrocarbon Components
Hydrocarbon Type
Triacontane, [30 38
Tetracontane, _40 50
Pentacontane, G50 12
Basestock TypeDibasic Acid Ester
Polyol Ester
TMP Ester
PE Ester
DPE Ester
Petroleum
Syn. Hydrocarbon
,Polyols
Trimethylolpropane,
(TMP)
Pentaerythritol,
(PE)
Dipentaerythritol,
(DPE)
Mono Alcohols
_-Heptanol (C)
2-Ethylhexanol (C)
(c)(c)
(c o )(c I)(C: 2 )
(C 3 )
Octanol
Nonanol
Decanol
Undecanol
Dodecanol
Tridecanol
T = Trace
wt%
20
80
wt%
100
116

TABLEF-9. BASESTOCKCHARACTERIZATION
SAMPLEDESIGNATION:HAFLRLNo.: AL-II262-L
Chemical Data
• Polyol Ester Components •
Monocarboxylic Acids wt%
Butanoic, C4
iso Petanoic, C5
Pentanoic, C5
Hexanoic, C6 T
iso Heptanoic, C7 35
Heptanoic, C7 50
iso Octanoic, C8
Octanoic, C8 1
Nonanoic, C9 7
Decanoic, _i0 5
Dodeconoil u12 2
Basestock TypeDibasic Acid Ester
Polyol Ester
TMP Ester
PE Ester
DPE Ester
Petroleum
Synthetic Hydrocarbon
wt%
i00
Polyols
Trimethylolpropane,
(TMP)
wt%
100
Dibasic Acid Ester Components
Dicarboxylic Acids
Succinic, C4
Glutaric, C5
Adipic, C6
Pimelic, C 7
Subaric, C8
Azelaic, C9
Sebacic, _i0
--' _iI
--, U12
S_rnthetic Hydrocarbon Components
Hydrocarbon Type
Triacontane, _30
Tetracontane, _40
Pentacontane, u50
Pentaerythritol,
(PE)
Dipentaerythritol,
(DPE)
Mono Alcohols
n-Heptanol (C_)
2---Ethylhexanol (C_)
Octanol (C_)
Nonanol (C_)
necanol (C_n)Undecanol (C_)
Dodecanol (CIJ)iz
Tridecanol (C13)
T = Trace
117

TABLEF-10. BASESTOCKCHARACTERIZATION
SAMPLEDESIGNATION:IAFLRLNo.: AL-II264-L
Chemical Data
@
O
@
Polyol Ester Components
Monocarboxylic Acids wt%
Butanoic, C4
iso Petanoic, C 5
Pentanoic, C5 13
Hexanoic, C6 2
iso Heptanoic, C7
Heptanoic, C 7 19
iso Octanoic, C8
Octanoic, C 8 30
Nonanoic, C 9 4
Decanoic, _i0 32Dodeconoil T
_12
Dibasic Acid Ester Components
Dicarboxylic Acids
Succinic, C 4
Glutaric, C5
Adipic, C6
Pimelic, C 7
Subaric, C8
Azelaic, C9
Sebacic, _10
--' _11
--' _12
Synthetic Hydrocarbon Components
Hydrocarbon Type
Triacontane, _30
Tetracontane, _40
Pentacontane, u50
Basestock Type wt___%Dibasic Acid Ester
Polyol Ester I00
TMP Ester 50
PE Ester 50
DPE Ester
Petroleum
Synthetic Hydrocarbon
,,po,lyol s wt%
Trimethylolpropane, 55(TMP)
Pentaerythritol, 45
(PE)
Dipentaerythritol,
(DPE)
Mono Alcohols
_-Heptanol
2-Ethylhexanol
Octanol
Nonanol
Decanol
Undecanol
Dodecanol
Tridecanol
(C7!
(c8:(c,(c8'.(c_
(c_:;)
T = Trace
118

i ,_:
TABLE F-II. BASESTOCK CHARACTERIZATION
SAMPLE DESIGNATION: J
AFLRL No.: AL-II270-L
Chemical Data
Polyol Ester Components
Monocarboxyllc Acids wt%
Butanoic, C4 T
iso Petanolc, C 5
Pentanoic, C 5 22
Hexanoic, C6 14
iso Heptanoic, C 7
Heptanoic, C 7 21
iso Octanoic, C8
Octanoic, C8 8
Nonanoic, C 9 23
Decanoic, CI0 12
Basestock TypeDibasic Acid Ester
Polyol EsterTMP Ester
PE Ester
DPE Ester
Petroleum
Synthetic Hydrocarbon
wt%
I00
Polyols wt%
Trimethylolpropane,
(TMP)
Dibasic Acid Ester Components
Dicarboxylic Acids
Succinic, C 4
Glutaric, C5
Adipic, C6
Pimelic, C 7
Subaric, C8
Azelaic, C9
Sebacic, _i0
--' _iI
--, C12
Synthetic Hydrocarbon Components
Hydrocarbon Type
Triacontane, _30
Tetracontane, _40
Pentacontane, _50
Pentaerythritol,
(PE)
Dipentaerythritol,
(DPE)
Mono Alcohols
_-Heptanol (Cv)
2-Ethylhexanol (C_)
Octanol (C_)
Nonanol (C_)
Decanol (C_n)
Undecanol (C_)
Dodecanol (C_)
Tridecanol (C13)
I00
T = Trace
/
119
" " "i• _ ,z "

TABLE F-12. BASESTOCK CHARACTERIZATION
SAMPLE DESIGNATION: K
AFLRL No.: AL-II266-L
Chemical Data
Polyol Ester Components
Monocarboxylic Acids wt%
Butanoic, C4 T
iso Petanoic, C5
Pentanoic, C5 22
Hexanoic, C 6 16
iso Heptanolc, C7
Heptanoic, C 7 24
iso Octanoic, C8
Octanoic, C8 8
Nonanoic, C 9 29
Decanoic, CI0 1
@ Basestock Type wt%Dibasic Acid Ester
Polyol Ester I00
TMP Ester
PE Ester 99
DPE Ester 1
Petroleum
Synthetic Hydrocarbon
Polyols wt___%
Trimethylolpropane,
(TMP)
@ Dibasic Acid Ester Components
Dicarboxylic Acids
Succinic, C4
Glutaric, C5
Adipic, C6
Pimelic, C7
Subaric, C8
Azelaic, C9
Sebacic, _10
--' _11
--, c12
Synthetic Hydrocarbon ComponentsHydrocarbon Type
Triacontane, _30
Tetracontane, _40
Pentacontane, c50
Pentaerythritol, 98
(PE)
Dipentaerythritol, 2
(DPE)
Mono Alcohols
n-Heptanol (C.)
2---Ethylhexanol (C_)
Octanol (C_)
Nonanol (C_)
Decanol (C_n)
Undecanol (C_V)
Dodecanol (C_)
Tridecanol (Cl_)
T = Trace
120
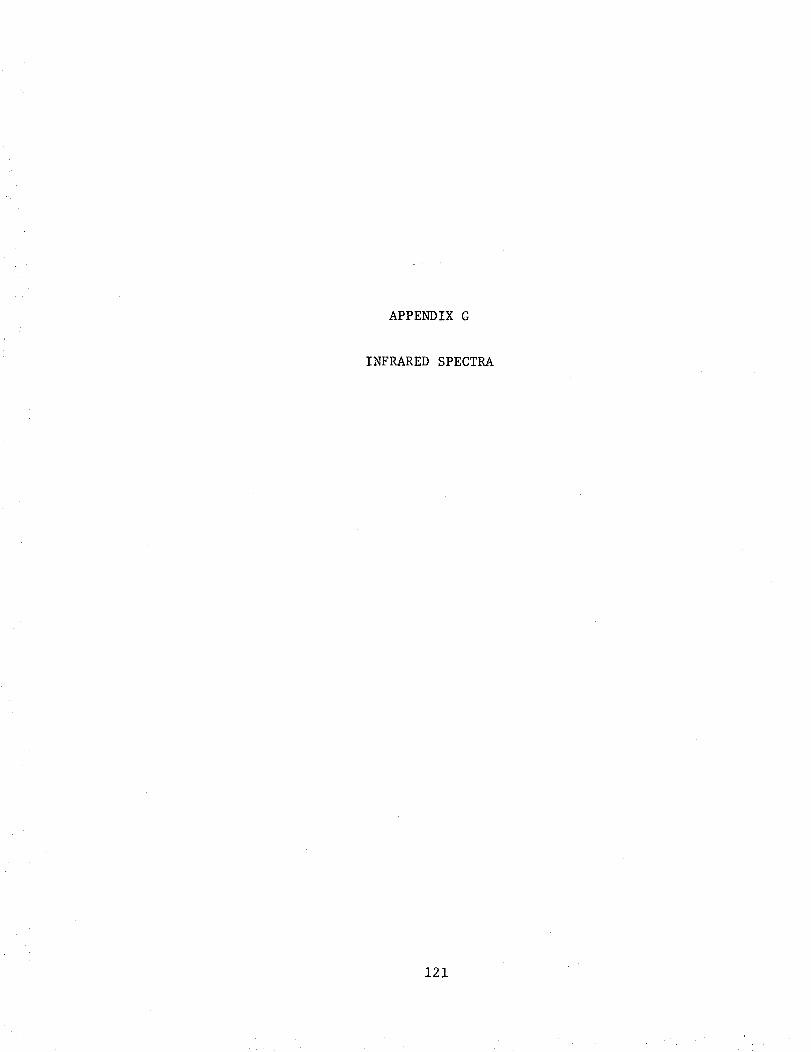
APPENDIXG
INFRAREDSPECTRA
121


• i
2;5
%8O 7',_
1H20_
4000
3 3.5
i:tlt
,_!_-,!l!!_
NN3000
6 6.5 7 7.5 8
_;_,_ .....
1800 1600 _ 400 1200
WAVENUMBER CM "1
FIGURE G-I. NASA-A
16
6O0
2,5
®
®
4000
3.5 4 4.5 7 7.5 8 9 10 11 12 14 16
1400 1200 1000 800 600
FIGURE G-2. NASA-B
123

2, 5 3.5 4 4.5 5 5.5 6 6.5 7 7.5 8 9 10 11 12 14 16
4O0O 3000 2000 1800
WAVENUM8ER CM "1
1600 1400 1200 1000 800 600
FIGURE G-3. NASA-C
2,5 3.5 4 4.5 5 5.5 6 6.5 7 7.5 8 9 10 11 12 14 16
:0:4000 3OO0 2000 1800
WAVENUMBER CM "1
1600 1400 1200 1000 000 600
FIGURE G-4. NASA-D
124

2.5
4000
3.5
3000
4 4,5 5 6 6.5 7 7.5 8
2000 1800
WAVENUMBER CM "1
1600 1400
FIGURE G-5. NASA-E
9 10 11 12 14 16
1200 1000 800 600
2.5 3 3.5 4
4000 3000
6.5 7 7,5 8
2000 1800 1600
WAVENUMBER CM "1
9 10 11 12 14 t6
FIGURE G-6. NASA-F
1400 1200 1000 800 600
125
i_ _ _i _ .......!,!,__,i_ _-_'.iiiii,_;'
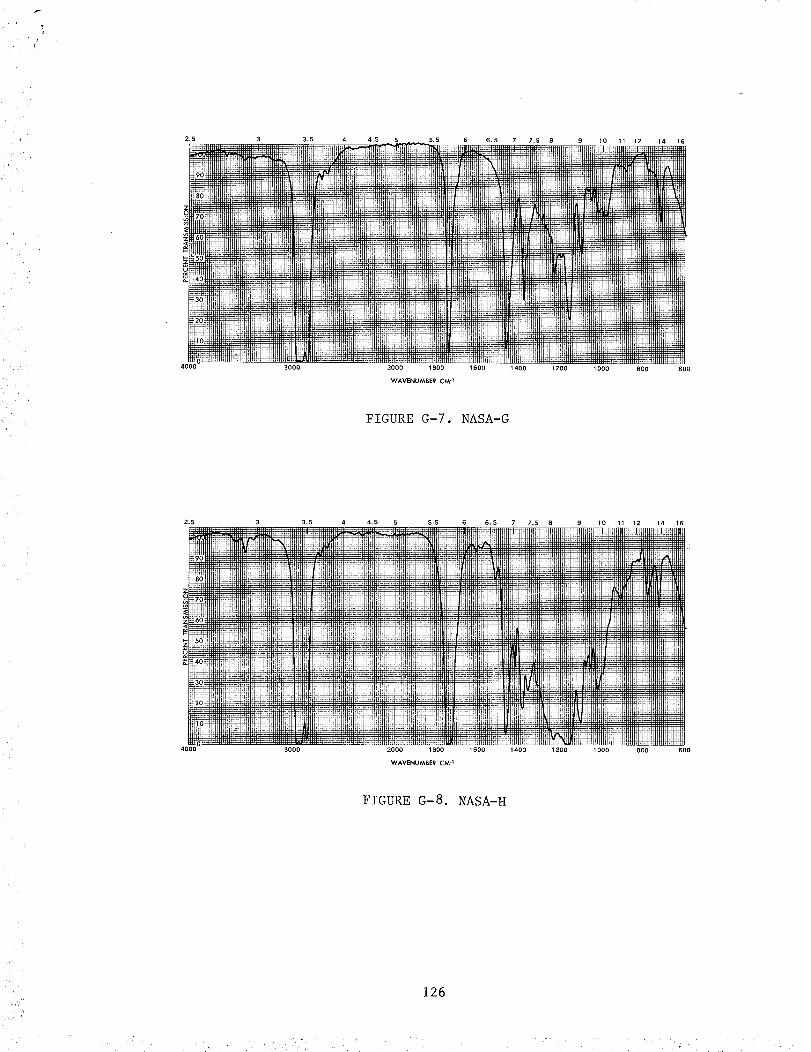
4000 3000
4.5
2000 1800
WAVENUMBER CM "t
1600 1400 1200 1000 800 600
FIGURE G-7. NASA-G
2.5
4000 3000
6 6.5 7 7.5 8
1600 1400
FIGURE G-8. NASA-H
9 10 11 12 14 16
1200 1000 800 600
126

x
2,5
9C
8C
7(
50I_
3CX
20X
4000 3000
4 4,5 5,5 6
2000 1800
WAVENUMBER CM "1
FIGURE G-9.
6.5 7 7.5 8 9 10 11 12 14 16
1600 1400 1200 1000 800 600
NASA- I
2.5
90_
_4_
4000 3000
3,5 4 4.5 5 5.5
2000 1800
WAVENUMBER CM "1
6 6.5 7 7,5 8 9 10 11 12 14 16
1600 1400 1200 1000 800 600
FIGURE G-10. NASA-J
127

2,5 3.5 4 4.5 5 5.5 6 6.5 7 7.5 8 9 10 I1 12 14 16
4000 300O 2000 1800 1600
WAVENUMBER CM "1
1400 1Z00 1000 800 600
FIGURE G-II. NASA-K
128

DISTRIBUTIONLIST
DEPARTMENTOFDEFENSE
DEFENSEDOCUMENTATIONCTRCAMERONSTATIONALEXANDRIAVA 22314
DEPTOFDEFENSEATTN: DASD-LM(MRDYCKMAN)WASHINGTONDC20301
COMMANDERDEFENSELOGISTICSAGYATTNDLA-SME(MRSP MCLAIN)CAMERONSTATIONALEXANDRIAVA 22314
COMMANDERDEFENSEFUELSUPPLYCTRATTN: DFSC-T(MR. MARTIN)CAMERONSTAALEXANDRIAVA 22314
COMMANDERDEFENSEGENERALSUPPLYCTRATTN: DGSC-SSARICHMONDVA 23297
DODATTN: DUSD(RAT) (Dr. Dix)ATTN: DUSD(RTI) (Dr. Young)WASHINGTON,DC 20301
DEFENSEADVANCEDRESPROJAGENCYDEFENSESCIENCESOFC1400 WILSONBLVDARLINGTONVA 22209
DEPARTMENTOFTHEARMY
HQ, DEPTOFARMYATTN: DALO-TSE(COLST. ARNAUD) 1
DALO-AV 1DALO-SMZ-E IDAMA-CSS-P(DR BRYANT) 1DA_-ARZ-E (DR VERDERAME)I
WASHINGTONDC20310
CDRU.S. ARMYMOBILITYEQUIPMENT
R&DCOMMANDAttn: DRDME-VF
DRDME-WCFORTBELVOIRVA 22060
12
I02
CDRUSARMYMATERIELDEVEL&
READINESSCOMMANDATTN: DRCLD(MRBENDER)
DRCDMR(MRGREINER)DRCDMD-ST(DR HALEY)DRCQA-EDRCDE-SGDRCIS-C(LTC CROW)DRCSM-WRS(MR. SCHEUBLE)
5001EISENHOWERAVEALEXANDRIAVA 22333
CDRUSARMYTANK-AUTOMOTIVECMDATTNDRSTA-GSPE
DRSTA-RGDRSTA-NS(DR CHURCH)DRSTA-GDRSTA-MDRSTA-GBP(MRMCCARTNEY)
WARRENMI 48090
DIRECTORUSARMYMATERIELSYSTEMS
ANALYSISAGENCYATTNDRXSY-CM
DRXSY-SDRXSY-L
ABERDEENPROVINGGROUNDMI) 21005
DIRECTORAPPLIEDTECHNOLOGYLABU.S. ARMYR&TLAB (AVRADCOM)ATTNDAVDL-ATL-ATP(MRMORROW)
DAVDL-ATL-ASV(MRCARPER)FORTEUSTISVA 23604
HQ, 172DINFANTRYBRIGADE(ALASKA)ATTNAFZT-DI-L 1
AFZT-DI-M IDIRECTORATEOF INDUSTRIALOPERATIONS
FT RICHARDSONAK 99505
CDRUSARMYGENERALMATERIAL&
PETROLEUMACTIVITYATTN STSGP-F (MR SPRIGGS)
STSGP-PE (MR MCKNIGHT),
BLDG 85-3
STSGP (COL CLIFTON)
NEW CUMBERLAND ARMY DEPOT
NEW CUMBERLAND PA 17070
7/83
AFLRL NO. 166
Page i of 6

iii̧ ¸
CDRUSARMYMATERIELARMAMEMT
READINESSCMDATTNDRSAR-LEMROCKISLANDARSENALIL 61299
CDRUSARMYCOLDREGIONTESTCENTERATTNSTECR-TAAPOSEATTLE98733
HQ, DEPT.OFARMYATTN: DAEN-RDMWASHINGTON,DC 20310
CDRUSARMYRES& STDZNGROUP
(EUROPE)ATTNDRXSN-UK-RABOX65FPONEWYORK09510
HQ, USARMYAVIATIONR&DCMDATTNDRDAV-GT(MRR LEWIS)
DRDAV-DP(MREDWARDS)DRDAV-N(MRBORGMAN)DRDAV-E
4300 GOODFELLOWBLVDST LOUISMO63120
CDRUSARMYFORCESCOMMANDATTNAFLG-REG
AFLC--POPFORTMCPHERSONGA30330
CDRUSARMYABERDEENPROVINGGROUNDATTN: STEAP-MT
STEAP-MT-U(MRDEAVER)ABERDEENPROVINGGROUNDMD21005
CDRUS ARMYYUMAPROVINGGROUNDATTNSTEYP-MT(MRDOEBBLER)YUMAAZ 85364
PROJMGR,ABRAMSTANKSYSATTNDRCPM-GCM-SATTNDRCPM-GCM-LF(MAJSIKES)WARRENMI 48090
7/83
AFLRL NO. 166
Page 2 of 6
PROJ MGR, FIGHTING VEHICLE SYS
ATTN DRCPM-FVS-SE
WARREN MI 48090
PROJ MGR, M60 TANK DEVELOPMENT
USMC-LNO, MAJ. VARELLA 1
US ARMY TANK-AUTOMOTIVE CMD (TACOM)
WARREN MI 48090
PROG MGR, MII3/MII3AI FAMILY
VEHICLES
ATTN DRCPM-MII3
WARREN MI 48090
PROJ MGR, MOBILE ELECTRIC POWER
ATTN DRCPM-MEP-TM
7500 BACKLICK ROAD
SPRINGFIELD VA22150
PROJ MGR, IMPROVED TOW
VEHICLE
US ARMY TANK-AUTOMOTIVE CMD
ATTN DRCPM-ITV-T
WARREN MI 48090
CDR
US ARMY EUROPE & SEVENTH ARMY
ATTN AEAGC-FMD
ATTN: AEAGC-TE
APO NY 09403
PROJ MGR, PATRIOT PROJ OFC
ATTN DRCPM-MD-T-G
US ARMY DARCOM
REDSTONE ARSENAL AL 35809
CDR
THEATER ARMY MATERIAL MGMT
CENTER (200TH)
DIRECTORATE FOR PETROL MGMT
ATTN AEAGD-MM-PT-Q
ZWEIBRUCKEN
APO NY 09052
CDR
US ARMY RESEARCH OFC
ATTN DRXRO-ZC
DRXRO-EG (DR SINGLETON)
DRXRO-CB (DR GHIRARDELLI)P O BOX 12211
RSCH TRIANGLE PARK NC 27709

•i•
i
DIR
US ARMY AVIATION R&T LAB (AVRADCOM)
ATTN DAVDL-AS (MR D WILSTEAD) 1
NASA/AMES RSCH CTR
MAIL STP 207-5
MOFFIT FIELD CA 94035
CDR
TOBYHANNA ARMY DEPOT
ATTN SDSTO-TP-S
TOBYHANNA PA 18466
DIR
US ARMY MATERIALS & MECHANICS
RSCH CTR
ATTN DRXMR-E
DRXMR-R
DRXMR-T
WATERTOWN MA 02172
CDR
US ARMY DEPOT SYSTEMS CMD
ATTN DRSDS
CHAMBERSBURG PA 17201
CDR
US ARMY WATERVLIET ARSENAL
ATTN SARWY-RDD
WATERVLIET NY 12189
CDR
US ARMY LEA
ATTN DALO-LEP
NEW CUMBERLAND ARMY DEPOT
NEW CUMBERLAND PA 17070
CDR
US A_MY GENERAL MATERIAL &
PETROLEUM ACTIVITY
ATTN STSGP-PW (MR PRICE)
BLDG 247, DEFENSE DEPOT TRACY
TRACY CA 95376
CDR
US ARMY FOREIGN SCIENCE & TECH
CENTER
ATTN DRXST-MT1
FEDERAL BLDG
CHARLOTTESVILLE VA 22901
CDR
DARCOM MATERIEL READINESS
SUPPORT ACTIVITY (MRSA)
ATTN DRXMD-MD
LEXINGTON KY 40511
HQ, US ARMY T&E COMMAND
ATTN DRSTE-TO-O 1
ABERDEEN PROVING GROUND, MD 21005
HQ, US ARMY ARMAMENT R&D CMD
ATTN DRDAR-LC 1
DRDAR-SC 1
DRDAR-AC 1
DRDAR-QA 1DOVER NJ 07801
HQ, US ARMY TROOP SUPPORT &
AVIATION MATERIAL READINESS
COMMAND
ATTN DRSTS-MEG (2)
DRCPO-PDE (LTC FOSTER)
4300 GOODFELLOW BLVD
ST LOUIS MO 63120
DEPARTMENT OF THE ARMY
CONSTRUCTION ENG RSCH LAB
ATTN CERL-EM
CERL-ZT
CERL-EH
P 0 BOX 4005
CHAMPAIGN IL 61820
DIR
US ARMY ARMAMENT R&D CMD
BALLISTIC RESEARCH LAB
ATTN DRDAR-BLV
DRDAR-BLP
ABERDEEN PROVING GROUND, MD 21005
HQUS ARMY TRAINING & DOCTRINE CMD
ATTN ATCD-S (LTC LESKO)
FORT MONROE VA 23651
DIRECTOR
US ARMY RSCH & TECH LAB (AVRADCOM)
PROPULSION LABORATORY
ATTN DAVDL-PL-D (MR ACURIO) 1
21000 BROOKPARK ROAD
CLEVELAND OH 44135
CDR
US ARMY NATICK RES & DEV LAB
ATTN DRDNA-YE (DR KAPLAN)
NATICK MA 01760
CDR
US ARMY TRANSPORTATION SCHOOL
ATTN ATSP-CD-MS
FORT EUSTIS VA 23604
7/83
AFLRL NO. 166
Page 3 of 6
r r •

CDR
US ARMY QUARTERMASTER SCHOOL
ATTN ATSM-CD (COL VOLPE)
ATSM-CDM
ATSM-TNG-PT
FORT LEE VA 23801
HQ, US ARMY ARMOR CENTERATTN ATZK-CD-SB
FORT KNOX KY 40121
CDR
101ST AIRBORNE DIV (AASLT)
ATTN: AFZB-KE-J 1
AFZB-KE-DMMC (CPT MORRIS) i
FORT CAMPBELL, KY 42223
CDR
US ARMY LOGISTICS CTR
ATTN ATCL-MS (MR A MARSHALL)
FORT LEE VA 23801
CDR
US ARMY FIELD ARTILLERY SCHOOL
ATTN ATSF-CD
FORT SILL OK 73503
CDR
US ARMY ORDNANCE CTR & SCHOOL
ATTN ATSL-CTD-MS
ABERDEEN PROVING GROUND MD 21005
CDR
US ARMY ENGINEER SCHOOL
ATTN ATSE-CDM
FORT BELVOIR VA 22060
CDR
US ARMY INFANTRY SCHOOL
ATTN ATSH-CD-MS-M
FORT BENNING GA 31905
CDR
US ARMY AVIATION BOARD
ATTN ATZQ-OT-C
ATZQ-OT-A
FORT RUCKER AL 36362
CDR
US ARMY MISSILE CMD
ATTN DRSMI-O
DRSMI-RK
DRSMI-D
REDSTONE ARSENAL, AL 35809
7/83
A_LRL NO. 166
Page 4 of 6
CRD
US ARMY AVIATION CTR & FT RUCKER
ATTN ATZQ-DFORT RUCKER AL 36362
PROJ MGR M60 TANK DEVELOP.
ATTN DRCPM-M60-E
WARREN MI 48090
CDR
US ARMY INFANTRY BOARD
ATTN ATZB-IB-PR-T
FORT BENNING, GA 31905
CDR
US ARMY FIELD ARTILLERY BOARD
ATTN ATZR-BDPR
FORT SILL OK 73503
CDR
US ARMY ARMOR & ENGINEER BOARD
ATTN ATZK-AE-PD
ATZK-AE-CV
FORT KNOX, KY 40121
CDR
US ARMY CHEMICAL SCHOOL
ATTN ATZN-CM-CS
FORT MCCLELLAN, AL 36205
CHIEF, U.S. ARMY LOGISTICS
ASSISTANCE OFFICE, FORSCOM
ATTN DRXLATFO (MR PITTMAN)
FT MCPHERSON, GA 30330
DEPARTMENT OF THE NAVY
CDR
NAVAL AIR PROPULSION CENTER
ATTN PE-71 (MR WAGNER)
PE-72 (MR D'ORAZIO)
P O BOX 7176
TRENTON NJ 06828
CDR
NAVAL SEA SYSTP_S CMD
CODE 05M4 (MR R LAYNE)
WASHINGTON DC 20362
CDR
DAVID TAYLOR NAVAL SHIP R&D CTR
CODE 2830 (MR G BOSMAJIAN) 1
CODE 2705.1 (MR STRUCKO) i
CODE 2831 I
CODE 2832 1
ANNAPOLIS MD 21402

JOINT OIL ANALYSISPROGRAM-TECHNICALSUPPORTCTR
BLDG780
NAVAL AIR STATION
PENSACOLA FL 32508
DEPARTMENT OF THE NAVY
HQ, US MARINE CORPS
ATTN LPP (MAJ SANDBERG)
LMM/3 (MAJ STROCE)
WASHINGTON DC 20380
CDR
NAVAL AIR SYSTEMS CMI)
ATTN CODE 5304CI (MR WEINBURG)
CODE 53645 (MR MEARNS)
WASHINGTON DC 20361
CDR
NAVAL AIR DEVELOPMENT CTR
ATTN CODE 60612 (MR L STALLINGS) 1
WARMINSTER PA 18974
CDR
NAVAL RESEARCH LABORATORY
ATTN CODE 6170 (MR H RAVNER)
CODE 6180
CODE 6110 (DR HARVEY)
WASHINGTON DC 20375
CDR
NAVAL FACILITIES ENGR CTR
ATTN CODE 120 (MR R BURRIS)
CODE 120B (MR BUSCHELMAN)
200 STOVWALL ST
ALEXANDRIA VA 22322
CHIEF OF NAVAL RESEARCH
ATTN CODE 473
ARLINGTON VA 22217
CDR
NAVAL AIR ENGR CENTER
ATTN CODE 92727
LAKEHURST NJ 08733
COMMANDING GENERAL
US MARINE CORPS DEVELOPMENT
& EDUCATION COMMAND
ATTN: D075 (LTC KERR)
QUANTICO, VA 22134
CDR, NAVAL MATERIEL COMMAND
ATTN MAT-08E (DR A ROBERTS)
MAT-O8E (MR ZIEM)
CP6, RM 606
WASHINGTON DC 20360
CDR
NAVY PETROLEUM OFC
ATTN CODE 40
CAMERON STATION
ALEXANDRIA VA 22314
CDR
MARINE CORPS LOGISTICS SUPPORT
BASE ATLANTIC
ATTN CODE P841
ALBANY GA 31704
DEPARTMENT OF THE AIR FORCE
HQ, USAF
ATTN LEYSF (MAJ LENZ)
WASHINGTON DC 20330
HQ AIR FORCE SYSTEMS CMD
ATTN AFSC/DLF (LTC RADLOFF)
ANDREWS AFB MD 20334
CDR
US AIR FORCE WRIGHT AERONAUTICAL
LAB
ATTN AFWAL/POSF (MR CHURCHILL)
AFWAL/POSL (MR JONES)
AFWAL/MLSE (MR MORRIS)
AFWAL-MLBT
WRIGHT-PATTERSON AFB OH 45433
CDR
SAN ANTONIO AIR LOGISTICS
CTR
ATTN SAALC/SFQ (MR MAKRIS)
SAALC/MMPRR
KELLY AIR FORCE BASE, TX 78241
CDR
WARNER ROBINS AIR LOGISTIC
CTR
ATTN WR-ALC/MMIRAB-I (MR GRAHAM) I
ROBINS AFB GA 31098
7/83
AFLRL NO. 166
Page 5 of 6

OTHERGOVERNMENTAGENCIES
USDEPARTMENTOFTRANSPORTATIONATTNAIRCRAFTDESIGNCRITERIA
BRANCHFEDERALAVIATIONADMIN2100 2NDST SWWASHINGTONDC20590
DIRECTORNATLMAINTENANCETECHSUPPORT
CTRUS POSTALSERVICENORMANOK73069
NASA-LEWISRESEARCHCENTER21000 BROOKPARKROADCLEVELAND,OHIO 44135ATTN: MR. A. MITCHELL,MS23-3 25
DR. E.V. ZARETSKY,MS23-3 1DR. J.J. COY,MS23-3 IMR. J' GROBMAN,MS6-9 IMR. J. CLARK,MS6-9 iLIBRARY,MS60-3 2REPORTCONTROLOFFICE,
MS60-i 1
NASA-RJPATTN: LYNNWRIGHT 1
EARLVANLANDINGHAM 1WASHINGTONDC 20546
USDEPARTMENTOFENERGYSYSTEMSEEF, ATTN: MR.ALPAUGHFORRESTALBLDG.i000 INDEPENDENCEAVE., SWWASHINGTONDC 20585
DEPARTMENTOFTRANSPORTATIONFEDERALAVIATIONADMINISTRATIONAWS-II0, ATTN: MR. NUGENT800 INDEPENDENCEAVE, SWWASHINGTONDC 20590
USDEPARTMENTOFENERGYCE-131.2, GB-096ATTN: MRECKLUNDFORRESTALBLDG.I000 INDEPENDENCEAVE, SWWASHINGTONDC 20585
7/83AFLRLNO. 166Page 6 of 6
1
USDEPARTMENTOF ENERGYBARTLESVILLEENERGYRSCHCTRDIV OF PROCESSING& THERMORESDIV OFUTILIZATIONRESBOX1398BARTLESVILLEOK74003
SCI & TECHINFOFACILITYATTNNASAREP(SAK/DL) 6P 0 BOX8757BALTIMORE/WASHINT AIRPORTMD21240
ENVIRONMENTALPROTECTIONAGCYOFFICEOFMOBILESOURCESMAIL CODEANR-455
(MR. G. KITTREDGE) i401M ST., SWWASHINGTONDC 20460

