7 liquefaction and slope stability - purdue...
TRANSCRIPT
Li f ti d S i i SlLiquefaction and Seismic Slope Stabilityy
Prof. Ellen M. Rathje, Ph.D., P.E.
Department of Civil Architectural andDepartment of Civil, Architectural, and Environmental Engineering
University of Texas at Austin
19 November 2010
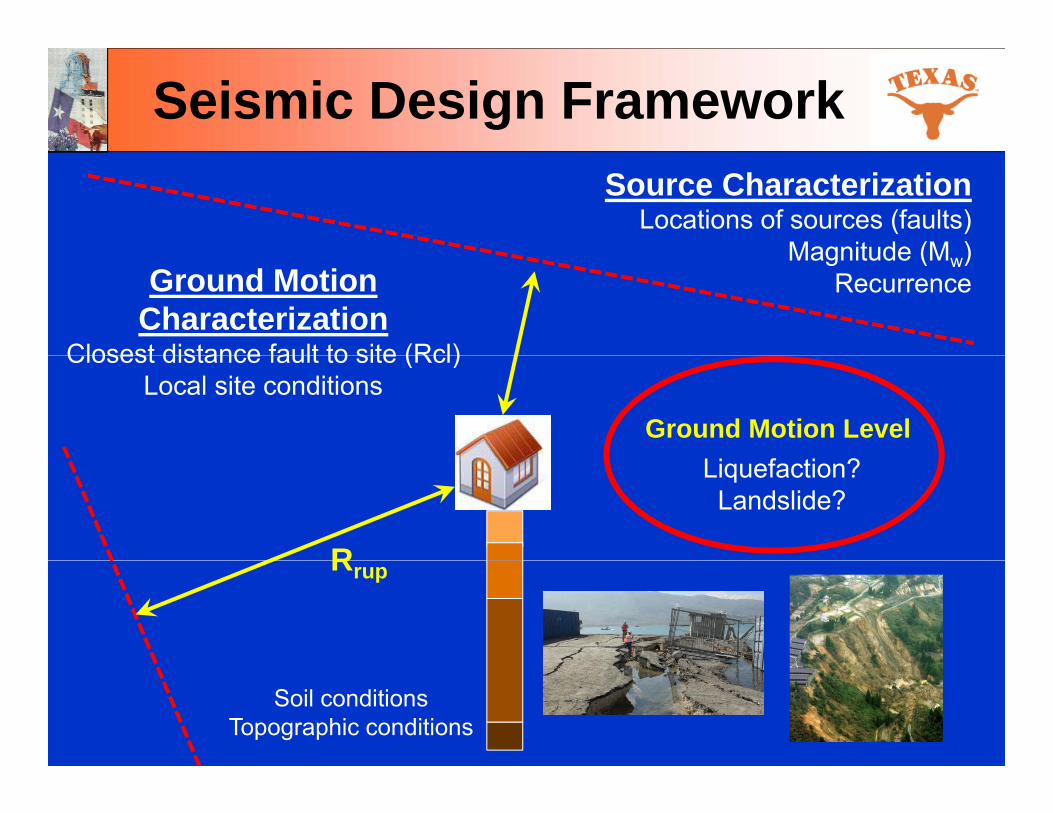
Seismic Design FrameworkSource Characterization
Locations of sources (faults)Magnitude (M )Magnitude (Mw)
RecurrenceGround Motion Characterization
Closest distance fault to site (Rcl)Closest distance fault to site (Rcl)Local site conditions
Ground Motion Level
R
Liquefaction?Landslide?
Rrup
Soil conditionsTopographic conditions

Liquefaction
Occurs in loose sand below the water tableStrong shaking:
– Increases pore water pressuresD ff ti t– Decreases effective stress
– Decreases strengthEffectsEffects
– Soil and water shoot out of ground– Buildings tilt and settleBuildings tilt and settle– Ground spreading on slopes (e.g., river bank)
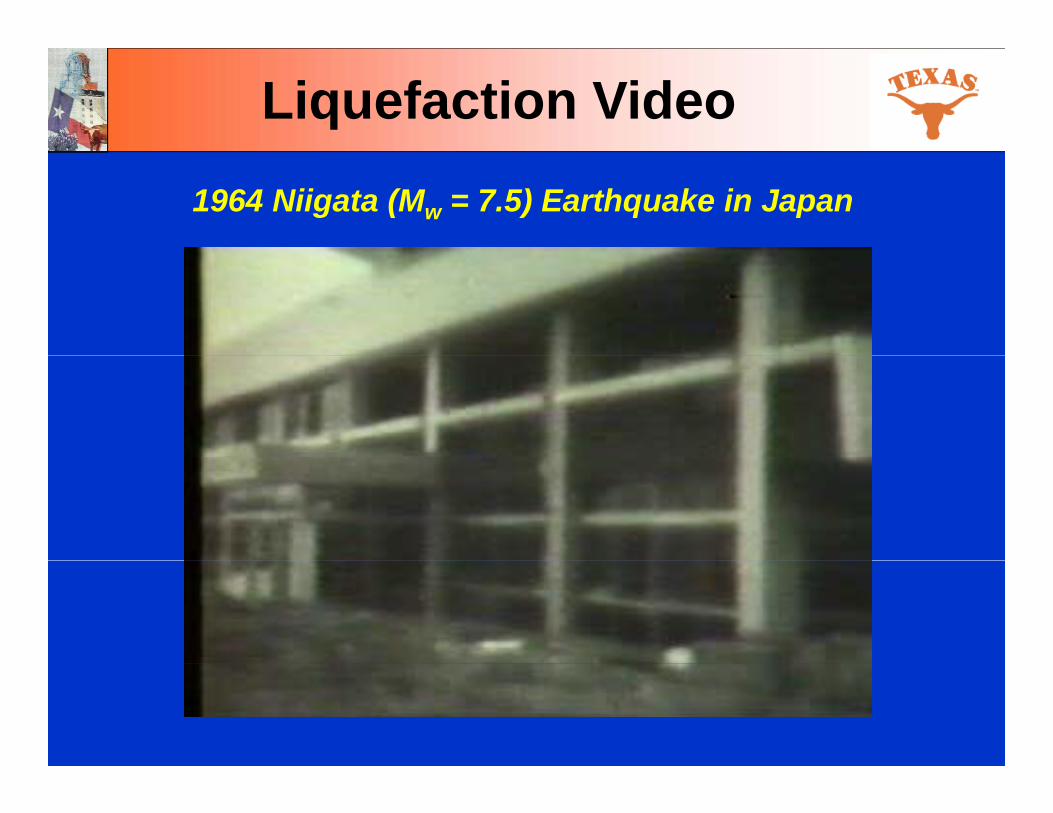
Liquefaction Video1964 Niigata (Mw = 7.5) Earthquake in Japan

Niigata Airport
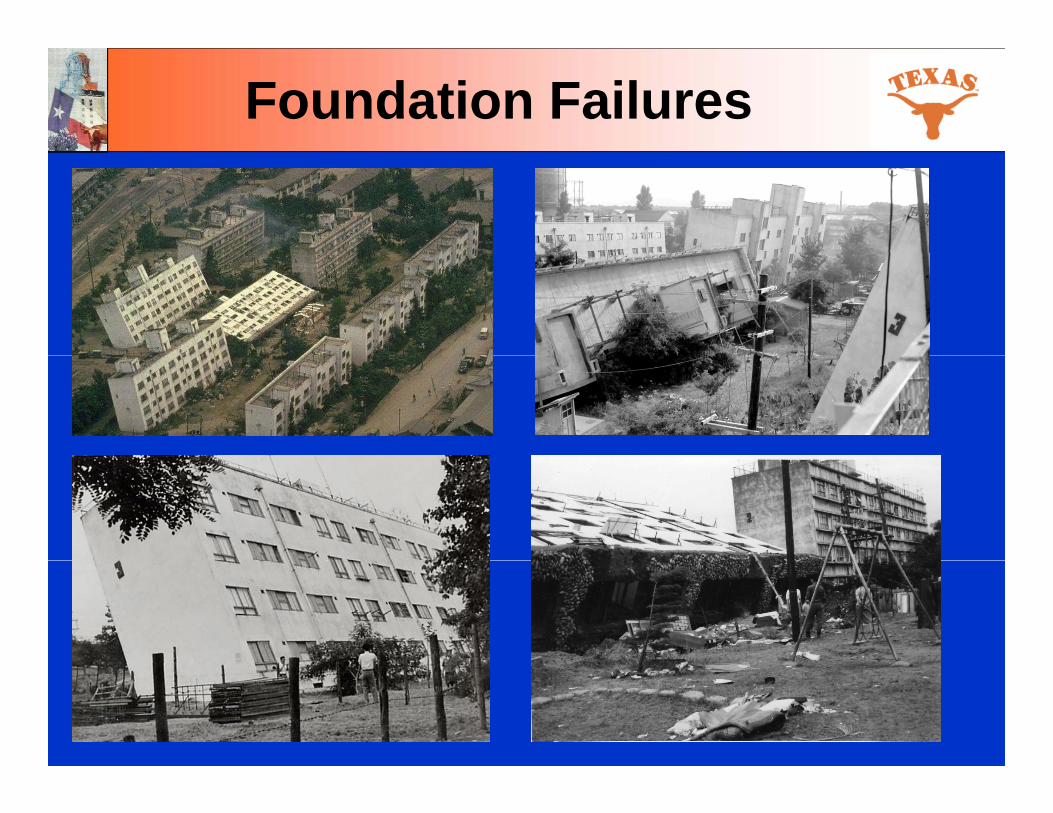
Foundation Failures

Lateral Spreading

Liquefaction Assessment
• Determine if soil type is liquefiableSand non plastic silt− Sand, non-plastic silt
• Characterize the cyclic resistance of soil− Cyclic stress ratio (CSR) = / v− Cyclic resistance ratio (CRR) = CSR to cause
li f tiliquefaction− Estimated from SPT blowcount
• Characterize seismic loading (CSREQ)− Estimated from PGA and earthquake M
• Factor of Safety = CRR / CSREQ

Cyclic Resistance Ratio
• (N1)60 = SPT blowcountcorrected to 60%corrected to 60% theoretical energy and v = 1 atm (100 kPa)
CR
RC
From Youd et al. (2001)
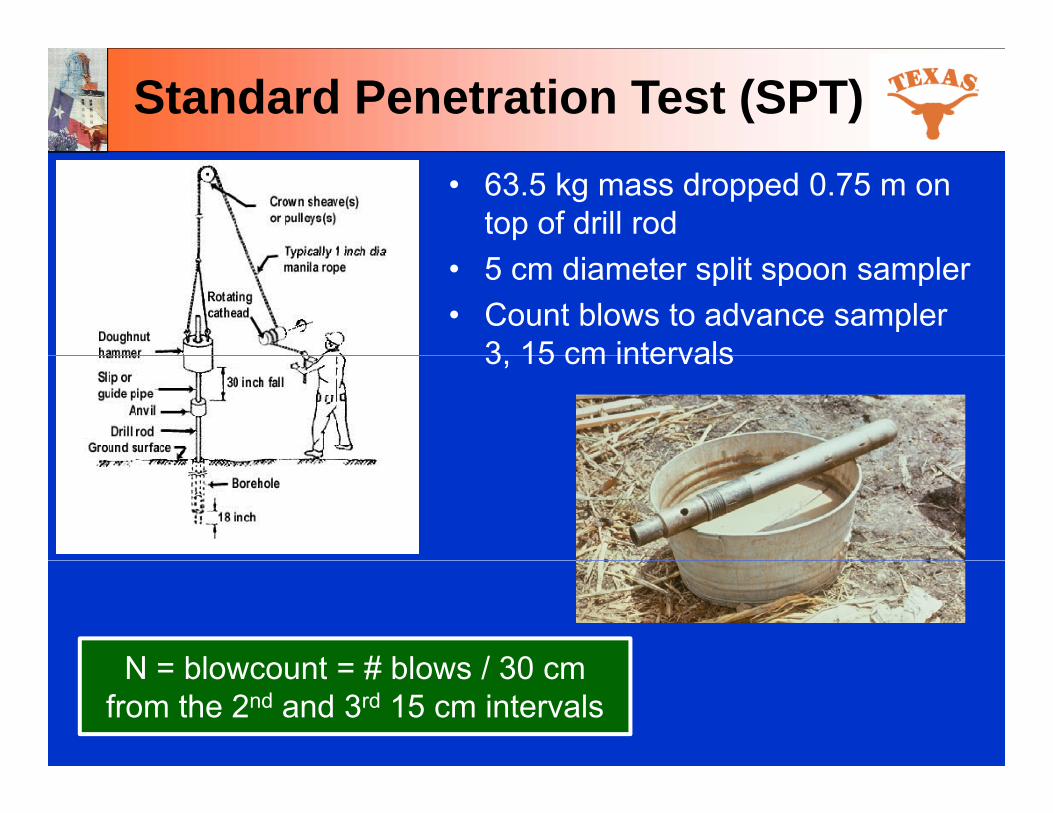
Standard Penetration Test (SPT)• 63.5 kg mass dropped 0.75 m on
top of drill rod• 5 cm diameter split spoon sampler • Count blows to advance sampler
3 15 cm intervals3, 15 cm intervals
N = blowcount = # blows / 30 cmN = blowcount = # blows / 30 cm from the 2nd and 3rd 15 cm intervals
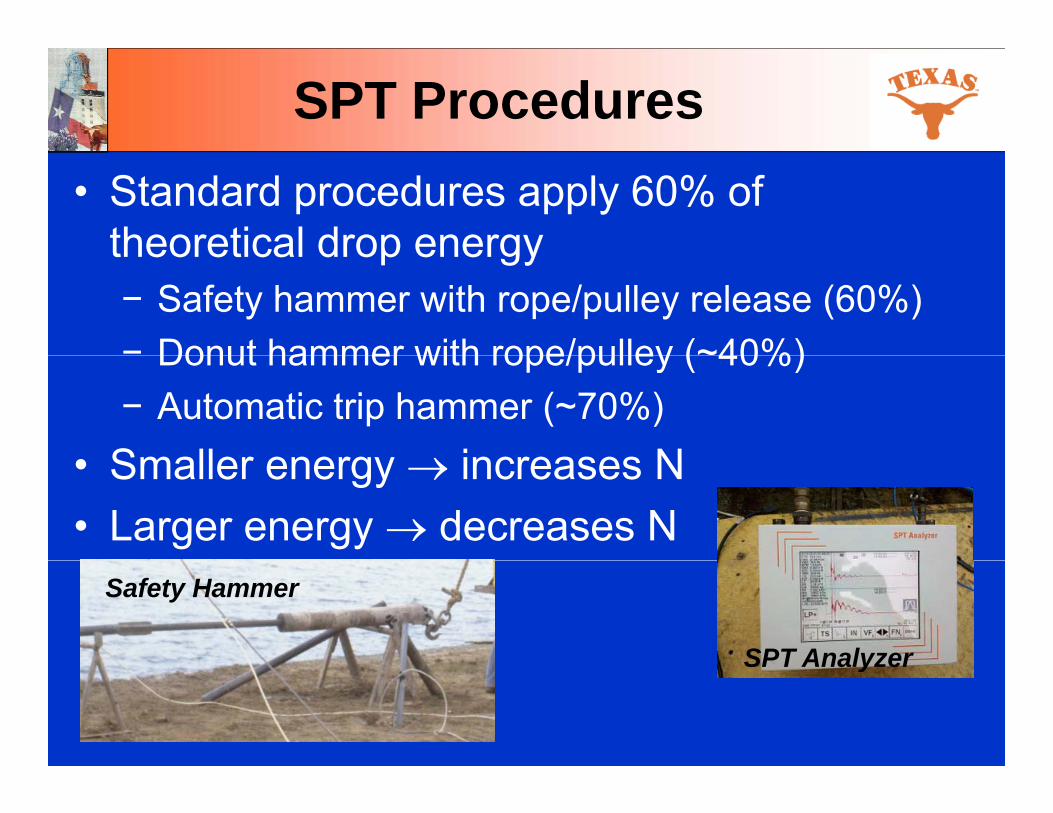
SPT Procedures• Standard procedures apply 60% of
theoretical drop energytheoretical drop energy− Safety hammer with rope/pulley release (60%)− Donut hammer with rope/pulley (~40%)Donut hammer with rope/pulley ( 40%)− Automatic trip hammer (~70%)
Smaller energy increases N• Smaller energy increases N• Larger energy decreases N
Safety Hammer
SPT AnalyzerSPT Analyzer

SPT Corrections• Overburden stress (i.e., depth) also affects
blowcountblowcount• Correct blow count to 60% theoretical
energy and = 1 atmenergy and v = 1 atm
(N1)60 = N · (Energy Ratio / 60) · (CN)( 1)60 ( gy ) ( N)Energy Ratio = % of theoretical energy impartedCN = 1 / v with v in units of atmO h i f d l h b h lOther corrections for rod length, bore hole diameter, etc.

CRR
CRR = CRRM=7.5, =1 atm · MSF · K
M = 7.5, v= 1 atm
CR
R
v

CSREQ
• Related to PGA and earthquake magnitude
CSREQ = 0.65 · PGA · (v / v) · rd
FS = CRR / CSREQ
FS > 1.2 ok!
FS 1.2 Liquefaction!

Liquefaction Assessment
• Port at Port-au-PrinceN (blows/30cm)
0
0 10 20 30 40
N60 (blows/30cm)
5
10
15
Dep
th (m
)
20
25
30

Dealing with Liquefaction
• Soil ImprovementStone columns (densify and reinforce soil)− Stone columns (densify and reinforce soil)
− Deep dynamic compaction (densify)G ti ( d difi ti )− Grouting (ground modification)
• Foundation Improvement− Deep foundations (driven piles, drilled piers)
that extend beyond the liquefaction layer− Must be stiff enough to resist lateral forces

Earthquake-Induced Landslides

Yield Acceleration (ky)
tantan
tantan
sin
m
tcFS w
)tan/1(tan)1(
gFSky )(
When acceleration = ky, FS = 1.0

Stability Assessment
• If PGA kyFS 1 0 (no problem!) 0 4
If accel exceeds ky:− FS 1.0 (no problem!)
• If PGA > ky -0.2
0
0.2
0.4
0 2 4 6 8 10Time (s)
Acc
eler
atio
n (g
)
k y = 0.1 g
− FS < 1.0 (but only at peak in time history)P f till
-0.4
A
20
30
(cm
/s)
− Performance still may be okOften mo ements not
0
10
0 2 4 6 8 10Time (s)
Slid
ing
Vel.
− Often movements not large until PGA > 2· ky(i e k / PGA < 0 5) 2
4
6
8
ng D
ispl
. (cm
)
(i.e., ky / PGA < 0.5)0
2
0 2 4 6 8 10Time (s)
Slid
in