7. process chart
TRANSCRIPT
8/3/2019 7. Process Chart
http://slidepdf.com/reader/full/7-process-chart 1/7
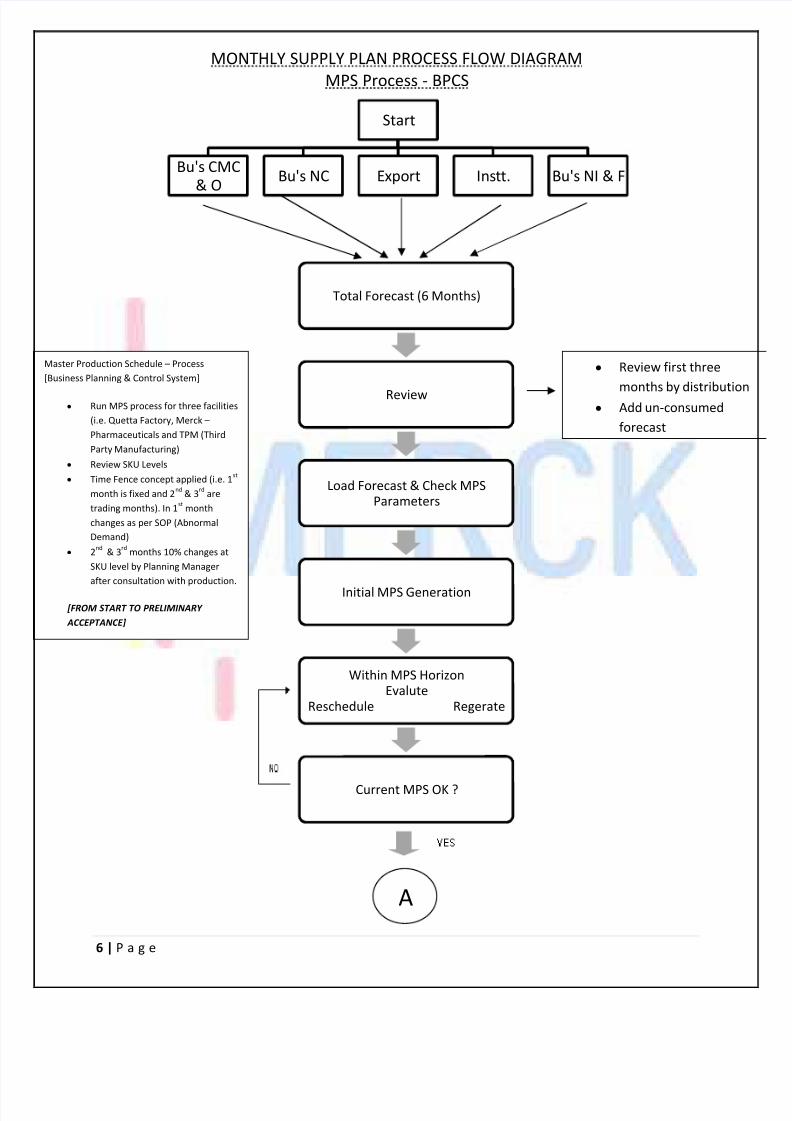
MONTHLY SUPPLY PLAN PROCESS FLOW DIAGRAM
MPS Process - BPCS
6 | P a g e
Start
Bu's CMC& O
Bu's NC Export Instt. Bu's NI & F
Total Forecast (6 Months)
Review
Load Forecast & Check MPSParameters
Initial MPS Generation
Within MPS HorizonEvalute
Reschedule Regerate
Current MPS OK ?
A
Master Production Schedule Process
[Business Planning & Control System]
y Run MPS process for three facilities
(i.e. Quetta Factory, Merck
Pharmaceuticals and TPM (Third
Party Manufacturing)
y Review SKU Levels
y Time Fence concept applied (i.e. 1st
month is fixed and 2nd
& 3rd
are
trading months). In 1st
month
changes as per SOP (Abnormal
Demand)
y 2nd
& 3rd
months 10% changes at
SKU level by Planning Manager
after consultation with production.
[FROM START TO PRELIMINARY
ACCEPTANCE]
y Review first three
months by distributio
y Add un-consumed
forecast
8/3/2019 7. Process Chart
http://slidepdf.com/reader/full/7-process-chart 2/7
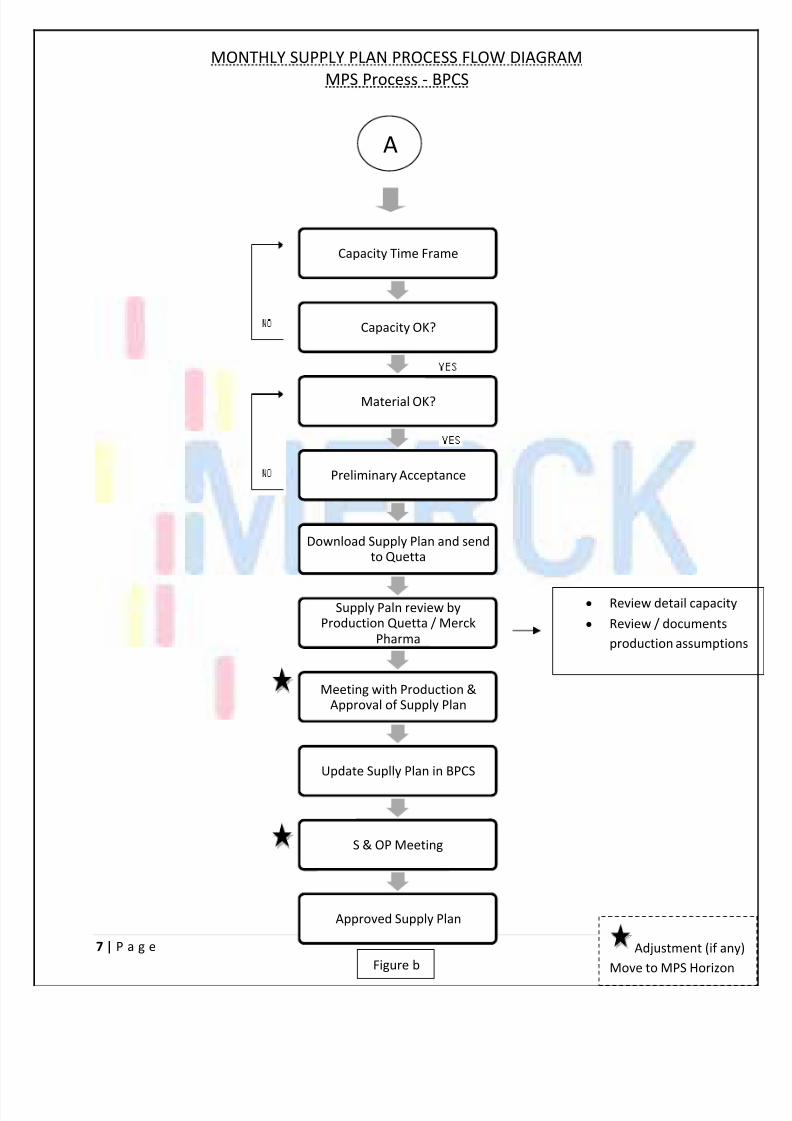
MONTHLY SUPPLY PLAN PROCESS FLOW DIAGRAM
MPS Process - BPCS
7 | P a g e
Capacity Time Frame
Capacity OK?
Material OK?
Preliminary Acceptance
Download Supply Plan and sendto Quetta
Supply Paln review byProduction Quetta / Merck
Pharma
Meeting with Production &Approval of Supply Plan
Update Suplly Plan in BPCS
S & OP Meeting
Approved Supply Plan
A
y Review detail capacity
y Review / documents
production assumption
Adjustment (if any
Move to MPS HorizonFigure b
8/3/2019 7. Process Chart
http://slidepdf.com/reader/full/7-process-chart 3/7
MONTHLY SUPPLY PLAN PROCESS FLOW DIAGRAM
MPS Process - BPCS
8 | P a g e
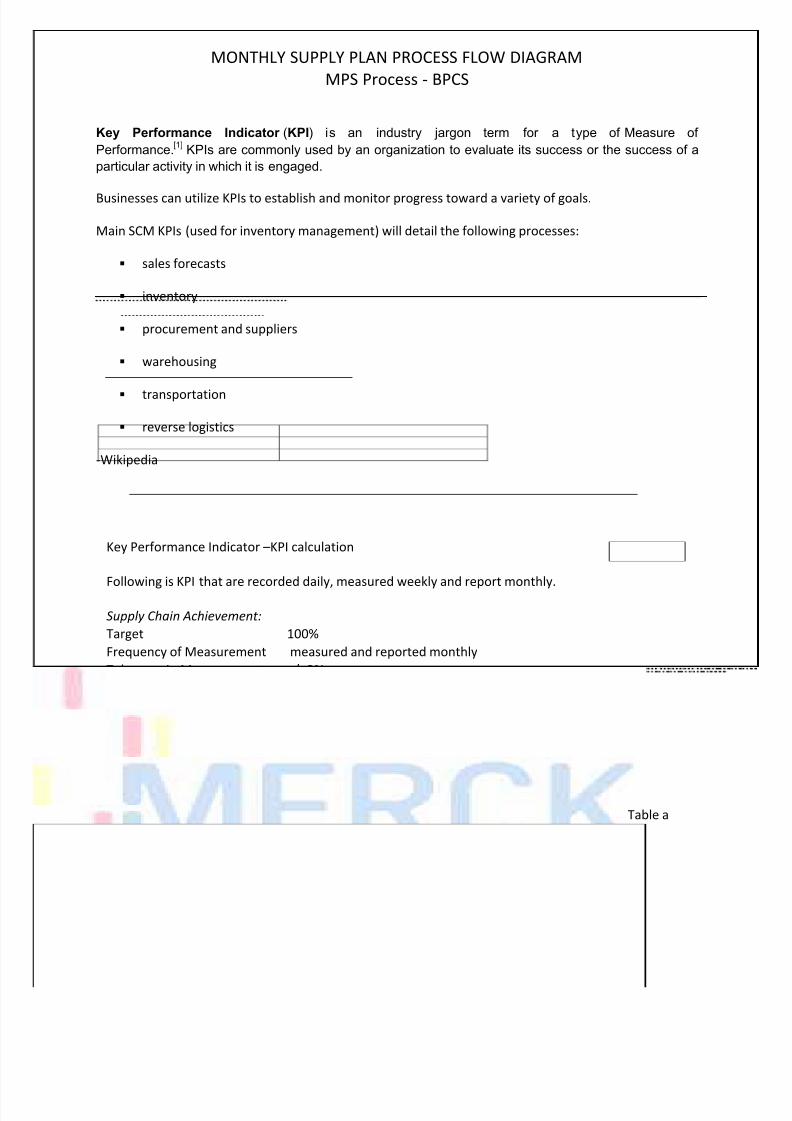
Key Performance Indicator (KPI) is an industry jargon term for a type of Measure of
Performance.[1]
KPIs are commonly used by an organization to evaluate its success or the success of a
particular activity in which it is engaged.
Businesses can utilize KPIs to establish and monitor progress toward a variety of goals.
Main SCM KPIs (used for inventory management) will detail the following processes:
sales forecasts
inventory
procurement and suppliers
warehousing
transportation
reverse logistics
-Wikipedia
-Formula used by Merck Pharma
Key Performance Indicator KPI calculation
Following is KPI that are recorded daily, measured weekly and report monthly.
Supply Chain Achievement:
Target 100%
Frequency of Measurement measured and reported monthly
Tolerance in Measurement +/- 2%
Formula:
X= Total quantity actually produced this month___________________
Total quantity agreed to produce as per last months approved supply plan for this month
Table a
8/3/2019 7. Process Chart
http://slidepdf.com/reader/full/7-process-chart 4/7
MONTHLY SUPPLY PLAN PROCESS FLOW DIAGRAM
MPS Process - BPCS
9 | P a g e
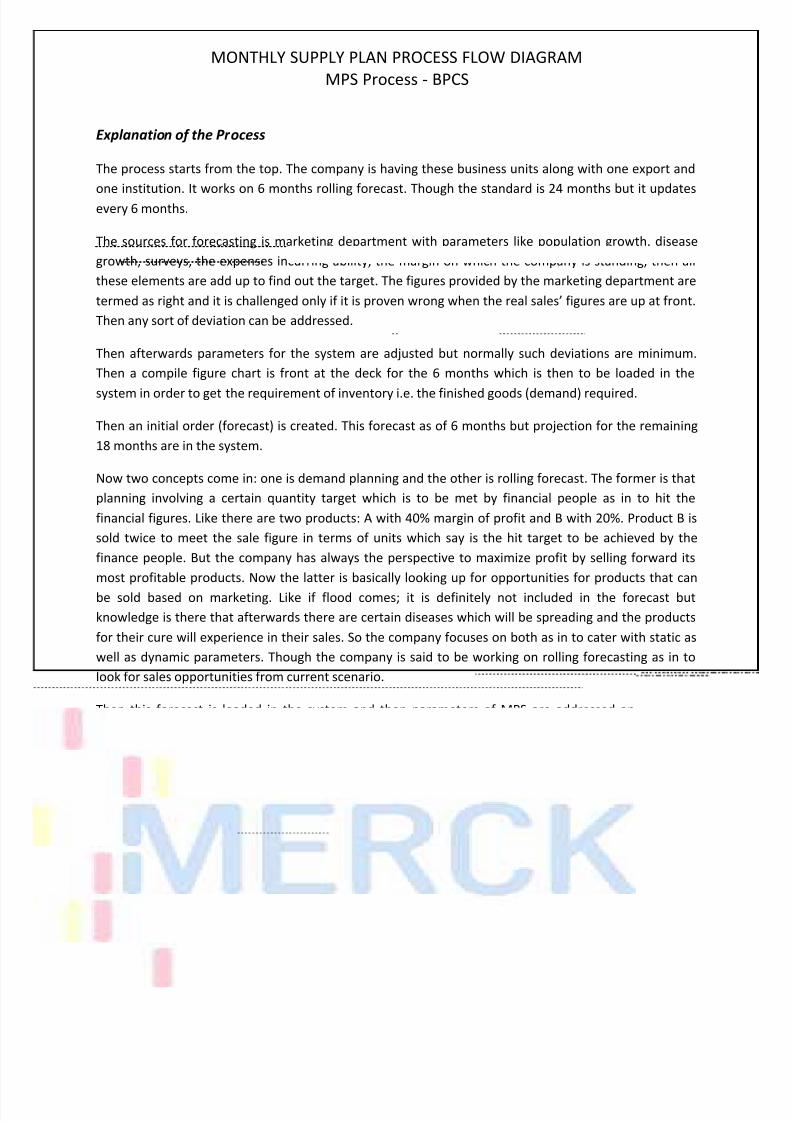
Explanation of the Process
The process starts from the top. The company is having these business units along with one export and
one institution. It works on 6 months rolling forecast. Though the standard is 24 months but it updates
every 6 months.
The sources for forecasting is marketing department with parameters like population growth, disease
growth, surveys, the expenses incurring ability, the margin on which the company is standing, then all
these elements are add up to find out the target. The figures provided by the marketing department are
termed as right and it is challenged only if it is proven wrong when the real sales figures are up at front.
Then any sort of deviation can be addressed.
Then afterwards parameters for the system are adjusted but normally such deviations are minimum.
Then a compile figure chart is front at the deck for the 6 months which is then to be loaded in the
system in order to get the requirement of inventory i.e. the finished goods (demand) required.
Then an initial order (forecast) is created. This forecast as of 6 months but projection for the remaining
18 months are in the system.
Now two concepts come in: one is demand planning and the other is rolling forecast. The former is that
planning involving a certain quantity target which is to be met by financial people as in to hit the
financial figures. Like there are two products: A with 40% margin of profit and B with 20%. Product B is
sold twice to meet the sale figure in terms of units which say is the hit target to be achieved by the
finance people. But the company has always the perspective to maximize profit by selling forward its
most profitable products. Now the latter is basically looking up for opportunities for products that can
be sold based on marketing. Like if flood comes; it is definitely not included in the forecast but
knowledge is there that afterwards there are certain diseases which will be spreading and the products
for their cure will experience in their sales. So the company focuses on both as in to cater with static as
well as dynamic parameters. Though the company is said to be working on rolling forecasting as in to
look for sales opportunities from current scenario.
Then this forecast is loaded in the system and then parameters of MPS are addressed and they are
checked once every 6 months. The initial generation is the now the plan generated.

8/3/2019 7. Process Chart
http://slidepdf.com/reader/full/7-process-chart 5/7
MONTHLY SUPPLY PLAN PROCESS FLOW DIAGRAM
MPS Process - BPCS
10 | P a g e
Terms to be understood:
Gross Requirement= Production
Requirement including Safety Stock
Scheduled receipt= order given to the
supplier and the supplier is agreed to
the terms.
Projected on hand= if things are in
accordance to the parameters set; than
the projection made for the inventory
will come true
Net requirement= Production
Requirement without Safety Stock
Initial Generation of MPS
Parameters
ABC= B Frozen time= 90 days Lead time = 3months
safty stock=50 Lot size= 10 units
Month 1 Month 2 Month 3 Month 4 Month 5 Month 6
demand 50 100 75 50 150 50
Supply 75 75 75 75 75 75
Surplus/Deficit 25 -25 0 25 -75 25
Opening stock 0 55 50 50 75 50
safety stock
needed
25 30 0 0 50 0
R/m purchsed 30 20 0 0 50 0
ending inventory 55 50 50 75 50 75
This is the data Mr Fatami made up to explain the process when and how to purchsing the iventory. Firstly
there are several parameters which are defined once a year and a revised every 6 months to identify any
changes occuring due to market demand/ supply/law and order etc. supposing the leadtime for every purchase
is 3 months then the raw material to be purchased in month 5 will be ordered in month 2 than the supply of
month 5 will increases from 75 to 150 in acutal but no changes will be made here as this is only the planed forcas
Initial Generation of MPS(Original)
Table b
8/3/2019 7. Process Chart
http://slidepdf.com/reader/full/7-process-chart 6/7
MONTHLY SUPPLY PLAN PROCESS FLOW DIAGRAM
MPS Process - BPCS
11 | P a g e
Afterwards the initial MPS chart is checked which if is correct; the company moves to the next step but if
it is not then it is reviewed again within the horizon period of 3 months time period as the order is to be
given keeping in mind the lead time which does not allow the company to go smooth if the forecast is
doubled on a surprise note. The minimum stock level is also to be addressed as in to understand themaintenance of inventory level.
Horizon period :
y It is the period during which time is freeze; it the duration during which you dont want to allow
computer to do anything to deal with any sort of case or mess; instead you want to do
something. For example if there is a case where the company puts an order requiring time
period equal to 90 days and once order is given; it cannot be changed and if you want to change
any factor than manual interaction is needed for which this horizon period is created. Horizon
period is depended on lead time as it former is 90 days and the latter is 60 days; then some
changes if needed can be made but in contrast if the former is 60 days and the latter is 90 days
then definitely nothing can be done about any issue being raised.
MSL: minimum stock level
y In local material inventory management when these material reach the minimum level one
consignment is shipped to Quetta and these are materials like huge volumes ampules, tubes etc.
y Eye is kept on these products as in to maintain them on a daily basis; now people are looking in
the morning that what is the position of the material and then orders are sent to suppliers as in
what to order and in how much quantity.
y
An automated system MSL is set with parameters dealt with manual interaction and then it isreviewed every 6 months along with focus on what the actual sales is going and what MSL shall
be according to that parameter.
T here are two demand codes; one for static demand and the other for dynamic demand
y Static demand: Stable over a period of time. It comprises of fixed parameters. Example of
diabetic patients exist in the country and their growth is very much stable like about by 3 to 4%
and therefore the trend for this demand is stable as well and the production of glucophage is
carried out accordingly and so is the minimum stock keeping requirement is fixed.
y Dynamic demand: If we receive more than forecasted suppose forecast is 100 and demand is
120, system will take 120 in and parameter for the next forecast is taken from the current data.
It states that how much days are required for replenishment and where in one or three months
stock are kept in hand and current consumption of the current month is taken into account and
accordingly create new order.
T he types of demands also have influence of minimum balance/quantity keeping requirement. Once the
minimum level is reached; a new order is created.

8/3/2019 7. Process Chart
http://slidepdf.com/reader/full/7-process-chart 7/7
MONTHLY SUPPLY PLAN PROCESS FLOW DIAGRAM
MPS Process - BPCS
12 | P a g e
[But demand is uncertain in nature and if any such requirement comes say from exports or institution;
then a form is there to mention the abnormal demand in order to be catered as in to see the company is
having the material or not; if no then any procurement can be made successfully along with the review
of additional capacity in addition to regular order capacity. If it is possible then the note/form is signedby the MD as in to deal with it finally.]
Now it is to be kept in mind that initial generation is made with the concept of infinite capacity. So
afterwards it is reviewed in the context of capacity available with manufacturing plant and then it is
reviewed in the context of material whether company is having it or not; whether any procurement is
required and for any type of fluctuations observed there is a massage based system. Here the name of
the type of inventory and the action is put into the system through the message which is send to the
concerned planner who will than edit and remake the initial generation.
Now if it is ok then the company reaches the MPS acceptance level at the primary level also termed as
the MPS confirmation level because this is basically a rough cut which tends to be 90% accurate and 10%
variation is expected. Therefore, it is send to the manufacturing plant to confirm the plan laid out
afterwards meetings is held for the same purpose. This doesnt end here as it is followed by monitoring
process as in to ensure effective implementation.
This whole process is a monthly process and is done round the year because of cyclic nature.