7 soil pollution risk -...
TRANSCRIPT

7 SOIL POLLUTION RISK

RESULTS AND DISCUSSION
153
7.1 MAIN CHEMICAL POLLUTANTS
7.1.1 PHOSPHORUS
Phosphorus is an essential element for plant growth. Plants must have P to
conduct photosynthesis. It is one of major three fertilizer nutrients. Although the
majority of soil P is not soluble for plant absorption, Barber (1984) showed that
the total amount of phosphorus in top soil as an average of 1000 kg ha-1
is not
large compared to annual crop removals of 10 to 40 kg ha-1
. This is especially true
since a large fraction of the phosphorus present is in a mineral form not readily
available for absorption by the plant. Egashira et al. (2003) studied the surface
layers of 13 agricultural soils collected from locations differing in the parent rock.
They found that total P concentration ranged from 251 to 1334 mg kg-1
and was
most highly and significantly correlated with the organic P concentration
percentage. Organic (P) percentage from the total (P) varied considerably with the
soils from 11 to 70%. Amer and Abou-El Roos (1975) showed that total P in
Egyptian soils ranged from 870 to 1781 mg kg-1
in clay loam soils, about 722 mg
kg-1
in (sandy loam) soils and from 337 to 481 mg kg-1
in sandy soils. References
indicate that total phosphorus in soils varies considerably, the high values being
associated with heavy texture alluvial soils. According to Awaga (1989) the total
phosphorus content in Egyptian soils ranged between 270 to 1360 ppm expressed
as profile means, which ranged from 300 to 1050 mg kg-1
in alluvial soils and from
270 to 340 mg kg-1
in sandy soils and was about 680 mg kg-1
in calcareous soils.
Saarela (2003), found that total P ranged from 1066 - 1870 mg kg-1
. In addition,
Egashira et al. (2003) showed that total phosphorus in Ganges flood plains ranged
from 257 to 726 mg kg-1
soil. Important phosphorus levels have been reported in
Qarun and Wadi El-Rayan lake sediments Abdel-Satar and Sayed (2010) and water
(Omar et al., 2013).
Phosphate retention is considered the main problem of phosphorus found in
Egyptian soils especially in El-Fayoum soils. These soils have some physical and
chemical characteristics such as low P-availability high pH, high CaCO3 content,
high soluble calcium cations, fine clay and amount of Al and Fe oxides. Some of
these variables enhance P-fixation (retention) which transfer available-P to
unavailable forms. As a result of P-retention reaction in Egyptian soils, total-P
amounts in such soils become very high, whereas the available amount remains
very low and lies within the deficient range. Available amount of phosphorus is
related to soil characteristics as pH, CaCO3 content, clay mineralogy, sesquioxides,
and calcium concentration in soil solution. Any of these factors or combinations

CHAPTER 7
154
thereof may be linked to transformations of P from available to fixed form,
unavailable to plants. The concentration of total-P in the dry season varied wildly,
which was much higher than those in the wet and normal season (Song et al.,
2013). Phosphorus (P) is a crucial element in the eutrophication of the Great Lakes
(Van Bochove et al., 2011), and high levels of phosphate promote over-production
of algae and aquatic weeds. However that may be, many of us have
misconceptions as to the origin of pollutants phosphates, and many homeowners
unwittingly contribute to the problem. In 1976, the international Pollution from
Land Use Activities Reference Group (PLUARG) estimated that about 24% of all P
entering the entire Great Lakes basin came from the agricultural land on both
Canadian and US sides (PLUARG 1978).
7.1.2 NITRATES
The inorganic forms of soil nitrogen include ammonium (NH4+), nitrate (NO3
-),
nitrous oxide (N2O), nitric oxide (NO) and elemental nitrogen (N2). The last form of
nitrogen is inert except for its utilization by rhizobia and other nitrogen-fixing
microorganisms. From the standpoint of soil fertility the NH4+, NO2
-, and NO3
-
forms are of greatest importance; N2O and NO are also important in a negative
way, for they represent forms of nitrogen that are lost through denitrification. The
ammonium and nitrate forms arise either from the normal aerobic decomposition
of soil organic matter or from the addition to the soil of various commercial
fertilizers, these three forms usually represent from 2 to 5% of the total soil
nitrogen (Tisdale et al., 1985). Soil N occurs as inorganic or organic N, with 95% or
more of total N in surface soils present as organic N, (Tisdale et al., 1990).
According Sutapa et al. (2006) waste amendments increase the total N content of
soil (Muir et al., 1973) found that NO3-N concentration in soil is positively
correlated with the source of N-fertilizer, and livestock density but negatively
correlated with soil pH and depth. (Paramasivam et al., 2000) studied the
transport of NO3-N and NH4-N in fine sand, after heavy addition of liquid fertilizer
containing ammonium nitrate. They reported that both NO3-N and NH4-N are
transported quite rapidly (within 3 days). The concentrations of NO3-N in El-
Fayoum district soils ranged from 0.03 to 40.22 within the surface layer (0-30) and
from 0.01 to 33.2 in subsoil (30-60) with a mean 14.88 mg kg-1
within the top 60
cm (Hamdi, 2007). Acording to Xue Ying et al., 2013 the tributaries of the Taizi
River (China) were seriously contaminated by NH3-N, with 83.8%, 100% and 100%
of the sampling sites exceeding the fifth level in the dry season, wet season and
normal season, respectively.
RESULTS AND DISCUSSION
155
The excess of nitrogen lead to overstimulation of growth of aquatic plants and
algae. These organisms, in turn, can clog water intakes, use up dissolved oxygen
as they decompose, and block light to deeper waters. Also the excess nitrogen in
water can harm persons where, too much nitrogen, as nitrate, in drinking water
can be harmful to young infants or young cattle. Excessive nitrate can result in
restriction of oxygen transport in the bloodstream. Infants under the age of 4
months lack the enzyme necessary to correct this condition "blue baby
syndrome". In parts of Eastern Europe where groundwater is contaminated with
50-100 ppm of nitrate, pregnant women and children under 1 year of age are
supplied with bottled water (USGS, 2014)6.
Nitrate contamination is one of the most problems that affect Spain where more
than 50% of the Spanish population lives in areas whose rivers are polluted by
nitrates. This compound in water cause problems in the digestive system and in
the long term, could lead to increased risk of cancer in these organs. Over ten
million of Spanish persons are exposed to high concentrations of nitrates,
considering that, in cities such as Madrid, much of the water comes from aquifers
and, if they are close to highly fertilized agricultural areas, the presence of nitrates
is a threat almost certain(FVS, 2011)7.
7.1.3 HEAVY METALS AND PESTICIDES
“Heavy metals” designates not only heavy metals, but also a group of metal and
metalloid elements that show similar behaviors in the soil system and trophic
chains. Originally, only some metals denser than iron (Cd, Hg and Pb) were
included in this definition, but, currently, many elements are considered heavy
metals, although the term is not fully accepted by IUPAC, and some alternative
names (e.g., toxic metal) have been suggested, for which there is no consensus.
However, elements that may represent a serious environmental problem
(including some light metals as Be or Al) are commonly referred to as "heavy
metals". Heavy metal contamination is an important problem, causing serious
alterations to the environment and adversely affecting human health (Souza etal.,
6 http://water.usgs.gov/edu/nitrogen.html
7 https://www.vidasostenible.org

CHAPTER 7
156
2014). Heavy metals have long been a component of some agricultural pesticides
that are sprayed on croplands and eventually end up in rivers, lakes and coastal
waters. They are also found in high concentrations in sewage sludge, some
fertilizers and industrial waste. The macro fauna and microorganisms may absorb
heavy metals from the surrounding water or from their food. When absorbed,
heavy metals tend to accumulate in certain tissues and organs, rather than being
uniformly distributed in the body, causing numerous harmful effects on
organisms. Heavy metals often accumulate in the nervous system and brain,
causing lesions, behavioral disturbances and diverse neurological problems. Heavy
metals may also impair growth, cause malformations of the body, damage organs,
or disrupt the immune system. Due to limitations in the allowed amounts of water
from the Nile, vast areas of agricultural lands in El-Fayoum Province are irrigated
with water from mixing stations that mix fresh Nile water and old drainage water
that lead to increasing concentrations of heavy metals in soil and water.
Glenn et al. (1995) studied how the amount of sludge applied to soil influences
the composition of the soil solution. Because the movement of heavy metals
within soils is mainly in the solution phase, chemical factors that control the
distribution of metals between the solid and solution phase influence the mobility
of heavy metals. Some of the soil chemical reactions controlling mobility of heavy
metals and phosphorus are in fact adsorption/ desorption processes. Determining
the metal and phosphorus sorption properties of soil gives a good indication of
the mobility and, therefore, the bioavailability of these elements. Hence, an
understanding of sorption properties is essential when determining loading rates
of sludge-borne heavy metals and phosphorus to soils that will have minimal
impact on the environment.
The concentrations of heavy metals, nitrate and total soluble salt in such mixed
water depends mainly on the mixing ratio and how well the water is mixed.
Detailed long-term monitoring of the concentrations of heavy metals
concentrations, nitrates and total soluble salts is the only way to distinguish
between non-contaminated, contaminated and polluted soils
Concentrations of total Cd in El-Fayoum District soils greatly exceeded the
maximum permissible limits listed by several developed countries. The
concentrations of total Ni in soils slightly exceeded the maximum critical limits
recommended by developed countries. Although the concentrations of total Pb in
soils all over the area of El-Fayoum District were generally below the maximum
RESULTS AND DISCUSSION
157
permissible limits, there is evidence of Pb concentration increases in few spots
particularly in soil surface near main roads and urban areas (Hamdi, 2007).
Total and DTPA extractable heavy metals indicated that the surface layer (0-30)
cm of El-Fayoum District soils generally contained greater concentrations of both
total and DTPA extractable Cd, Ni and Pb in comparison with those in subsoil (30-
60 cm) with some exceptions in several sites. The concentrations of total Cd, Pb
and Ni in top soils were 2.16, 1.87 and 2.88 times those of the layer (30-60cm)
respectively. Corresponding ratios of DTPA extractable metals were 2.27, 1.4 and
1.74 respectively. This was due to atmospheric depositions, applied commercial
fertilizers (phosphates in particular) pesticides, manures, town refuse and maybe
discharge of domestic sewage (Hamdi, 2007).
7.1.4 CRITICAL THRESHOLD OF SOIL CONTAMINANTS
The concentration of trace elements in the soil is increasingly becoming an issue
of global concern, especially as soils constitute a crucial component of rural and
urban environments, and it can be considered a very important "ecological
crossroad" in the landscape (USDA, 2001). Although some are essential for growth
and reproduction, trace elements are toxic for living organisms at excessive
concentrations. Deficiencies in these essential elements or micronutrients can
lead to disease and even death of organisms. Some essential trace elements are
Co, Cr, Cu, Mn, Mo, Ni, Se, and Zn. Others, as Ag, As, Ba, Cd, Hg, Pb and Sb may
also have negative impacts. The most important heavy metals with regards to
potential hazards and occurrence in contaminated soils are As, Cd, Cr, Hg, Pb, and
Zn (Alloway, 1995).
The accumulation of heavy metals in agricultural soils is of increasing concern due
to the food safety issues and potential health risks as well as its detrimental
effects on soil ecosystems. These metals have peculiar characteristics including:
� Their concentration in soils does not decay with time.
� They can be necessary or beneficial to plants at certain levels, but toxic
when exceeding specific thresholds.
� They are always present at a background level of non-anthropogenic
origin, as their input in soils may be related to weathering of parent rocks
and pedogenesis.
� They often occur as cations which strongly interact with the soil matrix.
Consequently, heavy metals in soils can become mobile as a result of
changing environmental conditions.

CHAPTER 7
158
The major external source of heavy metals in soils is usually pollution, caused by
anthropogenic activities, such as metal mining, smelting, and processing (Rosman
et al., 1993).
In addition to aerial sources of trace pollutants, fertilizers, pesticides, and all
sewage-derived materials contribute to increase the trace element pool in soils.
The mobilization of heavy metals from smelter and mine spoil by transport with
seepage waters or by windblown dust may also be an important source of soil
contamination in some industrial regions. The variability of trace element
concentrations in materials used in agriculture is presented in Table 7-1.
High concentration of trace elements in soils may be derived from various
sources, including anthropogenic pollution, weathering of natural high
background rocks, and metal deposits (Asaah and Abimbola, 2006).
The reference values for heavy metals in soils for agricultural soils, with relation to
the soil vulnerability classes are shown in Table 7-2.
Contamination of soil with heavy metals can occur because of anthropogenic
activities such as manufacturing, mining, smelting procedures, and agriculture, as
well as natural activities (Navarro et al., 2008).
Table 7-1. Main agricultural sources of trace element contamination in soils (ppm DW).
Adapted from Kabata-Pendias (2001).
Element Manure
(ppm)
N- fertilizers
(ppm)
P- fertilizers
(ppm)
Sewage sludge
(ppm)
Pesticides (%)
As 3–25 2–120 2–1200 2–26 22–60
B 0.3–0.6 6 5–115 15–1000 -
Be - - - 4–13 -
Cd 0.3–0.8 0.05–8.5 0.1–170 2–1500 -
Co 0.3–24 5–12 1–12 2–260 -
Cr 5.2–55 3–19 66–245 20–40600 -
Cu 2–60 1–15 1–300 50–3300 12–50
F 7 82–212 8500–38000 2–740 18–45
Hg 0.09–0.2 0.3–3 0.01–1.2 0.1-55 0.8–42
Mo 0.05–3 1–7 0.1–60 1–40 -
Ni 7.8–30 7–38 7–38 16–5300 -
Pb 6.6–15 2–1450 7–225 50–3000 60
Sb - - - - -
Se 2.4 - 0.5-25 2–10 -
Zn 15–250 1–42 50–1450 700–49000 1.3–25

RESULTS AND DISCUSSION
159
Table 7-2. Reference values for heavy metals agricultural soils with relation to the soil
vulnerability classes (V1-V4) (ppm DW). Source: MIMAM (2000).
Element V1 V2 V3 V4
As 35 30 25 20
Cd 3 1.5 1 0.5
Co 50 40 30 20
Cr 250 200 125 70
Cu 140 100 50 20
Hg 1.5 1 0.5 0.4
Mo 5 10 15 30
Ni 85 65 45 25
Pb 300 100 70 50
Zn 300 200 150 70
Table 7-3. Maximum admissible concentrations (MAC) of trace elements in agricultural
soils proposed or given in the directives in various countries. and year (ppm DW).
Source: Adapted from Kabata-Pendias (2001) and MIMAM (2000).
Element Spain
2000
Austria
1977
Poland
1993
Russia
1986
UK
1987
Germany
1992
EU
1986
US
1993
As - 50 30 2 10 - - -
B - 100 - - - - - -
Be - 10 10 - - - - -
Cd 1-3 5 1-3 - 3-15 1.5 1-3 20
Co - 50 50 - - - - -
Cr - 100 50-80 0.05 - 100 50-150 1500
Cu 50-220 100 30-70 23 50 60 50-140 750
F 500 - - - - - -
Hg 1-1.5 5 5 2.1 - 1 1-1.5 8
Mo 10 10 - - - - -
Ni 30-112 100 30-75 35 20 50 30-75 210
Pb 50-300 100 70-150 20 500-2000 100 50-300 150
Sb - - 10 - - - - -
Se - 10 10 - - - - -
V - - 150 150 - - - -
Zn 150-450 300 100-300 110 130 200 150-300 1400
Kabata-Pendias (2001), reported that long-term use of inorganic phosphate
fertilizers adds substantially to the natural levels of Cd in soils, while other

CHAPTER 7
160
elements such as As, Cr and Pb do not increase significantly. Effects of sewage
sludge applications on soil composition are especially of great environmental
concern and have been the subject of many studies and much legislation. Advisory
standards and guidelines for safe addition of trace elements in sewage sludge to
land is still in the stages of experiment however, several authors have suggested
threshold values for the maximum admissible concentration of trace elements in
soils for specific countries (Table 7-3).
7.2 SOIL POLLUTION RISK IN ANDALUSIA UNDER CLIMATE CHANGE SCENARIOS
7.2.1 PHOSPHORUS CONTAMINATION RISK
Results show, there are small differences among contamination vulnerabilities
classes of phosphorus under future hypothetical climatic scenarios (Table 7-4). A
positive effect of climate change is observed in the soil type JA06-Typic
Haploxerepts, where the attainable risk varied from V4rl subclass in the current
scenario to be V3r subclass in the future climate scenarios. Net positive effects of
climate change with respect to P were also observed in MA04-Typic Haploxerolls,
SE02-Typic Rhodoxeralfs, SE09-Typic Xerofluvents and SE05-Typic Fluvaquents. In
general, the total area that has a positive effect represents about 7.0% of the
studied area.
Table 7-4. Spatial distribution (area, km2 and %) of vulnerability classes (V1, none; V2,
low; V3, moderate; V4, high; V5, extreme) by phosphorus contamination risk under
current and future climate scenarios. The number of limitation factors is shown between
parentheses.
Land
vulnerability
classes
1960-2000 2040 2070 2100
km2 %
km
2 %
km
2 %
km
2 %
V1 13650 15.6 14648 16.7 14648 16.7 14648 16.7
V2 13857 15.8 11955 13.6 11955 13.6 11955 13.6
V3 2157 2.5 0 0.0 0 0.0 0 0.0
V3(1) 21280 24.3 26211 29.9 26211 29.9 26211 29.9
V4 18834 21.5 19963 22.8 19963 22.8 19963 22.8
V4(1) 16489 18.8 14823 16.9 14823 16.9 14823 16.9
V4(2) 1333 1.5 0 0.0 0 0.0 0 0.0

RESULTS AND DISCUSSION
161
Figure 7-1. Attainable and actual phosphorus contamination vulnerability under current
and future climate scenarios. Vulnerability class: V1, None; V2, Low; V3, Moderate; V4,
High; 5,Extreme. Limitation factors: r=Surface Run-off; l=Leaching Degree.
THXV
LHXI
THXU
THXI
THXI CHXI
LHXI
LHEM
THXA
THXA
TXTE
TRXA
TXTE
THXV
CHXV
TXTE
TXTE
FDUI
TPXA
THXM
THXI
THXV
THXV
VPXA
CHXI
AXFE
THXI
TDUI
CHXI
EHXV
VHAR
LXTE
THXV
XHCR
LRXA
TXTE
TFAE
LHXI
TXFE
THXV
TRXA
THXI
UHUM
TXFE
TFAE
TRXA
TXTE
LHXI
THXA
APXA
TXFE
HUAE
TXTE
LHEM
EHXV
AHXA
TRXA
EHXM
CRXA
CRXA
CRXA
TFAE
TXFE
CHXA
030
60
90
120
15
km
±
Portugal
Extremadura
Castilla-La Mancha
Murcia
Andalusia
Current climate scenario (Attainable risk)
Vulnerability classes (Pantanal model):
V1
V2
V3
V3r
V4
V4r
V4rl
THXV
LHXI
THXU
THXI
THXI CHXI
LHXI
LHEM
THXA
THXA
TXTE
TRXA
TXTE
THXV
CHXV
TXTE
TXTE
FDUI
TPXA
THXM
THXI
THXV
THXV
VPXA
CHXI
AXFE
THXI
TDUI
CHXI
EHXV
VHAR
LXTE
THXV
XHCR
LRXA
TXTE
TFAE
LHXI
TXFE
THXV
TRXA
THXI
UHUM
TXFE
TFAE
TRXA
TXTE
LHXI
THXA
APXA
TXFE
HUAE
TXTE
LHEM
EHXV
AHXA
TRXA
EHXM
CRXA
CRXA
CRXA
TFAE
TXFE
CHXA
030
60
90
120
15
km
±
Portugal
Extremadura
Castilla-La Mancha
Murcia
AndalusiaClimate scenario 2040, 2070 and 2100 (Attainble risk)
Vulnerability classes (Pantanal model):
V1
V2
V3r
V4
V4r
Natural regions with negative climate change impact
Natural regions with positive climate change impact
THXV
LHXI
THXU
THXI
THXI CHXI
LHXI
LHEM
THXA
THXA
TXTE
TRXA
TXTE
THXV
CHXV
TXTE
TXTE
FDUI
TPXA
THXM
THXI
THXV
THXV
VPXA
CHXI
AXFE
THXI
TDUI
CHXI
EHXV
VHAR
LXTE
THXV
XHCR
LRXA
TXTE
TFAE
LHXI
TXFE
THXV
TRXA
THXI
UHUM
TXFE
TFAE
TRXA
TXTE
LHXI
THXA
APXA
TXFE
HUAE
TXTE
LHEM
EHXV
AHXA
TRXA
EHXM
CRXA
CRXA
CRXA
TFAE
TXFE
CHXA
030
60
90
120
15
km
1:1,400,000
±
Portugal
Extremadura
Castilla-La Mancha
Murcia
Andalusia
Climate scenario 2040, 2070 and 2100 (Actual risk)
Vulnerability classes (Pantanal model):
V3-/i
V4-/i
V5-/i
V5r/i
Natural regions with positive climate change impact
Natural regions with negative climate change impact
THXV
LHXI
THXU
THXI
THXI CHXI
LHXI
LHEM
THXA
THXA
TXTE
TRXA
TXTE
THXV
CHXV
TXTE
TXTE
FDUI
TPXA
THXM
THXI
THXV
THXV
VPXA
CHXI
AXFE
THXI
TDUI
CHXI
EHXV
VHAR
LXTE
THXV
XHCR
LRXA
TXTE
TFAE
LHXI
TXFE
THXV
TRXA
THXI
UHUM
TXFE
TFAE
TRXA
TXTE
LHXI
THXA
APXA
TXFE
HUAE
TXTE
LHEM
EHXV
AHXA
TRXA
EHXM
CRXA
CRXA
CRXA
TFAE
TXFE
CHXA
030
60
90
120
15
km
±
Portugal
Extremadura
Castilla-La Mancha
Murcia
Andalusia
Current climate scenario (Actual risk)
Vulnerability classes (Pantanal model):
V3-/i
V4-/i
V5-/i
V5r/i
V5rl/i
CHAPTER 7
162
On the other hand, negative impacts are expected under the projected climate
change scenarios, especially on JA08-Lithic Haprendolls and HU02-Lithic
Xerorthents (Figure 7-1). According to this, 3.5% of the study area shows a
negative impact, where the actual vulnerability class under future climate
scenarios is V5-/i instead of V4-/I under current climate conditions (Figure 7-1).
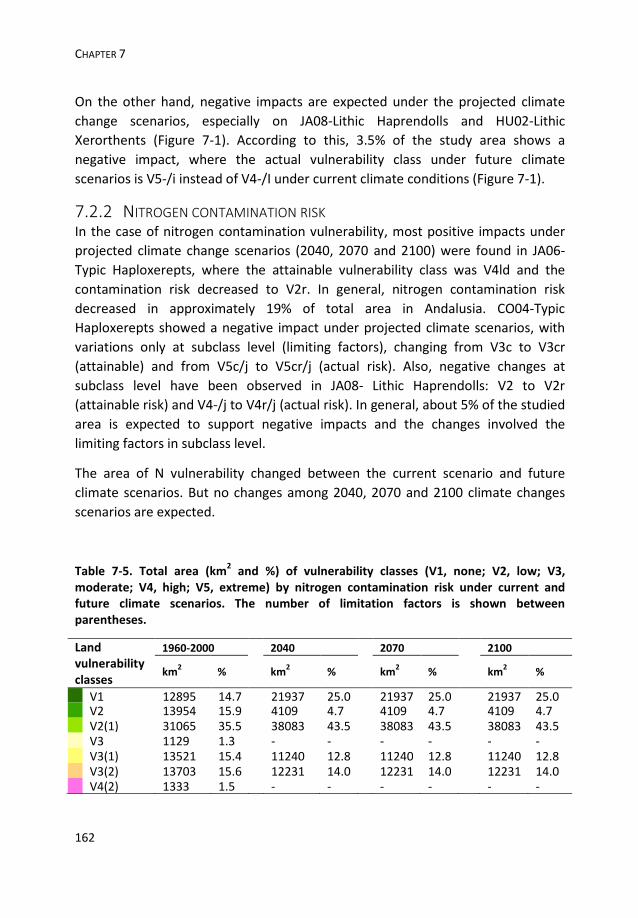
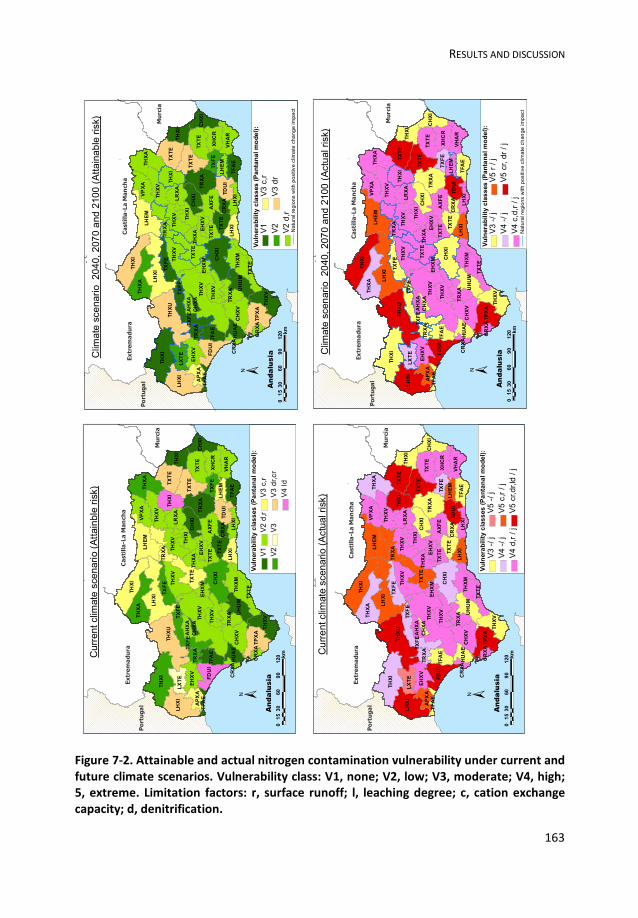
7.2.2 NITROGEN CONTAMINATION RISK
In the case of nitrogen contamination vulnerability, most positive impacts under
projected climate change scenarios (2040, 2070 and 2100) were found in JA06-
Typic Haploxerepts, where the attainable vulnerability class was V4ld and the
contamination risk decreased to V2r. In general, nitrogen contamination risk
decreased in approximately 19% of total area in Andalusia. CO04-Typic
Haploxerepts showed a negative impact under projected climate scenarios, with
variations only at subclass level (limiting factors), changing from V3c to V3cr
(attainable) and from V5c/j to V5cr/j (actual risk). Also, negative changes at
subclass level have been observed in JA08- Lithic Haprendolls: V2 to V2r
(attainable risk) and V4-/j to V4r/j (actual risk). In general, about 5% of the studied
area is expected to support negative impacts and the changes involved the
limiting factors in subclass level.
The area of N vulnerability changed between the current scenario and future
climate scenarios. But no changes among 2040, 2070 and 2100 climate changes
scenarios are expected.
Table 7-5. Total area (km2 and %) of vulnerability classes (V1, none; V2, low; V3,
moderate; V4, high; V5, extreme) by nitrogen contamination risk under current and
future climate scenarios. The number of limitation factors is shown between
parentheses.
Land
vulnerability
classes
1960-2000 2040 2070 2100
km2 %
km
2 %
km
2 % km
2 %
V1 12895 14.7 21937 25.0 21937 25.0 21937 25.0 V2 13954 15.9 4109 4.7 4109 4.7 4109 4.7
V2(1) 31065 35.5 38083 43.5 38083 43.5 38083 43.5
V3 1129 1.3 - - - - - -
V3(1) 13521 15.4 11240 12.8 11240 12.8 11240 12.8
V3(2) 13703 15.6 12231 14.0 12231 14.0 12231 14.0
V4(2) 1333 1.5 - - - - - -
RESULTS AND DISCUSSION
163
Figure 7-2. Attainable and actual nitrogen contamination vulnerability under current and
future climate scenarios. Vulnerability class: V1, none; V2, low; V3, moderate; V4, high;
5, extreme. Limitation factors: r, surface runoff; l, leaching degree; c, cation exchange
capacity; d, denitrification.
THXV
LHXI
THXU
THXI
THXI CHXI
LHXI
LHEM
THXA
THXA
TXTE
TRXA
TXTE
THXV
CHXV
TXTE
TXTE
FDUI
TPXA
THXM
THXI
THXV
THXV
VPXA
CHXI
AXFE
THXI
TDUI
CHXI
EHXV
VHAR
LXTE
THXV
XHCR
LRXA
TXTE
TFAE
LHXI
TXFE
THXV
TRXA
THXI
UHUM
TXFE
TFAE
TRXA
TXTE
LHXI
THXA
APXA
TXFE
HUAE
TXTE
LHEM
EHXV
AHXA
TRXA
EHXM
CRXA
CRXA
CRXA
TFAE
TXFE
CHXA
030
60
90
120
15
km
1:1,400,000
±
Portugal
Extremadura
Castilla-La Mancha
Murcia
Andalusia
Current climate scenario (Attainble risk)
Vulnerability classes (Pantanal model):
V1
V2
V2 d,r
V3
V3 c,r
V3 dr,cr
V4 ld
THXV
LHXI
THXU
THXI
THXI CHXI
LHXI
LHEM
THXA
THXA
TXTE
TRXA
TXTE
THXV
CHXV
TXTE
TXTE
FDUI
TPXA
THXM
THXI
THXV
THXV
VPXA
CHXI
AXFE
THXI
TDUI
CHXI
EHXV
VHAR
LXTE
THXV
XHCR
LRXA
TXTE
TFAE
LHXI
TXFE
THXV
TRXA
THXI
UHUM
TXFE
TFAE
TRXA
TXTE
LHXI
THXA
APXA
TXFE
HUAE
TXTE
LHEM
EHXV
AHXA
TRXA
EHXM
CRXA
CRXA
CRXA
TFAE
TXFE
CHXA
030
60
90
120
15
km
±
Portugal
Extremadura
Castilla-La Mancha
Murcia
AndalusiaClimate scenario 2040, 2070 and 2100 (Attainable risk)
Vulnerability classes (Pantanal model):
V1
V2
V2 d,r
V3 c,r
V3 dr
Natural regions with positive climate change impact
THXV
LHXI
THXU
THXI
THXI CHXI
LHXI
LHEM
THXA
THXA
TXTE
TRXA
TXTE
THXV
CHXV
TXTE
TXTE
FDUI
TPXA
THXM
THXI
THXV
THXV
VPXA
CHXI
AXFE
THXI
TDUI
CHXI
EHXV
VHAR
LXTE
THXV
XHCR
LRXA
TXTE
TFAE
LHXI
TXFE
THXV
TRXA
THXI
UHUM
TXFE
TFAE
TRXA
TXTE
LHXI
THXA
APXA
TXFE
HUAE
TXTE
LHEM
EHXV
AHXA
TRXA
EHXM
CRXA
CRXA
CRXA
TFAE
TXFE
CHXA
030
60
90
120
15
km
1:1,400,000
±
Portugal
Extremadura
Castilla-La Mancha
Murcia
Andalusia
Current climate scenario (Actual risk)
Vulnerability classes (Pantanal model):
V3 -/ j
V4 -/ j
V4 d,r / j
V5 -/ j
V5 c,r / j
V5 cr,dr,ld / j
THXV
LHXI
THXU
THXI
THXI CHXI
LHXI
LHEM
THXA
THXA
TXTE
TRXA
TXTE
THXV
CHXV
TXTE
TXTE
FDUI
TPXA
THXM
THXI
THXV
THXV
VPXA
CHXI
AXFE
THXI
TDUI
CHXI
EHXV
VHAR
LXTE
THXV
XHCR
LRXA
TXTE
TFAE
LHXI
TXFE
THXV
TRXA
THXI
UHUM
TXFE
TFAE
TRXA
TXTE
LHXI
THXA
APXA
TXFE
HUAE
TXTE
LHEM
EHXV
AHXA
TRXA
EHXM
CRXA
CRXA
CRXA
TFAE
TXFE
CHXA
030
60
90
120
15
km
1:1,400,000
±
Portugal
Extremadura
Castilla-La Mancha
Murcia
AndalusiaClimate scenario 2040, 2070 and 2100 (Actual risk)
Vulnerability classes (Pantanal model):
V3 -/ j
V4 -/ j
V4 c,d,r / j
V5 r / j
V5 cr, dr / j
Natural regions with positive climate change impact

CHAPTER 7
164
7.2.3 HEAVY METAL CONTAMINATION RISK
In the case of study heavy metal contamination vulnerability under the projected
climate change scenarios, about 15% of the studied area will have a positive effect
under different future climate scenarios. High variation between classes is
expected in JA06-Typic Haploxerepts, changing from V4rl to V3r (attainable risk)
and only subclass-level changes from V5rl/e to V5r/e (actual risk) (Figure 7-3).
About 2% of the studied area will have a negative impact, especially on JA08-
Lithic Haprendolls, where attainable risk increased from V2, current, to V3r in the
future climate scenarios, and actual risk increased from V4-/e, current, to V5r/e,
under future projected scenarios, as shown in Figure 7-3.
No variation among the different climate change scenarios (2040, 2070 and 2100)
is expected in spatial and temporal analysis (Figure 7-3 and Table 7-6) and,
generally, the amount of vulnerable areas will decrease under future scenarios in
compassion to the current climate scenario (Table 7-6).
Table 7-6. Total area (km2 and %) of vulnerability classes (V1, none; V2, low; V3,
moderate; V4, high; V5, extreme) by heavy metals contamination risk under current and
future climate scenarios. The number of limitation factors is shown between
parentheses.
Land vulnerability
classes
1960-2000 2040 2070 2100
km2 % km
2 % km
2 % km
2 %
V1 20030 22.9 24559 28.0 24559 28.0 24559 28.0 V2 9441 10.8 4109 4.7 4109 4.7 4109 4.7
V3 1129 1.3 - - - - - -
V3(1) 45108 51.5 54920 62.7 54920 62.7 54920 62.7
V4(1) 6547 7.5 - - - - - -
V4(2) 5345 6.1 4012 4.6 4012 4.6 4012 4.6

RESULTS AND DISCUSSION
165
Figure 7-3. Attainable and actual heavy metals contamination vulnerability under
current and future climate scenarios. Vulnerability class: V1, none; V2, low; V3,
moderate; V4, high; 5, extreme. Limitation factors: r, surface runoff; l, leaching degree;
c, cation exchange capacity; d, denitrification.
THXV
LHXI
THXU
THXI
THXI CHXI
LHXI
LHEM
THXA
THXA
TXTE
TRXA
TXTE
THXV
CHXV
TXTE
TXTE
FDUI
TPXA
THXM
THXI
THXV
THXV
VPXA
CHXI
AXFE
THXI
TDUI
CHXI
EHXV
VHAR
LXTE
THXV
XHCR
LRXA
TXTE
TFAE
LHXI
TXFE
THXV
TRXA
THXI
UHUM
TXFE
TFAE
TRXA
TXTE
LHXI
THXA
APXA
TXFE
HUAE
TXTE
LHEM
EHXV
AHXA
TRXA
EHXM
CRXA
CRXA
CRXA
TFAE
TXFE
CHXA
030
60
90
120
15
km
±
Portugal
Extremadura
Castilla-La Mancha
Murcia
Andalusia
Current climate scenario (Attainable risk)
Vulnerability classes (Pantanal model):
V1
V2
V3
V3 c,r
V4 r
V4 cr, rl
THXV
LHXI
THXU
THXI
THXI CHXI
LHXI
LHEM
THXA
THXA
TXTE
TRXA
TXTE
THXV
CHXV
TXTE
TXTE
FDUI
TPXA
THXM
THXI
THXV
THXV
VPXA
CHXI
AXFE
THXI
TDUI
CHXI
EHXV
VHAR
LXTE
THXV
XHCR
LRXA
TXTE
TFAE
LHXI
TXFE
THXV
TRXA
THXI
UHUM
TXFE
TFAE
TRXA
TXTE
LHXI
THXA
APXA
TXFE
HUAE
TXTE
LHEM
EHXV
AHXA
TRXA
EHXM
CRXA
CRXA
CRXA
TFAE
TXFE
CHXA
030
60
90
120
15
km
±
Portugal
Extremadura
Castilla-La Mancha
Murcia
Andalusia
Current climate scenario (Actual risk)
Vulnerability classes (Pantanal model):
V3 -/ e
V4 -/ e
V5 -/ e
V5 c,d,r / e
V5 cr, rl / e
THXV
LHXI
THXU
THXI
THXI CHXI
LHXI
LHEM
THXA
THXA
TXTE
TRXA
TXTE
THXV
CHXV
TXTE
TXTE
FDUI
TPXA
THXM
THXI
THXV
THXV
VPXA
CHXI
AXFE
THXI
TDUI
CHXI
EHXV
VHAR
LXTE
THXV
XHCR
LRXA
TXTE
TFAE
LHXI
TXFE
THXV
TRXA
THXI
UHUM
TXFE
TFAE
TRXA
TXTE
LHXI
THXA
APXA
TXFE
HUAE
TXTE
LHEM
EHXV
AHXA
TRXA
EHXM
CRXA
CRXA
CRXA
TFAE
TXFE
CHXA
030
60
90
120
15
km
1:1,400,000
±
Portugal
Extremadura
Castilla-La Mancha
Murcia
AndalusiaClimate scenario 2040, 2070 and 2100 (Attainable risk)
Vulnerability classes (Pantanal model):
V1
V2
V3 c, d, r
V4 cr
Natural regions with negative climate change impact
Natural regions with positive climate change impact
THXV
LHXI
THXU
THXI
THXI CHXI
LHXI
LHEM
THXA
THXA
TXTE
TRXA
TXTE
THXV
CHXV
TXTE
TXTE
FDUI
TPXA
THXM
THXI
THXV
THXV
VPXA
CHXI
AXFE
THXI
TDUI
CHXI
EHXV
VHAR
LXTE
THXV
XHCR
LRXA
TXTE
TFAE
LHXI
TXFE
THXV
TRXA
THXI
UHUM
TXFE
TFAE
TRXA
TXTE
LHXI
THXA
APXA
TXFE
HUAE
TXTE
LHEM
EHXV
AHXA
TRXA
EHXM
CRXA
CRXA
CRXA
TFAE
TXFE
CHXA
030
60
90
120
15
km
1:1,400,000
±
Portugal
Extremadura
Castilla-La Mancha
Murcia
Andalusia
Climate scenario 2040, 2070 and 2100 (Actual risk)
Vulnerability classes (Pantanal model):
V3 -/ e
V4 -/ e
V5 c, r, d / e
V5 cr / e
Natural regions with negative climate change impact
Natural regions with positive climate change impact

CHAPTER 7
166
7.2.4 PESTICIDES CONTAMINATION RISK
According to results, contamination risk by pesticides in the studied area is higher
than in the case of phosphorus, nitrogen and heavy metals. Only 9.0% of the study
area shows positive effects under different climate scenarios, while 17.0% of the
studied soils show negative climate change impacts. GR11-Aquic Xerofluvents and
JA01-Typic Rhodoxeralfs show the highest positive changes, with vulnerability
class decreasing under climate change scenarios. In JA01-Aquic Xerofluvents, the
risk class decreased from V4og to V3o (attainable vulnerability) and from V5og/e
to V4o/e (actual vulnerability class) (Figure 7-4).
CA03-Calcic Rhodoxeralfs show the highest negative impacts, with attainable
vulnerability increasing from V2r (current scenario) to V4r (future climate
scenarios). In addition, actual vulnerability increased from V4r/e, current scenario,
to V5r/e under different future scenarios 2040, 2070 and 2100 (Figure 7-4). As
shown in (Table 7-7), vulnerability classes are not expected to vary under the
different climate change scenarios. On the other hand, variations between current
and future scenarios have been observed.
Table 7-7. Total area (km2 and %) of vulnerability classes by pesticide contamination risk
under current and future climate scenarios (V1, none; V2, low; V3, moderate; V4, high;
V5, extreme). The number of limitation factors is shown between parentheses.
Land
vulnerability
classes
1960-2000 2040 2070 2100
km2 %
km
2 %
km
2 %
km2
%
V1 7022 8.0 6773 7.7 6773 7.7 6773 7.7 V2 7465 8.5 7714 8.8 7714 8.8 7714 8.8
V2(1) 2699 3.1 1054 1.2 1054 1.2 1054 1.2
V3(1) 24215 27.6 15460 17.6 15460 17.6 15460 17.6
V3(2) - 0.0 - - - - - -
V3(3) 1666 1.9 - - - - - -
V4 - 0.0 - - - - - -
V4(1) 19450 22.2 26746 30.5 26746 30.5 26746 30.5
V4(2) 15196 17.3 25245 28.8 26384 30.1 26384 30.1
V4(3) 9887 11.3 4608 5.3 3469 4.0 3469 4.0

RESULTS AND DISCUSSION
167
Figure 7-4. Attainable and actual pesticides contamination vulnerability under current
and future climate scenarios. Vulnerability class: V1, none; V2, low; V3, moderate; V4,
high; V5, extreme. Limitation factors: r, surface runoff; l, leaching degree; c, cation
exchange capacity; d, denitrification; o, pesticides sorption; g, biodegradation.
THXV
LHXI
THXU
THXI
THXI CHXI
LHXI
LHEM
THXA
THXA
TXTE
TRXA
TXTE
THXV
CHXV
TXTE
TXTE
FDUI
TPXA
THXM
THXI
THXV
THXV
VPXA
CHXI
AXFE
THXI
TDUI
CHXI
EHXV
VHAR
LXTE
THXV
XHCR
LRXA
TXTE
TFAE
LHXI
TXFE
THXV
TRXA
THXI
UHUM
TXFE
TFAE
TRXA
TXTE
LHXI
THXA
APXA
TXFE
HUAE
TXTE
LHEM
EHXV
AHXA
TRXA
EHXM
CRXA
CRXA
CRXA
TFAE
TXFE
CHXA
030
60
90
120
15
km
±
Portugal
Extremadura
Castilla-La Mancha
Murcia
Andalusia
Current climate scenario (Attainable risk)
Vulnerability classes (Pantanal model):
V1
V2
V2 r
V3 o, r
V3 ogr
V4 r
V4 og, rg, or
V4 ogr
THXV
LHXI
THXU
THXI
THXI CHXI
LHXI
LHEM
THXA
THXA
TXTE
TRXA
TXTE
THXV
CHXV
TXTE
TXTE
FDUI
TPXA
THXM
THXI
THXV
THXV
VPXA
CHXI
AXFE
THXI
TDUI
CHXI
EHXV
VHAR
LXTE
THXV
XHCR
LRXA
TXTE
TFAE
LHXI
TXFE
THXV
TRXA
THXI
UHUM
TXFE
TFAE
TRXA
TXTE
LHXI
THXA
APXA
TXFE
HUAE
TXTE
LHEM
EHXV
AHXA
TRXA
EHXM
CRXA
CRXA
CRXA
TFAE
TXFE
CHXA
030
60
90
120
15
km
±
Portugal
Extremadura
Castilla-La Mancha
Murcia
Andalusia
Climate scenario 2040, 2070 and 2100 (Attainable risk)
Vulnerability classes (Pantanal model):
V1
V2
V2 r
V3 o
V4 r
V4 rg, or
V4 org
Natural regions with negative climate change impact
Natural regions with positive climate change impact
THXV
LHXI
THXU
THXI
THXI CHXI
LHXI
LHEM
THXA
THXA
TXTE
TRXA
TXTE
THXV
CHXV
TXTE
TXTE
FDUI
TPXA
THXM
THXI
THXV
THXV
VPXA
CHXI
AXFE
THXI
TDUI
CHXI
EHXV
VHAR
LXTE
THXV
XHCR
LRXA
TXTE
TFAE
LHXI
TXFE
THXV
TRXA
THXI
UHUM
TXFE
TFAE
TRXA
TXTE
LHXI
THXA
APXA
TXFE
HUAE
TXTE
LHEM
EHXV
AHXA
TRXA
EHXM
CRXA
CRXA
CRXA
TFAE
TXFE
CHXA
030
60
90
120
15
km
±
Portugal
Extremadura
Castilla-La Mancha
Murcia
Andalusia
Current climate scenario (Actual risk)
Vulnerability classes (Pantanal model):
V2 -/ e
V4 -/ e
V4 o, r / e
V4 org / e
V5 r / e
V5 og, or, rg / e
V5 lor, org / e
Pesticides contamination vulnerability (Actual risk)
THXV
LHXI
THXU
THXI
THXI CHXI
LHXI
LHEM
THXA
THXA
TXTE
TRXA
TXTE
THXV
CHXV
TXTE
TXTE
FDUI
TPXA
THXM
THXI
THXV
THXV
VPXA
CHXI
AXFE
THXI
TDUI
CHXI
EHXV
VHAR
LXTE
THXV
XHCR
LRXA
TXTE
TFAE
LHXI
TXFE
THXV
TRXA
THXI
UHUM
TXFE
TFAE
TRXA
TXTE
LHXI
THXA
APXA
TXFE
HUAE
TXTE
LHEM
EHXV
AHXA
TRXA
EHXM
CRXA
CRXA
CRXA
TFAE
TXFE
CHXA
030
60
90
120
15
km
1:1,400,000
±
Portugal
Extremadura
Castilla-La Mancha
Murcia
AndalusiaClimate scenario 2040, 2070 and 2100 (Actual risk)
Vulnerability classes (Pantanal model):
V2 - /e
V4 - /e
V4 o, r /e
V5 r /e
V5 or, rg /e
V5 org /e
Natural regions with positive climate change impact
Natural regions with negative climate change impact

CHAPTER 7
168
Figure 7-5. Total area and vulnerability classes of phosphorus, nitrogen, heavy metals
and pesticides contamination risk in different climate scenarios. Vulnerability class: V1,
none; V2, low; V3, moderate; V4, high; V5, extreme. Limitation factors: I, phosphate; j,
nitrogen.
Figure 7-5 shows the histogram of areas according to different vulnerability
classes of contamination risk by phosphorus, nitrogen, heavy metals and
pesticides under different climate scenarios. Results show that actual
contamination risk is higher than attainable risk, because of the impacts of soil
management practices (which include the addition of nitrogen, phosphorus
fertilizers and pesticides).
7.3 SOIL POLLUTION RISK IN EL-FAYOUM UNDER DIFFERENT MANAGEMENT
SCENARIOS
Pantanal outputs include vulnerability classes (land, management and field
vulnerability) for phosphorus, nitrogen, heavy metals and pesticides for different
soils, types of management and crops, including maize, beans, wheat and
sorghum (Table 7-8). Results show no differences for attainable vulnerability
under different management scenarios of wheat, maize, sorghum and bean,
Actual risk (Erosion)
V1 V2 V3 V4 V5
0
20
40
60
Vulnerability classes
V1 /i V2 /i V3 /i V4 /i V5 /i
0
20
40
60
Attainable risk (Phosphorus)
Actual risk (Phosphorus)
Area (x1000 km2)
V1 V2 V3 V4 V5
0
20
40
60Attainable risk (Nitrogen)
V1 /j V2 /j V3 /j V4 /j V5 /j 0
20
40
60Actual risk (Nitrogen)
Vulnerability classes
Area (x1000 km2)
V1 V2 V3 V4 V5
0
20
40
60Attainable risk (Heavy metals)
V1 /e V2 /e V3 /e V4 /e V5 /e
0
20
40
60Actual risk (Heavy metals)
Area (x1000 km2)
Vulnerability classes
V1 V2 V3 V4 V5
0
20
40
60
V1 /e V2 /e V3 /e V4 /e V5 /e
0
20
40
60
Vulnerability classes
Area (x1000 km2)
Attainable risk (Pesticides)
Actual risk (Pesticides)
Current 2040 2070 2100

RESULTS AND DISCUSSION
169
where the phosphorus vulnerability class was V1 in different soil units: Vertic
Torrifluvents (F-SU1), Typic Haplocalcids (F-SU2), Typic Torrifluvents (F-SU3), Typic
Haplosalids (F-SU5) and V2 in Typic Haplogypsids (F-SU4),Typic torripsamments (F-
SU6). On the other hand, vulnerability varied among the different crop
management, but all soil types showed the same vulnerability class. Attainable
vulnerability for phosphorus, nitrogen and heavy metals varied from V1 to V2 and
varied from V1 to V3 in the case of pesticides.
Management vulnerability was V3-V4 (phosphorus), V2-V4 (nitrogen), V4 (heavy
metals) and V2 (pesticides), under the different soil types and crop managements.
Field vulnerability represents the combination of attainable risk and management
risk and varies depending on soil unit and crop management. Results show that
contamination risk by different agents under maize, beans, wheat and sorghum
cultivations is generally limited by management practices and soil properties.
Table 7-8. Attainable, management and contamination vulnerability risks for wheat,
maize, sorghum and bean crops in El-Fayoum. Vulnerability class: V1, none; V2, low; V3,
moderate; V4, high. Contaminant type: P, phosphorus; N, nitrogen; H, heavy metals; X,
pesticides. Degradation factors: q, heavy metals ; I, phosphate ; j, nitrogen ; o, pesticide
sorption.
Crop Soil profile Attainable vulnerability Managment vulnerability Field vulnerability
P N H X P N H X P N H X
Wheat F-SU1 V1 V1 V1 V2 V3 V3 V4q V2 V2-/- V2-/- V3-/q V2-/-
F-SU2 V1 V1 V1 V2 V3 V3 V4q V2 V2-/- V2-/- V3-/q V2-/-
F-SU3 V1 V1 V1 V1 V3 V3 V4q V2 V2-/- V2-/- V3-/q V1-/-
F-SU4 V2 V1 V1 V3o V3 V3 V4q V2 V4-/- V2-/- V3-/q V3o/-
F-SU5 V1 V1 V1 V1 V3 V3 V4q V2 V2-/- V2-/- V3-/q V1-/-
F-SU6 V2 V2 V2 V3o V3 V3 V4q V2 V4-/- V4-/- V4-/- V3o/-
Maize F-SU1 V1 V1 V1 V2 V4i V4j V4q V2 V3-/i V3-/j V3-/q V2-/-
F-SU2 V1 V1 V1 V2 V4i V4j V4q V2 V3-/i V3-/j V3-/q V2-/-
F-SU3 V1 V1 V1 V1 V4i V4j V4q V2 V3-/i V3-/j V3-/q V1-/-
F-SU4 V2 V1 V1 V3o V4i V4j V4q V2 V4-/i V3-/j V3-/q V3o/-
F-SU5 V1 V1 V1 V1 V4i V4j V4q V2 V3-/i V3-/j V3-/q V1-/-
F-SU6 V2 V2 V2 V3o V4i V4j V4q V2 V4-/i V4-/j V4-/q V3o/-
Sorghum F-SU1 V1 V1 V1 V2 V3 V4j V4q V2 V2-/- V3-/j V3-/q V2-/-
F-SU2 V1 V1 V1 V2 V3 V4j V4q V2 V2-/- V3-/j V3-/q V2-/-
F-SU3 V2 V1 V1 V3o V3 V4j V4q V2 V4-/- V3-/j V3-/q V3o/-
F-SU4 V2 V1 V1 V3o V3 V4j V4q V2 V4-/- V3-/j V3-/q V3o/-
F-SU5 V1 V1 V1 V1 V3 V4j V4q V2 V2-/- V3-/j V3-/q V1-/-
F-SU6 V2 V2 V2 V3o V3 V4j V4q V2 V4-/- V4-/j V4-/q V3o/-
Bean F-SU1 V1 V1 V1 V2 V4i V2 V4q V2 V3-/i V1-/- V3-/q V2-/-
F-SU2 V1 V1 V1 V2 V4i V2 V4q V2 V3-/i V1-/- V3-/q V2-/-
F-SU3 V2 V1 V1 V3o V4i V2 V4q V2 V3-/i V1-/- V3-/q V1-/-
F-SU4 V2 V1 V1 V3o V4i V2 V4q V2 V4-/- V1-/- V3-/q V3o/-
F-SU5 V1 V1 V1 V1 V4i V2 V4q V2 V3-/i V1-/- V3-/q V1-/-
F-SU6 V2 V2 V2 V3o V4i V2 V4q V2 V4-/i V2-/- V4-/q V3o/-

CHAPTER 7
170
Table 7-9 shows the area corresponding to each vulnerability class (V1, V2, V3 and
V4), based on the evaluation of contamination risk of 46 representative soil
profiles from SDBm-El-Fayoum. The assessment was carried out for phosphorus,
nitrogen, heavy metals and pesticides under different management types of four
major crops (wheat, maize, sorghum and bean).
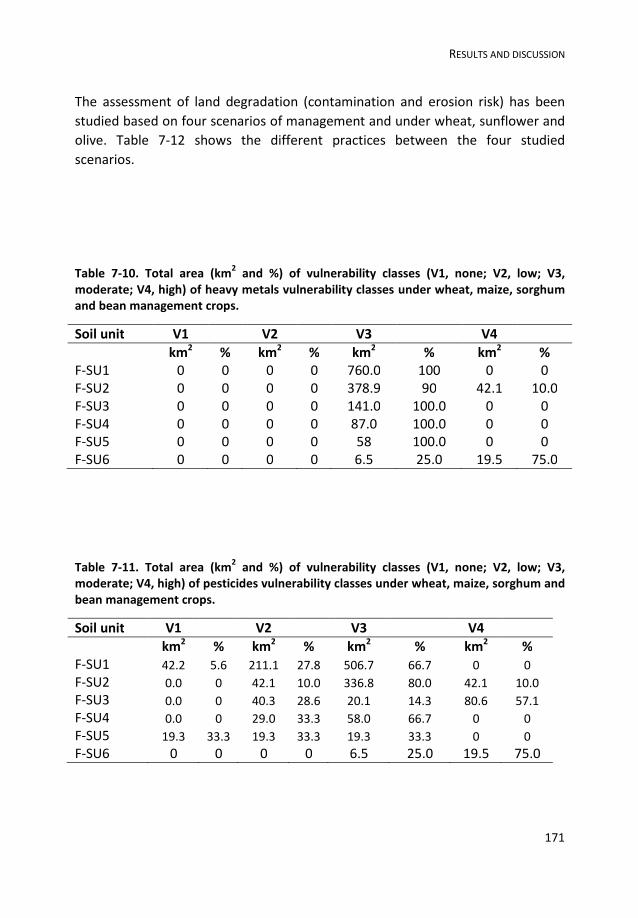
Phosphorus and nitrogen vulnerability classes under the different studied crops
and managements have the same distribution areas (Table 7-9). Table 7-10 shows
no variation among the distribution of vulnerability classes by heavy metals under
the different crops and types of management. Similarly, Table 7-11 shows no
variation among the distributions of vulnerability classes for pesticides under the
different crops and managements.
Table 7-9. Total area (km2 and %) of vulnerability classes (V1, none; V2, low; V3,
moderate; V4, high) of phosphorus and nitrogen under wheat, maize, sorghum and bean
crops.
Soil unit
Vulnerability classes
V1-none
V2-low
V3-moderate
V4-high
km2 %
km
2 %
km
2 %
km
2 %
Wheat
F-SU1 0 0
506.7 66.7
0 0
253.3 33.3 F-SU2 42.1 10
0 0
0 0
378.9 90
F-SU3 0 0
0 0
80.6 57.1
60.4 42.9 F-SU4 0 0
29 33.3
0 0
58 66.6
F-SU5 0 0
58 100
0 0
0 0 F-SU6 0 0
0 0
0 0
26 100
Maize
F-SU1 0 0
0 0
506.7 66.7
253.3 33.3 F-SU2 42.1 10
0 0
0 0
378.9 90
F-SU3 0 0
0 0
80.6 57.1
60.4 42.9 F-SU4 0 0
0 0
29 33.3
58 66.6
F-SU5 0 0
0 0
58 100
0 0 F-SU6 0 0
0 0
0 0
26 100
Sorghum
F-SU1 0 0
506.7 66.7
0 0
253.3 33.3 F-SU2 42.1 10
0 0
0 0
378.9 90
F-SU3 0 0
80.6 57.1
0 0
60.4 42.9 F-SU4 0 0
29 33.3
0 0
58 66.6
F-SU5 0 0
58 100
0 0
0 0 F-SU6 0 0
0 0
0 0
26 100
Bean
F-SU1 0 0
0 0
464.4 61.1
295.6 38.9 F-SU2 42.1 10
0 0
0 0
378.9 90
F-SU3 0 0
0 0
80.6 57.1
60.4 42.9 F-SU4 0 0
0 0
29 33.3
58 66.6
F-SU5 0 0
0 0
58 100
0 0 F-SU6 0 0
0 0
0 0
26 100
RESULTS AND DISCUSSION
171
The assessment of land degradation (contamination and erosion risk) has been
studied based on four scenarios of management and under wheat, sunflower and
olive. Table 7-12 shows the different practices between the four studied
scenarios.
Table 7-10. Total area (km2 and %) of vulnerability classes (V1, none; V2, low; V3,
moderate; V4, high) of heavy metals vulnerability classes under wheat, maize, sorghum
and bean management crops.
Soil unit V1 V2 V3 V4
km2 % km
2 % km
2 % km
2 %
F-SU1 0 0 0 0 760.0 100 0 0
F-SU2 0 0 0 0 378.9 90 42.1 10.0
F-SU3 0 0 0 0 141.0 100.0 0 0
F-SU4 0 0 0 0 87.0 100.0 0 0
F-SU5 0 0 0 0 58 100.0 0 0
F-SU6 0 0 0 0 6.5 25.0 19.5 75.0
Table 7-11. Total area (km2 and %) of vulnerability classes (V1, none; V2, low; V3,
moderate; V4, high) of pesticides vulnerability classes under wheat, maize, sorghum and
bean management crops.
Soil unit V1 V2 V3 V4
km2 % km
2 % km
2 % km
2 %
F-SU1 42.2 5.6 211.1 27.8 506.7 66.7 0 0
F-SU2 0.0 0 42.1 10.0 336.8 80.0 42.1 10.0
F-SU3 0.0 0 40.3 28.6 20.1 14.3 80.6 57.1
F-SU4 0.0 0 29.0 33.3 58.0 66.7 0 0
F-SU5 19.3 33.3 19.3 33.3 19.3 33.3 0 0
F-SU6 0 0 0 0 6.5 25.0 19.5 75.0

CHAPTER 7
172
Table 7-12. The different practices of the principles four management scenarios.
Practices Scenario 1 Scenario 2 Scenario 3 Scenario 4
Land use type None Arable, irrigated Arable, irrigated Arable, irrigated
Irrigation water
(mm)
11 714 1142 1427
Crop rotation Nill, grazing Winter summer,
crop
combination
Winter summer,
crop
combination
Winter summer,
crop
combination
Land use on slopes Yes Yes Yes Yes
Addition of P-
fertilizer
Nothing Controlled Excessive Excessive
Addition of N-
fertilizer
Nothing Controlled Excessive Excessive
Addition of animal
manure
No Yes Yes Yes
Addition of
industrial / urban
waste
No No Yes Yes
Season of
fertilization
Autumn/win
ter
Autumn/winter Autumn/winter Autumn/winter
Use of pesticides No Yes Yes Yes
Persistence of
pesticides
Nil Low, < 6 months Medium, 6-12
months
High, ˃ 12
months
Toxicity (LD50,
ppm)
Nil Low, >1001 Medium, 200-
1000
High,<200
Methods of
application of
pesticides
Nil Foliage Foliage Direct
Artificial drainage No Yes Yes Yes
Artificial ground
water
No No Yes Yes
Treatment of
residues
Nil, grazing Mulching,
ploughed in
Mulching,
ploughed in
Burning
Tillage Zero tillage Minimum tillage Mulch tillage Conventional
tillage
Depth of tillage Without
superficial
tillage
With superficial
tillage
With superficial
tillage
With superficial
tillage
Tillage method Nil Use of dick
cultivator
Use of dick
cultivator
Use of dick
cultivator
Row spacing (m) Nil 0.1 0.1 0.1
Soil conservation
techniques (water
erosion)
Nil Terracing Terracing Terracing
Soil conservation
techniques (wind
erosion)
Nil Nil Nil Nil

RESULTS AND DISCUSSION
173
Table 7-13. Vulnerability classes of ccontamination under different management
scenarios for wheat, sunflower and olive in El-Fayoum. Contaminant type: P,
phosphorus; N, nitrogen; H, heavy metals; X, pesticides. Vulnerability classes: V1, none;
V2, low; V3, moderate; V4, high. Degradation factors: q, heavy metals; I, phosphate; j,
nitrogen; o, pesticide sorption.
Management
scenario
Wheat Sunflower Olive
P N H X P N H X P N H X
Scenario 1 V4i V4j V4q V4t V4i V4j V4q V4t V4e V4j V4q V4t
Scenario 2 V4i V2 V4q V3 V4i V4j V4q V2 V3 V4j V4q V3
Scenario 3 V3 V2 V4q V2 V3 V2 V4q V2 V2 V2 V2 V1
Scenario 4 V2e V2e V2e V2e V2e V2e V2e V2e V2e V2e V2e V2e
Table 7-13, shows that class of management vulnerability for wheat, sunflower
and olive crops decreases with water irrigation. When vulnerability to
contamination by nitrogen, heavy metals and pesticides, and to water and wind
erosion were considered, highest risks were observed under Scenario 1 (100%
water irrigation), while lowest risks were observed under Scenario 4 (no irrigation
and no cultivation, rainfed conditions). The vulnerability was analysed.
Attainable vulnerability by nitrogen and heavy metals show the same risk under
different crops and scenarios for each soil profile, varying between V1 (F-SU1, F-
SU2, F-SU3 and F-SU4) and V2 (F-SU6) (Table 7-14 to Table 7-16). Vulnerability to
pesticides was V1 (F-SU3 and F-SU5), V2 (F-SU1 and F-SU2) and V3 (F-SU4 and F-
SU6). Typic Haplogypsids (F-SU4) and Typic torripsamments (F-SU6) show the high
soil degradation risk (contamination and erosion). Under wheat (Table 7-14),
sunflower (Table 7-15) and olive (Table 7-16), the highest vulnerability classes for
contamination by phosphorus, nitrogen, heavy metals and pesticides and water
erosion were observed under scenario 1. These results are in agreement with
Abdel Kawy and Belal (2012), who stated that, under current irrigation policies,
heavy metals accumulation in the surface layer of cropped soils will go on
increasing due to the use of drainage water for irrigation. The lower vulnerability
classes were observed under scenario 4. In opposite, a high vulnerability for wind
erosion was observed under scenario 4.
These results are in agreement with Ali and Abdel Kawy (2013), who have
reported intense chemical degradation in EL-Fayoum soils. They suggested that
degradation risk and the actual hazard indicate that the human activities are not
CHAPTER 7
174
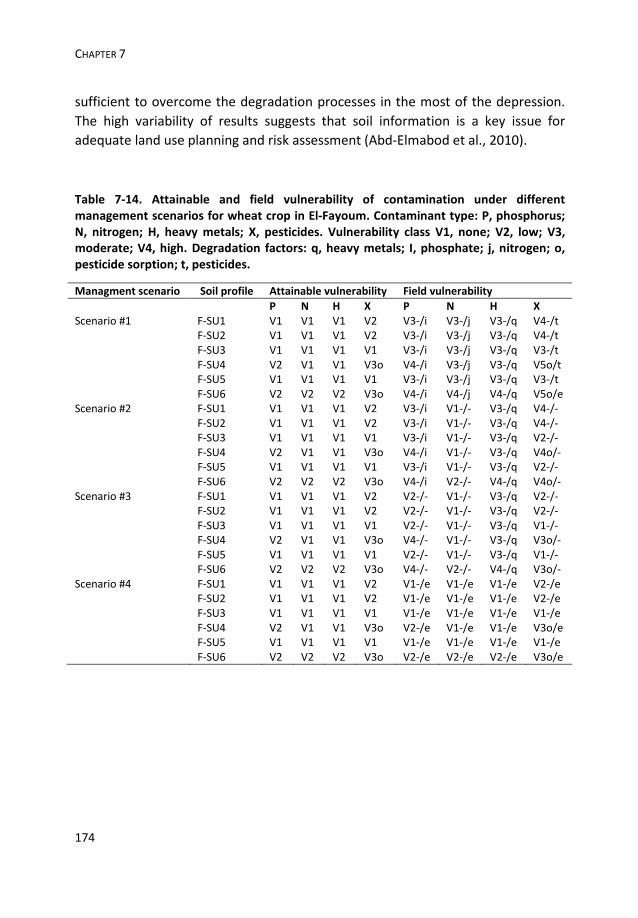
sufficient to overcome the degradation processes in the most of the depression.
The high variability of results suggests that soil information is a key issue for
adequate land use planning and risk assessment (Abd-Elmabod et al., 2010).
Table 7-14. Attainable and field vulnerability of contamination under different
management scenarios for wheat crop in El-Fayoum. Contaminant type: P, phosphorus;
N, nitrogen; H, heavy metals; X, pesticides. Vulnerability class V1, none; V2, low; V3,
moderate; V4, high. Degradation factors: q, heavy metals; I, phosphate; j, nitrogen; o,
pesticide sorption; t, pesticides.
Managment scenario Soil profile Attainable vulnerability Field vulnerability
P N H X P N H X
Scenario #1 F-SU1 V1 V1 V1 V2 V3-/i V3-/j V3-/q V4-/t
F-SU2 V1 V1 V1 V2 V3-/i V3-/j V3-/q V4-/t
F-SU3 V1 V1 V1 V1 V3-/i V3-/j V3-/q V3-/t
F-SU4 V2 V1 V1 V3o V4-/i V3-/j V3-/q V5o/t
F-SU5 V1 V1 V1 V1 V3-/i V3-/j V3-/q V3-/t
F-SU6 V2 V2 V2 V3o V4-/i V4-/j V4-/q V5o/e
Scenario #2 F-SU1 V1 V1 V1 V2 V3-/i V1-/- V3-/q V4-/-
F-SU2 V1 V1 V1 V2 V3-/i V1-/- V3-/q V4-/-
F-SU3 V1 V1 V1 V1 V3-/i V1-/- V3-/q V2-/-
F-SU4 V2 V1 V1 V3o V4-/i V1-/- V3-/q V4o/-
F-SU5 V1 V1 V1 V1 V3-/i V1-/- V3-/q V2-/-
F-SU6 V2 V2 V2 V3o V4-/i V2-/- V4-/q V4o/-
Scenario #3 F-SU1 V1 V1 V1 V2 V2-/- V1-/- V3-/q V2-/-
F-SU2 V1 V1 V1 V2 V2-/- V1-/- V3-/q V2-/-
F-SU3 V1 V1 V1 V1 V2-/- V1-/- V3-/q V1-/-
F-SU4 V2 V1 V1 V3o V4-/- V1-/- V3-/q V3o/-
F-SU5 V1 V1 V1 V1 V2-/- V1-/- V3-/q V1-/-
F-SU6 V2 V2 V2 V3o V4-/- V2-/- V4-/q V3o/-
Scenario #4 F-SU1 V1 V1 V1 V2 V1-/e V1-/e V1-/e V2-/e
F-SU2 V1 V1 V1 V2 V1-/e V1-/e V1-/e V2-/e
F-SU3 V1 V1 V1 V1 V1-/e V1-/e V1-/e V1-/e
F-SU4 V2 V1 V1 V3o V2-/e V1-/e V1-/e V3o/e
F-SU5 V1 V1 V1 V1 V1-/e V1-/e V1-/e V1-/e
F-SU6 V2 V2 V2 V3o V2-/e V2-/e V2-/e V3o/e

RESULTS AND DISCUSSION
175
Table 7-15. Attainable and field vulnerability of contamination under different
management scenarios for sunflower crop in El-Fayoum. Abbreviations as in Table 7-14
(page 174).
Managment scenario Soil profile Attainable
vulnerability
Field vulnerability
P N H X P N H X
Scenario #1 F-SU1 V1 V1 V1 V2 V3-/i V3-/j V3-/q V4-/t
F-SU2 V1 V1 V1 V2 V3-/i V3-/j V3-/q V4-/t
F-SU3 V1 V1 V1 V1 V3-/i V3-/j V3-/q V3-/t
F-SU4 V2 V1 V1 V3o V4-/i V3-/j V3-/q V5o/t
F-SU5 V1 V1 V1 V1 V3-/i V3-/j V3-/q V3-/t
F-SU6 V2 V2 V2 V3o V4-/i V4-/j V4-/q V5o/t
Scenario #2 F-SU1 V1 V1 V1 V2 V3-/i V3-/j V3-/q V2-/-
F-SU2 V1 V1 V1 V2 V3-/i V3-/j V3-/q V2-/-
F-SU3 V1 V1 V1 V1 V3-/i V3-/j V3-/q V1-/-
F-SU4 V2 V1 V1 V3o V4-/i V3-/j V3-/q V3o/-
F-SU5 V1 V1 V1 V1 V3-/i V3-/j V3-/q V1-/-
F-SU6 V2 V2 V2 V3o V4-/i V4-/j V4-/q V3o/-
Scenario #3 F-SU1 V1 V1 V1 V2 V2-/- V1-/- V3-/q V2-/-
F-SU2 V1 V1 V1 V2 V2-/- V1-/- V3-/q V2-/-
F-SU3 V1 V1 V1 V1 V2-/- V1-/- V3-/q V1-/-
F-SU4 V2 V1 V1 V3o V4-/- V1-/- V3-/q V3o/-
F-SU5 V1 V1 V1 V1 V2-/- V1-/- V3-/q V1-/-
F-SU6 V2 V2 V2 V3o V4-/- V2-/- V4-/q V3o/-
Scenario #4 F-SU1 V1 V1 V1 V2 V1-/e V1-/e V1-/e V2-/e
F-SU2 V1 V1 V1 V2 V1-/e V1-/e V1-/e V2-/e
F-SU3 V1 V1 V1 V1 V1-/e V1-/e V1-/e V1-/e
F-SU4 V2 V1 V1 V3o V2-/e V1-/e V1-/e V3o/e
F-SU5 V1 V1 V1 V1 V1-/e V1-/e V1-/e V1-/e
F-SU6 V2 V2 V2 V3o V2-/e V2-/e V2-/e V3o/e
CHAPTER 7
176
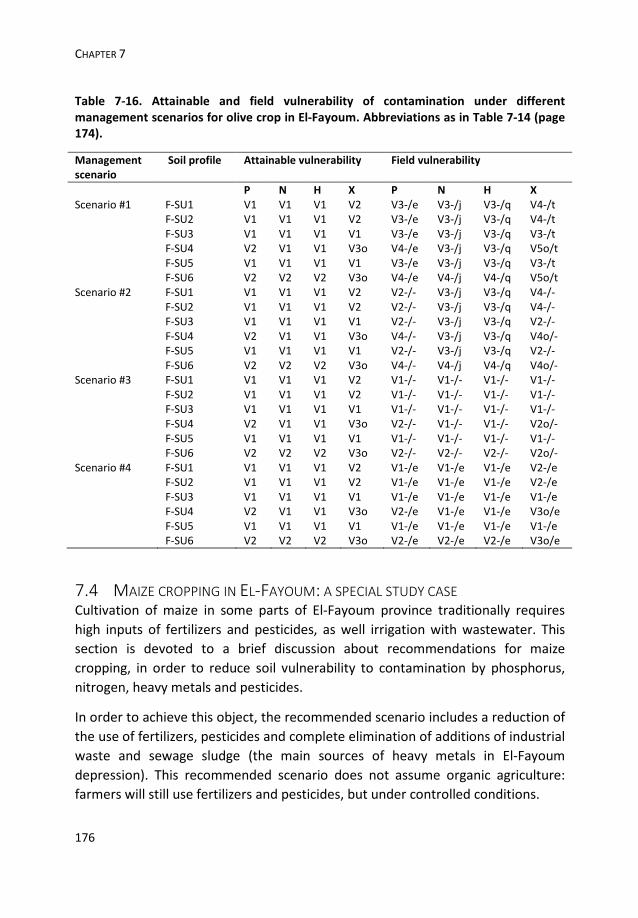
Table 7-16. Attainable and field vulnerability of contamination under different
management scenarios for olive crop in El-Fayoum. Abbreviations as in Table 7-14 (page
174).
Management
scenario
Soil profile Attainable vulnerability Field vulnerability
P N H X P N H X
Scenario #1 F-SU1 V1 V1 V1 V2 V3-/e V3-/j V3-/q V4-/t
F-SU2 V1 V1 V1 V2 V3-/e V3-/j V3-/q V4-/t
F-SU3 V1 V1 V1 V1 V3-/e V3-/j V3-/q V3-/t
F-SU4 V2 V1 V1 V3o V4-/e V3-/j V3-/q V5o/t
F-SU5 V1 V1 V1 V1 V3-/e V3-/j V3-/q V3-/t
F-SU6 V2 V2 V2 V3o V4-/e V4-/j V4-/q V5o/t
Scenario #2 F-SU1 V1 V1 V1 V2 V2-/- V3-/j V3-/q V4-/-
F-SU2 V1 V1 V1 V2 V2-/- V3-/j V3-/q V4-/-
F-SU3 V1 V1 V1 V1 V2-/- V3-/j V3-/q V2-/-
F-SU4 V2 V1 V1 V3o V4-/- V3-/j V3-/q V4o/-
F-SU5 V1 V1 V1 V1 V2-/- V3-/j V3-/q V2-/-
F-SU6 V2 V2 V2 V3o V4-/- V4-/j V4-/q V4o/-
Scenario #3 F-SU1 V1 V1 V1 V2 V1-/- V1-/- V1-/- V1-/-
F-SU2 V1 V1 V1 V2 V1-/- V1-/- V1-/- V1-/-
F-SU3 V1 V1 V1 V1 V1-/- V1-/- V1-/- V1-/-
F-SU4 V2 V1 V1 V3o V2-/- V1-/- V1-/- V2o/-
F-SU5 V1 V1 V1 V1 V1-/- V1-/- V1-/- V1-/-
F-SU6 V2 V2 V2 V3o V2-/- V2-/- V2-/- V2o/-
Scenario #4 F-SU1 V1 V1 V1 V2 V1-/e V1-/e V1-/e V2-/e
F-SU2 V1 V1 V1 V2 V1-/e V1-/e V1-/e V2-/e
F-SU3 V1 V1 V1 V1 V1-/e V1-/e V1-/e V1-/e
F-SU4 V2 V1 V1 V3o V2-/e V1-/e V1-/e V3o/e
F-SU5 V1 V1 V1 V1 V1-/e V1-/e V1-/e V1-/e
F-SU6 V2 V2 V2 V3o V2-/e V2-/e V2-/e V3o/e
7.4 MAIZE CROPPING IN EL-FAYOUM: A SPECIAL STUDY CASE
Cultivation of maize in some parts of El-Fayoum province traditionally requires
high inputs of fertilizers and pesticides, as well irrigation with wastewater. This
section is devoted to a brief discussion about recommendations for maize
cropping, in order to reduce soil vulnerability to contamination by phosphorus,
nitrogen, heavy metals and pesticides.
In order to achieve this object, the recommended scenario includes a reduction of
the use of fertilizers, pesticides and complete elimination of additions of industrial
waste and sewage sludge (the main sources of heavy metals in El-Fayoum
depression). This recommended scenario does not assume organic agriculture:
farmers will still use fertilizers and pesticides, but under controlled conditions.
RESULTS AND DISCUSSION
177
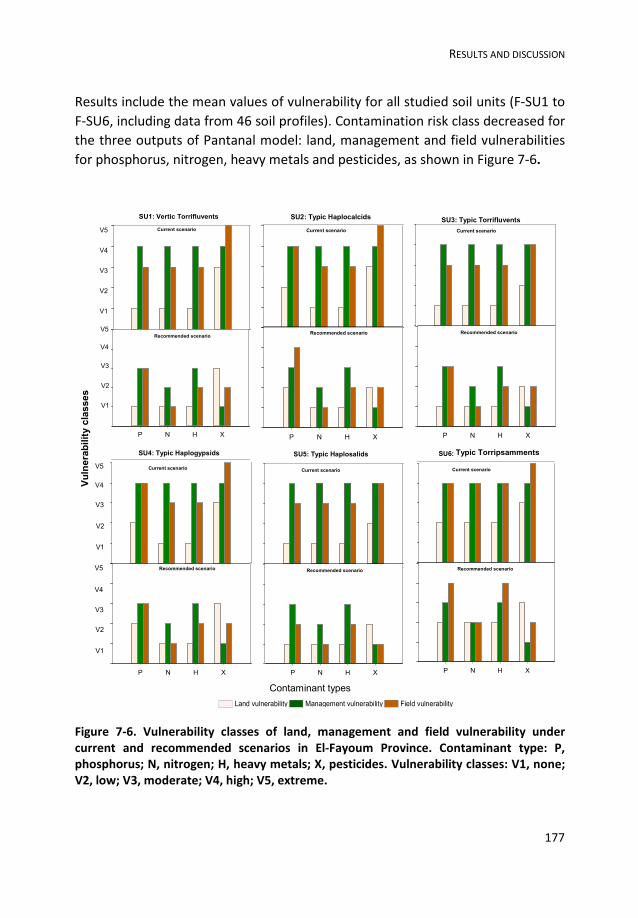
Results include the mean values of vulnerability for all studied soil units (F-SU1 to
F-SU6, including data from 46 soil profiles). Contamination risk class decreased for
the three outputs of Pantanal model: land, management and field vulnerabilities
for phosphorus, nitrogen, heavy metals and pesticides, as shown in Figure 7-6.
Figure 7-6. Vulnerability classes of land, management and field vulnerability under
current and recommended scenarios in El-Fayoum Province. Contaminant type: P,
phosphorus; N, nitrogen; H, heavy metals; X, pesticides. Vulnerability classes: V1, none;
V2, low; V3, moderate; V4, high; V5, extreme.
Land vulnerability Management vulnerability Field vulnerability
Vulnerabilityclasses
Contaminant types
P N H X
P N H X
SU2: Typic Haplocalcids
Current scenario
Recommended scenario
P N H X
SU3: Typic Torrifluvents
Current scenario
Recommended scenario
P N H X
SU4: Typic Haplogypsids
Current scenario
Recommended scenario P N H X
P N H X
SU5: Typic Haplosalids
Current scenario
Recommended scenario P N H X
P N H X
SU6: Typic Torripasamments
Current scenario
Recommended scenario
V1
V2
V3
V4
V5
V1
V2
V3
V4
V5
V1
V2
V3
V4
V5
V1
V2
V3
V4
V5
P N H X
V1
V2
SU1: Vertic Torrifluvents
V3
V4
V5
V1
V2
V3
V4
V5
Current scenario
Recommended scenario
Typic Torripsamments

CHAPTER 7
178
Figure 7-7. Vulnerability classes for current scenario and hypothetically recommended
scenario for all the studied soil type in El-Fayoum Province. Contaminant type: P,
phosphorus; N, nitrogen; H, heavy metals; X, pesticides.
7.4.1 VERTIC TORRIFLUVENTS
Results obtained under the actual management scenario indicate that in SU1-
Vertic Torrifluvents (506.7 km2, 66.67% of the total unit area) have a moderate
vulnerability class (V3), while the rest of the area (253.3 km2, 33.33%) falls within
the V4 class due to the risk of contamination by phosphorus. For nitrogen and
heavy metals, it was found that almost all the area is included in class V3.
Vulnerability classes of contaminants
0
5
10
15
20
25
30
P N H X
0
5
10
15
20
25
30
SU6: Typic Torripasamments
Current scenario
Recommended scenario
SU4: Typic Haplogypsids
Current scenario
P N H X
0
20
40
60
80
100Recommended scenario
0
20
40
60
80
100Current scenario
0
20
40
60
P N H X
0
20
40
60
SU5: Typic Haplosalids
Recommended scenario
Current scenario
SU5: Typic Haplosalids
P N H X
0
20
40
60
80
100
120
140
1600
20
40
60
80
100
120
140
160
SU3: Typic Torrifluvents
Current scenario
Recommended scenario
P N H X
0
100
200
300
400
0
100
200
300
400
SU2: Typic Haplocalcids
Recommended scenario
Current scenario
P N H X
0
200
400
600
8000
200
400
600
800
SU1: Vertic Torrifluvents
Current scenario
Recommended scenario
Area, km2
V1= None V2= Low V3= Moderate V4= High V5= Extreme
Typic Torripsamments

RESULTS AND DISCUSSION
179
According to vulnerability for contamination by pesticides, it was found that V5
class includes 506.7 km2 (66.7%). The resting area falls within classes V4 (211.1
km2, 27.8%) and V3 (42.2 km
2, 5.6%).
On the other hand, data under the recommended management scenario in the
same soil units show vulnerability V2 (506.7 km2, 66.67%) and V4 (253.3 km
2,
33.3%) due to contamination risk by phosphorus. For nitrogen and heavy metals,
it was found that almost all of the area is included in V1 class. According to
vulnerability of pesticides contamination vulnerability, vulnerability classes
determined were V1 (253.3 km2, 33.3%) and V2 (506.7 km
2, 66.7%).
7.4.2 TYPIC HAPLOCALCIDS
Under current conditions, SU2-Typic Haplocalcids (382.7 km2, 90%) show high
vulnerability (V4) for phosphorus, while the rest of the area (38.3 km2, 10%) falls
into class V3. Attending to vulnerability for contamination by nitrogen and heavy
metals, 100% of the total area present moderate vulnerability class (V3). Finally,
vulnerability class for pesticides is V1 (38.3 km2, 10%) and V5 (382.7 km
2, 90%).
In contrast, under the recommended management scenario, vulnerability for
phosphorus is V2 (38.3 km2, 10%) and V4 (382.7 km
2, 90%). Vulnerability for
nitrogen and heavy metals decreased to V1 in all the area. Finally, vulnerability for
pesticides is V1 (38.3 km2, 10%) and V2 (382.7 km
2, 90%).
7.4.3 TYPIC TORRIFLUVENTS
SU3-Typic Torrifluvents spread through an area of 141 km2. Under the current
management conditions, vulnerability for phosphorus is V3 (80.6 km2, 57.1%) and
V4 (60.4 km2, 42.9%). For nitrogen and heavy metals, results showed that 100% of
the unit has a moderate vulnerability class (V3). Current vulnerability for
pesticides is V3 (40.3 km2, 28.58%), V4 (20.1 km
2, 14.22%) and V5 (80.6 km
2,
57.2%).
Under the recommended scenario, phosphorus vulnerability is V2 (80.6 km2,
57.1%) and V4 (in this case, the affected area did not vary). For nitrogen and
heavy metals, results showed that vulnerability class decreased from V3 to V1 in
all the study area. Finally, for pesticides, vulnerability also decreased to V2 in all
the study area.

CHAPTER 7
180
7.4.4 TYPIC HAPLOGYPSIDS
In SU4-Typic Haplogypsids soil unit, under current management conditions,
vulnerability for phosphorus is V3 (29 km2, 33.3%) and V4 (58 km
2, 66.6%). For
nitrogen and heavy metals, the whole unit (87 km2) was included in V3 class. For
pesticides, vulnerability was V4 (29 km2, 33.3%) and V5 (58 km
2, 66.6%).
On the other hand, under the recommended scenario, vulnerability for
phosphorus is V2 (29 km2, 33.3%) and V4 (58 km
2, 66.6%). For nitrogen and heavy
metals, vulnerability is V1 and V2 in all the unit area, respectively. Finally,
vulnerability for pesticides is V1 (29 km2, 33.3%) and V2 (58 km
2, 66.6%).
7.4.5 TYPIC HAPLOSALIDS
In SU5-Typic Haplosalids soil unit, vulnerability for phosphorus, nitrogen and
heavy metals is V3 in all the unit area. In contrast, vulnerability for pesticides is V2
(19.3 km2, 33.3%) and V3 (38.7 km
2, 66.7%).
On the other hand, the result of recommended management scenario indicates
that the whole unit has a vulnerability class V3 for phosphorus. But for nitrogen
and heavy metals, the vulnerability decreased to V2. In the case of pesticides
vulnerability was V1 (38.7 km2, 66.7%) and V2 (19.3 km
2, 33.3%).
7.4.6 TYPIC TORRIPSAMMENT
In SU6-Typic Torripsamment soil unit, vulnerability for phosphorus under the
current scenario is V4 (26 km2). Vulnerability for nitrogen and heavy metals is V3
(6.5 km2, 25%) and V4 (19.5 km
2, 75%). Finally, the whole unit area was classified
as V5 for pesticides vulnerability.
On the other hand, vulnerability for phosphorus did not vary under the
recommended scenario, while vulnerability for nitrogen decreased to V2 in all the
unit area. Finally, vulnerability the total unit area was V3 for heavy metals and V2
for pesticides under the recommended management scenario.
7.4.7 WHOLE AREA
Figure 7-8 shows the results for the whole study area. It can be summarized that
the model application results are grouped in five vulnerability classes: V1 (none)
to V5 (extreme) for each specific contaminant. Results obtained in El-Fayoum area
showed that 47.8% and 52.2% of total studied area were classified as V3 and V4
due to phosphorus contamination under the actual management scenario, but
41.9, 5.9 and 52.2% of total area were classified as V2, V3 and V4 under

RESULTS AND DISCUSSION
181
recommended management scenario. Vulnerability for nitrogen and heavy metals
was V3 (98.7%) and V4 (1.3%) of the total area under the actual management
scenario. Finally, vulnerability for pesticides is V1 (2.6%), V3 (8.1%), V4 (17.4%)
and V5 (71.9%) under the actual management scenario,
In contrast, under the recommended scenario, vulnerability was V1 (94.4%) and
V2 (5.6% of the total area) for nitrogen, V1 (79.0%), V2 (19.1%) and V4 (1.7%) for
heavy metals and V1 (24.0%) and V2 (76.0%) for pesticides under the
recommended management scenario.
Figure 7-8. Comparison between vulnerability classes for current management scenario
and hypothetically recommended management scenario in El-Fayoum Province.
Contaminant type: P, phosphorus; N, nitrogen; H, heavy metals; X, pesticides.
V1= None V2= Low V3= Moderate V4= High V5= Extreme
Vulnerability classes of contaminantsP N H X
0
200
400
600
800
1000
1200
1400
1600
P N H X
Area, km
Current scenario Recommended scenario
Area, km2


Eutrophication and high concentration
of nutrients in the agriculture water in
El-Fayoum Province.


Burnt rice crop residues in marshlands
near Seville (Andalusia).
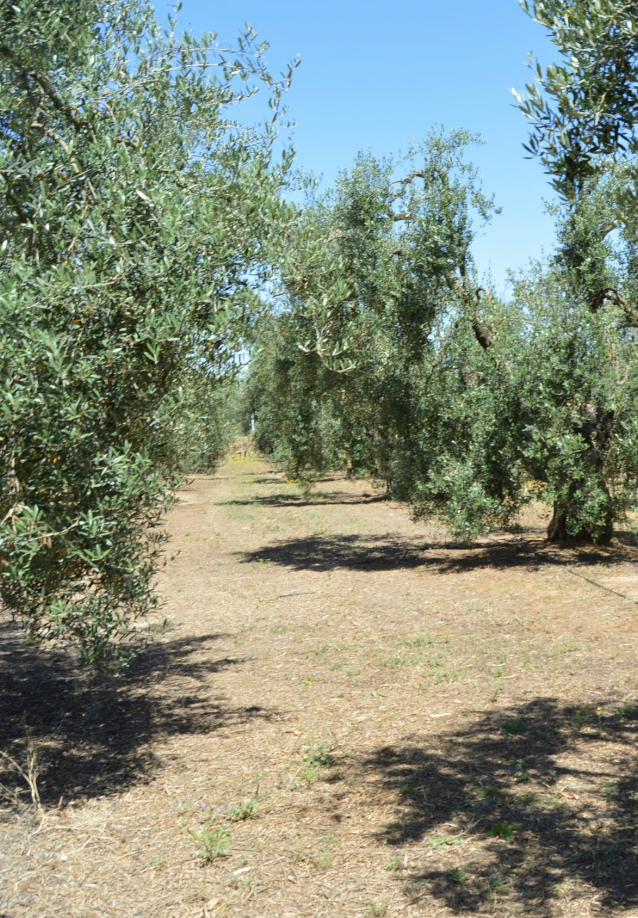

Olive crop in Andalusia. The farmer
used herbicide to control weeds
among the olive tree.


Pollution of irrigation water by human
waste in El-Fayoum Province.


Using animal manure as an organic
fertilizer in El-Fayoum depression.
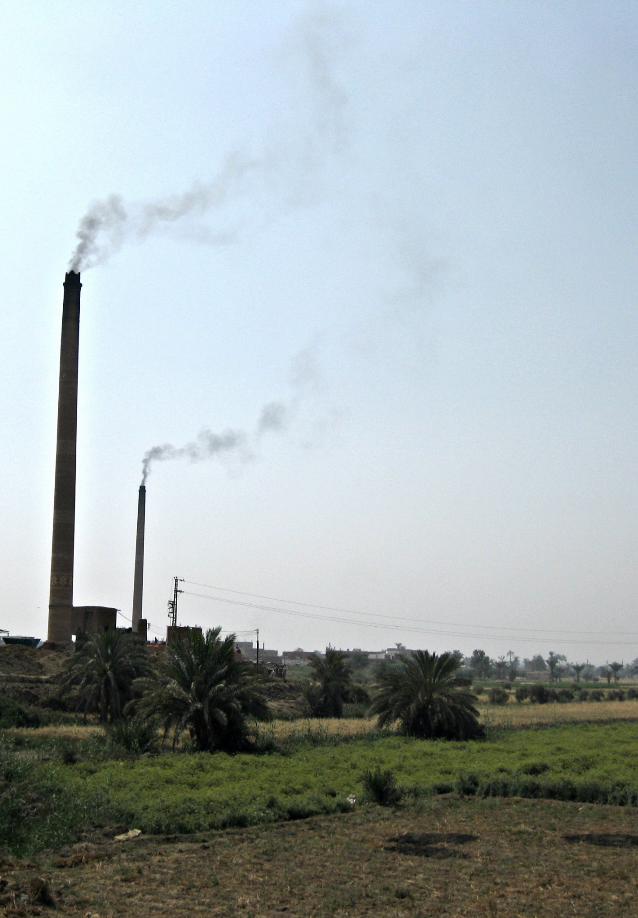

Brick factories contribute in the
contamination of air and soil in El-
Fayoum province.


Burnt weeds in irrigation canals in El-
Fayoum.


Baher el Banat irrigation canal. This is
one of the most polluted canals in El-
Fayoum depression.