7. strategic resource plan and financial performance
TRANSCRIPT

7. Strategic resource plan and financial performance indicators
7.1 Plan development
This section considers the long term financial projections of the Council. The Act requires a Strategic
Resource Plan to be prepared covering both financial and non-financial resources, and including key financial
indicators for at least the next four financial years to support the Council Plan.
Council has prepared a Strategic Resource Plan (SRP) for the four years 2015-16 to 2018-19 as part of its
ongoing financial planning to assist in adopting a budget within a longer term framework. The SRP takes the
strategic objectives and strategies as specified in the Council Plan and expresses them in financial terms for
the next four years. Council has also adopted a Financial Sustainability Plan with a set of targets for Council
to achieve over the short and long term. The Strategic Resource Plan is used to project Council's
performance in meeting this targets.
Assumptions used in preparation of the Strategic Resource Plan include:
The Act requires a Strategic Resource Plan to be prepared describing both financial and non-financial
resources (including human resources) for at least the next four financial years to achieve the strategic
objectives in the Council Plan.
In preparing the SRP, the Council has also been mindful of the need to comply with the following Principles of
Sound Financial Management as contained in the Act:
• Consider the financial effects of Council decisions on future generations
• Provide full, accurate and timely disclosure of financial information.
• Maintain effort on capital works, with 5% annual increase in the rates contribution to capital works
• Maintain at least a $150,000 annual cash surplus on a rate determination basis.
• Maintain existing service levels with expenditure increases to generally correspond to increases in
the cost base, rather than expansion of services.
• Prudently manage financial risks relating to debt, assets and liabilities
• Provide reasonable stability in the level of rate burden
Nillumbik Shire Council Budget 2015-2016
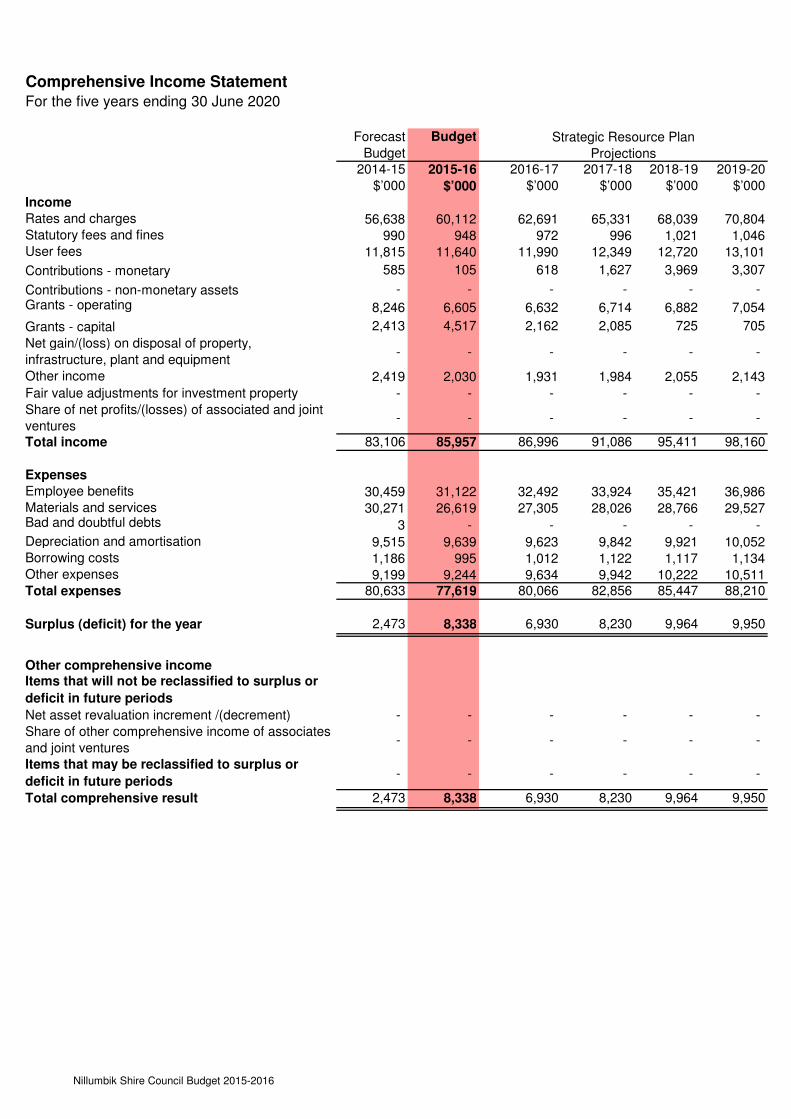
Comprehensive Income StatementFor the five years ending 30 June 2020
Budget
2014-15 2015-16 2016-17 2017-18 2018-19 2019-20
$’000 $’000 $’000 $’000 $’000 $’000
Income
Rates and charges 56,638 60,112 62,691 65,331 68,039 70,804Statutory fees and fines 990 948 972 996 1,021 1,046User fees 11,815 11,640 11,990 12,349 12,720 13,101
Contributions - monetary 585 105 618 1,627 3,969 3,307
Contributions - non-monetary assets - - - - - - Grants - operating 8,246 6,605 6,632 6,714 6,882 7,054
Grants - capital 2,413 4,517 2,162 2,085 725 705
Net gain/(loss) on disposal of property,
infrastructure, plant and equipment- - - - - -
Other income 2,419 2,030 1,931 1,984 2,055 2,143
Fair value adjustments for investment property - - - - - -
Share of net profits/(losses) of associated and joint
ventures- - - - - -
Total income 83,106 85,957 86,996 91,086 95,411 98,160
Expenses
Employee benefits 30,459 31,122 32,492 33,924 35,421 36,986Materials and services 30,271 26,619 27,305 28,026 28,766 29,527Bad and doubtful debts 3 - - - - - Depreciation and amortisation 9,515 9,639 9,623 9,842 9,921 10,052Borrowing costs 1,186 995 1,012 1,122 1,117 1,134Other expenses 9,199 9,244 9,634 9,942 10,222 10,511Total expenses 80,633 77,619 80,066 82,856 85,447 88,210
Surplus (deficit) for the year 2,473 8,338 6,930 8,230 9,964 9,950
Other comprehensive incomeItems that will not be reclassified to surplus or
deficit in future periods
Net asset revaluation increment /(decrement) - - - - - -
Share of other comprehensive income of associates
and joint ventures- - - - - -
Items that may be reclassified to surplus or
deficit in future periods- - - - - -
Total comprehensive result 2,473 8,338 6,930 8,230 9,964 9,950
Forecast
BudgetStrategic Resource Plan
Projections
Nillumbik Shire Council Budget 2015-2016

Comprehensive Income Statement Forward Estimates For the five years ending 30 June 2025
2020-21 2021-22 2022-23 2023-24 2024-25
$’000 $’000 $’000 $’000 $’000
Income
Rates and charges 73,603 76,377 79,158 81,985 84,827Statutory fees and fines 1,073 1,099 1,127 1,155 1,184User fees 13,494 13,899 14,316 14,746 15,188Contributions - monetary 5 5 5 5 5Contributions - non-monetary assets - - - - - Grants - operating 7,231 7,411 7,597 7,787 7,981Grants - capital 1,147 3,647 1,647 1,897 2,447Net gain/(loss) on disposal of property,
infrastructure, plant and equipment- - - - -
Other income 2,234 2,267 2,327 2,325 2,383
Fair value adjustments for investment property - - - - -
Share of net profits/(losses) of associated and joint
ventures- - - - -
Total income 98,787 104,705 106,177 109,900 114,015
Expenses
Employee benefits 38,624 40,505 42,481 44,555 46,538Materials and services 30,308 31,111 31,938 32,788 33,661Bad and doubtful debts - - - - - Depreciation and amortisation 10,203 10,267 10,395 10,494 10,574Borrowing costs 1,220 839 778 543 424Other expenses 10,809 11,116 11,433 11,760 12,097Total expenses 91,164 93,838 97,025 100,140 103,294
Surplus (deficit) for the year 7,623 10,867 9,152 9,760 10,721
Other comprehensive incomeItems that will not be reclassified to surplus or
deficit in future periods
Net asset revaluation increment /(decrement) - - - - -
Share of other comprehensive income of associates
and joint ventures- - - - -
Items that may be reclassified to surplus or
deficit in future periods- - - - -
Total comprehensive result 7,623 10,867 9,152 9,760 10,721
Forward Estimates
Nillumbik Shire Council Budget 2015-2016

Rate Determination StatementFor the five years ending 30 June 2020
2014-15 2015-16 2016-17 2017-18 2018-19 2019-20
$’000 $’000 $’000 $’000 $’000 $’000
Description
Recurrent Resource
Rates and charges 48,921 52,199 54,352 56,542 58,776 61,042
Garbage charge 7,718 7,912 8,339 8,789 9,263 9,762
Government grants 6,605 6,551 6,632 6,714 6,882 7,054
Statutory fees and fines 990 948 972 996 1,021 1,046
User fees 11,815 11,640 11,990 12,349 12,720 13,101
Reimbursements 94 82 84 86 88 91
Interest 917 918 791 816 857 915
Proceeds on sale - recurrent 729 521 550 700 520 550
Other revenue 1,408 1,030 1,056 1,082 1,109 1,137
Total Recurrent Resource 79,197 81,801 84,766 88,074 91,236 94,698
Recurrent Allocation
Employee costs 30,459 31,122 32,492 33,924 35,421 36,986
Contracts 15,226 14,752 15,177 15,613 16,062 16,524
Materials and services 11,300 11,271 11,568 11,871 12,183 12,502
Bad and doubtful debts 3 - - - - -
Other expenses 9,199 9,244 9,634 9,942 10,222 10,51166,187 66,389 68,871 71,350 73,888 76,523
Interest expenses 1,186 995 1,012 1,122 1,117 1,134
Total Recurrent Allocation 67,373 67,384 69,883 72,472 75,005 77,657
Net Recurrent Resource 11,824 14,417 14,883 15,602 16,231 17,041
Non-recurrent Resource
Tfr from reserves 4,060 440 306 306 306 306
Proceeds on sale - non-current 5,700 8,400 - 2,070 - -
Total Non-recurrent Resource 9,760 8,840 306 2,376 306 306
Non-recurrent Allocation
Revaluation decrements on assets - - - - - -
Debt redemption 1,516 797 818 695 611 658
Tfr to reserves 12,001 12,911 4,452 6,924 5,103 5,311
Capital works recharge (420) (420) (439) (459) (479) (501)
Total Non-recurrent Allocation 13,097 13,288 4,831 7,160 5,235 5,468
Net Non-recurrent Resource (3,337) (4,448) (4,525) (4,784) (4,929) (5,162)
Net Operating Resource 8,487 9,969 10,358 10,818 11,302 11,879
BudgetForecast
Budget
Strategic Resource Plan
Projections
Nillumbik Shire Council Budget 2015-2016
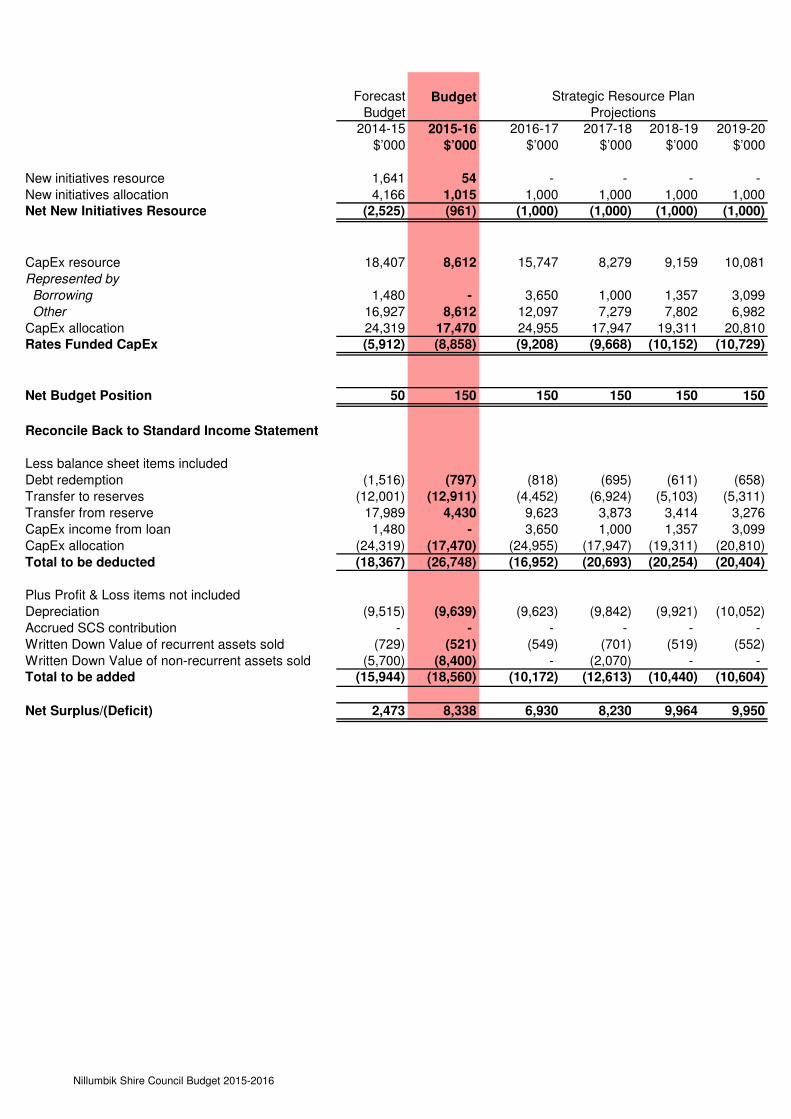
2014-15 2015-16 2016-17 2017-18 2018-19 2019-20
$’000 $’000 $’000 $’000 $’000 $’000
New initiatives resource 1,641 54 - - - -
New initiatives allocation 4,166 1,015 1,000 1,000 1,000 1,000Net New Initiatives Resource (2,525) (961) (1,000) (1,000) (1,000) (1,000)
CapEx resource 18,407 8,612 15,747 8,279 9,159 10,081
Represented by
Borrowing 1,480 - 3,650 1,000 1,357 3,099
Other 16,927 8,612 12,097 7,279 7,802 6,982
CapEx allocation 24,319 17,470 24,955 17,947 19,311 20,810Rates Funded CapEx (5,912) (8,858) (9,208) (9,668) (10,152) (10,729)
Net Budget Position 50 150 150 150 150 150
Reconcile Back to Standard Income Statement
Less balance sheet items included
Debt redemption (1,516) (797) (818) (695) (611) (658)
Transfer to reserves (12,001) (12,911) (4,452) (6,924) (5,103) (5,311)
Transfer from reserve 17,989 4,430 9,623 3,873 3,414 3,276
CapEx income from loan 1,480 - 3,650 1,000 1,357 3,099
CapEx allocation (24,319) (17,470) (24,955) (17,947) (19,311) (20,810)
Total to be deducted (18,367) (26,748) (16,952) (20,693) (20,254) (20,404)
Plus Profit & Loss items not included
Depreciation (9,515) (9,639) (9,623) (9,842) (9,921) (10,052)
Accrued SCS contribution - - - - - -
Written Down Value of recurrent assets sold (729) (521) (549) (701) (519) (552)
Written Down Value of non-recurrent assets sold (5,700) (8,400) - (2,070) - - Total to be added (15,944) (18,560) (10,172) (12,613) (10,440) (10,604)
Net Surplus/(Deficit) 2,473 8,338 6,930 8,230 9,964 9,950
BudgetProjections
Strategic Resource PlanForecast
Budget
Nillumbik Shire Council Budget 2015-2016

Rate Determination Statement Forward EstimatesFor the five years ending 30 June 2025
2020-21 2021-22 2022-23 2023-24 2024-25
$’000 $’000 $’000 $’000 $’000
Description
Recurrent Resource
Rates and charges 63,315 65,535 67,732 69,944 72,138
Garbage charge 10,288 10,842 11,426 12,041 12,689
Government grants 7,231 7,411 7,597 7,787 7,981
Statutory fees and fines 1,073 1,099 1,127 1,155 1,184
User fees 13,494 13,899 14,316 14,746 15,188
Reimbursements 93 95 97 100 102
Interest 976 978 1,005 971 994
Proceeds on sale - recurrent 700 520 550 700 700
Other revenue 1,165 1,194 1,224 1,255 1,286
Total Recurrent Resource 98,335 101,573 105,074 108,699 112,262
Recurrent Allocation
Employee costs 38,624 40,505 42,481 44,555 46,538
Contracts 16,999 17,488 17,991 18,509 19,042
Materials and services 12,832 13,170 13,518 13,876 14,244
Bad and doubtful debts - - - - -
Other expenses 10,809 11,116 11,433 11,760 12,09779,264 82,279 85,423 88,700 91,921
Interest expenses 1,220 839 778 543 424
Total Recurrent Allocation 80,484 83,118 86,201 89,243 92,345
Net Recurrent Resource 17,851 18,455 18,873 19,456 19,917
Non-recurrent Resource
Tfr from reserves 2,698 1,786 3,956 1,306 1,661
Proceeds on sale - non-current - - - - -
Total Non-recurrent Resource 2,698 1,786 3,956 1,306 1,661
Non-recurrent Allocation
Revaluation decrements on assets - - - - -
Debt redemption 3,107 2,252 4,483 1,899 2,328
Tfr to reserves 5,621 5,634 5,428 5,351 5,121
Capital works recharge (522) (548) (572) (595) (626)
Total Non-recurrent Allocation 8,206 7,338 9,339 6,655 6,823
Net Non-recurrent Resource (5,508) (5,552) (5,383) (5,349) (5,162)
Net Operating Resource 12,343 12,903 13,490 14,107 14,755
Forward Estimates
Nillumbik Shire Council Budget 2015-2016
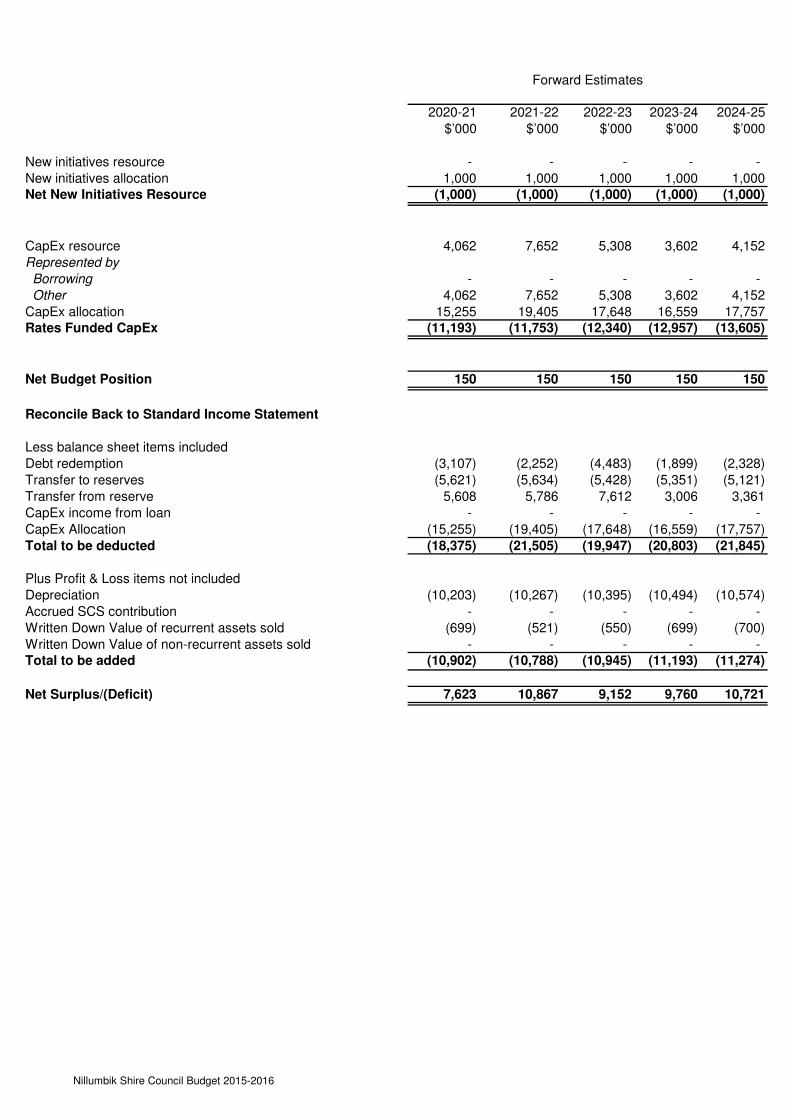
2020-21 2021-22 2022-23 2023-24 2024-25
$’000 $’000 $’000 $’000 $’000
New initiatives resource - - - - -
New initiatives allocation 1,000 1,000 1,000 1,000 1,000Net New Initiatives Resource (1,000) (1,000) (1,000) (1,000) (1,000)
CapEx resource 4,062 7,652 5,308 3,602 4,152
Represented by
Borrowing - - - - -
Other 4,062 7,652 5,308 3,602 4,152
CapEx allocation 15,255 19,405 17,648 16,559 17,757Rates Funded CapEx (11,193) (11,753) (12,340) (12,957) (13,605)
Net Budget Position 150 150 150 150 150
Reconcile Back to Standard Income Statement
Less balance sheet items included
Debt redemption (3,107) (2,252) (4,483) (1,899) (2,328)
Transfer to reserves (5,621) (5,634) (5,428) (5,351) (5,121)
Transfer from reserve 5,608 5,786 7,612 3,006 3,361
CapEx income from loan - - - - -
CapEx Allocation (15,255) (19,405) (17,648) (16,559) (17,757)
Total to be deducted (18,375) (21,505) (19,947) (20,803) (21,845)
Plus Profit & Loss items not included
Depreciation (10,203) (10,267) (10,395) (10,494) (10,574)
Accrued SCS contribution - - - - -
Written Down Value of recurrent assets sold (699) (521) (550) (699) (700)
Written Down Value of non-recurrent assets sold - - - - - Total to be added (10,902) (10,788) (10,945) (11,193) (11,274)
Net Surplus/(Deficit) 7,623 10,867 9,152 9,760 10,721
Forward Estimates
Nillumbik Shire Council Budget 2015-2016

Balance SheetFor the five years ending 30 June 2020
2014-15 2015-16 2016-17 2017-18 2018-19 2019-20
$’000 $’000 $’000 $’000 $’000 $’000
Current assets
Cash and cash equivalents 20,676 29,978 24,207 29,543 31,641 36,458
Trade and other receivables 4,427 5,205 5,136 3,400 3,500 3,400
Other assets 561 561 561 561 611 611
Non-current assets classified as held for sale 745 745 745 745 745 745
Inventories 26 26 27 28 28 29Total current assets 26,435 36,515 30,676 34,277 36,525 41,243
Non-current assets
Trade and other receivables 1,100 800 500 500 500 500
Investments in associates and joint ventures - - - - - - Property, infrastructure, plant & equipment 655,782 654,692 669,474 674,809 683,680 693,888Investment property - - - - - - Intangible assets - - - - - - Other assets 1,216 1,216 1,216 1,216 1,216 1,216Total non-current assets 658,098 656,708 671,190 676,525 685,396 695,604
Total assets 684,533 693,223 701,866 710,802 721,921 736,847
Current liabilities
Trade and other payables 5,563 4,950 3,544 3,644 3,742 5,950
Interest-bearing loans and borrowings 821 818 695 611 658 3,107Provisions 6,922 7,179 7,446 7,724 8,013 8,313Trust funds and deposits 1,166 1,166 1,166 1,166 1,166 1,166Total current liabilities 14,472 14,113 12,851 13,145 13,579 18,536
Non-current liabilities
Interest-bearing loans and borrowings 13,072 13,763 16,718 17,107 17,806 17,798Provisions 8,546 8,566 8,588 8,610 8,633 8,657Total non-current liabilities 21,618 22,329 25,306 25,717 26,439 26,455
Total liabilities 36,090 36,442 38,157 38,862 40,018 44,991
Net assets 648,443 656,781 663,709 671,940 681,903 691,856
Equity
Reserves 9,464 17,945 12,774 15,826 17,515 19,550Asset revaluation reserve 269,545 269,545 269,545 269,545 269,545 269,545Retained profits 369,434 369,291 381,390 386,569 394,843 402,761
Total equity 648,443 656,781 663,709 671,940 681,903 691,856
Projections
Strategic Resource PlanForecast
BudgetBudget
Nillumbik Shire Council Budget 2015-2016

Balance Sheet Forward Estimates For the five years ending 30 June 2025
2020-21 2021-22 2022-23 2023-24 2024-25
$’000 $’000 $’000 $’000 $’000
Current assets
Cash and cash equivalents 37,158 37,607 35,937 38,313 40,617
Trade and other receivables 3,200 3,100 3,100 3,100 3,100
Other assets 611 611 611 611 612
Non-current assets classified as held for sale 745 745 745 745 745
Inventories 30 31 31 32 33Total current assets 41,744 42,094 40,424 42,801 45,107
Non-current assets
Trade and other receivables 500 500 500 500 500
Investments in associates and joint ventures - - - - - Property, infrastructure, plant & equipment 698,240 706,857 713,560 718,925 725,409Investment property - - - - - Intangible assets - - - - - Other assets 1,216 1,216 1,216 1,216 1,216Total non-current assets 699,956 708,573 715,276 720,641 727,125
Total assets 741,700 750,667 755,700 763,442 772,232
Current liabilities
Trade and other payables 5,950 5,950 5,950 5,950 5,950
Interest-bearing loans and borrowings 2,252 4,483 1,899 2,328 4,147Provisions 8,626 8,951 9,289 9,141 9,507Trust funds and deposits 1,166 1,166 1,166 1,166 1,166Total current liabilities 17,994 20,550 18,304 18,585 20,770
Non-current liabilities
Interest-bearing loans and borrowings 15,546 11,063 9,164 6,836 2,689Provisions 8,682 8,709 8,737 8,766 8,796Total non-current liabilities 24,228 19,772 17,901 15,602 11,485
Total liabilities 42,222 40,322 36,205 34,187 32,255Net assets 699,478 710,345 719,495 729,255 739,977
Equity
Reserves 19,563 19,412 17,227 19,573 21,333Asset revaluation reserve 269,545 269,545 269,545 269,545 269,545Retained profits 410,370 421,388 432,723 440,137 449,099Total equity 699,478 710,345 719,495 729,255 739,977
Forward Estimates
Nillumbik Shire Council Budget 2015-2016
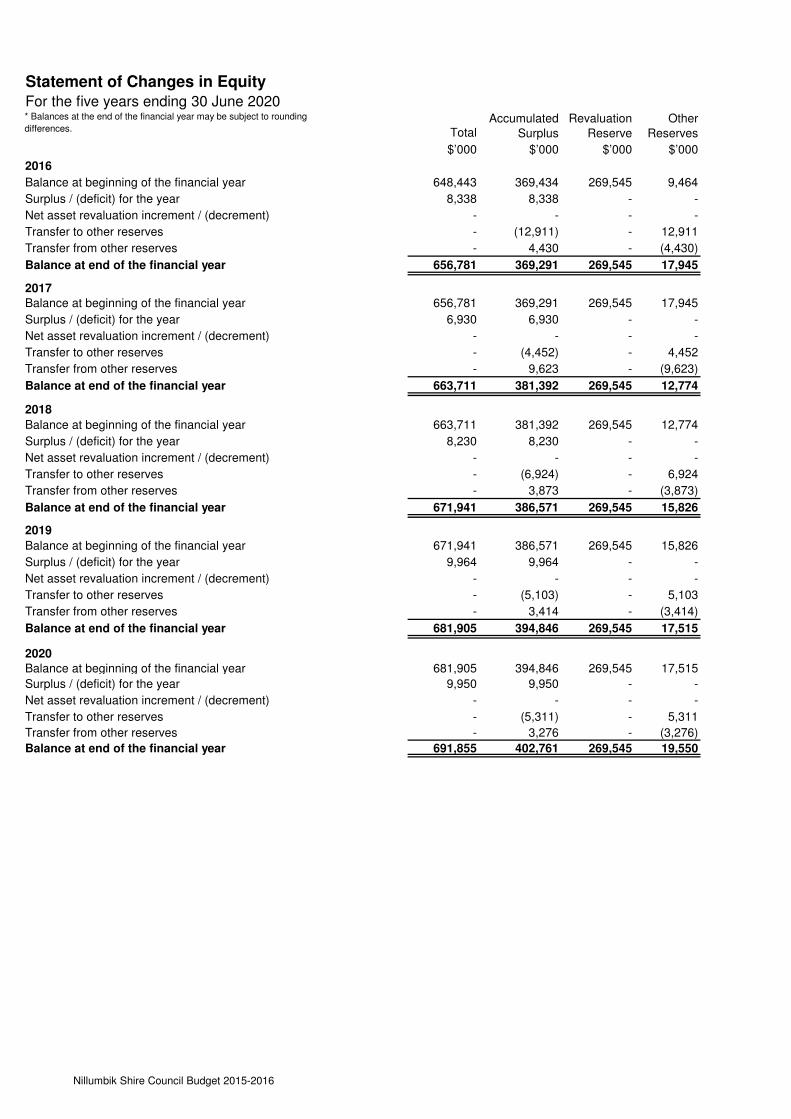
Statement of Changes in EquityFor the five years ending 30 June 2020* Balances at the end of the financial year may be subject to rounding
differences. TotalAccumulated
Surplus
Revaluation
Reserve
Other
Reserves
$’000 $’000 $’000 $’000
2016
Balance at beginning of the financial year 648,443 369,434 269,545 9,464
Surplus / (deficit) for the year 8,338 8,338 - -
Net asset revaluation increment / (decrement) - - - -
Transfer to other reserves - (12,911) - 12,911
Transfer from other reserves - 4,430 - (4,430)
Balance at end of the financial year 656,781 369,291 269,545 17,945
2017
Balance at beginning of the financial year 656,781 369,291 269,545 17,945
Surplus / (deficit) for the year 6,930 6,930 - -
Net asset revaluation increment / (decrement) - - - -
Transfer to other reserves - (4,452) - 4,452
Transfer from other reserves - 9,623 - (9,623)
Balance at end of the financial year 663,711 381,392 269,545 12,774
2018
Balance at beginning of the financial year 663,711 381,392 269,545 12,774
Surplus / (deficit) for the year 8,230 8,230 - -
Net asset revaluation increment / (decrement) - - - -
Transfer to other reserves - (6,924) - 6,924
Transfer from other reserves - 3,873 - (3,873)
Balance at end of the financial year 671,941 386,571 269,545 15,826
2019
Balance at beginning of the financial year 671,941 386,571 269,545 15,826
Surplus / (deficit) for the year 9,964 9,964 - -
Net asset revaluation increment / (decrement) - - - -
Transfer to other reserves - (5,103) - 5,103
Transfer from other reserves - 3,414 - (3,414)
Balance at end of the financial year 681,905 394,846 269,545 17,515
2020
Balance at beginning of the financial year 681,905 394,846 269,545 17,515
Surplus / (deficit) for the year 9,950 9,950 - -
Net asset revaluation increment / (decrement) - - - -
Transfer to other reserves - (5,311) - 5,311
Transfer from other reserves - 3,276 - (3,276)
Balance at end of the financial year 691,855 402,761 269,545 19,550
Nillumbik Shire Council Budget 2015-2016

Statement of Changes in Equity Forward Estimates For the five years ending 30 June 2025
TotalAccumulated
Surplus
Revaluation
Reserve
Other
Reserves
$’000 $’000 $’000 $’000
2021
Balance at beginning of the financial year 691,855 402,761 269,545 19,550
Surplus / (deficit) for the year 7,623 7,623 - -
Net asset revaluation increment / (decrement) - - - -
Transfer to other reserves - (5,621) - 5,621
Transfer from other reserves - 5,608 - (5,608)
Balance at end of the financial year 699,478 410,371 269,545 19,563
2022
Balance at beginning of the financial year 699,478 410,371 269,545 19,563
Surplus / (deficit) for the year 10,867 10,867 - -
Net asset revaluation increment / (decrement) - - - -
Transfer to other reserves - (5,634) - 5,634
Transfer from other reserves - 5,786 - (5,786)
Balance at end of the financial year 710,345 421,390 269,545 19,411
2023
Balance at beginning of the financial year 710,345 421,390 269,545 19,411
Surplus / (deficit) for the year 9,152 9,152 - -
Net asset revaluation increment / (decrement) - - - -
Transfer to other reserves - (5,428) - 5,428
Transfer from other reserves - 7,612 - (7,612)
Balance at end of the financial year 719,497 432,726 269,545 17,227
2024Balance at beginning of the financial year 719,497 432,726 269,545 17,227
Surplus / (deficit) for the year 9,760 9,760 - -
Net asset revaluation increment / (decrement) - - - -
Transfer to other reserves - (5,351) - 5,351
Transfer from other reserves - 3,006 - (3,006)
Balance at end of the financial year 729,257 440,141 269,545 19,572
2025
Balance at beginning of the financial year 729,257 440,141 269,545 19,572
Surplus / (deficit) for the year 10,721 10,721 - -
Net asset revaluation increment / (decrement) - - - -
Transfer to other reserves - (5,121) - 5,121
Transfer from other reserves - 3,361 - (3,361)Balance at end of the financial year 739,978 449,102 269,545 21,332
Nillumbik Shire Council Budget 2015-2016
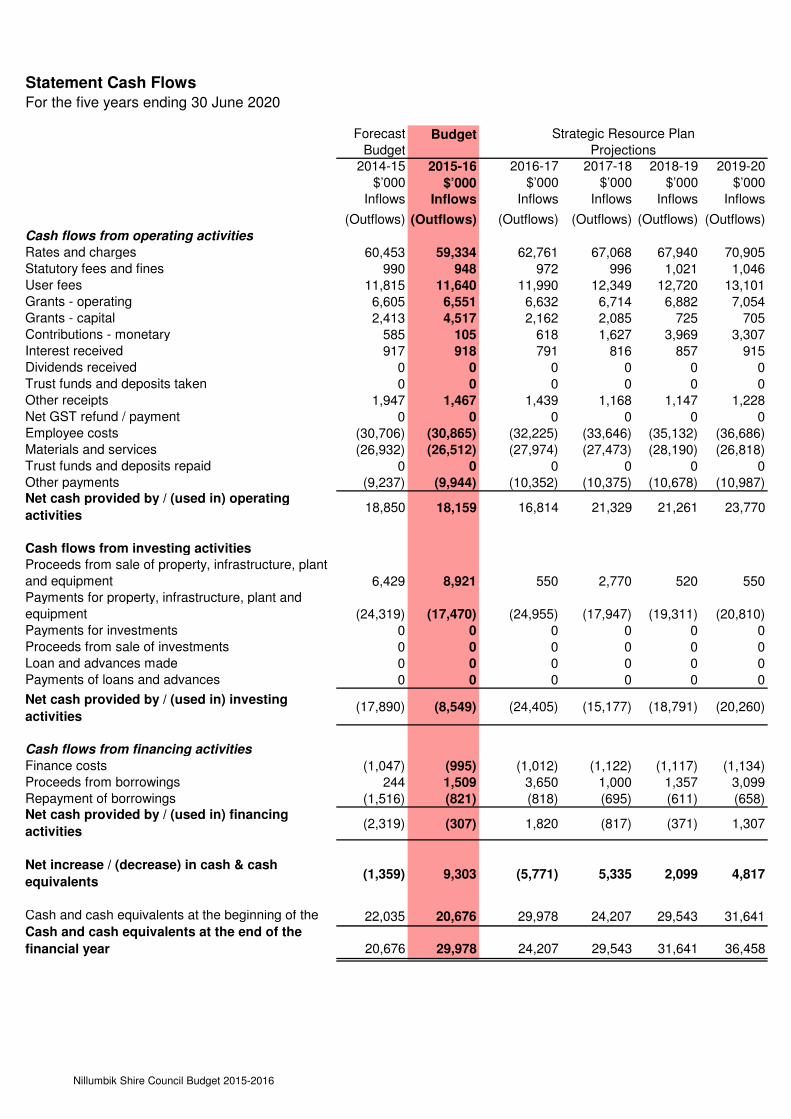
Statement Cash FlowsFor the five years ending 30 June 2020
2014-15 2015-16 2016-17 2017-18 2018-19 2019-20
$’000 $’000 $’000 $’000 $’000 $’000
Inflows Inflows Inflows Inflows Inflows Inflows
(Outflows) (Outflows) (Outflows) (Outflows) (Outflows) (Outflows)
Cash flows from operating activities
Rates and charges 60,453 59,334 62,761 67,068 67,940 70,905Statutory fees and fines 990 948 972 996 1,021 1,046User fees 11,815 11,640 11,990 12,349 12,720 13,101Grants - operating 6,605 6,551 6,632 6,714 6,882 7,054Grants - capital 2,413 4,517 2,162 2,085 725 705Contributions - monetary 585 105 618 1,627 3,969 3,307Interest received 917 918 791 816 857 915Dividends received 0 0 0 0 0 0Trust funds and deposits taken 0 0 0 0 0 0Other receipts 1,947 1,467 1,439 1,168 1,147 1,228Net GST refund / payment 0 0 0 0 0 0Employee costs (30,706) (30,865) (32,225) (33,646) (35,132) (36,686)Materials and services (26,932) (26,512) (27,974) (27,473) (28,190) (26,818)Trust funds and deposits repaid 0 0 0 0 0 0Other payments (9,237) (9,944) (10,352) (10,375) (10,678) (10,987)Net cash provided by / (used in) operating
activities 18,850 18,159 16,814 21,329 21,261 23,770
Cash flows from investing activities
Proceeds from sale of property, infrastructure, plant
and equipment 6,429 8,921 550 2,770 520 550Payments for property, infrastructure, plant and
equipment (24,319) (17,470) (24,955) (17,947) (19,311) (20,810)Payments for investments 0 0 0 0 0 0Proceeds from sale of investments 0 0 0 0 0 0Loan and advances made 0 0 0 0 0 0Payments of loans and advances 0 0 0 0 0 0
Net cash provided by / (used in) investing
activities (17,890) (8,549) (24,405) (15,177) (18,791) (20,260)
Cash flows from financing activities
Finance costs (1,047) (995) (1,012) (1,122) (1,117) (1,134)Proceeds from borrowings 244 1,509 3,650 1,000 1,357 3,099Repayment of borrowings (1,516) (821) (818) (695) (611) (658)Net cash provided by / (used in) financing
activities (2,319) (307) 1,820 (817) (371) 1,307
Net increase / (decrease) in cash & cash
equivalents (1,359) 9,303 (5,771) 5,335 2,099 4,817
Cash and cash equivalents at the beginning of the 22,035 20,676 29,978 24,207 29,543 31,641Cash and cash equivalents at the end of the
financial year 20,676 29,978 24,207 29,543 31,641 36,458
BudgetProjections
Strategic Resource PlanForecast
Budget
Nillumbik Shire Council Budget 2015-2016

Statement of Cash Flows Forward Estimates For the five years ending 30 June 2025
2020-21 2021-22 2022-23 2023-24 2024-25
$’000 $’000 $’000 $’000 $’000
Inflows Inflows Inflows Inflows Inflows
(Outflows) (Outflows) (Outflows) (Outflows) (Outflows)
Cash flows from operating activities
Rates and charges 73,804 76,478 79,159 81,985 84,828Statutory fees and fines 1,073 1,099 1,127 1,155 1,184User fees 13,494 13,899 14,316 14,746 15,188Grants - operating 7,231 7,411 7,597 7,787 7,981Grants - capital 1,147 3,647 1,647 1,897 2,447Contributions - monetary 5 5 5 5 5Interest received 976 978 1,005 971 994Dividends received 0 0 0 0 0Trust funds and deposits taken 0 0 0 0 0Other receipts 1,258 1,289 1,321 1,355 1,387Net GST refund / payment 0 0 0 0 0Employee costs (38,311) (40,180) (42,143) (44,704) (46,172)Materials and services (29,786) (30,566) (31,368) (32,789) (33,663)Trust funds and deposits repaid 0 0 0 0 0Other payments (11,308) (11,635) (11,976) (11,730) (12,068)Net cash provided by / (used in) operating
activities 19,583 22,425 20,690 20,678 22,111
Cash flows from investing activities
Proceeds from sale of property, infrastructure, plant
and equipment 700 520 550 700 700Payments for property, infrastructure, plant and
equipment (15,255) (19,405) (17,648) (16,559) (17,757)Payments for investments 0 0 0 0 0Proceeds from sale of investments 0 0 0 0 0Loan and advances made 0 0 0 0 0Payments of loans and advances 0 0 0 0 0Net cash provided by / (used in) investing
activities (14,555) (18,885) (17,098) (15,859) (17,057)
Cash flows from financing activities
Finance costs (1,220) (839) (778) (543) (424)Proceeds from borrowings 0 0 0 0 0Repayment of borrowings (3,107) (2,252) (4,483) (1,899) (2,328)Net cash provided by / (used in) financing
activities (4,327) (3,091) (5,261) (2,442) (2,752)
Net increase / (decrease) in cash & cash
equivalents 700 449 (1,670) 2,376 2,302
Cash and cash equivalents at thebeginning of the
financial year 36,458 37,158 37,607 35,937 38,315Cash and cash equivalents at the end of the
financial year 37,158 37,607 35,937 38,313 40,617
Forward Estimates
Nillumbik Shire Council Budget 2015-2016
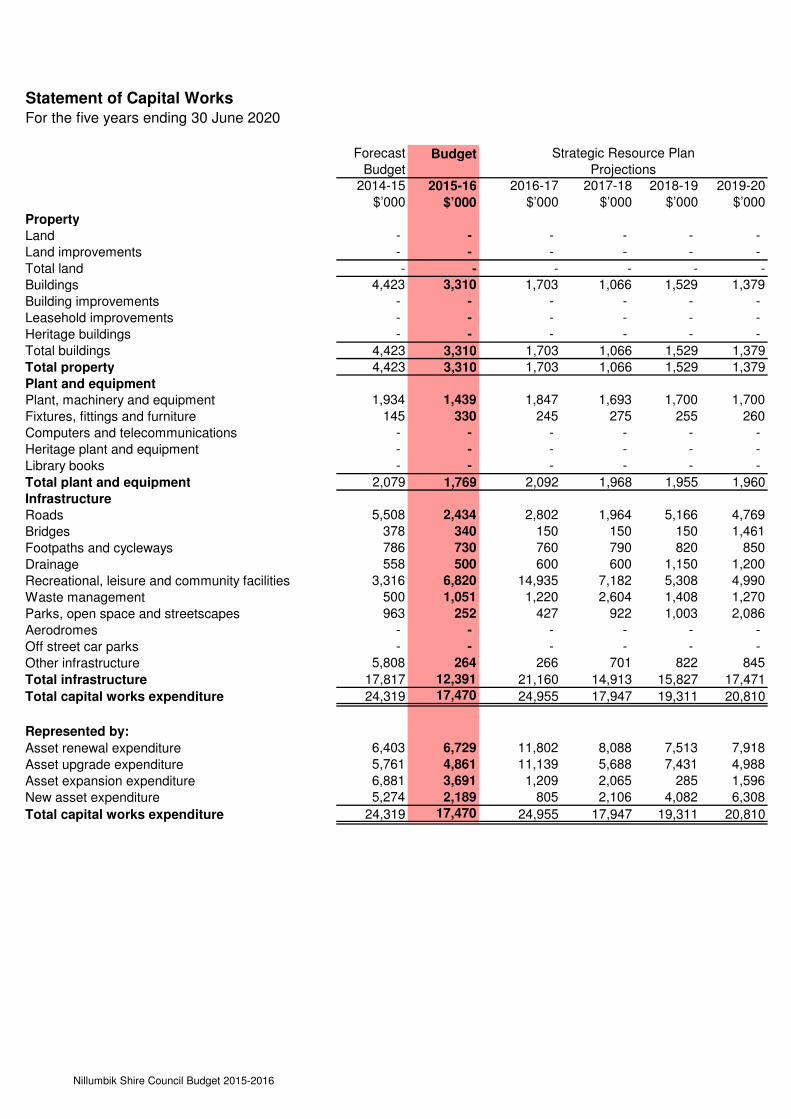
Statement of Capital WorksFor the five years ending 30 June 2020
2014-15 2015-16 2016-17 2017-18 2018-19 2019-20
$’000 $’000 $’000 $’000 $’000 $’000
Property
Land - - - - - -
Land improvements - - - - - -
Total land - - - - - -
Buildings 4,423 3,310 1,703 1,066 1,529 1,379
Building improvements - - - - - -
Leasehold improvements - - - - - -
Heritage buildings - - - - - -
Total buildings 4,423 3,310 1,703 1,066 1,529 1,379
Total property 4,423 3,310 1,703 1,066 1,529 1,379
Plant and equipment
Plant, machinery and equipment 1,934 1,439 1,847 1,693 1,700 1,700
Fixtures, fittings and furniture 145 330 245 275 255 260
Computers and telecommunications - - - - - -
Heritage plant and equipment - - - - - -
Library books - - - - - -
Total plant and equipment 2,079 1,769 2,092 1,968 1,955 1,960
Infrastructure
Roads 5,508 2,434 2,802 1,964 5,166 4,769
Bridges 378 340 150 150 150 1,461
Footpaths and cycleways 786 730 760 790 820 850
Drainage 558 500 600 600 1,150 1,200
Recreational, leisure and community facilities 3,316 6,820 14,935 7,182 5,308 4,990
Waste management 500 1,051 1,220 2,604 1,408 1,270
Parks, open space and streetscapes 963 252 427 922 1,003 2,086
Aerodromes - - - - - -
Off street car parks - - - - - -
Other infrastructure 5,808 264 266 701 822 845
Total infrastructure 17,817 12,391 21,160 14,913 15,827 17,471
Total capital works expenditure 24,319 17,470 24,955 17,947 19,311 20,810
Represented by:
Asset renewal expenditure 6,403 6,729 11,802 8,088 7,513 7,918
Asset upgrade expenditure 5,761 4,861 11,139 5,688 7,431 4,988
Asset expansion expenditure 6,881 3,691 1,209 2,065 285 1,596
New asset expenditure 5,274 2,189 805 2,106 4,082 6,308
Total capital works expenditure 24,319 17,470 24,955 17,947 19,311 20,810
Strategic Resource Plan
Projections
Forecast
BudgetBudget
Nillumbik Shire Council Budget 2015-2016

Statement of Capital Works Forward Estimates For the five years ending 30 June 2025
2020-21 2021-22 2022-23 2023-24 2024-25
$’000 $’000 $’000 $’000 $’000
Property
Land - - - - -
Land improvements - - - - -
Total land - - - - -
Buildings 1,629 1,229 4,479 1,329 1,579
Building improvements - - - - -
Leasehold improvements - - - - -
Heritage buildings - - - - -
Total buildings 1,629 1,229 4,479 1,329 1,579
Total property 1,629 1,229 4,479 1,329 1,579
Plant and equipment
Plant, machinery and equipment 1,700 1,700 1,700 1,700 1,700
Fixtures, fittings and furniture 80 80 80 80 80
Computers and telecommunications - - - - -
Heritage plant and equipment - - - - -
Library books - - - - -
Total plant and equipment 1,780 1,780 1,780 1,780 1,780
Infrastructure
Roads 2,614 2,164 2,214 2,264 3,114
Bridges 150 150 150 150 150
Footpaths and cycleways 880 910 940 970 1,000
Drainage 450 450 450 450 450
Recreational, leisure and community facilities 4,675 9,680 4,035 8,290 8,605
Waste management 1,210 2,300 1,956 - -
Parks, open space and streetscapes 1,037 242 747 252 257
Aerodromes - - - - -
Off street car parks - - - - -
Other infrastructure 830 500 897 1,074 822
Total infrastructure 11,846 16,396 11,389 13,450 14,398
Total capital works expenditure 15,255 19,405 17,648 16,559 17,757
Represented by:
Asset renewal expenditure 7,626 7,274 8,049 8,204 8,330
Asset upgrade expenditure 5,355 6,347 7,305 1,051 3,853
Asset expansion expenditure 285 5,285 1,785 785 5,045
New asset expenditure 1,989 499 509 6,519 529
Total capital works expenditure 15,255 19,405 17,648 16,559 17,757
Forward Estimates
Nillumbik Shire Council Budget 2015-2016
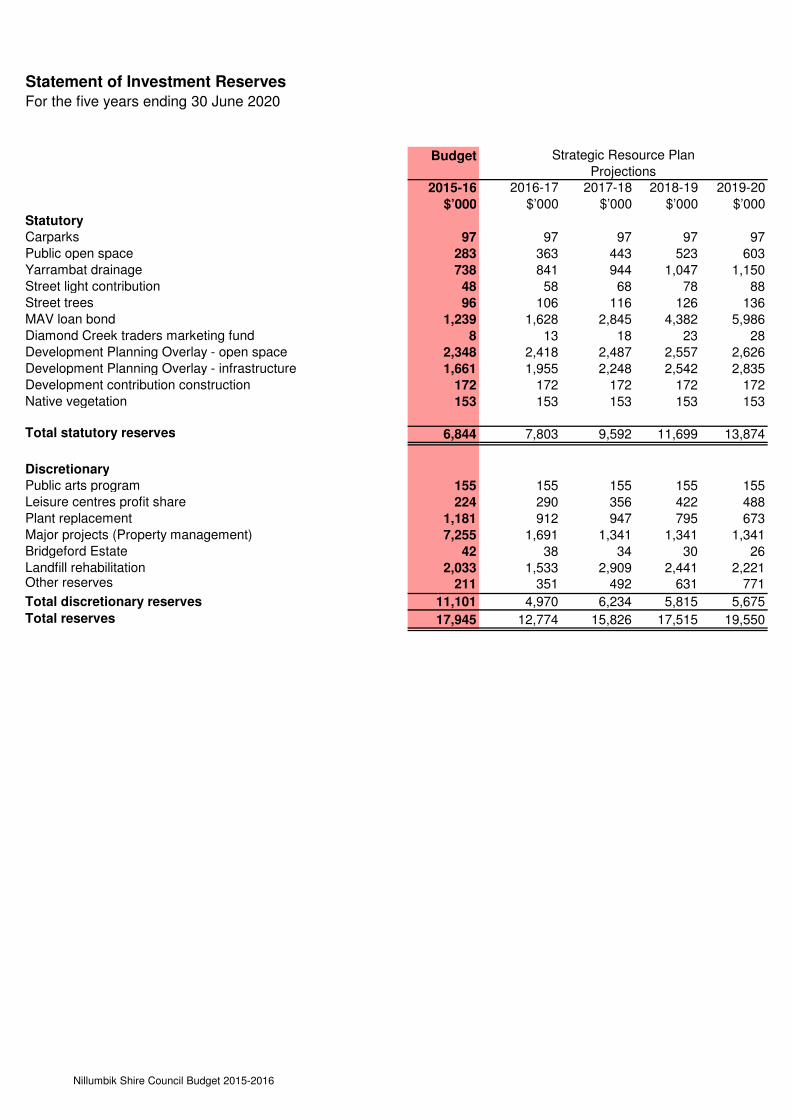
Statement of Investment ReservesFor the five years ending 30 June 2020
2015-16 2016-17 2017-18 2018-19 2019-20
$’000 $’000 $’000 $’000 $’000
Statutory
Carparks 97 97 97 97 97Public open space 283 363 443 523 603Yarrambat drainage 738 841 944 1,047 1,150Street light contribution 48 58 68 78 88Street trees 96 106 116 126 136MAV loan bond 1,239 1,628 2,845 4,382 5,986Diamond Creek traders marketing fund 8 13 18 23 28Development Planning Overlay - open space 2,348 2,418 2,487 2,557 2,626Development Planning Overlay - infrastructure 1,661 1,955 2,248 2,542 2,835Development contribution construction 172 172 172 172 172Native vegetation 153 153 153 153 153
Total statutory reserves 6,844 7,803 9,592 11,699 13,874
Discretionary
Public arts program 155 155 155 155 155Leisure centres profit share 224 290 356 422 488Plant replacement 1,181 912 947 795 673Major projects (Property management) 7,255 1,691 1,341 1,341 1,341Bridgeford Estate 42 38 34 30 26Landfill rehabilitation 2,033 1,533 2,909 2,441 2,221Other reserves 211 351 492 631 771
Total discretionary reserves 11,101 4,970 6,234 5,815 5,675
Total reserves 17,945 12,774 15,826 17,515 19,550
ProjectionsBudget Strategic Resource Plan
Nillumbik Shire Council Budget 2015-2016

Statement of Investment Reserves Forward Estimates For the five years ending 30 June 2024
2020-21 2021-22 2022-23 2023-24 2024-25
$’000 $’000 $’000 $’000 $’000
Statutory
Carparks 97 97 97 97 97Public open space 683 763 843 923 1,003Yarrambat drainage 1,253 1,356 1,459 1,562 1,667Street light contribution 98 108 118 128 138Street trees 146 156 166 176 186MAV loan bond 5,248 5,505 3,246 3,300 2,655Diamond Creek traders marketing fund 33 38 43 48 53Development Planning Overlay - open space 2,696 2,766 2,835 2,905 2,974Development Planning Overlay - infrastructure 3,129 3,422 3,716 4,009 4,303Development contribution construction 172 172 172 172 172Native vegetation 153 153 153 153 153
Total statutory reserves 13,708 14,536 12,848 13,473 13,401
Discretionary
Public arts program 155 155 155 155 155Leisure centres profit share 554 620 686 752 819Plant replacement 701 549 427 455 484Major projects (Property management) 1,341 1,341 1,341 1,341 1,341Bridgeford Estate 22 18 14 10 6Landfill rehabilitation 2,171 1,141 565 2,055 3,655Other reserves 911 1,052 1,191 1,331 1,472Total discretionary reserves 5,855 4,876 4,379 6,099 7,932Total reserves 19,563 19,412 17,227 19,573 21,333
Forward Estimates
Nillumbik Shire Council Budget 2015-2016

Statement of Human Resources
For the four years ending 30 June 2020
2014-15 2015-16 2016-17 2017-18 2018-19 2019-20
$’000 $’000 $’000 $’000 $’000 $’000
Staff expenditure
Employee costs - operating 30,459 31,122 32,492 33,924 35,421 36,986
Employee costs - capital - - - - - -
Total staff expenditure 30,459 31,122 32,492 33,924 35,421 36,986
EFT EFT EFT EFT EFT EFT
Staff numbers
Permanent EFT numbers 308.58 309.68 309.68 309.68 309.68 309.68
Limited tenures 4.93 4.03 4.03 4.03 4.03 4.03
Total staff numbers 313.51 313.71 313.71 313.71 313.71 313.71
Forecast
BudgetBudget Strategic Resource Plan
Projections
Nillumbik Shire Council Budget 2015-2016
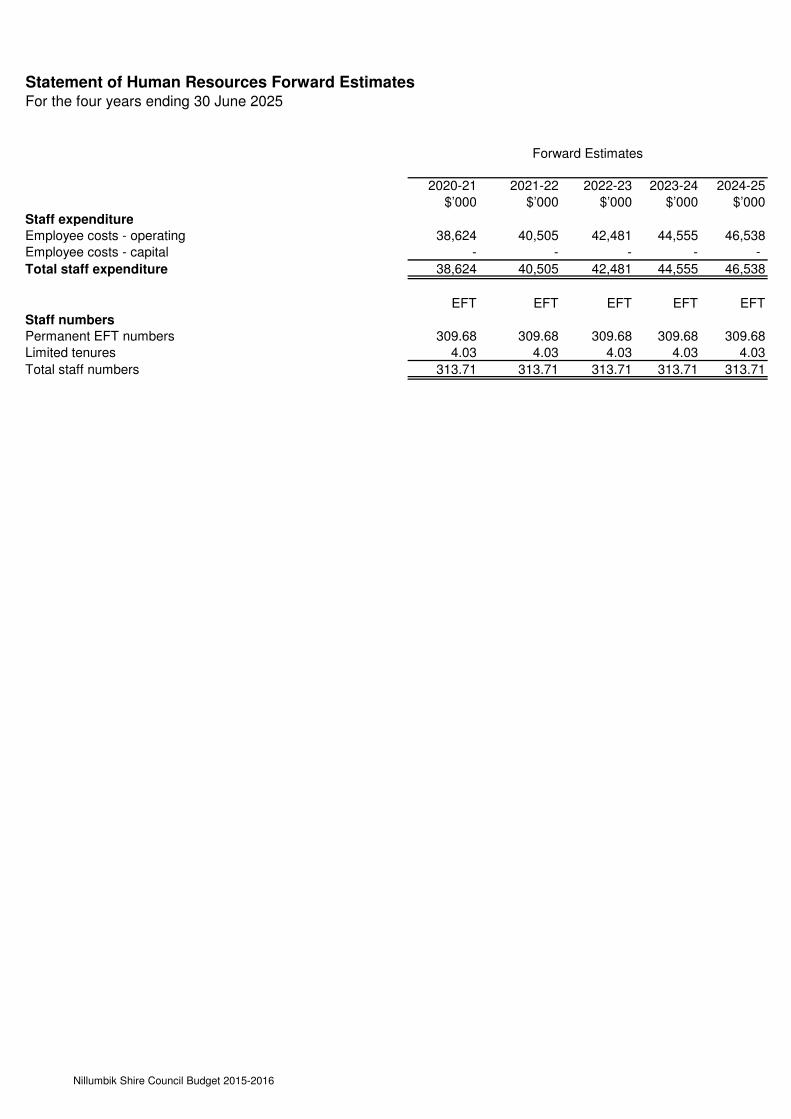
Statement of Human Resources Forward Estimates For the four years ending 30 June 2025
2020-21 2021-22 2022-23 2023-24 2024-25
$’000 $’000 $’000 $’000 $’000
Staff expenditure
Employee costs - operating 38,624 40,505 42,481 44,555 46,538
Employee costs - capital - - - - -
Total staff expenditure 38,624 40,505 42,481 44,555 46,538
EFT EFT EFT EFT EFT
Staff numbers
Permanent EFT numbers 309.68 309.68 309.68 309.68 309.68
Limited tenures 4.03 4.03 4.03 4.03 4.03
Total staff numbers 313.71 313.71 313.71 313.71 313.71
Forward Estimates
Nillumbik Shire Council Budget 2015-2016
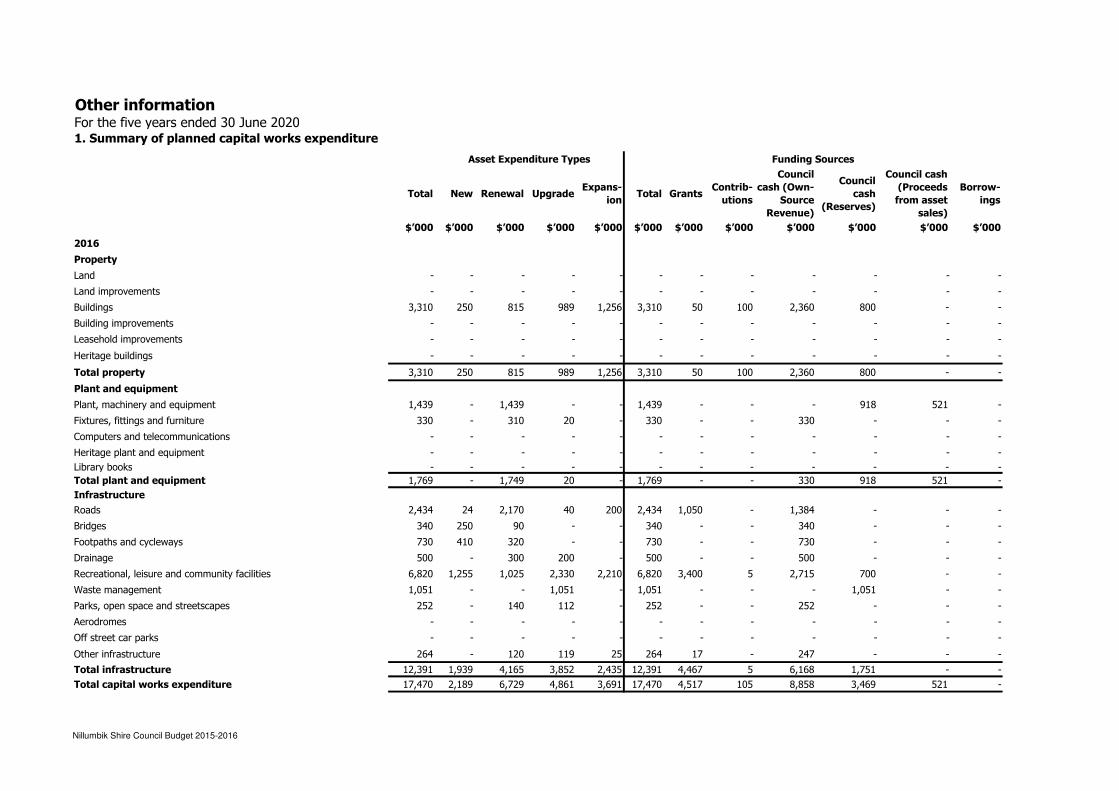
Other informationFor the five years ended 30 June 20201. Summary of planned capital works expenditure
Total New Renewal UpgradeExpans-
ionTotal Grants
Contrib-
utions
Council
cash (Own-
Source
Revenue)
Council
cash
(Reserves)
Council cash
(Proceeds
from asset
sales)
Borrow-
ings
$’000 $’000 $’000 $’000 $’000 $’000 $’000 $’000 $’000 $’000 $’000 $’000
2016
Property
Land - - - - - - - - - - - -
Land improvements - - - - - - - - - - - -
Buildings 3,310 250 815 989 1,256 3,310 50 100 2,360 800 - -
Building improvements - - - - - - - - - - - -
Leasehold improvements - - - - - - - - - - - -
Heritage buildings - - - - - - - - - - - -
Total property 3,310 250 815 989 1,256 3,310 50 100 2,360 800 - -
Plant and equipment
Plant, machinery and equipment 1,439 - 1,439 - - 1,439 - - - 918 521 -
Fixtures, fittings and furniture 330 - 310 20 - 330 - - 330 - - -
Computers and telecommunications - - - - - - - - - - - -
Heritage plant and equipment - - - - - - - - - - - -
Library books - - - - - - - - - - - -
Total plant and equipment 1,769 - 1,749 20 - 1,769 - - 330 918 521 -
Infrastructure
Roads 2,434 24 2,170 40 200 2,434 1,050 - 1,384 - - -
Bridges 340 250 90 - - 340 - - 340 - - -
Footpaths and cycleways 730 410 320 - - 730 - - 730 - - -
Drainage 500 - 300 200 - 500 - - 500 - - -
Recreational, leisure and community facilities 6,820 1,255 1,025 2,330 2,210 6,820 3,400 5 2,715 700 - -
Waste management 1,051 - - 1,051 - 1,051 - - - 1,051 - -
Parks, open space and streetscapes 252 - 140 112 - 252 - - 252 - - -
Aerodromes - - - - - - - - - - - -
Off street car parks - - - - - - - - - - - -
Other infrastructure 264 - 120 119 25 264 17 - 247 - - -
Total infrastructure 12,391 1,939 4,165 3,852 2,435 12,391 4,467 5 6,168 1,751 - -
Total capital works expenditure 17,470 2,189 6,729 4,861 3,691 17,470 4,517 105 8,858 3,469 521 -
Asset Expenditure Types Funding Sources
Nillumbik Shire Council Budget 2015-2016

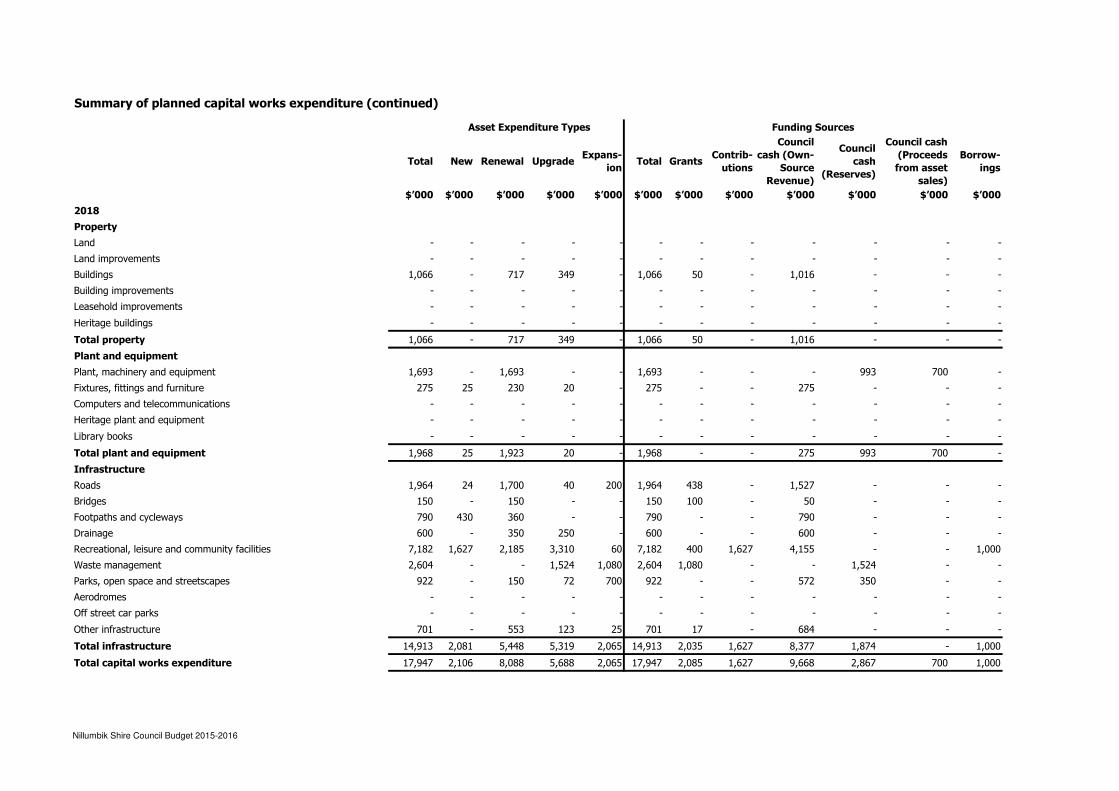
Summary of planned capital works expenditure (continued)
Total New Renewal UpgradeExpans-
ionTotal Grants
Contrib-
utions
Council
cash (Own-
Source
Revenue)
Council
cash
(Reserves)
Council cash
(Proceeds
from asset
sales)
Borrow-
ings
$’000 $’000 $’000 $’000 $’000 $’000 $’000 $’000 $’000 $’000 $’000 $’000
2017
Property
Land - - - - - - - - - - - -
Land improvements - - - - - - - - - - - -
Buildings 1,703 - 830 349 524 1,703 50 - 1,653 - - -
Building improvements - - - - - - - - - - - -
Leasehold improvements - - - - - - - - - - - -
Heritage buildings - - - - - - - - - - - -
Total property 1,703 - 830 349 524 1,703 50 - 1,653 - - -
Plant and equipment
Plant, machinery and equipment 1,847 - 1,847 - - 1,847 - - - 1,297 550 -
Fixtures, fittings and furniture 245 - 225 20 - 245 - - 245 - - -
Computers and telecommunications - - - - - - - - - - - -
Heritage plant and equipment - - - - - - - - - - - -
Library books - - - - - - - - - - - -
Total plant and equipment 2,092 - 2,072 20 - 2,092 - - 245 1,297 550 -
Infrastructure
Roads 2,802 355 1,650 197 600 2,802 480 588 1,734 - - -
Bridges 150 - 150 - - 150 100 - 50 - - -
Footpaths and cycleways 760 420 340 - - 760 - - 760 - - -
Drainage 600 - 350 250 - 600 - - 600 - - -
Recreational, leisure and community facilities 14,935 5 6,130 8,740 60 14,935 1,515 5 3,515 6,250 - 3,650
Waste management 1,220 - - 1,220 - 1,220 - - - 1,220 - -
Parks, open space and streetscapes 427 25 160 242 - 427 - 25 402 - - -
Aerodromes - - - - - - - - - - - -
Off street car parks - - - - - - - - - - - -
Other infrastructure 266 - 120 121 25 266 17 - 249 - - -
Total infrastructure 21,160 805 8,900 10,770 685 21,160 2,112 618 7,310 7,470 - 3,650
Total capital works expenditure 24,955 805 11,802 11,139 1,209 24,955 2,162 618 9,208 8,767 550 3,650
Asset Expenditure Types Funding Sources
Nillumbik Shire Council Budget 2015-2016
Summary of planned capital works expenditure (continued)
Total New Renewal UpgradeExpans-
ionTotal Grants
Contrib-
utions
Council
cash (Own-
Source
Revenue)
Council
cash
(Reserves)
Council cash
(Proceeds
from asset
sales)
Borrow-
ings
$’000 $’000 $’000 $’000 $’000 $’000 $’000 $’000 $’000 $’000 $’000 $’000
2018
Property
Land - - - - - - - - - - - -
Land improvements - - - - - - - - - - - -
Buildings 1,066 - 717 349 - 1,066 50 - 1,016 - - -
Building improvements - - - - - - - - - - - -
Leasehold improvements - - - - - - - - - - - -
Heritage buildings - - - - - - - - - - - -
Total property 1,066 - 717 349 - 1,066 50 - 1,016 - - -
Plant and equipment
Plant, machinery and equipment 1,693 - 1,693 - - 1,693 - - - 993 700 -
Fixtures, fittings and furniture 275 25 230 20 - 275 - - 275 - - -
Computers and telecommunications - - - - - - - - - - - -
Heritage plant and equipment - - - - - - - - - - - -
Library books - - - - - - - - - - - -
Total plant and equipment 1,968 25 1,923 20 - 1,968 - - 275 993 700 -
Infrastructure
Roads 1,964 24 1,700 40 200 1,964 438 - 1,527 - - -
Bridges 150 - 150 - - 150 100 - 50 - - -
Footpaths and cycleways 790 430 360 - - 790 - - 790 - - -
Drainage 600 - 350 250 - 600 - - 600 - - -
Recreational, leisure and community facilities 7,182 1,627 2,185 3,310 60 7,182 400 1,627 4,155 - - 1,000
Waste management 2,604 - - 1,524 1,080 2,604 1,080 - - 1,524 - -
Parks, open space and streetscapes 922 - 150 72 700 922 - - 572 350 - -
Aerodromes - - - - - - - - - - - -
Off street car parks - - - - - - - - - - - -
Other infrastructure 701 - 553 123 25 701 17 - 684 - - -
Total infrastructure 14,913 2,081 5,448 5,319 2,065 14,913 2,035 1,627 8,377 1,874 - 1,000
Total capital works expenditure 17,947 2,106 8,088 5,688 2,065 17,947 2,085 1,627 9,668 2,867 700 1,000
Asset Expenditure Types Funding Sources
Nillumbik Shire Council Budget 2015-2016

Summary of planned capital works expenditure (continued)
Total New Renewal UpgradeExpans-
ionTotal Grants
Contrib-
utions
Council
cash (Own-
Source
Revenue)
Council
cash
(Reserves)
Council cash
(Proceeds
from asset
sales)
Borrow-
ings
$’000 $’000 $’000 $’000 $’000 $’000 $’000 $’000 $’000 $’000 $’000 $’000
2019
Property
Land - - - - - - - - - - - -
Land improvements - - - - - - - - - - - -
Buildings 1,529 250 930 349 - 1,529 50 - 1,479 - - -
Building improvements - - - - - - - - - - - -
Leasehold improvements - - - - - - - - - - - -
Heritage buildings - - - - - - - - - - - -
Total property 1,529 250 930 349 0 1,529 50 0 1,479 0 0 0
Plant and equipment
Plant, machinery and equipment 1,700 - 1,700 - - 1,700 - - - 1,180 520 -
Fixtures, fittings and furniture 255 - 235 20 - 255 - - 255 - - -
Computers and telecommunications - - - - - - - - - - - -
Heritage plant and equipment - - - - - - - - - - - -
Library books - - - - - - - - - - - -
Total plant and equipment 1,955 - 1,935 20 - 1,955 - - 255 1,180 520 -
Infrastructure
Roads 5,166 469 1,750 2,747 200 5,166 438 2,652 2,077 - - -
Bridges 150 - 150 - - 150 100 - 50 - - -
Footpaths and cycleways 820 440 380 - - 820 - - 820 - - -
Drainage 1,150 - 350 800 - 1,150 - - 1,150 - - -
Recreational, leisure and community facilities 5,308 2,148 1,190 1,910 60 5,308 120 541 3,290 - - 1,357
Waste management 1,408 - - 1,408 - 1,408 - - - 1,408 - -
Parks, open space and streetscapes 1,003 776 155 72 - 1,003 - 776 227 - - -
Aerodromes - - - - - - - - - - - -
Off street car parks - - - - - - - - - - - -
Other infrastructure 822 - 672 125 25 822 17 - 805 - - -
Total infrastructure 15,826 3,832 4,647 7,062 285 15,826 675 3,968 8,418 1,408 - 1,357
Total capital works expenditure 19,310 4,082 7,512 7,431 285 19,310 725 3,968 10,152 2,588 520 1,357
Asset Expenditure Types Funding Sources
Nillumbik Shire Council Budget 2015-2016
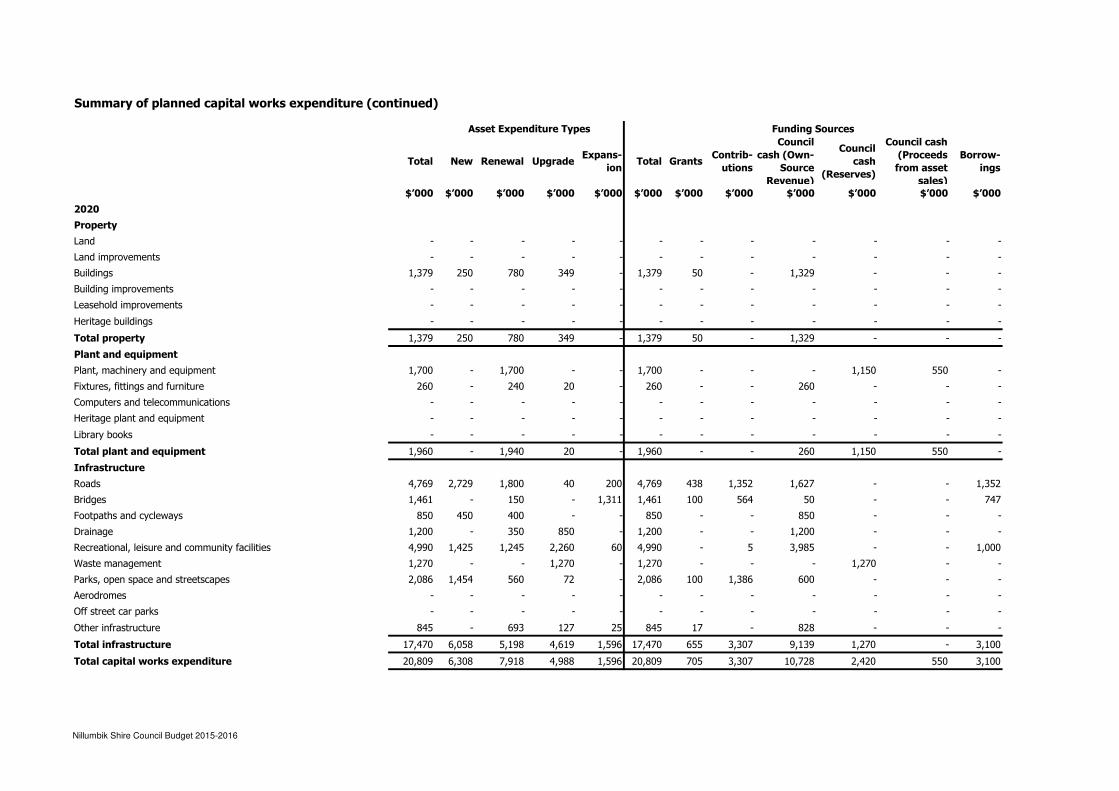
Summary of planned capital works expenditure (continued)
Total New Renewal UpgradeExpans-
ionTotal Grants
Contrib-
utions
Council
cash (Own-
Source
Revenue)
Council
cash
(Reserves)
Council cash
(Proceeds
from asset
sales)
Borrow-
ings
$’000 $’000 $’000 $’000 $’000 $’000 $’000 $’000 $’000 $’000 $’000 $’000
2020
Property
Land - - - - - - - - - - - -
Land improvements - - - - - - - - - - - -
Buildings 1,379 250 780 349 - 1,379 50 - 1,329 - - -
Building improvements - - - - - - - - - - - -
Leasehold improvements - - - - - - - - - - - -
Heritage buildings - - - - - - - - - - - -
Total property 1,379 250 780 349 - 1,379 50 - 1,329 - - -
Plant and equipment
Plant, machinery and equipment 1,700 - 1,700 - - 1,700 - - - 1,150 550 -
Fixtures, fittings and furniture 260 - 240 20 - 260 - - 260 - - -
Computers and telecommunications - - - - - - - - - - - -
Heritage plant and equipment - - - - - - - - - - - -
Library books - - - - - - - - - - - -
Total plant and equipment 1,960 - 1,940 20 - 1,960 - - 260 1,150 550 -
Infrastructure
Roads 4,769 2,729 1,800 40 200 4,769 438 1,352 1,627 - - 1,352
Bridges 1,461 - 150 - 1,311 1,461 100 564 50 - - 747
Footpaths and cycleways 850 450 400 - - 850 - - 850 - - -
Drainage 1,200 - 350 850 - 1,200 - - 1,200 - - -
Recreational, leisure and community facilities 4,990 1,425 1,245 2,260 60 4,990 - 5 3,985 - - 1,000
Waste management 1,270 - - 1,270 - 1,270 - - - 1,270 - -
Parks, open space and streetscapes 2,086 1,454 560 72 - 2,086 100 1,386 600 - - -
Aerodromes - - - - - - - - - - - -
Off street car parks - - - - - - - - - - - -
Other infrastructure 845 - 693 127 25 845 17 - 828 - - -
Total infrastructure 17,470 6,058 5,198 4,619 1,596 17,470 655 3,307 9,139 1,270 - 3,100
Total capital works expenditure 20,809 6,308 7,918 4,988 1,596 20,809 705 3,307 10,728 2,420 550 3,100
Asset Expenditure Types Funding Sources
Nillumbik Shire Council Budget 2015-2016
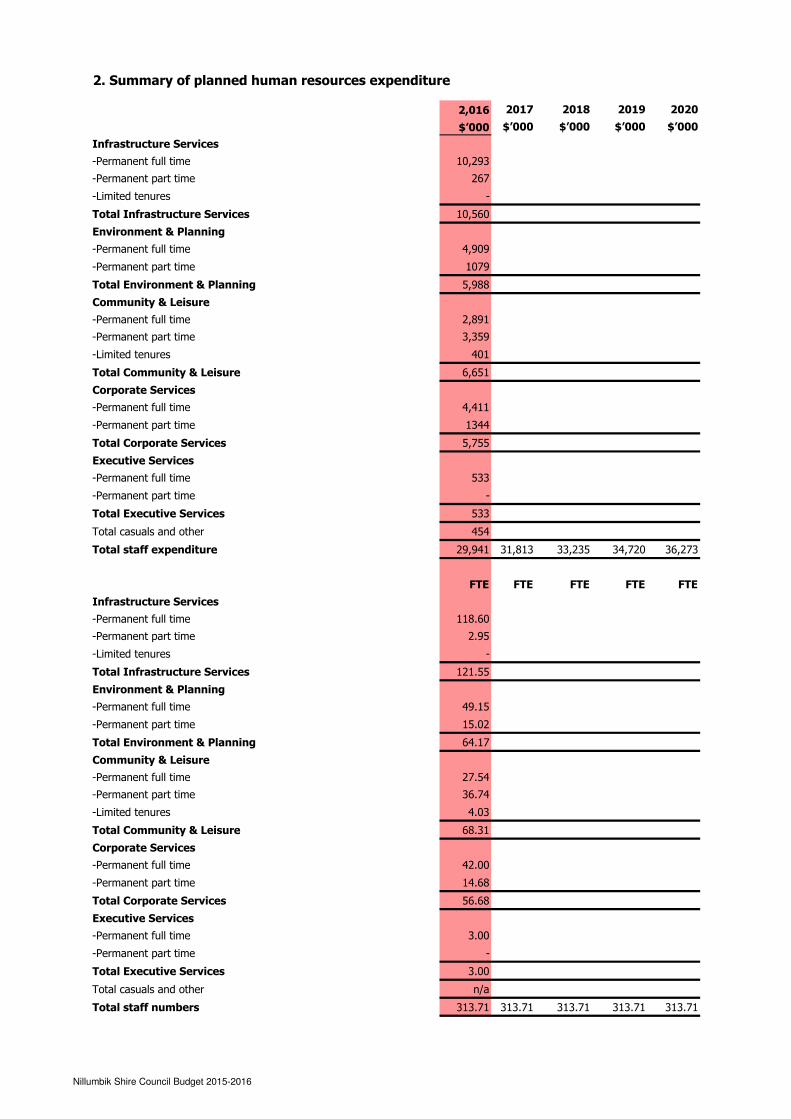
2. Summary of planned human resources expenditure
2,016 2017 2018 2019 2020
$’000 $’000 $’000 $’000 $’000
Infrastructure Services
-Permanent full time 10,293
-Permanent part time 267
-Limited tenures -
Total Infrastructure Services 10,560
Environment & Planning
-Permanent full time 4,909
-Permanent part time 1079
Total Environment & Planning 5,988
Community & Leisure
-Permanent full time 2,891
-Permanent part time 3,359
-Limited tenures 401
Total Community & Leisure 6,651
Corporate Services
-Permanent full time 4,411
-Permanent part time 1344
Total Corporate Services 5,755
Executive Services
-Permanent full time 533
-Permanent part time -
Total Executive Services 533
Total casuals and other 454
Total staff expenditure 29,941 31,813 33,235 34,720 36,273
FTE FTE FTE FTE FTE
Infrastructure Services
-Permanent full time 118.60
-Permanent part time 2.95
-Limited tenures -
Total Infrastructure Services 121.55
Environment & Planning
-Permanent full time 49.15
-Permanent part time 15.02
Total Environment & Planning 64.17
Community & Leisure
-Permanent full time 27.54
-Permanent part time 36.74
-Limited tenures 4.03
Total Community & Leisure 68.31
Corporate Services
-Permanent full time 42.00
-Permanent part time 14.68
Total Corporate Services 56.68
Executive Services
-Permanent full time 3.00
-Permanent part time -
Total Executive Services 3.00
Total casuals and other n/a
Total staff numbers 313.71 313.71 313.71 313.71 313.71
Nillumbik Shire Council Budget 2015-2016